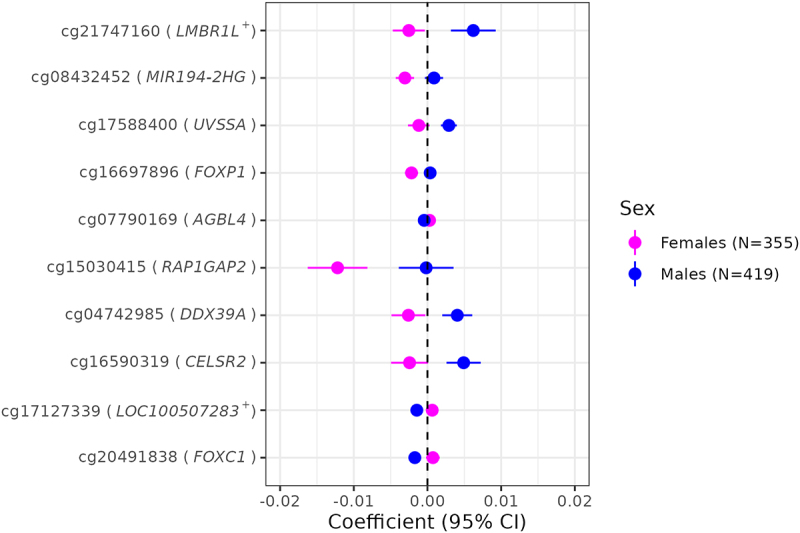
Figure 6.

Sex-heterogeneous associations of gestational age with placental CpG methylation after cell-type adjustment.
Forest plot depicting the top 10 probes with methylation levels that differed most significantly between the two sexes. Gene annotations were verified in the UCSC Genome Browser (hg19) with + indicating the closest gene.
