

ABSTRACT
The challenge of rapid macromolecular synthesis enforces the energy-hungry cancer cell mitochondria to switch their metabolic phenotypes, accomplished by activation of oncogenic tyrosine kinases. Precisely how kinase activity is directly exploited by cancer cell mitochondria to meet high-energy demand, remains to be deciphered. Here we show that a non-receptor tyrosine kinase, TNK2/ACK1 (tyrosine kinase non receptor 2), phosphorylated ATP5F1A (ATP synthase F1 subunit alpha) at Tyr243 and Tyr246 (Tyr200 and 203 in the mature protein, respectively) that not only increased the stability of complex V, but also increased mitochondrial energy output in cancer cells. Further, phospho-ATP5F1A (p-Y-ATP5F1A) prevented its binding to its physiological inhibitor, ATP5IF1 (ATP synthase inhibitory factor subunit 1), causing sustained mitochondrial activity to promote cancer cell growth. TNK2 inhibitor, (R)-9b reversed this process and induced mitophagy-based autophagy to mitigate prostate tumor growth while sparing normal prostate cells. Further, depletion of p-Y-ATP5F1A was needed for (R)-9b-mediated mitophagic response and tumor growth. Moreover, Tnk2 transgenic mice displayed increased p-Y-ATP5F1A and loss of mitophagy and exhibited formation of prostatic intraepithelial neoplasia (PINs). Consistent with these data, a marked increase in p-Y-ATP5F1A was seen as prostate cancer progressed to the malignant stage. Overall, this study uncovered the molecular intricacy of tyrosine kinase-mediated mitochondrial energy regulation as a distinct cancer cell mitochondrial vulnerability and provided evidence that TNK2 inhibitors can act as “mitocans” to induce cancer-specific mitophagy.
Abbreviations: ATP5F1A: ATP synthase F1 subunit alpha; ATP5IF1: ATP synthase inhibitory factor subunit 1; CRPC: castration-resistant prostate cancer; DNM1L: dynamin 1 like; MAP1LC3B/LC3B: microtubule associated protein 1 light chain 3 beta; Mdivi-1: mitochondrial division inhibitor 1; Mut-ATP5F1A: Y243,246A mutant of ATP5F1A; OXPHOS: oxidative phosphorylation; PC: prostate cancer; PINK1: PTEN induced kinase 1; p-Y-ATP5F1A: phosphorylated tyrosine 243 and 246 on ATP5F1A; TNK2/ACK1: tyrosine kinase non receptor 2; Ub: ubiquitin; WT: wild type
KEYWORDS: ATP5F1A, ATP5IF1, mitochondrial dysfunction, mitochondrial vulnerability, mitophagy, TNK2/ACK1, tyrosine phosphorylation
Introduction
Dependence on tyrosine kinase signaling and metabolic reprogramming are important hallmarks of cancer [1,2]. Although, both the arms have been studied individually, their interdependence has not been fully understood. The aerobic glycolysis in cancers, also known as Warburg effect [3], is the combined result of alterations in multiple signaling pathways executed by oncogenes, loss of tumor suppressors, a hypoxic microenvironment, mitochondrial DNA (mtDNA) mutations and others [4,5]. In contrast, a distinct set of cancers including prostate cancer (PC), show mitochondrial heterogeneity among tumor grades [6,7] and are rarely flurodeoxyglucose (FDG) avid, suggesting reliance on oxidative phosphorylation (OXPHOS) for their bioenergetics [8–10], as well as biomass production [11,12]. Cancer cells have a large appetite for synthesis of membranes, nucleic acids and proteins, and thus utilizes significant amount of energy (ATP). Cancer cells that rely on OXPHOS are likely to undertake specialized modification of mitochondrial biochemical pathways to produce optimal levels of ATPs to efficiently fuel various metabolic processes [13–15]. Although, how this is precisely accomplished it not fully clear.
The adenosine triphosphate synthase in mitochondria provides most cellular ATP [16]. The ATP synthase (F1Fo ATP synthase or complex V) is composed of the catalytic domain, F1, a membrane domain, F0, and extrinsic stalk that holds the complex together [16–21]. F1 is composed of ATP5F1A/α3-ATP5F1B/β3-ATP5F1C/γ-ATP5F1Dδ-ATP5F1E/ε with molecular mass of about 350 kDa. There are 3 catalytic sites, primarily formed by the ATP5F1B/β-subunit, but also by the ATP5F1A/α-subunit. The ATP5F1C/γ-subunit rotates within the central core and alters the confirmations of the catalytic sites in a sequential manner. ATP synthases use a transmembrane proton gradient to produce ATP, but in low pH or hypoxic condition, this reaction can be reversed, hydrolyzing ATP. Mammalian cells exhibited a distinct mechanism wherein ATP5IF1, a physiological inhibitor of the ATP synthase, prevented the hydrolysis of ATP under mitochondrial depolarizing conditions [22–24]. Since mitochondria are functional in most cancer cells [25,26] and indeed many cancer types including prostate cancer, utilize mitochondria rather than glycolysis to produce significantly higher levels of ATP [27,28], it seeks an explanation for presence of robust ATP levels in unfavorable conditions. This hyperactive mitochondrial phenotype observed in prostate cancer cells might be consequence of enhanced kinase activity, which led us to hypothesize that tyrosine kinase-driven oncogenic alterations could be associated with heterogeneous metabolic vulnerabilities, which might stem from remodeling in OXPHOS.
TNK2/ACK1 is a non-receptor tyrosine kinase that is ubiquitously expressed with high expression in brain, endocrine tissues, male and female reproductive tissues and immune cells [29]. Recently, TNK2/ACK1 was shown to bind LCP2/SLP-76 via sterile alpha motif (SAM) domain interaction and induced phosphorylation of the LCP2 at three proximal tyrosine residues: Tyr113, Tyr128, and Tyr145 [30]. This modification leads to calcium flux and NFAT-AP1 promoter activity and treatment with TNK2/ACK1 inhibitor, AIM-100 [31], resulted in increased cell motility, suggesting it could regulate T cell function [30]. Although, there is an increasing interest in uncovering role in normal cells, TNK2 as an oncogene and its aberrant activation in multiple malignancies including prostate, breast, pancreatic and lung cancers is well documented [32–36]. The major mechanisms for TNK2/ACK1 oncogenic activation, observed as its autophosphorylation at Y284 [31,37], are the gene amplification, mutations, and its interaction with receptor tyrosine kinases such as EGFR, ERBB2/HER2, MERTK and PDGFR, that are stabilized by HSP90 [32,34–41]. Prostate cancer stem-like cells (PCSCs) are critically dependent on TNK2/ACK1 kinase activity; genetic or pharmacological inhibition mitigated sphere formation, overcame resistance to radiation-induced cell death, and induced significant apoptosis in PCSCs [42]. Over the years, AR (androgen receptor) and AKT have emerged to be the major downstream effectors of TNK2/ACK1 kinase activity in multiple malignancies, wherein AR Y267- and AKT Y176-phosphorylatin correlated with disease progression [36,37,43].
In this study, we have uncovered a new role for TNK2 oncogene, phosphorylation of the mitochondrial protein, ATP5F1A (ATP synthase F1 subunit alpha) in cancer cells. We performed detailed, biochemical, cellular and structural studies to obtain mechanistic insights into how phosphorylated-ATP5F1A enhances mitochondrial energy outcome. In addition, we addressed how this `resourceful’ version of oxidative phosphorylation employed by cancer cell is likely to support survival and progression of prostate cancer to malignant stage. Further, we explored the effect of TNK2/ACK1 inhibition in promoting cancer-specific mitophagy.
Results
TNK2/ACK1 phosphorylates ATP5F1A (ATP synthase F1 subunit alpha) at Y243 and Y246
We hypothesized that tyrosine kinase-driven oncogenic alterations are associated with heterogeneous metabolic vulnerabilities, which mechanistically stems from remodeling in oxidative phosphorylation, causing hyperactive mitochondrial phenotype. To test the role of TNK2/ACK1 in metabolic reprogramming, Tyr-phosphorylated proteins were enriched from TNK2/ACK1 overexpressing cells, followed by mass spectrometry. This unbiased screen revealed multiple peptides along with known TNK2/ACK1 auto-phosphorylated sites, as well as novel peptides derived from ATP5F1A, phosphorylated at Y246 (Figure 1A).
Figure 1.
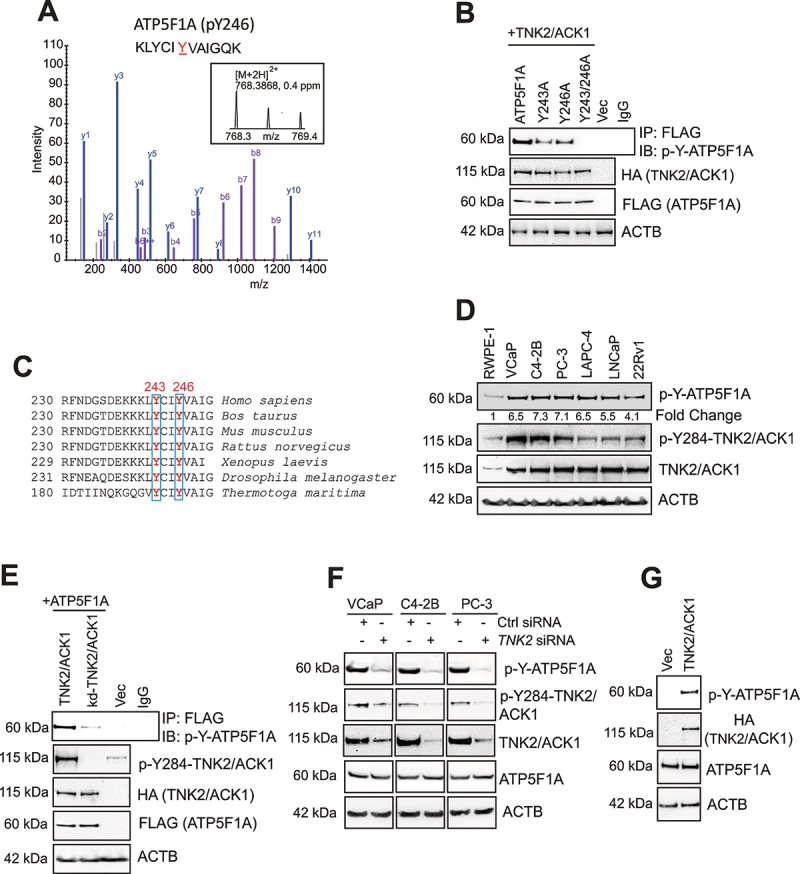
Phosphorylation of ATP5F1A (ATP synthase F1 subunit alpha) at evolutionarily conserved Y243 and Y246 sites by TNK2/ACK1 kinase. (A) Lysates of HEK293T cells transfected with TNK2/ACK1 were processed for LC-MS/MS analysis. A peptide KLYCIYVAIGQK from ATP5F1A (p-Y246) was detected at m/z 768.3868 (2+), which represents mass accuracy of 0.4 ppm (MS1). MS/MS spectrum confirmed the peptide sequence. The identification were made with MaxQuant software. (B) HEK293T cells were co-transfected with HA-tagged TNK2/ACK1 and FLAG-tagged ATP5F1A or mutants, Y243A or Y243/246A or vector (Vec) expressing constructs. Lysates were immunoprecipitated with FLAG beads or IgG, followed by immunoblotting with p-Tyr antibodies (Top panel). (C) Alignment of ATP5F1A protein sequence indicates that tyrosine residue at 243 and 246 site is invariant from human to bacteria. (D) Lysates prepared from RWPE-1, VCaP, C4-2B, PC-3, LAPC-4, LNCaP and 22Rv1 cells were screened for detection of p-Y-ATP5F1A, p-Y284-TNK2/ACK1, TNK2/ACK1 and ACTB by immunoblotting with respective antibodies. (E) HEK293T cells were co-transfected with FLAG-tagged ATP5F1A and HA-tagged TNK2/ACK1 or kd-TNK2/ACK1-TNK2/ACK1 or vector (Vec). Lysates were immunoprecipitated with p-Y-ATP5F1A or IgG, followed by immunoblot to detect ATP5F1A, p-Y284-TNK2/ACK1, HA, FLAG and ACTB levels. (F) VCaP, C4-2B, PC-3 cells were transfected with control (Ctrl) and TNK2 siRNA and levels of the indicated proteins were examined by immunoblotting. (G) Lysates from RWPE-1 cells stably expressing HA-tagged TNK2/ACK1 and vector, were subjected to immnunoblotting.
To validate TNK2/ACK1 mediated ATP5F1A Y246-phosphorylation, Y246A mutant of ATP5F1A was generated and co-transfected with a plasmid encoding TNK2/ACK1. Although, TNK2/ACK1 phosphorylated ATP5F1A, the phosphorylation on Y246A mutant of ATP5F1A was not completely ablated (Figure 1B, top panel), suggesting presence of another phosphorylation event. Notably, ATP5F1A has 2 evolutionarily conserved tyrosine residues, 243 and 246 (Tyr200 and 203 in mature protein, respectively) (Figure 1C), opening the possibility that TNK2/ACK1 might target both of these closely spaced sites. To test this hypothesis, two additional ATP5F1A mutants were generated, Y243A and a double mutant Y243/246A (Mut-ATP5F1A, hereafter); co-transfection with TNK2/ACK1 revealed almost complete loss of phosphorylation in Mut-ATP5F1A (Figure 1B).
To detect the endogenous phospho-ATP5F1A, we generated high affinity phospho-specific monoclonal antibodies against p-Y243/246-ATP5F1A (p-Y-ATP5F1A, hereafter), which were extensively validated (Fig. S1A and B). Briefly, the p-Y-ATP5F1A antibodies recognized the ATP5F1A derived phosphopeptide (spanning 240–256 aa) with Y243 and Y246 residues phosphorylated, in contrast, these antibodies exhibited no reactivity against the same non-phosphorylated peptide (Fig. S1A). As an additional control, a phosphopeptide derived from histone H2B, phosphorylated at Y37 [44] was used, which too was not recognized (Fig. S1A). Next, competition of p-Y-ATP5F1A antibody with the ATP5F1A derived phosphopeptide resulted in almost complete loss of phosphopeptide recognition, in contrast, similar competition by phosphopeptide derived from histone H2B did not affect ATP5F1A phosphopeptide recognition (Fig. S1B). Further, prostate cancer cells were treated with phosphatase inhibitor cocktail for 3 h and immunoblotting with p-Y-ATP5F1A antibody was performed, revealing increased p-Y-ATP5F1A levels (Fig. S1C).
To determine the relative expression of p-Y-ATP5F1A, prostate cancer (PC) cell lines were subjected to immunoblotting. A robust expression of p-Y-ATP5F1A was detected in most PC (prostate cancer) cell lines, in contrast, RWPE-1, normal prostate cells, exhibited almost 5-fold lower p-Y-ATP5F1A expression (Figure 1D). Further, to validate role of TNK2/ACK1 kinase activity, ATP5F1A was co-expressed with TNK2/ACK1 or its kinase inactive point mutant (K159A), kd-TNK2/ACK1 [31,33]. kd-TNK2/ACK1-expressing cells exhibited significant loss of p-Y-ATP5F1A expression (Figure 1E). Moreover, elimination of endogenous TNK2/ACK1 by siRNA too significantly diminished p-Y-ATP5F1A levels (Figure 1F). In addition, overexpression of WT TNK2/ACK1 in RWPE-1 caused elevation in p-Y-ATP5F1A levels (Figure 1G). Taken together these data indicate that TNK2/ACK1 is a bona fide kinase for ATP5F1A, causing Y243/246-phosphorylation that is selectively enriched in prostate cancer cells.
TNK2/ACK1 mediated phosphorylation increases mitochondrial energy output
To examine the functional role of p-Y-ATP5F1A, we employed CRISPR/Cas9 strategy to generate cells expressing Y243/246A mutant. These cells were unable to grow beyond 5 days (Unpublished data). Therefore, we utilized retroviral constructs to generate cells stably expressing FLAG-tagged ATP5F1A (WT) or Y243/246A mutant in VCaP, C4-2B and PC-3 cells. We validated incorporation of FLAG-tagged WT-ATP5F1A or Mut-ATP5F1A subunits into ATP synthase enzyme complex by subjecting the mitochondrial extracts to immunoblotting (Figure 2A, Top panel). Further, presence of p-Y-ATP5F1A in cytosol and absence of TNK2/ACK1 in mitochondrial extracts, indicate that TNK2/ACK1 phosphorylates ATP5F1A in cytosol, followed by its translocation to the mitochondria (Figure 2A, lower panel).
Figure 2.
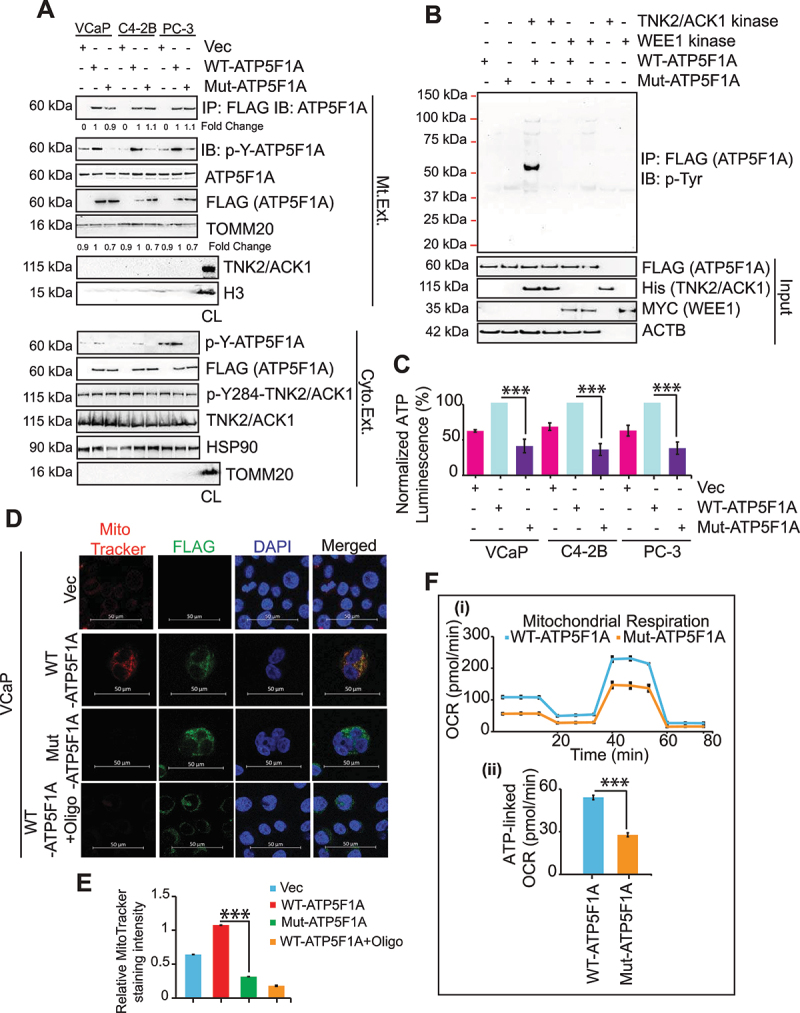
Y243/246-phosphorylation of ATP5F1A increases ATP synthase activity in prostate cancer cells by blocking ATP5IF1 binding. (A) Mitochondrial and Cytosolic extracts of VCaP, C4-2B and PC-3 cells stably expressing FLAG-tagged ATP5F1A and Mut-ATP5F1A were immunoblotted with p-Y-ATP5F1A (1st panel) and indicated antibodies. Total cell lysate (CL) is used as control for mitochondrial (Mt. Ext.) or cytosolic extract (Cyto. Ext.). (B) In vitro kinase assay performed using purified TNK2/ACK1 and a non-specific kinase, WEE1, with WT or Mut-ATP5F1A proteins immunoprecipitated on FLAG beads. The reaction was then immunoblotted with p-Tyr antibody to detect phosphorylation on ATP5F1A. (C) ATP levels were determined by luminescence-based assay in VCaP, C4-2B and PC-3 cells stably expressing vector (Vec) or FLAG-tagged WT-ATP5F1A and Mut-ATP5F1A variants. Data are represented as mean ± SEM (n = 3, 3 replicates). ***p < 0.001. (D and E) VCaP cells expressing vector (Vec), FLAG-tagged ATP5F1A and Mut-ATP5F1A were treated with DMSO or oligomycin (Oligo) (0.5 μM) for 3 h co-stained with MitoTracker and TOMM20 and were processed for immunofluoresence-based detection. Bars: 50 μm. MitoTracker Red staining intensity was normalized with DAPI staining intensity using densitometric analysis by ImageJ software (NIH) and fold changes were represented as mean ± SEM of relative MitoTracker staining intensity. ***p < 0.001. (F) (i) A representative graph of OCR outputs from the seahorseXF26 analyzer of VCaP cells expressing WT-ATP5F1A and Mut-ATP5F1A variants and the response to oligomycin, FCCP, and antimycin A/rotenone. (ii) Comparison of ATP-linked OCR in WT and Mut-ATP5F1A cells.
To explore functional role of p-Y-ATP5F1A, RWPE-1 cells were transfected with TNK2/ACK1 or kd-TNK2/ACK1, followed by staining with MitoTracker Red, a marker for mitochondrial function. In contrast to kd-TNK2/ACK1 expressing cells, a significant increase in MitoTracker Red intensity was observed in TNK2/ACK1 expressing cells (Fig. S1D and E). Moreover, cellular ATP levels were significantly reduced in kd-TNK2/ACK1 expressing cells (Fig. S1F).
To assess the direct binding of TNK2/ACK1 to ATP5F1A, an in vitro kinase assay was performed. FLAG tagged WT or Mut-ATP5F1A were transfected in HEK293T cells and captured on FLAG beads by immunoprecipitation. Beads were incubated with purified recombinant human TNK2/ACK1 or WEE1 kinase proteins (Fig. S2A), followed by immunoblotting with p-Tyr antibody. Phosphorylation of ATP5F1A was observed when TNK2/ACK1 was incubated with WT-ATP5F1A, but not with Mut-ATP5F1A (Figure 2B). Further, ATPF5F1a phosphorylation was undetectable upon incubation with WEE1 kinase. Overall, these data confirm direct phosphorylation of ATP5F1A by TNK2/ACK1.
Cancer cells expressing Mut-ATP5F1A exhibited a significant decrease in ATP levels and MitoTracker Red intensity (Figure 2C-E and S2B-E), suggesting that ATP5F1A Y243/246-phosphorylation affects total ATP output. Next, changes in OXPHOS were assessed by Seahorse XF extracellular Flux Analyzer-based real-time measurements of oxygen consumption rate (OCR), revealing reduced mitochondria basal activity (Figure 2F) and lower mitochondrial membrane potential (mtφ) in Mut-ATP5F1A expressing cells, as seen by TMRE staining (Fig. S2F and G). Together these data indicate that TNK2/ACK1 mediated ATP5F1A phosphorylation plays a role in increasing mitochondrial energy output in cancer cells.
ATP5F1A phosphorylation increases stability of complex-V
The crystal structure of the bovine F1 revealed the conformations of the catalytic sites and were named by the identity of the bound nucleotide, ADP (DP), ANP-PNP (TP), and empty (E) [20]. In accordance with this nomenclature, the subunits were name, αDP, βDP, αTP, βTP, and αE, βE, as those that form the DP, TP, and E sites, respectively. In addition to the catalytic sites, there are 3 non-catalytic sites with ATP bound formed primarily by the α-subunit, but with some involvement of the β-subunit [20]. Unlike the catalytic sites, the conformation of the three non-catalytic sites do not differ or change during the reaction pathway for the synthesis of ATP. αTyr203 is located adjacent to the nucleotide in the non-catalytic site (Figure 3A-D). To understand the effect of phosphorylation, we replaced Tyr with p-Tyr and energy minimized the structure. Surprisingly, the phosphorylation had minor effects on the overall structures of F1 but changes were observed especially in the C-terminal starting at residue 405 (Fiure. 3B). The hydroxyl group of Tyr203 points directly at the Mg2+ ion of the ANP-PNP complex. Upon phosphorylation, the phosphate of pTry203 coordinated with the Mg2+ ion coordinated with ATP. In contrast, p-Tyr200 coordinated with Lys198 and Lys262, which are aptly positioned in the non-phosphorylated forms to interact with the phosphate of Tyr200 (Figure 3C-D).
Figure 3.
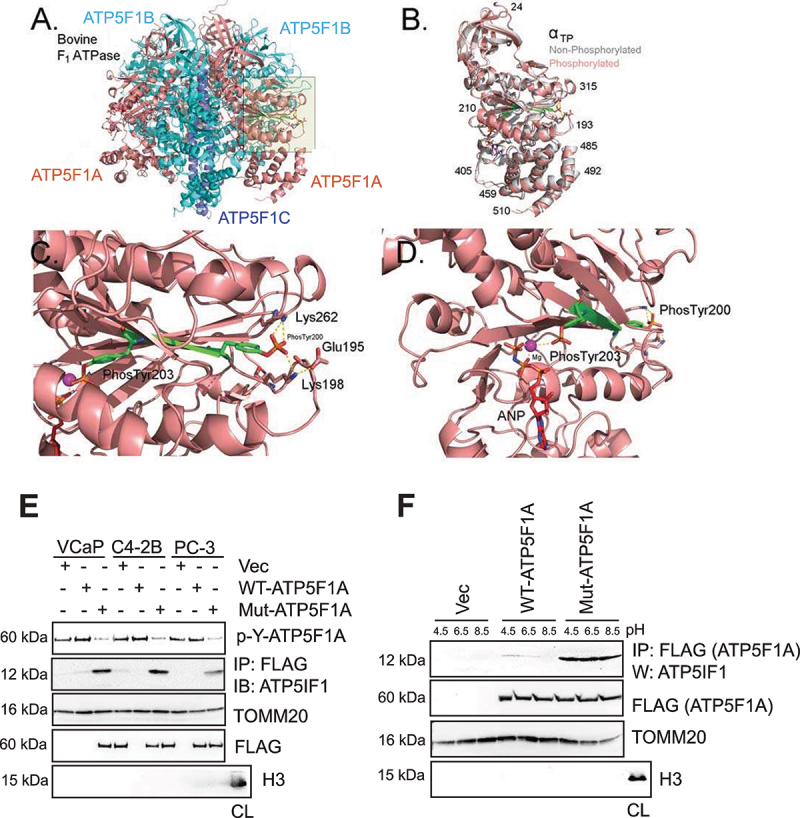
Representation of the structure of the phosphorylated form of the mammalian ATP F1 ATPase. (A-D) The crystal structure of bovine F1 ATPase (pdb: 1BMF) were energy minimized before (gray) and after replacement of Try200 and Tyr203 with phospho-tyrosine (p-Tyr). In A-D, the structure of the phosphorylated form were colored by subunit (ATP5F1A, ATP5F1B, ATP5F1C as salmon, cyan, purple, respectively). Residues 200–203 are colored green. The non-phosphorylated form is colored in gray and superimposed on the phosphorylated from in B. Cartoon of the bovine F1 ATPase is shown in A. The area shaded in yellow is zoomed in C and D. (C) Zoomed image of the region around the α-subunit that interacts with phospho-tyrosine 200 and 203. (D) The same as C, except that the perspective is changed and residues 211–227 were removed to allow visualization of p-Tyr203. Other colors for atoms: blue: nitrogen, Orange: phosphate, red: oxygen, magenta: Mg2+. Hydrogen atoms were added to the structure, but are not shown in the figures. (E) Mitochondrial extracts were immunoblotted with p-Y-ATP5F1A antibodies (top panel). In addition, lysates were immunoprecipitated with FLAG antibodies, followed by immunoblotting with ATP5IF1 antibodies (2nd panel). Total cell lysate (CL) is used as control for mitochondrial extract. (F) C4-2B cells expressing vector (Vec), FLAG-tagged ATP5F1A and Mut-ATP5F1A were cultured in media with pH 4.5, 6.5 and 8.5, for 6 h. Mitochondrial extracts were immunoprecipitated with FLAG (ATP5F1A) antibody, followed by immunoblotting with ATP5IF1 antibody, respectively (top panel). Total cell lysate (CL) is used as control for mitochondrial extract.
Interestingly, Lys198 located in a charged loop (DEKKK) on the surface of the enzyme, coordinated with p-Tyr200, however, p-Tyr203 coordinated with the non-catalytic nucleotide bound to the α-subunit. This interaction is strongly observed in the αTP subunit, but variations were also seen in αE and αDP subunits. This model suggests that phosphorylation of Tyr200 and 203 will constrain the flexibility of the highly charged loop defined by residues194-203, due to the restricted movement and shape (Figure 3C-D). To determine if the phosphorylation of Tyr200 and 203 had a differential effect on the structure of the F1-ATPase when it is inhibited with ATP5IF1 (ATP synthase inhibitory factor subunit 1), we performed the similar analysis with the crystal structure of F1 ATPase with bound ATP5IF1 (pdb: 1OHH). The phosphorylation of Tyr200 and Tyr203 had similar effects on the bulk of the enzyme as observed for the enzyme without inhibitor (Figure 3B). Collectively, it suggests that the di-phosphorylated α-subunit create a supporting structure that extends from the bound non-catalytic nucleotide to the surface of the α-subunit. The noncatalytic nucleotide might act as an anchor that keeps the linkage taut. The model suggests that the phosphate group of p-Tyr203 would interacts with the Mg2+ ion of the nucleotide, which is then linked to p-Tyr200, which in turn, is in salt linkages with Lys198 and Lys262. This interaction is likely to reduce the flexibility thereby increasing the stability of the enzyme, thus creating or eliminating a reactive and interacting site on the surface of the enzyme (S Video file).
ATP5F1A phosphorylation excludes ATP5IF1 binding
Mitochondria ATP synthase activity is regulated by proton motive force (Δp) and by ATP5IF1 [45–48]. Recent cryo-EM structure reveal that at low pH, two ATP5IF1 dimers link two ATP synthase dimers, thus the ATP synthase tetramer adopting an inhibited state [49]. This inhibited state have significant drop in maintenance of mitochondrial membrane potential [2,23]. Since, Mut-ATP5F1A expressing cells exhibited significant loss of mtφ, we reasoned that ATP5F1A-phosphorylation may have relevance in regulating interaction with the IF1. A robust ATP5IF1 binding to Mut-ATP5F1A was observed suggesting that ATP5F1A-phosphorylation might prevent ATP5IF1 binding (Figure 3E, panel 2). Interestingly, at pH 8.0, ATP5IF1 form a tetramer, however, when Δp level drops and pH plunges below 6.5, ATP5IF1 disassembles into dimers, which are inserted into the F1 heads [24]. Further, we cultured these cells in varying pH conditions, and observed that ATP5IF1 binding to Mut-ATP5F1A was unaffected (Figure 3F), suggesting that p-Y-ATP5F1A excludes ATP5IF1 even in low pH condition, often encountered in cancer cells.
Loss of p-Y-ATP5F1A induces mitophagy and mitigates prostate xenograft tumor growth
To determine the physiological relevance of consequences of ATP5F1A-phosphorylation, growth characteristics of WT and Mut-ATP5F1A expressing cancer cells were monitored. Mut-ATP5F1A expressing cells exhibited a significant reduction in proliferation (Figure 4A, Fig. S3A), which was also reflected in the colony formation assay (Fig. S3B). We reasoned that the stunted tumor cell growth could reflect in loss of mitochondrial DNA (mtDNA), a marker for mitochondrial health [50]. A significant reduction in mtDNA copy number was observed in Mut-ATP5F1A expressing cells (Figure 4B, Fig. S3C). Since, mitochondrial damage is often recognized as cellular stress to trigger macroautophagy/autophagy [51], we checked possibility of mitochondrial recruitment of p-Ser65-Ubiquitin/Ub, p-Ser65-PRKN/PARK2, DNM1L, p-DNM1L and MAP1LC3B/LC3B-II (microtubule-associated protein 1 light chain 3 beta). Notably, mitochondrial fraction of Mut-ATP5F1A transfected cells showed significantly higher incorporation of theses markers (Figure 4C) while slightly reduced TOMM20 levels were detected in low exposure immunoblots compared to WT fraction (Fig. S3D). Moreover, abundance of other apoptotic markers such as cleaved CASP3 and CASP9 were markedly increased in Mut-ATP5F1A expressing cells (Figure 4D), suggesting the triggering of mitophagy upon depletion of ATP5F1A-phosphorylation in cancer cells.
Figure 4.
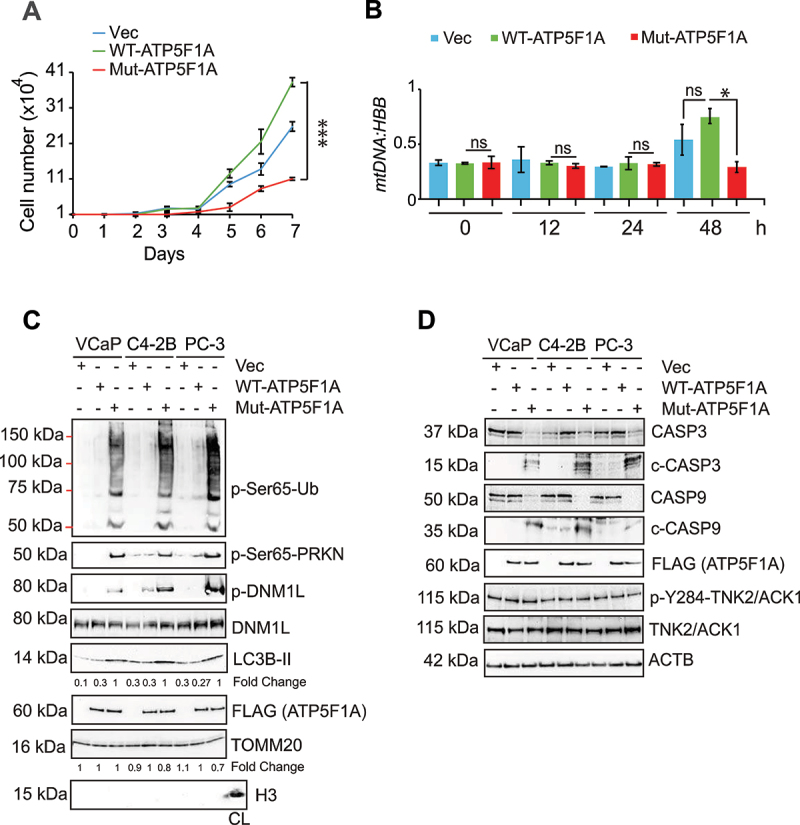
Ablation of Y243/246-phosphorylation on ATP5F1A induces mitophagy. (A) VCaP cells expressing FLAG-tagged ATP5F1A, Mut-ATP5F1A and control vector were grown in culture media with 1% serum for 7 days and number of viable cells was determined utilizing trypan blue exclusion assay. (B) Lysates were subjected for detection of mtDNA and HBB gene expression by qPCR. (C and D) Mitochondrial and cellular lysates from these cells were subjected to immunoblotting for the indicated proteins. For A and B, data are represented as mean ± SEM (n = 3, 3 replicates). *p < 0.05, ***p < 0.001.
To assess the consequences on tumor growth, ATP5F1A and Mut-ATP5F1A mutant expressing VCaP cells were injected subcutaneously into the flank of SCID mice and tumor growth was monitored. Robust tumor growth was observed in mice injected with ATP5F1A-transfected cells, however, markedly smaller tumors were formed by Mut-ATP5F1A expressing cells (Figure 5A-B). No significant change in mice body weight was observed (Figure S3E). At the end of experiment, tumors were harvested. Decreased p-Y-ATP5F1A levels were seen in Mut-ATP5F1A tumors, along with enhanced ATP5IF1 binding to Mut-ATP5F1A (Figure 5C-D). This was also reflected in attenuating ATP synthase activity in mitochondrial extracts isolated from Mut-ATP5F1A tumors and accumulation of mitophagy and autophagy marker proteins along with slight reduction in levels of TOMM20 (Figure 5C-E and Fig. S3F). Collectively, these data suggests the enhanced phosphorylation of ATP5F1A has crucial role in promoting tumor growth.
Figure 5.
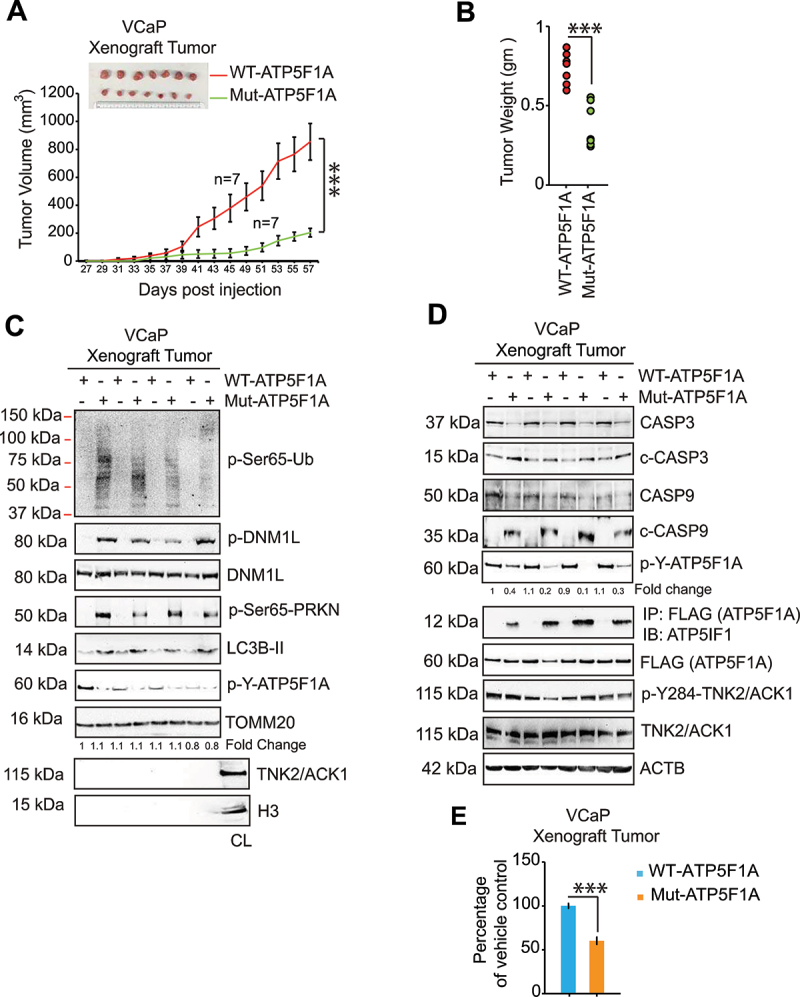
TNK2/ACK1-mediated ATP5F1A Y243/246-phosphorylation promotes prostate xenograft tumor growth by overcoming mitophagy. (A) VCaP cells stably expressing ATP5F1A or Mut-ATP5F1A (2 × 10⁶ cells/mice) were injected subcutaneously in mouse and tumor progression was monitored. Tumor volume is represented as mean of 7 mice ± SE. (B) Dot plot represents individual tumor weight n = 7 each group. ***p < 0.001. (C) Levels of p-Y-ATP5F1A (6th panel) along with mitophagy marker proteins and (D) Levels of p-Y-ATP5F1A (5th panel), ATP5F1A/ATPIF1 complex (6th panel) and p-Y284-TNK2/ACK1 (8th panel) were detected in tumor lysates by immunoblotting. (E) The mitochondrial extract from tumors were processed to determine ATP synthase activity. For E, data are represented as mean ± SEM (n = 3, 3 replicates). *p < 0.05, ***p < 0.001.
(R)-9b depletes p-Y-ATP5F1A sensitizing prostate cancer cells to mitophagy, but sparing normal cells
We have identified a novel TNK2/ACK1 inhibitor, (R)-9b that suppressed its kinase activity in vitro and in vivo [33]. (R)-9b treatment caused dose and time dependent depletion of both, activated TNK2/ACK1 (p-Y284-TNK2/ACK1 or TNK2/ACK1) and p-Y-ATP5F1A in prostate cancer cells (Fig. S4A and B). Further, (R)-9b mediated specific depletion of p-Y-ATP5F1A in mitochondrial and cytosolic extracts was consistent with p-Y-TNK2/ACK1 loss in cytosolic extract, suggesting that TNK2/ACK1 could phosphorylate ATP5F1A in cytosol prior to its mitochondrial translocation (Fig. S4C). RWPE-1 cells exhibited almost undetectable levels of p-Y-ATP5F1A and enhanced ATP5IF1 binding to ATP5F1A, in contrast, six different cancer cell lines exhibited vigorous expression of p-Y-ATP5F1A, however ATPIF1/ATP5F1A complex was barely detected (Figure 6A, panel 3). Upon (R)-9b treatment p-Y-ATP5F1A expression decreased causing revamping of ATPIF1/ATP5F1A complex (Figure 6A, panel 3). Further, a marked decline in ATP synthase activity and total ATP levels were seen upon (R)-9b treatment in cancer cells, in contrast, RWPE-1 cells were unperturbed (Figure 6B and Fig. S4D). Moreover, (R)-9b specifically depolarized prostate cancer cell mitochondria by reducing mtφ (Fig. S4E and F). A significant loss of MitoTracker Red staining was seen in (R)-9b treated cells, while RWPE-1 cells remained unruffled (Fig. S5A and S5B). No change in ATP5F1A mRNA levels were observed at early time points of 12–24 h post (R)-9b treatment, however, a significant decrease in ATP5F1A mRNA were observed after 48–96 h post (R)-9b treatment (Fig. S5C), attributed to initiation of cell death.
Figure 6.
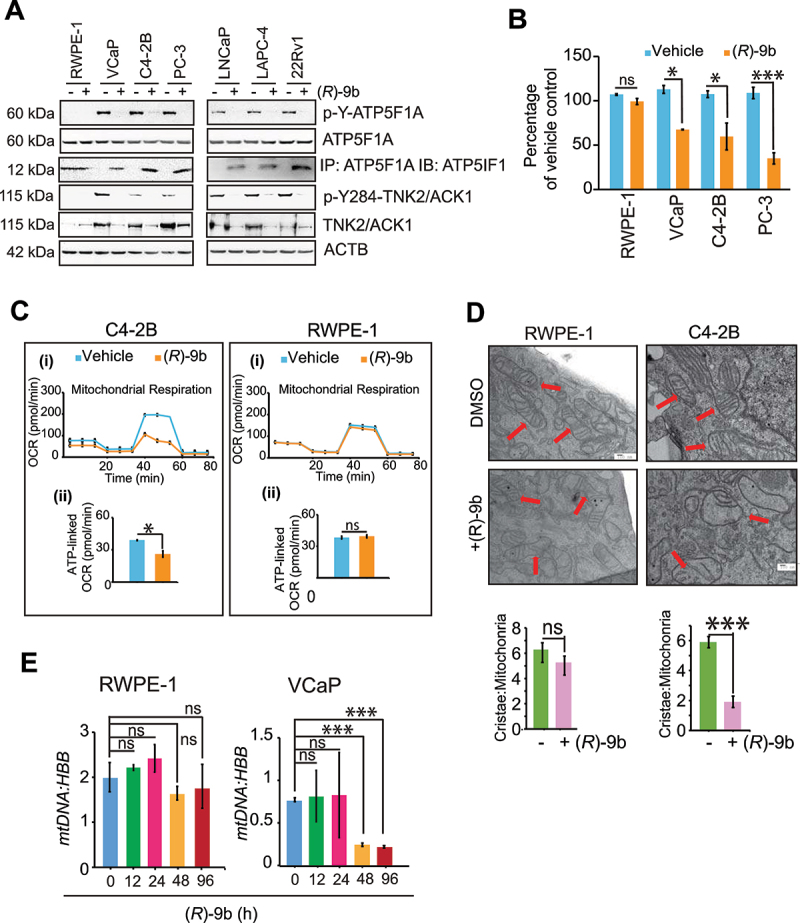
Loss of ATP5F1A Y243/246-phosphorylation causes loss of mitochondrial function in prostate cancer cells while sparing normal cells. (A) RWPE-1, VCaP, C4-2B, PC-3, LNCaP, LAPC-4 and 22Rv1 cells were treated with 1 μM of (R)-9b and protein lysates were processed for detection of p-Y-ATP5F1A (top panel), ATP5F1A, p-Y284-TNK2/ACK1 and TNK2/ACK1. In addition, the lysates were also immunoprecipitated with ATP5F1A, followed by immunoblotting with ATP5IF1 antibodies (3rd panel). (B) These lysates were also accessed for ATP synthase activity. (C) (i) A representative graph of OCR outputs from the XF24 analyzer of C4-2B and RWPE-1 cells were treated with 1 μM of (R)-9b for 12 h and the response to oligomycin, FCCP, and antimycin A/rotenone was recorded. (ii) Comparison of ATP-linked OCR in (R)-9b treated and untreated cells. (D) RWPE-1 and C4-2B cells were treated with 1 μM of (R)-9b for 48 h and processed for electron microscopy. Bars: 100 μm. (E) RWPE-1 and VCaP cells were treated with 1 µM of (R)-9b for 0, 12, 24, 48 and 96 h and lysates were subjected for detection of mtDNA and HBB levels by quantitative qPCR. For B, C, D and E, data are represented as mean ± SEM (n = 3, 2 replicates). ns, not significant. *p < 0.05, **p < 0.01, ***p < 0.001.
To scrutinize if (R)-9b mediated depletion of p-Y-ATP5F1A has similar OXPHOS truncation as in Mut-ATP5F1A cells, mitochondria stress assay was performed. A significant decrease in OCR was observed in (R)-9b treated C4-2B cells, while RWPE-1 cells were unaffected (Figure 6C). Similar mitochondrial dysfunctionality was imparted by (R)-9b in cells transfected with ATP5F1A and TNK2/ACK1 (and kinase dead TNK2/ACK1 or kd-TNK2/ACK1, Lys158R [52], as a control), as seen in significant reduction of ATP synthase activity and ATP levels (Fig. S6A-C). This was accompanied by loss of mitochondrial membrane potential and MitoTracker intensity in (R)-9b treated cells (Fig. S6 D-G). Taken together, these results opens an intriguing possibility that the cancer cells increase p-Y-ATP5F1A levels preventing ATP5IF1 binding, ensuing higher ATP synthase activity and total ATP output. In contrast, the normal cells that have low p-Y-ATP5F1A levels, exhibit higher ATP5IF1 binding and maintain relatively lower ATP output. Thus, low TNK2/ACK1 kinase activity and p-Y-ATP5F1A levels in RWPE-1 cells make them relatively insensitive to (R)-9b treatment.
To check if (R)-9b mediated loss of mitochondrial function can impair its integrity, C4-2B cells were treated and mitochondrial damage and fragmentation was visualized by electron microscopy. A significant distortion in mitochondrial morphology was observed upon (R)-9b treatment, with marked reduction in number of intact cristae per mitochondria, as compared to untreated C4-2B cells, while, RWPE-1 cells exhibited no noticeable changes in mitochondrial morphology (Figure 6D). Further, (R)-9b treatment caused significant reduction in mtDNA content in PC cells, while no change was observed in RWPE-1 cells (Figure 6E, and Fig. S6H).
Mitochondrial dysfunction, fragmentation and damage create cellular stress, thereby promoting mitochondrial clearance by mitophagic pathway [53,54], which often operates by accumulation of PINK1 and PRKN in mitochondrial membrane and anchoring LC3B-II to form autolysosome [55]. We observed time dependent increase in accumulation of p-Ser65-Ub, p-Ser65-PRKN, p-DNM1L, DNM1L, PINK1 and LC3B-II in mitochondrial fraction (Figure 7A), followed by increase in colocalization of LC3B-II with mitochondrial TOMM20 post (R)-9b treatment (Fig. S7A). Further, anchoring of damaged mitochondria to autolysosome was detected by co-staining of TOMM20 with LysoTracker (Fig. S7B). Moreover, increase in cleavage of CASP3 and CASP9 in cellular extracts of (R)-9b treated cancer cells confirm induction of mitophagy following apoptosis (Figure 7B). In contrast, these mitophagic events were markedly subdued in RWPE-1 cells (Fig. S6I).
Figure 7.
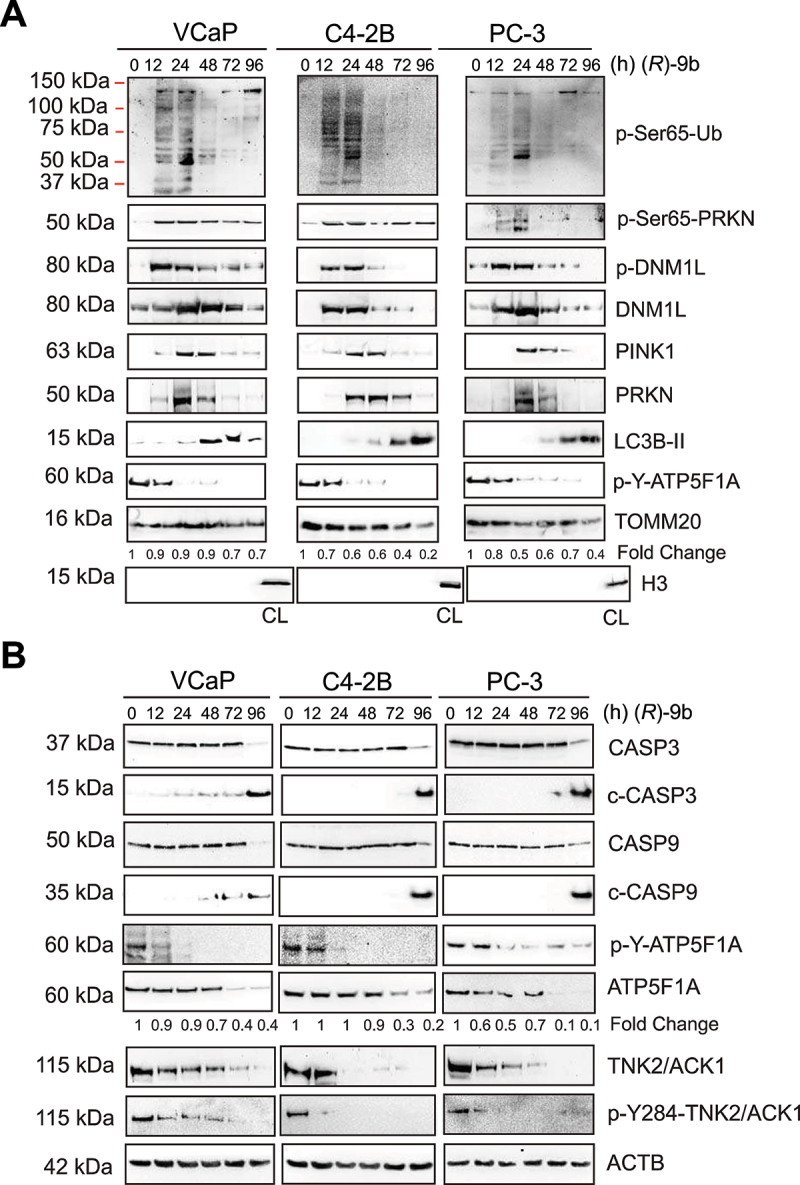
(R)-9b-mediated inhibition of ATP5F1A Y243/246-phosphorylation sensitize prostate cancer cells to mitophagy. (A) VCaP, C4-2B and PC-3 cells were treated with 1 µM of (R)-9b for indicated time duration and mitochondrial extracts were processed for detection of p-Ser65-Ub, p-Ser65-PRKN, p-DNM1L, DNM1L, LC3B-II, PINK1, PRKN and TOMM20 by immunoblotting (top 2 panels). Total cell lysate (CL) is used as control for mitochondrial or cytosolic extract. (B) Whole cell lysates were processed for detection of the indicated proteins.
To determine if dependence on TNK2/ACK1 is the primary cause for increased ATP synthase activity and ATP levels in cancer cells and thereby making it sensitive to (R)-9b, TNK2/ACK1 was overexpressed in RWPE-1 cells using retroviral construct and then exposed to (R)-9b. Otherwise insensitive to (R)-9b, RWPE-1 cells upon TNK2/ACK1 overexpressing restored mitophagic response to (R)-9b treatment, which was evident in significant reduction in number of surviving cells (Fig. S8A). Further, depletion of p-Y-ATP5F1A and elevated levels of p-Ser65-Ub, p-Ser65-PRKN, p-DNM1L, DNM1L, PINK1 and LC3B-II (Fig. S8B), as well as caspase activation was observed in TNK2/ACK1 overexpressing RWPE-1 cells upon (R)-9b treatment (Fig. S8C). A significant depletion of ATP synthase activity, ATP levels (Fig. S8D and E) and significant reduction in mitochondrial membrane potential and MitoTracker staining was also observed (Fig. S8F-I). Moreover, mtDNA content was markedly reduced upon (R)-9b treatment (Fig. S8J). Collectively, these data affirms that TNK2/ACK1 inhibition depletes phosphorylation of ATP5F1A, sensitizing prostate cancer cells to mitophagy, in contrast, normal prostate cells exhibit resistance due to absence of active TNK2/ATP5F1A signaling.
Depletion of p-Y-ATP5F1A is needed for (R)-9b mediated mitophagic response and tumor growth
To validate whether resumption of mitophagic response in prostate cancer cells is dependent on inhibition of TNK2/ACK1 kinase activity, (R)-9b treated cells were compared to Mut-ATP5F1A expressing cells. A marked decrease in MitoTracker staining intensity, ATP synthase enzyme activity and total ATP levels was observed in (R)-9b treated cells, which was comparable to Mut-ATP5F1A expressing cells (Fig. S9A-C). The resulting dysfunctionality in mitochondria culminating into mitochondrial damage was detected as a marked reduction of mtDNA upon (R)-9b treatment or Mut-ATP5F1A expression (Fig. S10A). Further, depletion of p-Y-ATP5F1A upon (R)-9b treatment or Mut-ATP5F1A overexpression led to incorporation of p-Ser65-Ub, p-Ser65-PRKN, p-DNM1L, DNM1L, PINK1 and LC3B-II in mitochondrial extract (Fig. S10B) and comparable elevation in CASP3 and CASP9 cleavage (Fig. S10C). Subsequently, immunofluorescence-based studies indicated increase in LC3B-II and LysoTracker colocalization in mitochondria in both Mut-ATP5F1A expressing as well as (R)-9b treated cells (Fig. S11A and B). Furthermore, (R)-9b also depolarized mitochondrial membrane in C4-2B cells expressing WT ATP5F1A (Fig. S11C and D).
To investigate involvement of PINK1 and PRKN in (R)-9b mediated mitochondrial damage, VCaP cells were transfected with siRNA, revealing that depletion of PINK1 and PRKN imparts transient rescue from (R)-9b mediated mitophagy (Figure 8A), which is also reflected in reduction in caspase cleavage and enhanced cell survival post treatment (Figure 8B-C). Further, interference in recruitment of damaged mitochondrial to lysosome mediated cytotoxicity was accessed by transfecting VCaP cells with control and MAP1LC3B siRNA, followed by treatment with (R)-9b. Enhanced CASP3 and CASP9 cleavage was seen in control siRNA expressing cancer cells upon (R)-9b treatment, which was almost completely lost upon LC3B-II depletion (Figure 8D). Further, a significant increase in surviving cells was observed when pre-transfected with MAP1LC3B siRNA and received (R)-9b treatment, as detected by trypan blue staining (Figure 8E). Moreover, VCaP cells were pretreated with 3-MA, an autophagy inhibitor [56], or mitochondrial division inhibitor 1 (Mdivi-1), a mitophagy inhibitor [57,58],, followed by treatment with (R)-9b, which significantly compromised (R)-9b induced elevation of cleaved CASP3 and CASP9 (Figure 8F). Rescue from cytotoxic effect of (R)-9b in this condition is further confirmed by increase in surviving VCaP cells pre-treated with either 3-MA or Mdivi-1, following (R)-9b treatment (Figure 8G and Fig. S12A). Similar rescue from mitophagy induced apoptosis was observed upon (R)-9b treatment in VCaP WT cells pre-treated with 3-MA or Mdivi-1 (Figure 8H-I, Fig. S12B). Collectively, these data validated that anchoring of defective mitochondria to lysosome is a critical step in (R)-9b mediated autophagic response.
Figure 8.
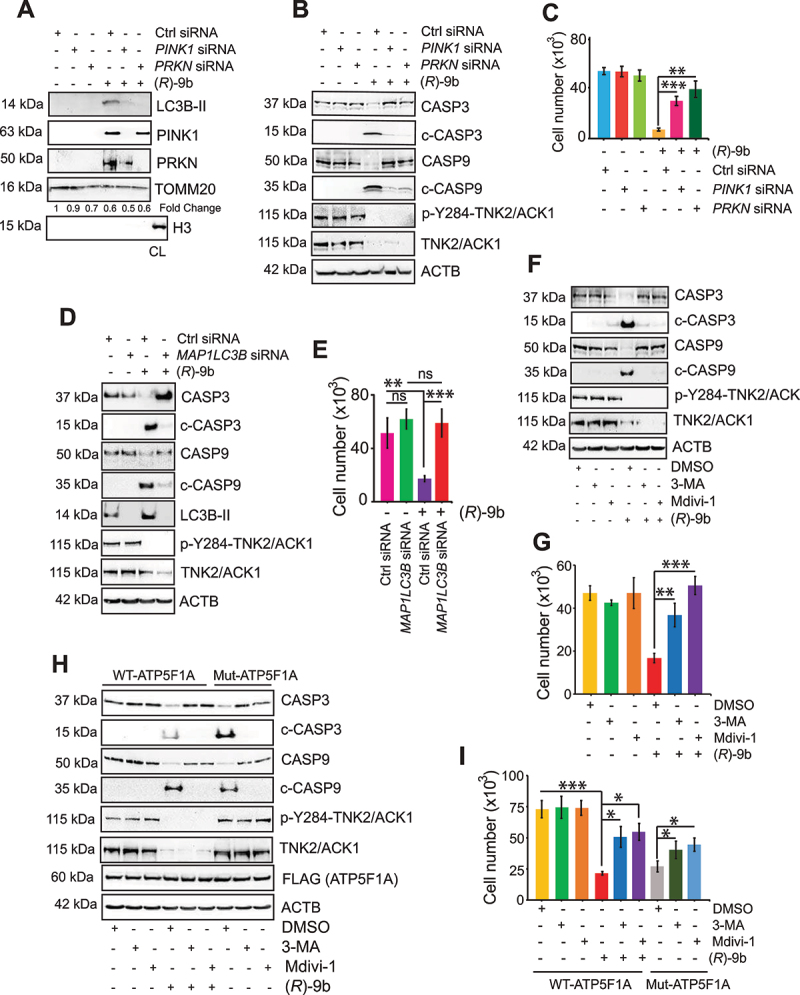
Anchoring of defective mitochondria to lysosome promoted by (R)-9b, mediating autophagic response. (A) VCaP cells were transfected with control (Ctrl) or PINK1 or PRKN siRNA, followed by (R)-9b (1 μM) for 72 h and mitochondrial extracts were subjected to immunoblot-based detection of the indicated proteins. (B) VCaP cells were transfected with control (Ctrl) or PINK1 or PRKN siRNA, followed by (R)-9b (1 μM) for 72 h and cell lysates were subjected to immunoblot-based detection of the indicated proteins. (C) VCaP cells were transfected with control (Ctrl) or PINK1 or PRKN siRNA, followed by (R)-9b (1 μM) for 96 h and surviving cell number was determined by trypan blue exclusion assay. (D) VCaP cells were transfected with control (Ctrl) or MAP1LC3B siRNA, followed by (R)-9b (1 μM) for 72 h and cell lysates were subjected to immunoblot-based detection of the indicated proteins. (E) VCaP cells were transfected with control (Ctrl) or MAP1LC3B siRNA, followed by (R)-9b (1 μM) for 96 h and surviving cell number was determined by trypan blue exclusion assay. (F) VCaP cells were pre-treated with 3-MA (5 mM) or Mdivi-1 (10 μM), followed by (R)-9b (1 μM) for 72 h and lysates were subjected to immunoblot-based detection of the indicated proteins. (G) VCaP cells were pre-treated with 3-MA (5 mM) or Mdivi-1 (10 μM), followed by (R)-9b (1 μM) for 72 h and surviving cell number was determined by trypan blue exclusion assay. (H) VCaP cells expressing FLAG-tagged WT-ATP5F1A and Mut-ATP5F1A were pre-treated with 3-MA (5 mM) or Mdivi-1 (10 μM) followed by (R)-9b (1 μM) for 72 h. Cell lysates were immunoblotted for detection of the indicated proteins (Lower panel). (I) These cells were subjected to trypan blue exclusion assay to determine the surviving cell number. For C, E, G and I, data are represented as mean ± SEM (n = 3, 3 replicates). ns- not significant, *p < 0.05, **p < 0.01, ***p < 0.001.
TNK2/ACK1 inhibitor, (R)-9b is a potent suppressor of prostate tumor growth [33,59]. To investigate role of p-Y-ATP5F1A regulated mitophagy in suppression of prostate tumor growth, VCaP and C4-2B cells were subcutaneously implanted in SCID mice, and once tumors were palpable, injected with (R)-9b. The tumors were excised 30 days post-treatment. Not only tumor growth was significantly compromised in (R)-9b injected mice (Figure 9A-D), but also a marked decrease in ATP synthase activity and mtDNA content was noticed upon (R)-9b treatment (Figure 9E) and F. Further, (R)-9b treated tumor extracts revealed loss of p-Y-ATP5F1A and abundant incorporation of p-Ser65-Ub, p-Ser65-PRKN, p-DNM1L, PINK1, PRKN and LC3B-II in mitochondria (Figure 9G), indicating induction of mitophagy in these tumors. We have also observed reduction in levels of TOMM20 in low exposure immunoblots in these xenograft tumors upon (R)-9b treatment (Fig. S12C). Moreover, marked elevation of CASP3 and CASP9 cleavage was observed upon (R)-9b treatment (Figure 9H). Additionally, immunohistochemistry (IHC) studies performed in VCaP and C4-2B xenograft tumors exhibited a significant loss of p-Y-ATP5F1A levels in (R)-9b treated tumors (Figure 10A-B). Taken together, these data indicate that TNK2/ACK1/p-Y-ATP5F1A signaling promotes prostate tumors growth by overcoming mitophagy.
Figure 9.
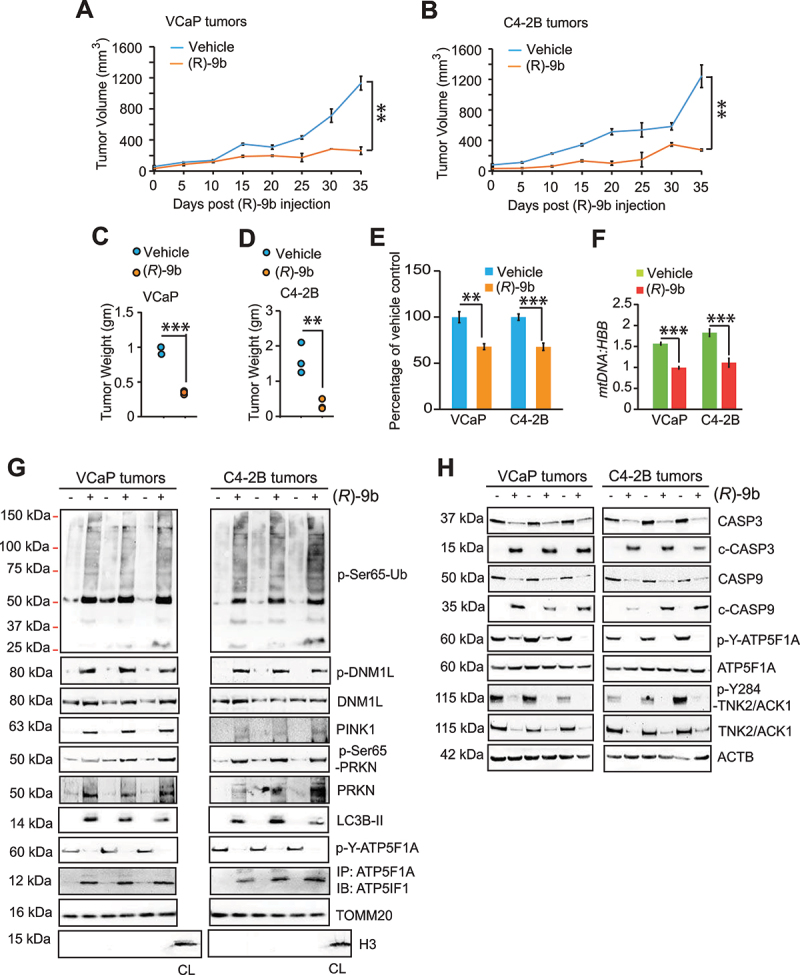
TNK2/ACK1 inhibitor (R)-9b suppresses p-Y-ATP5F1A and prostate tumors growth. (A and B) VCaP and C4-2B cells (2 × 10⁶/mice) were injected subcutaneously in SCID mice and once tumors were palpable, mice were injected with vehicle (6% Captisol) or (R)-9b (dissolved in 6% Captisol), 5 times a week for 5 weeks. The tumor volume was measured using calipers. (C) The mitochondrial extracts were processed for determining ATP synthase activity. (D) mtDNA and HBB levels were determined by qPCR. (E) Tumor mitochondrial extract were processed for immunoblot-based detection of p-Ser65-Ub, p-Ser65-PRKN, p-DNM1L, DNM1L, LC3B-II, PINK1, PRKN and TOMM20. Additionally, the lysates were also immunoprecipitated with ATP5F1A, followed by immunoblotting with ATP5IF1 antibodies (4th panel). (F) Tumor lysates were immunoblotted for detection of the indicated proteins. For A-F, data are represented as mean ± SEM (for E and F, n = 3, 2 replicates). ns- not significant, *p < 0.05, **p < 0.01, ***p < 0.001.
Figure 10.
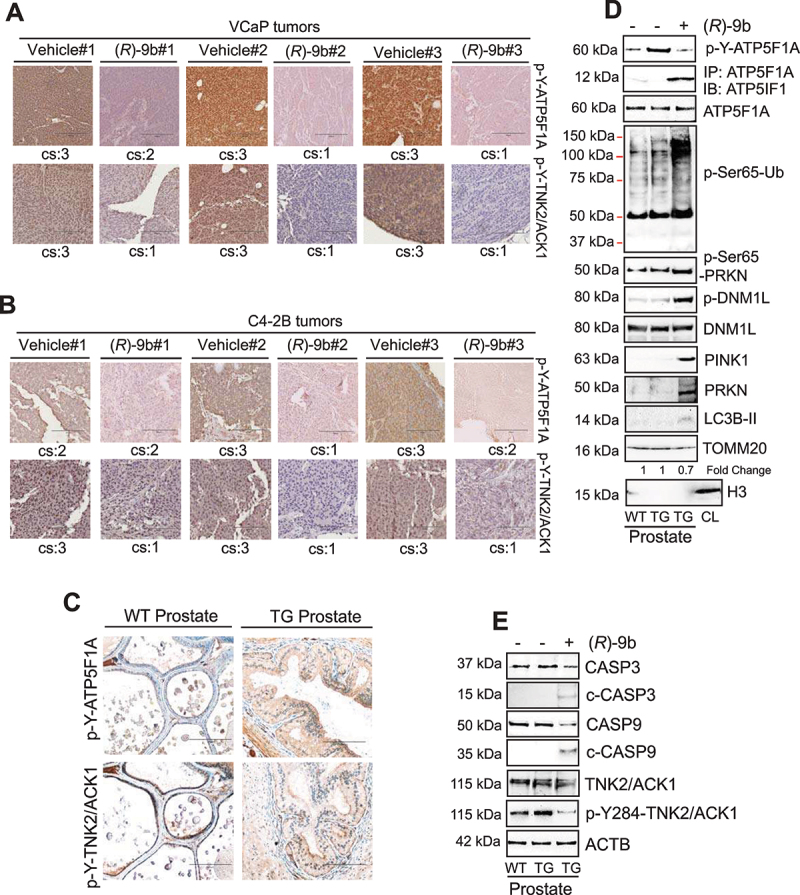
Loss of TNK2/ACK1 kinase activity depletes p-Y-ATP5F1A in tumor xenograft and mice models. (A and B) VCaP and C4-2B tumors treated with (R)-9b were processed for immunohistochemistry-based detection of p-Y-ATP5F1A, p-Y284-ACK. Histological scores for cytosolic staining (cs) in each sample is represented at bottom of each image. (C) TNK2 transgenic mice (TG) prostate sections were subjected to IHC staining with p-Y-ATP5F1A and p-Y-284-TNK2/ACK antibodies. (D) Mitochondrial lysates from prostates of wild type and TG mice were subjected to immunoblotting with indicated antibodies. (E) Total lysates from prostates of wild type and TG mice were subjected to immunoblotting with indicated antibodies.
Tnk2/Ack1 transgenic mice exhibit increased p-Y-ATP5F1A and loss of mitophagy
Earlier we have characterized an auto-activating E346K point mutation that causes constitutive activation of TNK2/ACK1 [29,37]. We generated a transgenic mouse model in which human E346K-ACK1 was expressed in prostates of the mice by placing it under the control of modified Probasin (PB) promoter, ARR2PB. Tnk2/Ack1 transgenic mice (TG) exhibited a significant increase in p-Y-TNK2/ACK1 and p-Y-ATP5F1A staining in prostates and developed prostatic intraepithelial neoplasia (PINs) (Figure 10C). In addition, TG mice exhibited a significant increase in p-Y-ATP5F1A expression and upon (R)-9b injection, increased ATP5IF1 binding and accumulation of p-Ser65-Ub, p-Ser65-PRKN, p-DNM1L, PINK1, PRKN and LC3B-II in mitochondrial fraction was observed (Figure 10D), followed by decrease in cleavage of CASP3 and CASP9 (Figure 10E).
Increased TNK2/ATP5F1A signaling during prostate cancer progression to malignant stage
To understand the clinical relevance, freshly harvested human benign prostate, prostate carcinoma, lymph node and sample with metastasis of prostate cancer to lymph node were IHC stained. A significant increase in p-Y-TNK2/ACK1 (cytoplasmic) and p-Y-ATP5F1A expression was observed in prostate carcinoma and its metastasis to lymph nodes (Figure 11A). To further validate these observation, IHC staining of a tissue microarray (TMA) of clinically annotated human prostate (n = 80) samples was undertaken. A significant increase in p-Y-TNK2/ACK1 and p-Y-ATP5F1A level was observed when cancer patients from progressive stages were examined, i.e. normal, hyperplasia and malignant stages (Figure 11B-D; Table S1). Kruskal Wallis test indicated that both p-Y-TNK2/ACK1 and p-Y-ATP5F1A expression differed significantly among progression stages (P = 0.00002 and P = 0.00019, respectively) and expression of p-Y-TNK2/ACK1 was significantly correlated with p-Y-ATP5F1A in situ (Spearman rank correlation coefficient ρ = 0.55, p = 1.1x10⁻⁷; Figure 11E).
Figure 11.
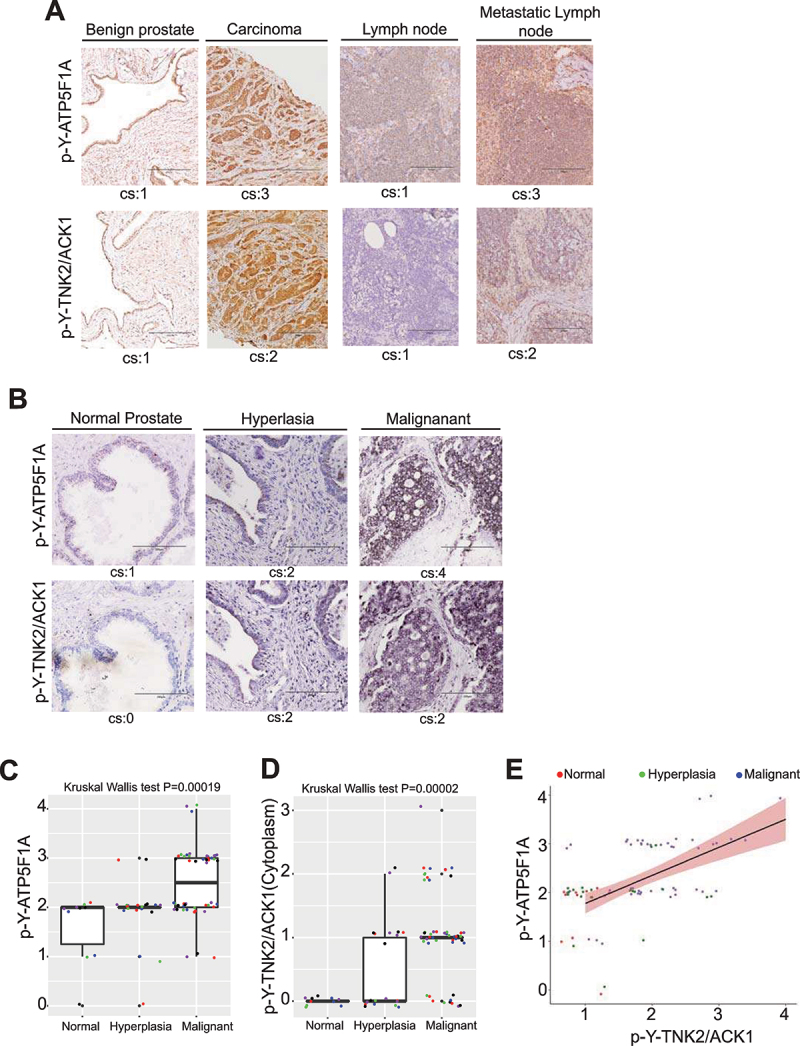
P-Y284-TNK2/ACK1 and p-Y-ATP5F1A expression in TMA is correlated with progression of prostate cancer to malignant stage. (A) Human benign prostates, cancer tissue, lymph nodes and metastatic lymph nodes were subjected to immunohistochemistry-based detection of p-Y-ATP5F1A and p-Y284-TNK2/ACK1. Pathologist’s scores for cytosolic staining (cs) in each sample is shown. Bars: 200 μm. (B) Human prostates TMA were subjected to IHC staining with p-Y-ATP5F1A and p-Y284-TNK2/ACK1 antibodies. Pathologist’s scores for in each sample is shown. Bars: 200 μm. (C and D) Box plots summarize distributions of staining intensities for p-Y-ATP5F1A or p-Y284-TNK2/ACK1 antibody in prostate TMA sections. The box indicates 50% of the data from the 25% quartile to the 75% quartile with the bold black horizontal lines representing the median. Whiskers extend from each end of the box to the most extreme values within 1.5 times the inter quartile range from the ends of the box. The individual data points were jittered and colored for better visualization. (E) Expression levels between p-Y-ATP5F1A and p-Y284-TNK2/ACK1 expression were significantly correlated in prostate tumors (ρ = 0.46, p = 1.9x10⁻⁵).
Discussion
Growth of prostate carcinoma is recognized as distinct among solid tumors because primary prostate tumors favor enhanced OXPHOS but limited glycolysis [10]. In this study, we uncovered that an oncogenic kinase, TNK2/ACK1, phosphorylates ATP5F1A at Tyr243/246, thus maintaining high mitochondrial output (Figure 12). Significantly, this post-translationally modified ATP5F1A is largely lacking in normal prostate cells or tissues, in contrast, a significant increase in p-Y-ATP5F1A levels were seen in malignant tissues that correlated with activated TNK2/ACK1. This uncovers a novel mitochondrial vulnerability that can be utilized to achieve cancer specific cell clearance. Thus, TNK2-ATP5F1A signaling presents an excellent opportunity for metabolism-based drug targeting.
Figure 12.
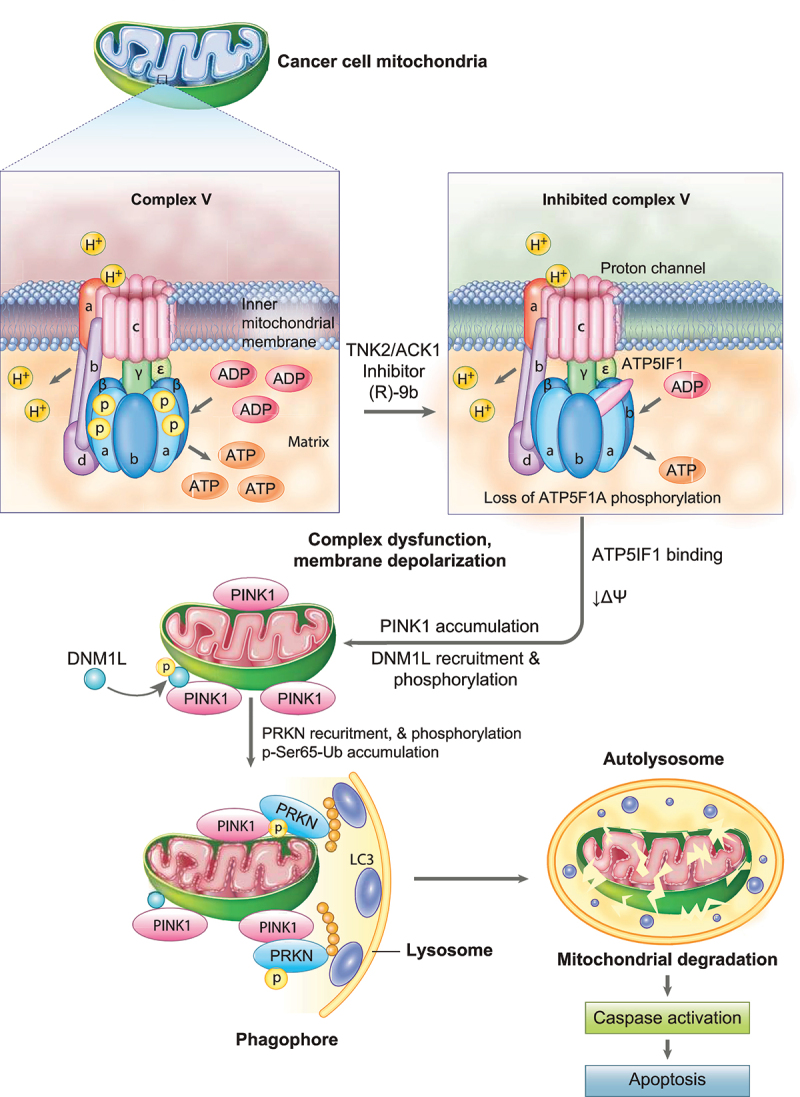
TNK2/ACK1-mediated phosphorylation of ATP5F1A (ATP synthase F1 subunit alpha): Graphical abstract. In prostate cancer cell mitochondria, TNK2/ACK1 inhibition by (R)-9b causes depletion of p-Y243/Y246-ATP5F1A, resulting in enhanced binding of ATP5IF1 to ATP synthase complex. ATP5IF1 binding causes mitochondrial dysfunction in prostate cancer cells, promoting reduction in mitochondrial membrane potential (ΔΨ) thereby elevating mitochondrial membrane depolarization. This mitochondrial stress then enable recruitment of PINK1, which further facilitates recruitment and phosphorylation of DNM1L and PRKN. Consequently, accumulation of p-Ser65-Ub activates PINK1/PRKN mitophagy pathway. The damaged mitochondria experiencing massive PINK1/PRKN activation recruits itself to lysosome membranes via LC3 attached to a phagophore. Targeted cancer mitochondria are subsequently degraded in autolysosome, causing activation of caspase-based apoptosis signaling, leading to cancer cell specific clearance.
A major advantage of cancer specific mitochondria-targeting drug synergy is unique activation of mitophagy mediated apoptosis in cancer cells, which is driven by leakage of pro-apoptotic factors. Since, normal cells do not pre-dispose such mitochondrial vulnerabilities, the usage of mitochondria-targeting treatment or “mitocan”-based therapy can lead to the efficient elimination of cancer cells, while sparing normal cells. Cancer metabolism-specific inhibitors as candidate mitocans are rare and highly sought after and therefore multiple mitochondrial inhibitors are delineated for their anti-cancer properties [60–64]. These drugs are mostly limited by their off-target toxic effects and unclear cancer specificity. For example, rotenone is an inhibitor of complex I that although inhibits proliferation of several human cancer cell lines, exhibit potent off-target toxic effects [60], and causes neurotoxicity [65]. Similarly, metformin, a pleiotropically acting drug that inhibits complex I [66,67] seems to decrease overall mortality, but not the incidence of prostate cancer [61,68,69]. Other complex I inhibitors, deguelin and IACS-010759, are recently reported for their anti-cancer properties in PTEN null mice [62,70] and in a prostate cancer mouse model with the co-deletion of PTEN and Trp53 [63], respectively. However, drugs that can specifically target mitochondrial metabolism have not been identified in prostate malignancies. In this context, our data demonstrate that (R)-9b is a cancer specific mitocan that compromises the unique metabolic needs of cancer cells and specifically annihilates them by triggering mitophagic pathways. It is likely that other TNK2/ACK1 overexpressing cancers e.g. breast, testicular, pancreatic, glioma and lung cancer could also exhibit sensitivity for TNK2/ACK1 inhibition.
We observed that (R)-9b mediated inhibition of mitochondrial output or OXPHOS is often accompanied by increased lactate levels in most prostate cancer lines, while not affecting glucose consumption (Fig. S12D-G), indicating that prostate cancer cells are trying to utilize alternative metabolic pathway to compensate for loss of ATP. Interestingly, at least six different glycolytic enzymes were found to be Tyr-phosphorylated in the proteomics screen of the TNK2/ACK1 overexpressing prostate cancer cells (Table S2). Further, (R)-9b treatment altered the levels of enzymes of various metabolic pathways (Fig. S12H and I). Taken together, these data postulate that the tumor inhibitory effect of TNK2/ACK1 inhibition may not only be seen in the OXPHOS dependent prostate cancers [33], but also in glycolysis dependent tumors such as breast cancers [34].
Castration resistant prostate cancer (CRPC) is notoriously difficult to treat due to its rapid acquisition of resistance to both, first and second generation of anti-androgen and AR-antagonist therapies. Since, AR is regulated by TNK2/ACK1 [33] and ubiquitin ligase such as SIAH2 is involved in TNK2/ACK1 degradation [40], it might be possible to achieve CRPC specific mitophagy by understanding mechanistic details of TNK2/ACK1 regulators. Overall, the dependence on p-Y-ATP5F1A to maintain ATP levels could be a novel paradigm for the addiction of cancer cell mitochondria to kinase signaling and presents a previously unknown “metabolic vulnerability” that can be exploited as a deterrent to drug resistance.
Materials and Methods
Cell lines
RWPE-1, VCaP, PC-3, LNCaP, 22Rv1 and HEK293T cells were obtained from ATCC (CRL-11609, CRL-2876, CRL-1435, CRL-1740, CRL-2505, CRL-3216). C4-2B and LAPC-4 cells source and growth conditions were as described previously [33]. VCaP and HEK293T cells were cultured in DMEM (Gibco, 15,070,063). PC-3 cells were cultured in RPMI-1640 (Thermo Fisher Scientific, 11,875,093) with 10% FBS (Life technologies, 160,044). LAPC-4 cells were cultured in Isove’s modified Eagle’s medium (Thermo Fisher Scientific, MT10016CV) which was supplemented with 10% fetal bovine serum, 1 nM R1881, 50 units/ml of penicillin, and 50 µg/ml of streptomycin, r supplemented with 10% FBS. All cultures were maintained with 5000 units/ml of penicillin-streptomycin (Thermo Fisher Scientific, 15,070,063) and cultured in a 5% CO2 incubator.
Knockdown of TNK2 by siRNA Interference
Various prostate cancer cell lines were transfected with test siRNA or control siRNA by using X-tremeGENE siRNA transfection reagent (Sigma-Aldrich, 4,476,093,001). Cells were allowed to culture for 48 h and then harvested for immunoblotting experiments. Following siRNA were used in present study: TNK2 siRNA#1 (Dharmacon RNA Technologies, D-003102-13), TNK2#2 (Dharmacon RNA Technologies, D-003102-11), PINK1 siRNA (Thermo Fisher Scientific, AM51331), PRKN siRNA (Thermo Fisher Scientific, AM16708), MAP1LC3B siRNA (Santa Cruz Biotechnology, sc-43,391) and control siRNA-A (Santa Cruz Biotechnology, sc-37,007).
Retrovirus-based transfection
To generate stable prostate cancer cell lines expressing Vector (Vec), WT and Mut-ATP5F1A or RWPE-1 cell line stably expressing Vector (Vec), TNK2/ACK1 and kd-TNK2/ACK1, respective retrovirus constructs were subcloned into pMSCV vector and transfected in 293 T cells with a packaging plasmid (pCMV-VSV-G and pUMVC3-gag pol) using X-tremeGENE transfection reagent (Sigma-Aldrich, 4,476,093,001). Prostate cancer cell lines or RWPE-1 cells were infected for 12 h with viral supernatants containing 8 μg/mL polybrene (Santa Cruz Biotechnology, sc-134,220). The transfected cells were selected in the presence of 2 μg/mL puromycin (Thermo Fisher Scientific, A1113802). WT and Mut-ATP5F1A cells were cultured in media with 1% serum for 12 h prior experiments or specifically mentioned in experiments.
Chemical/inhibitors treatment and cell culture conditions
For all the studies, (R)-9b treatment was given in 1% serum condition at concentration 1 μM until specifically indicated for time intervals as per experiments. WT and Mut-ATP5F1A cells were cultured in media with 1% serum for 12 h and processed for immunofluorescence-based detection of MitoTracker (Thermo fisher scientific, M7512) staining. In these experiments oligomycin (Oligo; Sigma, 579–13-5) treatment (0.5 μM) for 3 h was used as control for depletion of MitoTracker intensity. WT and Mut-ATP5F1A cells were cultured in media with 1% serum for 72 h for immunofluorescence-based detection of LC3B-II, LysoTracker (Invitrogen, L12492) staining. For experiments involving TMRE (Abcam, ab113852)-based immunofluorescence or flow cytometry, cells were treated with Oligo (0.5 μM) for 1 h or FCCP (Sigma, 370–86-5) (0.5 μM) for 1 h prior to harvesting cells. For experiments involving 3-MA (Santa Cruz Biotechnology, sc-205,596; 50 μM) and Mdivi-1 (Selleckchem, S7162; 50 μM) treatments, WT and Mut-ATP5F1A cells were cultured in 1% serum for 12 h followed by 48, 72 or 96 h of (R)-9b treatment, as per experiments. sodium orthovanadate (Thermo Fisher Scientific, S454-50; 1 μM) and sodium fluoride (Sigma, S6521; 1 μM) were added to culture media for inhibition of protease for 3 h prior to termination of respective experiment.
Mouse xenograft studies
All animal experiments were performed using the standards for humane care in accordance with the NIH Guide for the Care and Use of Laboratory Animals. Mice breeding and colony maintenance was performed according to IACUC protocols approved in writing by Washington University in St. Louis Department of Comparative Medicine (DCM). A xenograft WT-ATP5F1A and Mut-ATP5F1A VCaP tumor model was prepared and monitored for eight weeks. Briefly, retrovirus-based stable WT-ATP5F1A and Mut-ATP5F1A VCaP cells were cultured and harvested and resuspended in media. The viable cell numbers were estimated by counting trypan blue exclusion assay. The cell suspension was mixed with 50% volume of Matrigel (Corning, 354,428) to a final concentration of 2 × 10⁶ cells were injected subcutaneously into the left flank of the intact adult male SCID C.B17 mice (Jackson laboratory). Tumor growth and body weight were checked thrice a week. Tumor volume was calculated using the formula: volume = (width)2 × length/2. At the end of the experiment (8 weeks post cancer cell injection), the animals were euthanized by carbon dioxide asphyxiation. Tumor samples were collected and stored at −80°C until analysis.
For C4-2B xenograft tumor growth study, 2 × 10⁶ C4-2B cells were suspended in 200 µl of PBS (Sigma, P5493) with 50% Matrigel and were implanted subcutaneously into the dorsal flank of castrated six-week-old male SCID C.B17 mice (n = 3 per group). Once the tumors reach approximately 100mm3 in size (about 4–5 weeks), mice were injected subcutaneously with (R)-9b resuspended in 6% Captisol (Selleckchem, S4592; 6% Captisol in PBS as vehicle) at the concentrations 20 mg/Kg of body weight, five times a week, for 4–5 weeks. Tumor volumes were measured every 5th day interval using calipers and tumor volume was calculated as described above. Formation of tumors was monitored over a 10-week period. At the end of the study, all mice were humanely euthanized, tumors extracted and weighed.
For VCaP xenograft study, similar strategy was used except that the cells were injected in intact male SCID C.B17 mice (n = 3 per group) and treated orally with 48 mg/Kg of body weight with (R)-9b in 6% Captisol, five times a week. At the end of the experiment (day 35), and tumor samples were collected and processed as described above.
Tnk2/Ack1 Transgenic (TG) Mice
E346K mutant of human TNK2 gene was inserted into the pTG1 vector downstream of a sequence coding ARR2PB promoter region and Globin intron, upstream of a SV40 polyA site. The construct was digested and linear DNA fragment was microinjected into fertilized C57B6 mouse eggs, which were then surgically transplanted into a pseudo-pregnant female. Transgenic founders were screened by PCR using genomic DNA isolated from tail snips. Presence of mutation, E346K, was confirmed by tail PCR, followed by sequencing. The prostate specific expression was assessed by immunoblotting with p-Y284-TNK2/ACK1 antibodies. Prostates from transgenic mice were dissected using a dissection microscope, fixed in 10% buffered formalin and embedded in paraffin. Sections were stained with hematoxylin (Sigma, H9627) and eosin (Sigma, 861,006) and stained slides were evaluated by pathologist (C.W.).
Mass Spectrometry
C4-2B cell were transfected with HA-tagged TNK2/ACK1. Post-transfection, cells lysates were processed for LCMS/MS analysis. Samples were digested overnight with modified sequencing grade trypsin (Promega, Madison, V5111), Glu-C (Worthington, LS003605), or Arg-C (Roche, 11,370,529,001). Phosphopeptides were enriched using Phospho Select IMAC resins (Sigma, I1408). A nanoflow ultra-high performance liquid chromatograph (RSLC) (Thermo Fisher Scientific, ULTIM3000RSLCNANO) coupled to an electrospray bench top orbitrap mass spectrometer Q-Exactive plus (Thermo Fisher Scientific, IQLAAEGAAPFALGMBDK) was used for tandem mass spectrometry peptide sequencing experiments. The sample was first loaded onto a pre-column (2 cm × 100 μm ID packed with C18 reverse phase resin, 5 μm, 100 Å) and washed for 8 min with aqueous 2% acetonitrile and 0.04% trifluoroacetic acid. The trapped peptides were eluted onto the analytical column, (C18, 75 μm ID × 50 cm, 2 μm, 100 Å). The 90 min gradient was programmed as: 95% solvent A (2% acetonitrile + 0.1% formic acid) for 8 min, solvent B (90% acetonitrile + 0.1% formic acid) from 5% to 38.5% in 60 min, then solvent B from 50% to 90% B in 7 min and held at 90% for 5 min, followed by solvent B from 90% to 5% in 1 min and re-equilibrate for 10 min. The flow rate on analytical column was 300 nl/min. Sixteen tandem mass spectra were collected in a data-dependent manner following each survey scan. Both MS and MS/MS scans were performed in Orbitrap to obtain accurate mass measurement using 60 sec exclusion for previously sampled peptide peaks. Sequences were assigned using Sequest (Thermo Fisher Scientific) and Mascot (www.matrixscience.com) database searches against SwissProt protein entries of the appropriate species. Oxidized methionine, carbamidomethyl cysteine, and phosphorylated serine, threonine and tyrosine were selected as variable modifications, and as many as 3 missed cleavages were allowed. The precursor mass tolerance was 20 ppm and MS/MS mass tolerance was 0.05 Da. Assignments were manually verified by inspection of the tandem mass spectra and coalesced into Scaffold reports (www.proteomesoftware.com).
Generation and affinity purification of the p-Y-ATP5F1A antibody
Two ATP5F1A peptides coupled to immunogenic carrier proteins were synthesized as shown below, and p-Y-ATP5F1A antibodies to detect tyrosine at 243 and 246 sites were custom synthesized by ProMab Biotechnologies.
ATP5F1A Phosphorylated peptide (GSDEKKKLpYSIpYVAIGQKRSC)
ATP5F1A Non-modified peptide (GSDEKKKLYSIYVAIGQKRSC)
The monoclonal p-Y-ATP5F1A antibodies to detect tyrosine at 243 and 246 expressing hybridoma was custom generated by ProMab Biotechnologies.
Immunoblotting
Xenograft tumors were homogenized and lysed by sonication in receptor lysis buffer (RLB) containing 20 mM HEPES (pH 7.5), 500 mM NaCl, 1% Triton X-100, 1 mM DTT, 10% glycerol, phosphatase inhibitors (50 mM NaF, 1 mM Na2VO4), and protease inhibitor mix (Roche, 04574834001). RWPE-1, VCaP, C4-2B, PC-3, LAPC-4, LNCaP, 22Rv1 and HEK293T cells were transfected and/or treated as per experimental requirement and were harvested and lysed by sonication in RLB. Lysates were quantitated and 50 mg, unless specifically mentioned, of protein lysates were fractionated by SDS-PAGE, and transferred onto a PVDF membrane (Bio-Rad, 1,620,177). After blocking in 3% bovine serum albumin (BSA) (Sigma, A7030), membranes were incubated with the following primary antibodies: anti-p-Y-ATP5F1A (1:100), anti-ATP5F1A (1:1000), anti-ATPIF1 (1:1000), anti-PRKN (1:1000), anti-PINK1 (1:1000), anti-phosphoSer65-PRKN (1:1000), DNM1L (1:1000), phospho-DNM1L (1:1000), anti-phospho-Ubiquitin/Ub (1:1000), anti-p-Y-284-TNK2/ACK1 (1:1000), anti-TNK2/ACK1 (1:1000), anti-IF-1 (1:1000), anti-LC3B-II (1:1000), anti-TOMM20 (1:1000), anti-cleaved CASP3 (1:1000), anti-cleaved CASP9 (1:1000), anti-HA (1:1000), anti- phosphor-tyrosine (p-Tyr) (1:500), anti-FLAG (1:1000), anti-HSP90 (1:1000) and anti-ACTB (1:9000). Following three washes in PBS-T, the blots were incubated with horseradish peroxidase-conjugated secondary antibody. The blots were washed three times and the signals visualized by Pierce™ ECL Western Blotting Substrate according to manufacturer’s instructions (Thermo Fisher Scientific, 32,209).
For immunoprecipitation studies, cell or xenograft tumors were lysed by sonication in RLB, the lysates were quantitated and 0.5 to 1 mg of protein lysate was immunoprecipitated using 2 μg of anti-ATP5F1A, anti-p-Tyr, anti-FLAG or anti-HA antibody coupled with protein A/G sepharose (Santa Cruz Biotechnology, sc-2003) as described earlier [71]. Samples were then washes with RLB and PBS buffers. The beads were boiled in sample buffer and immunoblotting was performed as described above. Densitometric analysis using ImageJ software (ImageJ, NIH, USA) was performed for representative immunoblot images after normalizing with ACTB and fold change intensity for each lane is incorporated, wherever required.
Antibodies for western blots and immunofluorescence used were from the following sources:
anti-ATP5F1A (Santa Cruz Biotechnology, sc-136,178), anti-TOMM20 (Sigma, HPA011562),
anti-HSP-90 (Santa Cruz Biotechnology, sc-13,119), anti-ATPIF1 (Santa Cruz Biotechnology, sc-271,614), anti-p-Tyr (Santa Cruz Biotechnology, sc-508), anti-FLAG (Sigma, F3165), anti-HA (Santa Cruz Biotechnology, sc-7392), anti-TNK2/ACK1 (Santa Cruz Biotechnology, sc-28,336), anti- p-Y284-TNK2/ACK1 (Millipore, 09–142), anti-LC3B-II (Abcam, ab48394), anti-PINK1 (Santa Cruz Biotechnology, sc-517,353), anti-cleaved CASP9 (Cell Signaling Technology, 7237), anti-PRKN (Santa Cruz Biotechnology, sc-32,282), anti-phospho-ubiquitin (Ser65; Millipore, ABS1513-I), anti-phospho-PRKN (Ser65; Millipore, ABN2244), DNM1L (Cell Signaling Technology, 14,647), phospho-DNM1L (Ser616; Cell Signaling Technology, 3455), anti-cleaved CASP3 (Cell Signaling Technology, 9661), Alexa Fluor® 488 Goat anti-Rabbit IgG (Thermo Fisher Scientific, A-11008), Alexa Fluor® 488 Goat anti-Mouse IgG (Thermo Fisher Scientific, A-11029), anti-ACTB/Actin (Sigma, A2228), anti-mouse IgG, HRP-linked Antibody, Cell Signaling Technology, 7076) and anti-rabbit IgG, HRP-linked Antibody (Cell Signaling Technology,7074).
In vitro kinase assay
HEK293T cells were transfected with WT-ATP5F1A or Mutant constructs. Post 48 h of transfection, cell lysates were prepared and 1 mg protein was subjected to immunoprecipitation using FLAG beads for 2 h. 20ul of this IP WT/Mutant protein-bead conjugate was then incubated with TNK2/ACK1 or non-specific kinase, WEE1, (1 ug) at 37°C in kinase assay buffer (50 mM HEPES (pH 7.5) (Sigma, H7006), 15 mM MgCl2 (Sigma, M1028), 1 mM EGTA (Sigma, E8145), 10% glycerol (Sigma, G5516), 10 mM DTT (Sigma, 10,197,777,001) and 0.1 mM ATP (Sigma, A7699) for 2 h. The reaction was separated on SDS-PAGE, followed by immunoblotting with p-Tyr antibody to detect phosphorylation on ATP5F1A. TNK2/ACK1 and WEE1 proteins (1 ug) were also subjected to SDS-PAGE and stained with Coomassie brilliant blue R-250 (Thermo Fisher Scientific, BP101-25).
Mitochondrial extract preparation
RWPE-1, prostate cancer cells or tumor samples were harvested as per various experimental conditions and cell pellets were utilized for mitochondria isolation as per manufacturers protocol (Thermo Fisher Scientific, 89,874). Total cell lysate (CL) is used as control for mitochondrial or cytosolic extract.
Transmission electron microscopy
C4-2B and RWPE-1 cells were plated on coverslips and treated with 1 μM of (R)-9b for 48 h. Post 48 h, cells were immersion fixed overnight in a modified Karnovsky’s fixative containing 3% glutaraldehyde (Sigma, G5882) and, 2% paraformaldehyde (Sigma, 158,127) in 1 M sodium cacodylate buffer (pH 7.4) (Sigma, 97,068). Cells were then rinsed in 1 M sodium cacodylate buffer, post fixed in 2% osmium tetroxide (Sigma, 75,632), dehydrated through graded ethanol (Sigma, E7023) and propylene oxide (Sigma, 202,339) and embedded in Embed 812 (Electron Microscopy Sciences, 14,120). Sections were cut 90-nm thick and placed on 200-mesh copper grids. Grids were stained with uranyl acetate (Sigma, 221,171) and lead citrate (Sigma, 15,326) and viewed at 80kv with a JEOL 1200EX electron microscope and digital images were acquired with an AMT Advantage HR high speed, wide angle, 1.3 megapixel TEM high definition CCD camera. A minimum of 8–10 random fields were examined in blinded fashion at 2,500x (magnification for evidence of autophagy or cell injury/death. Higher magnifications (10,000–30,000x) were used to examine ultrastructure changes in mitochondria. Mitochondrial cristae per mitochondria were counted and plotted as mean±SEM in bar graphs.
Immunofluorescence analysis
Normal or prostate cancer cells (3 × 10²) under various experimental conditions were seeded on cover slips and allowed to adhere for 24 h at 37°C. Thereafter, cells were treated with inhibitors as per experimental conditions. Cell were then processed and permeabilized as described earlier [72]. Next, the cells were incubated with the primary antibodies, FLAG mouse monoclonal or LC3B-II mouse monoclonal and TOMM20 rabbit polyclonal at a dilution of 1:500 in blocking buffer for 1 h. The excess antibody was washed off with 1X PBS. The cells were incubated with Alexa Fluor 488-conjugated anti-rabbit secondary antibody (1:1000 dilution) and Alexa Fluor 594-conjugated anti-mouse secondary antibody (1:1000 dilution) for 30 min. The cells were washed and coverslips were mounted on glass slides in DAPI (Thermo Fisher Scientific, D1306) containing mounting media. The cells were visualized using Zeiss LSM 880 II Airyscan FAST Confocal Microscope with a 63X oil immersion objective. Zen blue software was used to acquire and process images.
For visualizing mitochondrial activity by MitoTracker Red (MitoTracker™ Red CMXRos; Thermo Fisher Scientific, M7512) staining or visualization of autolysosome by LysoTracker (Invitrogen, L12492) dye, cells under various experimental condition were incubated with 100 nM of MitoTracker Red or 50 nM of LysoTracker in complete media for 30 min at 37°C. Cells were also stained with DAPI as described earlier [73]. After washing with PBS, cells were fixed with 2% paraformaldehyde for 5 min and processed for Immunofluorescence staining for FLAG or TOMM20 as mentioned above. MitoTracker Red staining intensity was normalized with DAPI staining intensity using densitometric analysis by ImageJ software (NIH) and fold changes were represented as mean ± SEM of relative MitoTracker staining intensity, wherever required in related experiments.
TMRE staining
To access the changes in mitochondrial membrane potential, tetramethylrhodamine ethyl ester (TMRE) Mitochondrial Membrane Potential Assay Kit (Abcam, ab113852) was utilized as per manufacture’s protocol. Briefly, Cells were plated in CELLview 4‐compartment glass‐bottom tissue culture dishes (Greiner Bio‐One, 627,870), and treated as per experimental condition. Cells were then incubated for 30 min at room temperature with 50 nM TMRE and and NucBlue™ Live ReadyProbes™ Reagent (Thermo Fisher Scientific, R3760) and proceed for live‐cell imaging with the alpha Plan‐Apochromat 100×/1.46 Oil DIC M27 objective on the Zeiss LSM 880 with Airyscan. Prior to image analysis, raw .czi files were automatically processed into deconvoluted Airyscan images using the Zen software. Leica SP8 LSM, fitted with STED module, was used to perform live‐cell super‐resolution imaging.
Assessment of mitochondrial membrane potential by flow cytometry-based TMRE staining
To detect changes in mitochondrial membrane potential, cell were stained with tetramethylrhodamine ethyl ester (TMRE; Abcam, ab113852) and measure by flow cytometry as pre manufacturer protocol. Briefly, cells were incubated with 50 nM TMRE for 30 min. After washing the cells in PBS, they were processed for FACS-based detection of TMRE using flow cytometer (BD FACS Calibur). FLOWJO software was used to measure immunofluorescence intensities and fold change is potted as bar graphs.
Human prostate cancer clinical tissues and prostate TMA
The prostate TMAs were obtained from US Biomax (PR807c: 80 cases) for our study for which we are exempt from IRB approval, as no personal information about patients is sought.
Immunohistochemical staining
Fine sections (5 μm) were prepared from formalin fixed paraffin embedded tumor tissues and fixed on glass slides. For immunohistochemistry, slides were deparaffinization and antigen retrieval was performed as described earlier [74]. Horse serum (2.5%; Sigma, H1270) was used for blocking for 1 h. After washing with PBST, slides were probed with p-Y-ATP5F1A (1:10) or p-Y284-TNK2/ACK1 (1:100) and incubated at 4°C overnight. Slides were washed with PBST and probed with biotinylated universal secondary antibody (Vector Laboratories, BA-1400) for 1 h. Tissue sections were again washed with PBST and layered with ABC vectastain reagent (Vector Laboratories, PK-7200) for 30 min. After three washes with PBST, tissue sections were stained with DAB substrate (Vector Laboratories, SK-4100) and observed under microscope for reaction buildup and then immediately washed with PBS. Tissue sections were stained with hematoxylin for nuclear staining and washed under tap water followed by dehydration with 70% ethanol solution. Tissues sections were then sealed with coverslips using Cytoseal™ 60 (Richard-Allan Scientific, 925,302) and allowed to cure for 48 h. For human prostate TMA, similar IHC protocol was performed with slight modification after deparaffinization, endogenous peroxidase activity was blocked by treatment of 0.3% H2O2 (Sigma, 1.07209) in distilled water for 5 min and during DAB substate addition, DAB Reagent 4, containing Nickel, was also added. Tissue sections were then examined and images were captured with a brightfield microscope (EVOS M5000 Imaging System, Invitrogen) at 20x magnification. Histopathological analysis was performed for each tissue section and cytosolic scores (cs) were mentioned for IHC staining for both p-Y-ATP5F1A and p-Y284-TNK2/ACK1 at the bottom of image.
Seahorse Mito Stress assay
The metabolic status was investigated on an XFe96 Extracellular Flux analyzer (Seahorse Bioscience) with standard 96-well Seahorse microplates (Agilent, 101,085–004). A Mito Stress test kit (Agilent, 103,015) was applied, and the oxygen consumption ratio (OCR) and the extracellular acidification rate (ECAR) were measured. In brief, VCaP, C4-2B or RWPE-1 cells were seeded into 96 well plates with or without (R)-9b for 12 h and allowed to form a monolayer. Thereafter, medium was then replaced by 180 μl of non-buffered Dulbecco’s modified Eagle’s medium (DMEM) containing 10 mM glucose, 2 mM glutamine and 1 mM pyruvate. The cells were incubated in a CO2-free incubator at 37°C for 1 h to allow for temperature and pH equilibration before being loaded into the XFe96 analyzer. The injection sequence was programmed as: 1st, oligomycin (1 μM at final concentration); 2nd, FCCP (1 μM at final concentration); 3rd, rotenone and antimycin A (0.5 μM and 0.5 μM at final concentrations, respectively). ATP-linked OCR was measured by subtracting the OCR at oligomycin addition from baseline cellular OCR. The data was normalized with cell number and analyzed using software Wave (version 2.2.0, Seahorse Bioscience) for visual presence.
Trypan blue exclusion assay
To assess the effect of various transfections or retrovirus-based stable gene expression or treatments on cell proliferation, the cells were trypsinized and number of viable cells counted by trypan blue exclusion assay kit (Sigma, T8154) as per manufacturers protocol and data obtained were represented in bar graphs as mean±SEM.
Colony formation assay
Colony formation assay was performed as described elsewhere [75]. Briefly, retrovirus-based stable transfected VCaP, C4-2B and PC-3 cells (5 × 10²) were plated in 6 well plates and allowed to adhere for 24 h at 37°C. Next day, cells were cultured for further 48 h in 1%FBS containing media. Subsequently, medium was replaced with complete media and cells were incubated for an additional 21 days at 37°C in CO2 incubator with medium change on every 2–3 day. Cells were then fixed (3% paraformaldehyde and 0.02% glutaraldehyde in PBS) and stained with 0.05% crystal violet (Sigma, C0775). Images of colonies were captured and densitometric analysis was performed using ImageJ software (ImageJ, NIH, USA). Relative colony formation (%) values as compared to vector expressing cells were plotted in bar graphs as mean±SEM.
ATP Quantification
Cellular ATP contents were determined by Mitochondrial ToxGlo™ Assay (Promega, G9241). In brief, RWPE-1 or PC-3 cells were treated as per experimental conditions in 96 well white polystyrene microplate (Corning, VV-01728-44) and ATP levels were measured by luminescent ATP detection assay kit according to the manufacturer’s protocols. The percentage luminescence was normalized with cell number and plotted in bar graphs as mean±SEM.
ATP synthase activity assay
Complex V (ATP synthase) enzyme activity was determined using the ATP Synthase Enzyme Activity Microplate Assay Kit (Abcam, ab109714). Assay was performed as per the manufacturer’s protocol. Briefly, 5 ug of mitochondrial extracts obtained from various experimental conditions were plated in a 96-well assay plate and the hydrolysis of ATP to ADP, facilitated by immunocaptured ATP-synthase, was coupled to the oxidation of NADH to NAD+ resulting in reduced absorbance at 340 nm. OD obtained were calculated for percent of vehicle control and were represented in bar graphs as mean±SEM.
Mt-DNA qPCR
Cells under various experimental conditions were lysed in RLB and quantitative PCR was performed to quantify mitochondrial DNA (mtDNA) copy number and the internal control gene HBB using SYBR® Premix Ex TaqTM II TB green premix (TaKaRa, RR82LR) and the specific primers:
mtDNA: 172–5′-AGGACAAGAGAAATAAGGCC-3′ (forward)
5′-TAAGAAGAGGAATTGAACCTCTGACTGTAA-3′ (reverse)
HBB: 5′-GTGCACCTGACTCCTGAGGAGA-3′ (forward)
5′-CCTTGATACCAACCTGCCCAG-3′ (reverse)
The conditions of PCR reaction were as follows: one cycle of 95°C for 30s, 40 cycles of 95°C for 5 s, and 60°C for 30s. Each reaction was repeated three times. The expression level of mtDNA was determined by relative quantitative CT value of gene expression with 2−∆∆CT method. The HBB data were used for normalizing the gene values.
Quantitative RT-PCR
Cells under various experimental conditions were for RNA isolation and cDNA preparation as described earlier [74]. All RT reactions were done at the same time so that the same reactions could be used for all gene studies. For the construction of standard curves, serial dilutions of pooled sample RNA were used (50, 10, 2, 0.4, 0.08, and 0.016 ng) per reverse transcriptase reaction. One “no RNA” control and one “no Reverse Transcriptase” control were included for the standard curve. Three reactions were performed for each sample: 10 ng, 0.8 ng, and a NoRT (10 ng) control. Real-time quantitative PCR analyses were performed using the ABI PRISM 7900HT Sequence Detection System (Applied Biosystems). All standards, the no template control (H2O), the No RNA control, the no Reverse Transcriptase control, and the no amplification control (Bluescript plasmid) were tested in six wells per gene (2 wells/plate x 3 plates/gene). All samples were tested in triplicate wells each for the 10 ng and 0.8 ng concentrations. The no RT controls were tested in duplicate wells. Following primers of ATP5F1A and ACTB were used for RT-PCR reaction:
ATP5F1A:
5′-GCTCCTTACTCTGGCTGTTCCA-3′ (forward),
5′-GCGGAGCAACAGAGACATCTGA-3′ (reverse)
ACTB:
CACCATTGGCAATGAGCGGTTC (forward)
AGGTCTTTGCGGATGTCCACGT (reverse)
PCR was carried out with SYBR® Premix Ex TaqTM II TB green premix (TaKaRa, RR82LR) using 2 μl of cDNA and the primers in a 20 μl final reaction mixture. After 2 min incubation at 50°C, reaction was activated by 10 min incubation at 95°C, followed by 40 PCR cycles consisting of 15s of denaturation at 95°C and hybridization of primers for 1 min at 55°C. Dissociation curves were generated for each plate to verify the integrity of the primers. Data were analyzed using SDS software version 2.2.2 and exported into an Excel spreadsheet. The ACTB data were used for normalizing the gene values.
Modeling studies
The crystal structure of bovine F1 ATPase (pdb: 1BMF) and bovine F1 ATPase with the natural inhibitor, ATP5IF1, bound (pdb: 1OHH) were used in the modeling studies. Tyr200 and Tyr203 were replaced with phosphotyrosine using Pymol [76]. Using the Molecular Operating Environment (MOE) [77] software platform, the structures were prepared by invoking Protonate 3D, and then energy minimized in Amber 10 force-field. All images of the structures are presented using Pymol software.
High-multiplex stable-isotope dilution assay for measurement of metabolic enzymes
Proteotypic peptides were selected according to CPTAC recommendations [78] and were synthesized as high purity natural abundance and stable isotope-labeled pairs for 115 peptides from 67 enzymes. Lysates from DMSO or (R)-9b (1 μM) for 12 h treated PC-3 prostate cancer cell lines and RWPE-1 normal prostate epithelium cell line were prepared and tryptic digests were generated for spiking with labeled peptide standards. LC-MS analysis was performed using a Q-Exactive mass spectrometer with a parallel reaction monitoring (PRM) method [79]. Assays were developed as Tier 2 assays [80]. The 2 h scheduled PRM method with a minimum of 8 MS2 scans acquired for each peptide. For assay characterization, low complexity matrix is a tryptic digest of 10 commercially available proteins.
Fluorescence-activated cell sorting (FACS) analysis for detection of apoptotic cells
VCaP cells or WT-ATP5F1A or Mut-ATP5F1A retroviral infected cells (3x10⁵) were plated in 35 mm culture dish and allowed to adhere for 24 h. Next, cells were pretreated with 3-MA or Mdivi-1 for 12 h followed by 72 h of (R)-9b treatment. Thereafter, cells were processed for fluorescence-activated cell sorting (FACS) analysis for detection of apoptotic cells, by double staining with ANXA5/annexin V-FITC along with PI as described earlier [72,74]. Cells were sorted by flow cytometer (BD FACS Calibur) to determine the live and dead cell populations. Data was analyzed using Cell Quest Pro software (BD Biosciences) and bar graphs represent mean±SD of percentage of cells positive for ANXA5/annexin V uptake v/s PI as detected by flow cytometry of an experiment done in triplicate
Glucose consumption assay
PC-3 or RWPE-1 cells (3 × 10³) were plated in 12 well tissue culture plates and allowed to adhere for 24 h at 37°C. Next day, cells were starved of serum and glucose (Sigma, G8644) for 2 h. Thereafter, fresh DMEM containing 10% FBS with 25 mM glucose was added and cells were further cultured for 48 h. For measuring glucose utilization, residual glucose present in the culture medium was measured using rapid glucose analyzer (Accu-Chek Sensor Comfort, Roche Diagnostics) according to manufacturer’s instructions. Consumed glucose was estimated by subtracting the remaining residual glucose in the medium from the initial concentration in DMEM (450 mg/dl or 25 mM). The experiments were performed in triplicate and values were normalized to total number of cells.
Lactate assay
PC-3 or RWPE-1 were seeded in a 24-well plate in the growth medium containing 10% FBS under standard culture condition. Cell were treated with (R)-9b for 48 h. Cell pellets were then processed for lactate concentration measurement by YSI 2900 multianalyte system (YSI, 2900D). For TNK2 siRNA transfection studies, C4-2B or LAPC-4 cells were transfected with control (Ctrl) or TNK2 siRNA and post 48 h, cells were processed for lactate assay, as above. Final data of the lactate production rates were normalized to the cell number per well.
Statistical analysis
Data for all experiments were analyzed with Prism software (GraphPad). All statistical analyses were performed using Student t-test or one-way ANOVA unless otherwise specified.
Supplementary Material
Acknowledgments
N.P.M. is a recipient of NIH/NCI grants (1R01CA208258 and 5R01CA227025), Prostate Cancer Foundation (PCF) grant (17CHAL06) and Department of Defense award (PC200201). We thank Dr. Dhivya Sridaran for TNK2/ACK1 TG mice mutation validation. Eric H. Kim for providing human prostate tissue samples and Bin Fang for LC-MS/MS analysis. The expert technical assistance of Petra Erdmann Gilmore, Yiling Mi and Rose Connors is gratefully acknowledged. The Proteomics experiments were performed at the Washington University Proteomics Shared Resource (WU-PSR); R. Reid Townsend, Director WU-PSR is supported in part by the WU Institute of Clinical and Translational Sciences (NCATS UL1 TR000448), the Mass Spectrometry Research Resource (NIGMS P41 GM103422) and the Siteman Comprehensive Cancer Center Support Grant (NCI P30 CA091842). This project was also supported in part, by NIH R35GM131731 to D.M.M.
Funding Statement
This work was supported by the National Cancer Institute [1R01CA208258, 5R01CA227025].
Disclosure statement
Patents “Inhibitors of ACK1/TNK2 Tyrosine Kinase” (patent no. 9,850,216 and 10,017,478) cover (R)-9b compound. N.P.M. is named as inventor. Both the patents have been licensed by TechnoGenesys Inc. N.P.M. is a cofounder of TechnoGenesys Inc., own stocks, and serve as a consultant for TechnoGenesys Inc.
Supplementary material
Supplemental data for this article can be accessed online at https://doi.org/10.1080/15548627.2022.2103961
References
- [1].Hanahan D, Weinberg RA.. Hallmarks of cancer: the next generation. Cell. 2011 Mar 4; 144(5):646–674. [DOI] [PubMed] [Google Scholar]
- [2].Garcia-Bermudez J, Cuezva JM. The ATPase Inhibitory Factor 1 (IF1): a master regulator of energy metabolism and of cell survival. Biochim Biophys Acta. 2016. Aug;1857(8):1167–1182. [DOI] [PubMed] [Google Scholar]
- [3].Lemasters JJ. Metabolic implications of non-electrogenic ATP/ADP exchange in cancer cells: a mechanistic basis for the Warburg effect. Biochim Biophys Acta Bioenerg. 2021 Jul 1; 1862(7):148410. [DOI] [PMC free article] [PubMed] [Google Scholar]
- [4].Porporato PE, Filigheddu N, Pedro JMB, et al. Mitochondrial metabolism and cancer. Cell Res. 2018. Mar;28(3):265–280. [DOI] [PMC free article] [PubMed] [Google Scholar]
- [5].Vasan K, Werner M, Chandel NS. Mitochondrial metabolism as a target for cancer therapy. Cell Metab. 2020 Sep 1; 32(3):341–352. [DOI] [PMC free article] [PubMed] [Google Scholar]
- [6].Hopkins JF, Sabelnykova VY, Weischenfeldt J, et al. Mitochondrial mutations drive prostate cancer aggression. Nat Commun. 2017 Sep 22 8(1):656. [DOI] [PMC free article] [PubMed] [Google Scholar]
- [7].Schopf B, Weissensteiner H, Schafer G, et al. OXPHOS remodeling in high-grade prostate cancer involves mtDNA mutations and increased succinate oxidation. Nat Commun. 2020 Mar 20 11(1):1487. [DOI] [PMC free article] [PubMed] [Google Scholar]
- [8].Hu J, Locasale JW, Bielas JH, et al. Heterogeneity of tumor-induced gene expression changes in the human metabolic network. Nat Biotechnol. 2013. Jun;31(6):522–529. [DOI] [PMC free article] [PubMed] [Google Scholar]
- [9].Roesch A, Vultur A, Bogeski I, et al. Overcoming intrinsic multidrug resistance in melanoma by blocking the mitochondrial respiratory chain of slow-cycling JARID1B(high) cells. Cancer Cell. 2013 Jun 10 23(6):811–825. [DOI] [PMC free article] [PubMed] [Google Scholar]
- [10].Eidelman E, Twum-Ampofo J, Ansari J, et al. The metabolic phenotype of prostate cancer. Front Oncol. 2017;7:131. [DOI] [PMC free article] [PubMed] [Google Scholar]
- [11].Birsoy K, Wang T, Chen WW, et al. An essential role of the mitochondrial electron transport chain in cell proliferation is to enable aspartate synthesis. Cell. 2015 Jul 30 162(3):540–551. [DOI] [PMC free article] [PubMed] [Google Scholar]
- [12].Martinez-Reyes I, Cardona LR, Kong H, et al. Mitochondrial ubiquinol oxidation is necessary for tumour growth. Nature. 2020. Sep;585(7824):288–292. [DOI] [PMC free article] [PubMed] [Google Scholar]
- [13].Rosario SR, Long MD, Affronti HC, et al. Pan-cancer analysis of transcriptional metabolic dysregulation using the cancer genome atlas. Nat Commun. 2018. [2018 Dec 14];9(1):5330. [DOI] [PMC free article] [PubMed] [Google Scholar]
- [14].Koppenol WH, Bounds PL, Dang CV. Otto Warburg’s contributions to current concepts of cancer metabolism. Nat Rev Cancer. 2011. May;11(5):325–337. [DOI] [PubMed] [Google Scholar]
- [15].Levine AJ, Puzio-Kuter AM. The control of the metabolic switch in cancers by oncogenes and tumor suppressor genes. Science. 2010 Dec 3; 330(6009):1340–1344. [DOI] [PubMed] [Google Scholar]
- [16].Walker JE. The ATP synthase: the understood, the uncertain and the unknown. Biochem Soc Trans. 2013 Feb 1; 41(1):1–16. [DOI] [PubMed] [Google Scholar]
- [17].Srivastava AP, Luo M, Zhou W, et al. High-resolution cryo-EM analysis of the yeast ATP synthase in a lipid membrane. Science. 2018;360(6389). DOI: 10.1126/science.aas9699. [DOI] [PMC free article] [PubMed] [Google Scholar]
- [18].Xu T, Pagadala V, Mueller DM. Understanding structure, function, and mutations in the mitochondrial ATP synthase. Microb Cell. 2015 Apr 1; 2(4):105–125. [DOI] [PMC free article] [PubMed] [Google Scholar]
- [19].Stock D, Gibbons C, Arechaga I, et al. The rotary mechanism of ATP synthase. Curr Opin Struct Biol. 2000;10(6):672–679. [DOI] [PubMed] [Google Scholar]
- [20].Abrahams JP, Leslie AGW, Lutter R, et al. Structure at 2.8 Å resolution of F1-ATPase from bovine heart mitochondria. Nature. 1994;370:621–628. [DOI] [PubMed] [Google Scholar]
- [21].Kabaleeswaran V, Puri N, Walker JE, et al. Novel features of the rotary catalytic mechanism revealed in the structure of yeast F1 ATPase. Embo J. 2006 Nov 15 25(22):5433–5442. [DOI] [PMC free article] [PubMed] [Google Scholar]
- [22].Boreikaite V, Wicky BIM, Watt IN, et al. Extrinsic conditions influence the self-association and structure of IF1, the regulatory protein of mitochondrial ATP synthase. Proc Natl Acad Sci U S A. 2019 May 21 116(21):10354–10359. [DOI] [PMC free article] [PubMed] [Google Scholar]
- [23].Campanella M, Casswell E, Chong S, et al. Regulation of mitochondrial structure and function by the F1Fo-ATPase inhibitor protein, IF1. Cell Metab. 2008. Jul;8(1):13–25. [DOI] [PubMed] [Google Scholar]
- [24].Cabezon E, Montgomery MG, Leslie AG, et al. The structure of bovine F1-ATPase in complex with its regulatory protein IF1. Nat Struct Biol. 2003. Sep;10(9):744–750. [DOI] [PubMed] [Google Scholar]
- [25].Fantin VR, St-Pierre J, Leder P. Attenuation of LDH-A expression uncovers a link between glycolysis, mitochondrial physiology, and tumor maintenance. Cancer Cell. 2006. Jun;9(6):425–434. [DOI] [PubMed] [Google Scholar]
- [26].Moreno-Sanchez R, Rodriguez-Enriquez S, Marin-Hernandez A, et al. Energy metabolism in tumor cells. FEBS J. 2007. Mar;274(6):1393–1418. [DOI] [PubMed] [Google Scholar]
- [27].Zhou Y, Tozzi F, Chen J, et al. Intracellular ATP levels are a pivotal determinant of chemoresistance in colon cancer cells. Cancer Res. 2012 Jan 1 72(1):304–314. [DOI] [PMC free article] [PubMed] [Google Scholar]
- [28].Pellegatti P, Raffaghello L, Bianchi G, et al. Increased level of extracellular ATP at tumor sites: in vivo imaging with plasma membrane luciferase. PLoS One. 2008 Jul 9 3(7):e2599. [DOI] [PMC free article] [PubMed] [Google Scholar]
- [29].Mahajan K, Mahajan NP. Shepherding AKT and androgen receptor by Ack1 tyrosine kinase. J Cell Physiol. 2010. Aug;224(2):327–333. [DOI] [PMC free article] [PubMed] [Google Scholar]
- [30].Thaker YR, Recino A, Raab M, et al. Activated Cdc42-associated kinase 1 (ACK1) binds the sterile alpha motif (SAM) domain of the adaptor SLP-76 and phosphorylates proximal tyrosines. J Biol Chem. 2017 Apr 14 292(15):6281–6290. [DOI] [PMC free article] [PubMed] [Google Scholar]
- [31].Mahajan K, Challa S, Coppola D, et al. Effect of Ack1 tyrosine kinase inhibitor on ligand-independent androgen receptor activity. Prostate. 2010 Sep 1 70(12):1274–1285. [DOI] [PMC free article] [PubMed] [Google Scholar]
- [32].Mahajan K, Mahajan NP. ACK1/TNK2 tyrosine kinase: molecular signaling and evolving role in cancers. Oncogene. 2015 Aug 6; 34(32):4162–4167. [DOI] [PMC free article] [PubMed] [Google Scholar]
- [33].Mahajan K, Malla P, Lawrence HR, et al. ACK1/TNK2 regulates histone H4 Tyr88-phosphorylation and AR gene expression in castration-resistant prostate cancer. Cancer Cell. 2017 Jun 12 31(6):790–803 e8. [DOI] [PMC free article] [PubMed] [Google Scholar]
- [34].Wu X, Zahari MS, Renuse S, et al. The non-receptor tyrosine kinase TNK2/ACK1 is a novel therapeutic target in triple negative breast cancer. Oncotarget. 2017 Jan 10 8(2):2971–2983. [DOI] [PMC free article] [PubMed] [Google Scholar]
- [35].van der Horst EH, Degenhardt YY, Strelow A, et al. Metastatic properties and genomic amplification of the tyrosine kinase gene ACK1. Proc Natl Acad Sci USA. 2005 Nov 1 102(44):15901–15906. [DOI] [PMC free article] [PubMed] [Google Scholar]
- [36].Mahajan K, Coppola D, Chen YA, et al. Ack1 tyrosine kinase activation correlates with pancreatic cancer progression. Am J Pathol. 2012. Apr;180(4):1386–1393. [DOI] [PMC free article] [PubMed] [Google Scholar]
- [37].Mahajan K, Coppola D, Challa S, et al. Ack1 mediated AKT/PKB tyrosine 176 phosphorylation regulates its activation. PLoS One. 2010 Mar 19 5(3):e9646. [DOI] [PMC free article] [PubMed] [Google Scholar]
- [38].Maxson JE, Gotlib J, Pollyea DA, et al. Oncogenic CSF3R mutations in chronic neutrophilic leukemia and atypical CML. N Engl J Med. 2013 May 9 368(19):1781–1790. [DOI] [PMC free article] [PubMed] [Google Scholar]
- [39].Jenkins C, Luty SB, Maxson JE, et al. Synthetic lethality of TNK2 inhibition in PTPN11-mutant leukemia. Sci Signal. 2018 Jul 17;11(539). [DOI] [PMC free article] [PubMed] [Google Scholar]
- [40].Buchwald M, Pietschmann K, Brand P, et al. SIAH ubiquitin ligases target the nonreceptor tyrosine kinase ACK1 for ubiquitinylation and proteasomal degradation. Oncogene. 2013 Oct 10 32(41):4913–4920. [DOI] [PMC free article] [PubMed] [Google Scholar]
- [41].Mahendrarajah N, Borisova ME, Reichardt S, et al. HSP90 is necessary for the ACK1-dependent phosphorylation of STAT1 and STAT3. Cell Signal. 2017. Nov;39:9–17. [DOI] [PubMed] [Google Scholar]
- [42].Mahajan NP, Coppola D, Kim J, et al. Blockade of ACK1/TNK2 to squelch the survival of prostate cancer stem-like cells. Sci Rep. 2018 Jan 31 8(1):1954. [DOI] [PMC free article] [PubMed] [Google Scholar]
- [43].Mahajan NP, Liu Y, Majumder S, et al. Activated Cdc42-associated kinase Ack1 promotes prostate cancer progression via androgen receptor tyrosine phosphorylation. Proc Natl Acad Sci USA. 2007 May 15 104(20):8438–8443. [DOI] [PMC free article] [PubMed] [Google Scholar]
- [44].Mahajan K, Fang B, Koomen JM, et al. H2B Tyr37 phosphorylation suppresses expression of replication-dependent core histone genes. Nat Struct Mol Biol. 2012. Sep;19(9):930–937. [DOI] [PMC free article] [PubMed] [Google Scholar]
- [45].Pullman ME. Purification and properties of the ATPase inhibitor from bovine heart mitochondria. Methods Enzymol. 1986;126:460–470. [DOI] [PubMed] [Google Scholar]
- [46].Cabezon E, Butler PJ, Runswick MJ, et al. Modulation of the oligomerization state of the bovine F1-ATPase inhibitor protein, IF1, by pH. J Biol Chem. 2000 Aug 18 275(33):25460–25464. [DOI] [PubMed] [Google Scholar]
- [47].Cabezon E, Runswick MJ, Leslie AG, et al. The structure of bovine IF(1), the regulatory subunit of mitochondrial F-ATPase. EMBO J. 2001 Dec 17 20(24):6990–6996. [DOI] [PMC free article] [PubMed] [Google Scholar]
- [48].Pullman ME, Monroy GC. A naturally occurring inhibitor of mitochondrial adenosine triphosphatase. J Biol Chem. 1963. Nov;238:3762–3769. [PubMed] [Google Scholar]
- [49].Gu J, Zhang L, Zong S, et al. Cryo-EM structure of the mammalian ATP synthase tetramer bound with inhibitory protein IF1. Science. 2019 Jun 14 364(6445):1068–1075. [DOI] [PubMed] [Google Scholar]
- [50].Sreedhar A, Aguilera-Aguirre L, Singh KK. Mitochondria in skin health, aging, and disease. Cell Death Dis. 2020 Jun 9; 11(6):444. [DOI] [PMC free article] [PubMed] [Google Scholar]
- [51].Pustylnikov S, Costabile F, Beghi S, et al. Targeting mitochondria in cancer: current concepts and immunotherapy approaches. Transl Res. 2018. Dec;202:35–51. [DOI] [PMC free article] [PubMed] [Google Scholar]
- [52].Mahajan NP, Whang YE, Mohler JL, et al. Activated tyrosine kinase Ack1 promotes prostate tumorigenesis: role of Ack1 in polyubiquitination of tumor suppressor Wwox. Cancer Res. 2005 Nov 15 65(22):10514–10523. [DOI] [PubMed] [Google Scholar]
- [53].Anderson GR, Wardell SE, Cakir M, et al. Dysregulation of mitochondrial dynamics proteins are a targetable feature of human tumors. Nat Commun. 2018 Apr 26 9(1):1677. [DOI] [PMC free article] [PubMed] [Google Scholar]
- [54].Ni HM, Williams JA, Ding WX. Mitochondrial dynamics and mitochondrial quality control. Redox Biol. 2015;4:6–13. [DOI] [PMC free article] [PubMed] [Google Scholar]
- [55].Galluzzi L, Baehrecke EH, Ballabio A, et al. Molecular definitions of autophagy and related processes. EMBO J. 2017 Jul 3 36(13):1811–1836. [DOI] [PMC free article] [PubMed] [Google Scholar]
- [56].Heckmann BL, Yang X, Zhang X, et al. The autophagic inhibitor 3-methyladenine potently stimulates PKA-dependent lipolysis in adipocytes. Br J Pharmacol. 2013. Jan;168(1):163–171. [DOI] [PMC free article] [PubMed] [Google Scholar]
- [57].Patoli D, Mignotte F, Deckert V, et al. Inhibition of mitophagy drives macrophage activation and antibacterial defense during sepsis. J Clin Invest. 2020 Nov 2 130(11):5858–5874. [DOI] [PMC free article] [PubMed] [Google Scholar]
- [58].Bordt EA, Clerc P, Roelofs BA, et al. The putative Drp1 Inhibitor mdivi-1 is a reversible mitochondrial complex I inhibitor that modulates reactive oxygen species. Dev Cell. 2017 Mar 27 40(6):583–594.e6. [DOI] [PMC free article] [PubMed] [Google Scholar]
- [59].Sawant M, Mahajan K, Renganathan A, et al. Chronologically modified androgen receptor in recurrent castration resistant prostate cancer and its therapeutic targeting. Sci Transl Med. 2022;14:In press [DOI] [PMC free article] [PubMed] [Google Scholar]
- [60].Heinz S, Freyberger A, Lawrenz B, et al. Mechanistic investigations of the mitochondrial complex I inhibitor rotenone in the context of pharmacological and safety evaluation. Sci Rep. 2017 Apr 4;7:45465. [DOI] [PMC free article] [PubMed] [Google Scholar]
- [61].He K, Hu H, Ye S, et al. The effect of metformin therapy on incidence and prognosis in prostate cancer: a systematic review and meta-analysis. Sci Rep. 2019 Feb 18 9(1):2218. [DOI] [PMC free article] [PubMed] [Google Scholar]
- [62].Carpenter EL, Chagani S, Nelson D, et al. Mitochondrial complex I inhibitor deguelin induces metabolic reprogramming and sensitizes vemurafenib-resistant BRAF(V600E) mutation bearing metastatic melanoma cells. Mol Carcinog. 2019. Sep;58(9):1680–1690. [DOI] [PMC free article] [PubMed] [Google Scholar]
- [63].Naguib A, Mathew G, Reczek CR, et al. Mitochondrial complex I inhibitors expose a vulnerability for selective killing of pten-null cells. Cell Rep. 2018 Apr 3 23(1):58–67. [DOI] [PMC free article] [PubMed] [Google Scholar]
- [64].Shi Y, Lim SK, Liang Q, et al. Gboxin is an oxidative phosphorylation inhibitor that targets glioblastoma. Nature. 2019. [2019 Mar 01];567(7748):341–346. [DOI] [PMC free article] [PubMed] [Google Scholar]
- [65].Samantaray S, Knaryan VH, Guyton MK, et al. The parkinsonian neurotoxin rotenone activates calpain and caspase-3 leading to motoneuron degeneration in spinal cord of Lewis rats. Neuroscience. 2007 May 11 146(2):741–755. [DOI] [PMC free article] [PubMed] [Google Scholar]
- [66].Yu H, Zhong X, Gao P, et al. The potential effect of metformin on cancer: an umbrella review. Front Endocrinol (Lausanne). 2019;10:617. [DOI] [PMC free article] [PubMed] [Google Scholar]
- [67].LaMoia TE, Shulman GI. Cellular and molecular mechanisms of metformin action. Endocr Rev. 2020 Sep 8;42(1):77–96. [DOI] [PMC free article] [PubMed] [Google Scholar]
- [68].Zaidi S, Gandhi J, Joshi G, et al. The anticancer potential of metformin on prostate cancer. Prostate Cancer Prostatic Dis. 2019. Sep;22(3):351–361. [DOI] [PubMed] [Google Scholar]
- [69].Whitburn J, Edwards CM, Sooriakumaran P. Metformin and prostate cancer: a new role for an old drug. Curr Urol Rep. 2017. Jun;18(6):46. [DOI] [PMC free article] [PubMed] [Google Scholar]
- [70].Vashisht Gopal YN, Gammon S, Prasad R, et al. A novel mitochondrial inhibitor blocks MAPK pathway and overcomes MAPK inhibitor resistance in melanoma. Clin Cancer Res. 2019 Nov 1 25(21):6429–6442. [DOI] [PMC free article] [PubMed] [Google Scholar]
- [71].Singh S, Chouhan S, Mohammad N, et al. Resistin causes G1 arrest in colon cancer cells through upregulation of SOCS3. FEBS Lett. 2017. May;591(10):1371–1382. [DOI] [PubMed] [Google Scholar]
- [72].Chouhan S, Singh S, Athavale D, et al. Sensitization of hepatocellular carcinoma cells towards doxorubicin and sorafenib is facilitated by glucosedependent alterations in reactive oxygen species, P-glycoprotein and DKK4. J Biosci. 2020;45:45. [PubMed] [Google Scholar]
- [73].Kumari R, Chouhan S, Singh S, et al. Constitutively activated ERK sensitizes cancer cells to doxorubicin: involvement of p53-EGFR-ERK pathway. J Biosci. 2017. Mar;42(1):31–41. [DOI] [PubMed] [Google Scholar]
- [74].Chouhan S, Singh S, Athavale D, et al. Glucose induced activation of canonical Wnt signaling pathway in hepatocellular carcinoma is regulated by DKK4. Sci Rep. 2016 Jun 8;6:27558. [DOI] [PMC free article] [PubMed] [Google Scholar]
- [75].Malvi P, Chaube B, Singh SV, et al. Elevated circulatory levels of leptin and resistin impair therapeutic efficacy of dacarbazine in melanoma under obese state. Cancer Metab. 2018;6:2. [DOI] [PMC free article] [PubMed] [Google Scholar]
- [76].DeLano WL. The PyMOL molecular graphics system. San Carlos: Delano Scientific; 2002. [Google Scholar]
- [77].ULC CCG . Molecular Operating Environment (MOE). 2021.
- [78].Hoofnagle AN, Whiteaker JR, Carr SA, et al. Recommendations for the generation, quantification, storage, and handling of peptides used for mass spectrometry-based assays. Clin Chem. 2016. Jan;62(1):48–69. [DOI] [PMC free article] [PubMed] [Google Scholar]
- [79].Peterson AC, Russell JD, Bailey DJ, et al. Parallel reaction monitoring for high resolution and high mass accuracy quantitative, targeted proteomics. Mol Cell Proteomics. 2012. Nov;11(11):1475–1488. [DOI] [PMC free article] [PubMed] [Google Scholar]
- [80].Carr SA, Abbatiello SE, Ackermann BL, et al. Targeted peptide measurements in biology and medicine: best practices for mass spectrometry-based assay development using a fit-for-purpose approach. Mol Cell Proteomics. 2014. Mar;13(3):907–917. [DOI] [PMC free article] [PubMed] [Google Scholar]
Associated Data
This section collects any data citations, data availability statements, or supplementary materials included in this article.