

Abstract
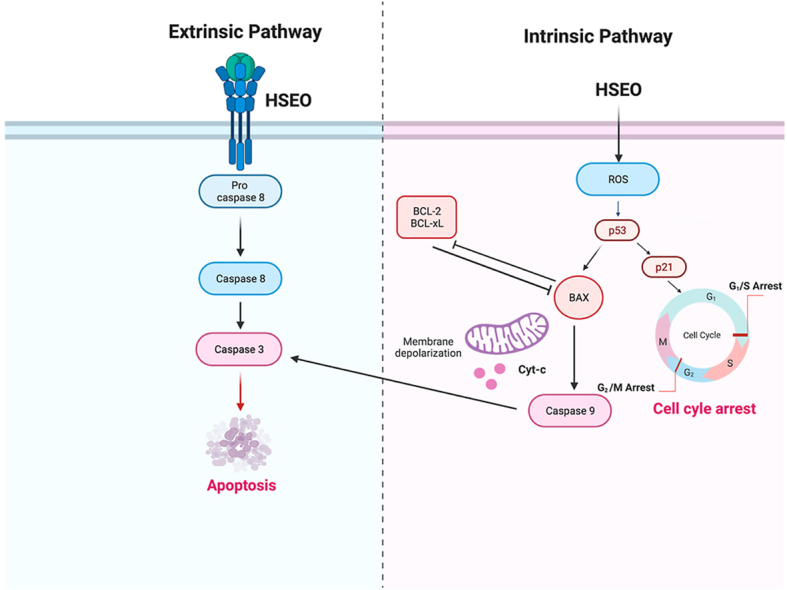
Hedychium spicatum is an essential oil bearing plant extensively used in the traditional system of medicine in several countries. Previous research has revealed H. spicatum essential oil (HSEO) to exhibit anti-tumor activity, although the mechanism of action is still unknown. Therefore, the current study was designed to carry out a comprehensive characterization of HSEO and evaluate the chemotherapeutic potential of HSEO against cancerous cells. The volatile constituents of HSEO was determined by one-dimensional gas chromatography with time-of-flight mass spectrometry (GC-TOFMS) and two-dimensional gas chromatography with time-of-flight mass spectrometry (GCxGC-TOFMS). In total, 193 phytocompounds could be detected, out of which 140 were identified for the first time. The major phytoconstituents detected by GCxGC-TOFMS were β-pinene (10.94%), eucalyptol (6.45%), sabinene (5.48%) and trans-isolimonene (5.00%). GCxGC-TOFMS analysis showed two and half fold increase in the constituents over GC-TOFMS due to better chromatographic separation of constituents in the 2nd dimensional column. HSEO was tested for in vitro cytotoxic activity against cancerous (PC-3, HCT-116 and A-549) and normal (3T3-L1) cell, with HSEO being most selective for prostate cancer cell (PC-3) over non-tumorigenic fibroblast (3T3-L1) cell. HSEO treatment inhibited the colony formation ability of PC-3 cells. HSEO treatment caused apoptotic cell death and cell cycle arrest at G2/M and S phase in PC-3 cells. HSEO induced apoptosis via intracellular ROS accumulation, mitochondria depolarization and increased caspase-3, 8, and 9 levels in PC-3 cells. Additionally, HSEO treatment led to a decrease of Bcl-2 and Bcl-xL and increase of Bax and Bak protein levels. Overall, results from this study highlighted the anticancer potential of H. spicatum essential oil, which could be considered as a new agent for treating prostate cancer.
Keywords: Anticancer activity, GCxGC-TOFMS, H. spicatum essential oil, Prostate cancer
Graphical abstract
1. Introduction
Globally cancer remains to be a serious life threatening disease with a higher fatality rate, followed by cardiovascular disorders [1]. Recent clinical study suggest that there will be an increase in the number of cancer related cases from 1.41 crore in 2012 to over 2.5 crore in 2035 [2]. Conventional cancer therapies involving the use of synthetic drugs in surgery, radiation and chemotherapy are used as management strategy for curing cancer patients. However, concerns like multidrug resistance, therapeutic efficacy, solubility, undesirable side effects, and low bioavailability are the biggest drawbacks to conventional chemotherapeutic treatment of cancer. There is an urgent need to search for promising antitumor drugs with lower side effects.
Recently, natural products derived from plants are the primary source for anticancer agents as they exhibit high efficacy and minimal toxicity. Many chemotherapeutic drugs derived from natural compounds such as taxol, podophyllotoxin, camptothecin, and doxorubicin have been widely employed in clinical trials. Essential oils and their phytoconstituents have been employed in cancer related therapy due to their well-documented anti-cancerous properties [3,4].
Hedychium spicatum Buch. Ham. ex D. Don. (Zingiberaceae) also known as spiked ginger lily, is a rhizomatous aromatic herb with broad distribution in central Himalaya, Eastern India, and hills of South India. The essential oil found in the H. spicatum rhizomes is usually considered to be responsible for its therapeutic properties. H. spicatum is widely used in several preparations of Chinese, Tibetan and Indian traditional system of medicine [5]. Previously, several authors have been documented on the chemical profile of Hedychium spicatum essential oil from various sources [[6], [7], [8], [9]], however a comprehensive fingerprint of its essential oil is still lacking. H. spicatum rhizomes has wide-ranging empirical uses such as to treat asthma, internal injury and tuberculosis [10]. The rhizome decoction is used to relieve flatulence and promote menstrual discharge. Ethnobotanical studies indicate that the powdered rhizome of H. spicatum is used widely to treat several ailments such as liver complaints, fever, dyspepsia, diarrhoea, inflammation and snake bite [10]. The rhizome essential oil also possesses antihelminthic, antimicrobial, pediculicidal and tranquillising properties [[11], [12], [13], [14]].
Several compounds isolated from genus Hedychium, such as coronarin-D have been shown to treat cancer [15]. The rhizomes of H. spicatum comprises of diverse secondary metabolites belonging to different classes such as diterpenes, flavonoid, phytosterols and sesquiterpenes [10]. Hedychium spicatum essential oils have recently been found to contain dominant volatile constituents like 1,8-cineole, eudesmol, cubenol, spathulenol, and α-cadinol, which displayed anti-tumor effects against lung, colon, breast, head and neck, and cervical cancer cells [8]. Few pharmacological reports investigating the anticancer activity of Hedychium spicatum essential oil have been reported so far, and an underlying molecular and cellular mechanism of its anticancer activity is still lacking.
Therefore, the current research was carried out to provide a deep insight into the chemical profile of H. spicatum essential oil and to evaluate the anti-proliferative effect of H. spicatum essential oil on various human cancer cell lines. As H. spicatum essential oil showed considerable anti-proliferative effect in prostate cancer (PC-3) cell, a detailed investigation was undertaken to understand the molecular mechanism of apoptosis caused by H. spicatum essential oil in PC-3 cancer cells.
2. Material and methods
2.1. Extraction of essential oil
Collection of fresh rhizomes of H. spicatum were made from Kalimpong, India (N 27.06834, E 88.46508) in the month of October, 2020 at its flowering stage. The plant was authenticated by Prof. P.C. Panda, Taxonomist, Centre for Biotechnology, Siksha O Anusandhan (Deemed to be University). Voucher specimen of plant (3120/CBT) was deposited in the herbarium of Centre for Biotechnology, Siksha O Anusandhan (Deemed to be University). The essential oil was isolated from shade dried rhizome powder (200 g) over a period of 4 h according to the hydrodistillation method reported in the European Pharmacopoeia [16] until no more essential oil was recovered. Further, anhydrous Na2SO4 was used to remove water traces from the isolated essential oil and was kept at 4 °C.
2.2. GC-TOFMS and GCxGC-TOFMS analysis
GC-TOFMS analysis of HSEO was done on a Agilent 7890 Gas chromatograph equipped with Pegasus HT GC-TOFMS. A non-polar Rxi-5Sil MS column (30 m × 0.25 mm × 0.25 μm) was used for separation. A volume of 0.1 μL neat essential oil was injected into system in split mode (1:100). The initial temperature of the first dimension column was programmed for 1 min at 60 °C, raised to 270 °C at 5 °C/min and then held for 4 min. Helium (99.999%) at a linear velocity of 1 ml/min was used. The injector and transfer line temperature were programmed at 290 and 280 °C, respectively. The electron ionisation (EI) was set at 70 eV with a mass scan range of 50–600 amu.
GCxGC-TOFMS analysis was performed on same gas chromatograph equipped by a two stage cryogenic modulator. The primary column and oven conditions was same as that used in GC-TOFMS analysis. The secondary column used was Rxi-17Sil MS (2 m × 0.25 mm × 0.25 μm). The secondary oven and modulator temperature was set at 15 °C offset to the primary oven. Different modulation periods (2, 4, 6 and 8 s) were tried. The modulation time was 4 s, with an interval of 1 s hot pulse. The spectral acquisition rate was 100 spectra/s.
Compound identification was accomplished by comparing the identified compounds spectra of with the mass spectral database (NIST 11). Additional confirmation was performed by measuring the linear temperature programmed retention index (LTPRI) obtained using n-alkane (C8–C40) with that of LTPRI values found in the literature [17].
2.3. Cell culture conditions
The human A-549 (human alveolar adenocarcinoma), PC-3 (human prostate carcinoma), HCT-116 (human colorectal carcinoma), and 3T3-L1 (mouse embryo fibroblast) cells were obtained from NCCS, Pune. A-549 cells was grown in RPMI-1640 medium, while PC-3, HCT-116 and 3T3-L1 cells were cultured in DMEM high glucose medium supplemented with FBS (10%), penicillin G (1%) and streptomycin (5000 U/mL) in a CO2 incubator.
2.4. Cytotoxicity assay
The antiproliferative effect of HSEO was assessed by the MTT assay against A-549, PC-3, HCT-116 and 3T3-L1 cells. Briefly, A-549, PC-3, HCT-116 and 3T3-L1 cells were harvested and seeded at 1 × 10⁴ cells per well in the cultured plate for 24 h. After incubation, H. spicatum essential oil (0–200 μg/ml) was added and kept for 24 h. The spent media was discarded and 50 μl of MTT reagent was added and allowed to stand for additional 3 h. The insoluble crystals was dissolved in DMSO and the absorbance of solution was determined using a microplate reader at 570 nm. The percentage of cell viability (%) was measured as:
| % Cell viability = [(Optical density570 nm of sample/Optical density570 nm of control)* | 100] |
2.5. Acridine orange and ethidium bromide dual staining assay
The morphological observation of PC-3 cells by fluorescence microscopy was done following the methodology of previous researcher [18]. Briefly, PC-3 cells were grown in six well plate and treated with HSEO (20 and 40 μg/ml) for 24 h. After incubation, the treated cells were removed by trypsinization, centrifuged and washed in PBS. Fluorescent dyes, ethidium bromide (100 μg/ml) and acridine orange (100 μg/ml) were added and the cells were incubated for 10 min at 37 °C in the dark. Cells were examined and imaged under the fluorescence microscope.
2.6. Annexin-V-FITC/PI assay
The proportion of cells that underwent apoptosis after treatment with HSEO was measured using Annexin-V-FITC/PI assay. Briefly, PC-3 cells were treated with HSEO (20 and 40 μg/ml) and control and incubated for 24 h. The cells were trypsinized, rinsed and resuspended in buffer. After that the cells were stained with PI followed by addition of FITC-labelled Annexin-V in the dark for 15 min. The proportion of late apoptotic, early apoptotic, viable and necrotic cells were measured by a flow cytometry.
2.7. JC-1 mitochondrial membrane potential assay
JC-1 assay was performed using BD MitoScreen Kit (BD Pharmingen, USA) according to the supplier protocol. Briefly, PC-3 cells were grown in culture dish at a density of 2 × 10⁵ cells/well. Then, the cells were exposed to control and HSEO (20 and 40 μg/ml) for another 24 h. After incubation, cells were harvested and JC-1 reagent (100 ng/ml) was added and kept for 15 min. Then, it was subjected for flow cytometry analysis.
2.8. Cell cycle analysis
PC-3 cell were seeded in culture plates and treated with HSEO (20 and 40 μg/ml) for 24 h. After treatment, media was removed. Then the cells were rinsed in PBS, trypsinized and fixed in 70% EtOH for 12 h. The cells were centrifuged and the cell pellet was rinsed with PBS and incubated with RNase (100 μg/ml) followed by staining with propidium iodide (PI) for 15 min. Fluorescence of treated cells was evaluated using flow cytometer. The percentages of cell populations in different cell phase were determined using CellQuest 3.3 software.
2.9. Intracellular reactive oxygen species (ROS) assay
The level of ROS was analyzed using 2′,7′-dichlorofluorescin diacetate (DCF-DA) as substrate. PC-3 cells (2 × 10⁵ cells/well) were grown in cell culture dish for 24 h and then incubated with 5 μM DCF-DA and treated without (control) or with HSEO (20 and 40 μg/ml). The cells were collected and rinsed with cold PBS. The ROS levels was measured from DCF fluorescence intensity using a flow cytometer. The cells were seeded on coverslips put onto cell culture plate for imaging detection of intracellular ROS. PC-3 cells were stimulated under the same circumstances as flow cytometry. The cells were treated with a 5 μM DCF-DA solution, washed and was viewed under a fluorescent microscope.
2.10. Clonogenic assay
Colony formation potential of HSEO on PC-3 cells was examined using clonogenic assay. Initially, the cultured PC-3 cells were treated with control and H. spicatum essential oil (20 and 40 μg/ml). They were incubated until colonies were formed and were subsequently fixed with methanol and acetic acid (3:1) followed by staining with crystal violet (0.5%). The colonies were determined using an inverted microscope (Primovert, Carl Zeiss, NY, United States). Colonies were measured as a percentage of the control (untreated) colonies.
2.11. Terminal deoxynucleotidyl transferase-mediated dUTP nick end labeling (TUNEL) assay
Apoptosis was measured by APO-DIRECT assay kit (BD Biosciences). Briefly, cultured PC-3 cells were exposed to control and different concentration of HSEO (20 and 40 μg/ml). Subsequently, the PC-3 cells were rinsed and fixed in 1% paraformaldehyde. Then the cells were centrifuged, rinsed and resuspended in 70% (v/v) chilled ethanol. Subsequently, DNA labelling solution was added and kept overnight. After incubation, add rinse buffer to the cells and centrifuge. Discard the supernatant and resuspend the cell pellet in PI/RNase staining buffer followed by measurement using a flow cytometer.
2.12. Caspase-3, 8 and 9 activity determination by flow cytometry
Briefly, PC-3 cells (1 × 10⁵ cells/well) were grown in cell culture plates for 24 h at 37 °C. Then the cells were treated with different amounts of HSEO (20 and 40 μg/ml) and control and incubated for another 24 h. Then the cells were centrifuged and to the supernatant 50 μl of 10 μM substrate solution (PhiPhiLux-G1D1, CaspaLux 8-L1D2, CaspaLux 9-M1D2 for caspase-3, 8 and 9, respectively) was added and kept for 2 h. Then the cells were rinsed in PBS and the caspase activity was determined by flow cytometer.
2.13. RNA extraction and quantitative real-time PCR analysis
PC-3 cells were treated with control and H. spicatum essential oil (20 and 40 μg/ml). The RNA extraction was carried out using Qiagen RNeasy kit (Hilden, Germany). The IScript cDNA synthesis kit (Biorad) was used to carry out reverse-transcription of RNA into cDNA. PCR amplification was performed using following gene specific primers:
Bcl-2, forward: (5′-CTGGTGAACATCGC-3′) and reverse: (5′-GGAGAAATCAAACAGAG G-3′); Bax, forward: (5′-TGGCAGCTGACATGTTTTCTGAC-3′) and reverse: (5′-TCACCC AACCACCCTGGTCTT-3′); p53 forward: (5′-CCCCTCCTGGCCCCTGTCATCT TC-3′) and reverse: (5′-GCAGCGCCTCACAACCTCCGTCAT-3′); p21 forward: (5′-CATGTGG ACCTGTCACTGTCTTGTA-3′) and reverse: (5′-GAAGATCAGCCGGCGTTTG-3′); Bcl-xL forward: (5′-TCCTTGTCTACGCTTTCCACG-3′) and reverse: (5′-GGTCGCATTGTGG CCTTT-3′); Bak forward: (5′-GCGCAGGCCATCACGAGAGA-3′) and reverse: (5′-CCGG CCCCAGTTAATGCCGC-3′) and β-actin, forward: (5′-ATCTGGCACCACACCTTCT A-3′) and reverse: (5′-CGTCATACTCCTGCTTGCTG-3′).
PCR analysis was performed in a Qiagen Rotor Gene Q 5plex HRM using SYBR green fluorescent dye under the following conditions: 95 °C for 5 min, then 40 cycles at 95 °C for 5 s, 60 °C for 30 s, and finally extension at 72 °C for 20 s. Cycle threshold (Ct) was detected, and the average Ct values was measured. The expression of each gene was measured and normalized using 2−ΔΔCt method relative to housekeeping gene β-actin of the same sample. Each assay was performed in triplicates.
2.14. Statistical analysis
Data expressed are represented as mean ± SD (n = 3). One-way analysis of variance (ANOVA) followed by Tukey test was used to compare difference between groups.
3. Results and discussion
3.1. Comprehensive characterization of HSEO
The essential oil obtained from H. spicatum rhizomes was pale yellow in color with an oil yield of 0.45% (v/w) on fresh weight basis. The result is similar to the study by Mishra et al. (2016) who have reported an essential oil yield of 0.24–0.53% in H. spicatum fresh rhizomes collected from various locations of Himalayas. The H. spicatum essential oil was initially analyzed by GC-TOFMS analysis. The chromatogram resulting out of GC-TOFMS analysis showed many coelutions, as a result of which few compounds could be identified. Out of several peaks detected, only 78 constituents could be identified comprising of following chemical class: alkanes, ketones, monoterpenes, sesquiterpenes and furans. Many compounds were not detected in the GC-TOFMS due to the presence of co-eluting peaks. As a result, the GCxGC-TOFMS approach was employed to get a detailed characterization of the HSEO. The thermal modulation used in the GCxGC system resulted in an increased peak capacity and improved sensitivity [19].
Automated peak processing of ChromaTOF software was used to detect the peaks in GCxGC chromatogram. Peaks with a minimum signal to noise (S/N) ratio threshold greater than 100 were only considered. The compounds were detected in 1st dimensional range of 335–2680 s and in 2nd dimensional range of 0.59–1.99 s. Compounds corresponding to those are presented in Table 1. A total of 193 compounds were nearly identified using combination of the NIST mass spectral similarity and LTPRI values. A maximum linear programmed retention index difference (LTPRIexp -LTPRIlit) of ±16 units was obtained. These 193 compounds were classified into various chemical classes that include 3 alcohols, 6 aldehydes, 3 alkanes, 7 ketones, 71 monoterpenes, 98 sesquiterpenes, 2 furans, 2 fatty acids and 1 diterpenes. Therefore, the majority of the components found in the H. spicatum essential oil were terpene compounds. Out of 193 constituents detected by GCxGC-TOFMS, 140 compounds were identified for the first time in the HSEO. GCxGC-TOFMS analyses revealed that the HSEO is composed mainly of monoterpenes such as β-pinene (10.94%), eucalyptol (6.45%), sabinene (5.48%), trans-isolimonene (5.00%), trans-sabinene hydrate (4.33%) terpinolene (4.24%) and linalool (4.24%). Other predominant constituents present in HSEO were trans-meta-mentha-2,8-diene (3.50%), α-muurolene (3.07%), pinocarvone (3.03%), myrtenal (2.91%), α-pinene (2.62%) and cis-sabinene hydrate (2.47%).
Table 1.
Chemical constituents identified in the H. spicatum rhizome essential oil using GC-TOFMS and GCxGC-TOFMS analysis.
| S.No | t1R (s) | t2R (s) | Compound | Molecular formula | RIexpa | RIlitb | Ref RIlitc | H. spicatum |
Compound previously reported | |
|---|---|---|---|---|---|---|---|---|---|---|
| GCxGC-TOF | GC-TOF | |||||||||
| Alkanes | ||||||||||
| 1 | 1185 | 0.79 | Tetradecane | C14H30 | 1390 | 1400 | Adams, 2007 | 0.01 | – | |
| 2 | 1330 | 0.81 | Pentadecane | C15H32 | 1499 | 1500 | Adams, 2007 | 0.81 | 1.06 | |
| 3 | 1460 | 1.15 | n-Hexadecane | C16H34 | 1600 | 1600 | Adams, 2007 | 0.37 | 0.48 | |
| Alcohols | ||||||||||
| 4 | 355 | 0.81 | 2-Heptanol | C7H16O | 892 | 896 | Adams, 2007 | 0.12 | – | |
| 5 | 515 | 0.88 | 2-Octanol | C8H18O | 993 | 994 | Adams, 2007 | 0.03 | – | |
| 6 | 1025 | 1.07 | 2-Undecanol | C11H24O | 1295 | 1301 | Adams, 2007 | 0.01 | – | |
| Aldehydes | ||||||||||
| 7 | 450 | 1.38 | Benzaldehyde | C7H6O | 951 | 952 | Adams, 2007 | 0.04 | – | |
| 8 | 585 | 1.54 | Benzeneacetaldehyde | C8H8O | 1039 | 1036 | Adams, 2007 | 0.07 | – | |
| 9 | 1010 | 1.43 | Undec-10-en-1-al | C11H20O | 1294 | 1299 | Adams, 2007 | 0.03 | – | |
| 10 | 1035 | 0.92 | Undec-9E-en-1-al | C11H20O | 1309 | 1311 | Adams, 2007 | 0.06 | – | |
| 11 | 1035 | 1.59 | (2E,4Z)-Decadienal | C9H10O2 | 1309 | 1315 | Nist, 2020 | 0.05 | – | |
| 12 | 1490 | 1.04 | Tetradecanal | C14H28O | 1605 | 1606 | Nist, 2020 | 0.01 | – | |
| Ketones | ||||||||||
| 13 | 335 | 0.89 | 2-Heptanone | C7H14O | 887 | 889 | Adams, 2007 | 0.33 | 0.51 | |
| 14 | 510 | 1.47 | 2-Octanone | C8H16O | 990 | 991 | Adams, 2007 | 0.01 | – | |
| 15 | 665 | 1.06 | 2-Nonanone | C9H18O | 1088 | 1087 | Adams, 2007 | 2.02 | 1.66 | |
| 16 | 785 | 1.44 | Sabina ketone | C9H14O | 1152 | 1154 | Adams, 2007 | 0.20 | – | |
| 17 | 840 | 1.06 | 2-Decanone | C10H20O | 1178 | 1190 | Adams, 2007 | 0.25 | 0.39 | |
| 18 | 1170 | 1.05 | 2-Dodecanone | C12H24O | 1389 | 1388 | Adams, 2007 | 0.08 | – | |
| 19 | 1320 | 1.05 | 2-Tridecanone | C13H26O | 1496 | 1495 | Adams, 2007 | 0.03 | – | |
| Monoterpene hydrocarbons | ||||||||||
| 20 | 390 | 1.53 | α-Thujene | C10H16 | 920 | 924 | Adams, 2007 | 0.24 | 0.36 | ✓ |
| 21 | 410 | 0.67 | α-Pinene | C10H16 | 935 | 932 | Adams, 2007 | 2.62 | 3.15 | ✓ |
| 22 | 430 | 3.62 | Camphene | C10H16 | 943 | 946 | Adams, 2007 | 0.09 | – | ✓ |
| 23 | 470 | 0.79 | Sabinene | C10H16 | 966 | 969 | Adams, 2007 | 5.48 | 4.78 | ✓ |
| 24 | 475 | 0.95 | β-Pinene | C10H16 | 974 | 974 | Adams, 2007 | 10.94 | 12.16 | ✓ |
| 25 | 485 | 0.75 | trans-meta-Mentha-2,8-diene | C10H16 | 979 | 979 | Adams, 2007 | 3.50 | 3.11 | |
| 26 | 490 | 1.12 | trans-Isolimonene | C10H16 | 981 | 980 | Adams, 2007 | 5.00 | 4.62 | |
| 27 | 495 | 0.75 | cis-meta-Mentha-2,8-diene | C10H16 | 984 | 983 | Adams, 2007 | 1.63 | 1.77 | |
| 28 | 500 | 0.79 | β-Myrcene | C10H16 | 989 | 988 | Adams, 2007 | 1.30 | 1.43 | ✓ |
| 29 | 545 | 0.83 | β-Phellandrene | C10H16 | 1022 | 1025 | Adams, 2007 | 0.59 | 0.77 | |
| 30 | 545 | 1.04 | p-Cymene | C10H16 | 1022 | 1020 | Adams, 2007 | 0.21 | 0.35 | ✓ |
| 31 | 550 | 1.76 | o-Cymene | C10H16 | 1023 | 1022 | Adams, 2007 | 0.20 | 0.33 | ✓ |
| 32 | 560 | 0.89 | Limonene | C10H16 | 1025 | 1024 | Adams, 2007 | 0.15 | – | ✓ |
| 33 | 590 | 1.02 | trans-β-Ocimene | C10H16 | 1042 | 1044 | Adams, 2007 | 0.36 | 0.44 | ✓ |
| 34 | 610 | 0.99 | p-Mentha-1,3-diene | C10H16 | 1058 | 1068 | Adams, 2007 | 0.95 | 1.13 | |
| 35 | 615 | 1.09 | ç-Terpinene | C10H16 | 1060 | 1054 | Adams, 2007 | 0.95 | 1.02 | ✓ |
| 36 | 655 | 1.68 | Terpinolene | C10H16 | 1085 | 1086 | Adams, 2007 | 4.24 | 4.07 | ✓ |
| 37 | 705 | 1.08 | p-Mentha-1,3,8-triene | C10H14 | 1109 | 1108 | Adams, 2007 | 0.15 | – | |
| 38 | 735 | 1.02 | Cosmene | C10H14 | 1130 | 1130 | Adams, 2007 | 0.04 | – | |
| 39 | 745 | 1.11 | p-Mentha-1,5,8-triene | C10H14 | 1132 | 1135 | Adams, 2007 | 0.10 | – | |
| Oxygenated monoterpenes | ||||||||||
| 40 | 570 | 0.9 | Eucalyptol | C10H18O | 1026 | 1026 | Adams, 2007 | 6.45 | 6.78 | ✓ |
| 41 | 630 | 1.02 | cis-Sabinene hydrate | C10H18O | 1064 | 1065 | Adams, 2007 | 2.47 | 3.01 | ✓ |
| 42 | 645 | 1.14 | cis-Linalool oxide | C10H18O2 | 1068 | 1067 | Adams, 2007 | 0.01 | – | ✓ |
| 43 | 665 | 1.17 | dehydro-Linalool | C10H16O | 1086 | 1086 | Adams, 2007 | 0.08 | – | |
| 44 | 685 | 1.00 | Linalool | C10H18O | 1089 | 1088 | Adams, 2007 | 4.24 | 4.06 | ✓ |
| 45 | 695 | 1.05 | trans-Sabinene hydrate | C10H18O | 1094 | 1095 | Adams, 2007 | 4.33 | 4.12 | |
| 46 | 715 | 1.11 | β-Thujone | C10H16O | 1110 | 1098 | Adams, 2007 | 0.50 | 0.48 | |
| 47 | 720 | 1.04 | endo-Fenchol | C10H18O | 1114 | 1114 | Adams, 2007 | 0.15 | – | |
| 48 | 730 | 1.05 | cis-p-Menth-2-en-1-ol | C10H18O | 1128 | 1114 | Adams, 2007 | 0.05 | – | |
| 49 | 745 | 1.89 | iso-3-Thujanol | C10H18O | 1132 | 1118 | Adams, 2007 | 0.43 | 0.57 | |
| 50 | 750 | 1.46 | trans-Pinocarveol | C10H16O | 1134 | 1134 | Adams, 2007 | 0.06 | – | ✓ |
| 51 | 755 | 1.14 | trans-p-Menth-2-en-1-ol | C10H18O | 1135 | 1135 | Adams, 2007 | 0.10 | – | |
| 52 | 765 | 1.18 | trans-Sabinol | C10H16O | 1136 | 1136 | Adams, 2007 | 1.80 | 2.01 | |
| 53 | 765 | 1.30 | Camphor | C10H16O | 1136 | 1137 | Adams, 2007 | 0.75 | 0.62 | ✓ |
| 54 | 770 | 1.10 | Citronellal | C10H18O | 1142 | 1141 | Adams, 2007 | 0.05 | – | |
| 55 | 770 | 1.24 | neo-Thujan-3-ol | C10H18O | 1142 | 1148 | Adams, 2007 | 0.07 | – | |
| 56 | 780 | 1.26 | β-Pinene oxide | C10H16O | 1147 | 1149 | Adams, 2007 | 0.19 | – | ✓ |
| 57 | 790 | 1.36 | Isoborneol | C10H18O | 1154 | 1154 | Adams, 2007 | 0.23 | – | ✓ |
| 58 | 805 | 1.34 | trans-Pinocamphone | C10H16O | 1155 | 1155 | Adams, 2007 | 0.59 | 0.64 | |
| 59 | 815 | 1.19 | trans-β-Terpineol | C10H18O | 1159 | 1158 | Adams, 2007 | 0.47 | 0.61 | |
| 60 | 815 | 1.32 | Pinocarvone | C10H14O | 1159 | 1159 | Adams, 2007 | 3.03 | 2.92 | |
| 61 | 835 | 1.30 | Umbellulone | C10H14O | 1161 | 1160 | Adams, 2007 | 0.39 | 0.51 | |
| 62 | 835 | 1.41 | p-Cymen-8-ol | C10H14O | 1166 | 1167 | Adams, 2007 | 0.02 | – | |
| 63 | 840 | 1.45 | Dihydrocarveol | C10H18O | 1178 | 1179 | Adams, 2007 | 0.10 | – | |
| 64 | 845 | 1.19 | Myrtenol | C10H16O | 1190 | 1192 | Adams, 2007 | 0.11 | – | |
| 65 | 850 | 1.25 | Terpineol | C10H18O | 1193 | 1194 | Adams, 2007 | 0.25 | 0.33 | ✓ |
| 66 | 850 | 1.41 | Myrtenal | C10H14O | 1193 | 1186 | Adams, 2007 | 2.91 | 2.65 | |
| 67 | 855 | 1.13 | cis-Piperitol | C10H18O | 1195 | 1195 | Adams, 2007 | 0.06 | – | |
| 68 | 855 | 1.15 | Verbanol | C10H18O | 1195 | 1195 | Adams, 2007 | 0.54 | 0.62 | |
| 69 | 855 | 1.24 | trans-4-Caranone | C10H16O | 1195 | 1197 | Adams, 2007 | 0.31 | 0.40 | |
| 70 | 870 | 1.49 | cis-Verbenone | C10H14O | 1197 | 1197 | Adams, 2007 | 1.11 | 1.30 | ✓ |
| 71 | 875 | 1.18 | trans-Piperitol | C10H18O | 1203 | 1204 | Adams, 2007 | 0.06 | – | |
| 72 | 895 | 1.16 | Nerol | C10H18O | 1216 | 1207 | Adams, 2007 | 0.34 | 0.40 | |
| 73 | 895 | 1.36 | Carveol | C10H16O | 1216 | 1227 | Adams, 2007 | 0.28 | 0.36 | ✓ |
| 74 | 900 | 1.09 | Citronellol | C10H20O | 1226 | 1226 | Adams, 2007 | 0.03 | – | |
| 75 | 900 | 1.33 | Ascaridole | C10H16O2 | 1226 | 1230 | Nist, 2020 | 0.21 | 0.27 | |
| 76 | 920 | 1.27 | Neral | C10H16O | 1233 | 1234 | Adams, 2007 | 0.02 | – | |
| 77 | 925 | 1.13 | Isobornyl formate | C11H18O2 | 1236 | 1235 | Adams, 2007 | 0.05 | – | |
| 78 | 930 | 1.43 | Cuminaldehyde | C10H12O | 1238 | 1235 | Adams, 2007 | 0.02 | – | |
| 79 | 945 | 1.41 | Piperitone | C10H16O | 1242 | 1238 | Adams, 2007 | 0.10 | – | |
| 80 | 950 | 1.3 | Linalool acetate | C12H20O2 | 1250 | 1249 | Adams, 2007 | 0.17 | – | |
| 81 | 955 | 1.31 | Teresantalol | C10H16O | 1255 | 1254 | Adams, 2007 | 0.09 | – | |
| 82 | 965 | 1.00 | Geranial | C10H16O | 1257 | 1256 | Nist, 2020 | 0.02 | – | |
| 83 | 970 | 1.23 | trans-p-Menth-2-en-7-ol | C10H18O | 1263 | 1264 | Adams, 2007 | 0.15 | – | |
| 84 | 970 | 1.57 | Isopiperitenone | C10H14O | 1263 | 1268 | Nist, 2020 | 0.06 | – | |
| 85 | 980 | 1.21 | p-Menth-1-en-7-al | C10H16O | 1270 | 1271 | Nist, 2020 | 0.03 | – | |
| 86 | 995 | 1.15 | Bornyl acetate | C12H20O2 | 1273 | 1273 | Adams, 2007 | 0.35 | 0.42 | |
| 87 | 995 | 1.32 | Perilla alcohol | C10H16O | 1273 | 1285 | Adams, 2007 | 0.05 | – | |
| 88 | 1005 | 1.47 | Terpinen-4-ol acetate | C12H20O2 | 1293 | 1295 | Adams, 2007 | 0.40 | 0.48 | |
| 89 | 1055 | 1.29 | Myrtenyl acetate | C12H18O2 | 1313 | 1299 | Adams, 2007 | 0.20 | 0.23 | |
| 90 | 1070 | 1.38 | Limonene aldehyde | C10H14O | 1324 | 1324 | Adams, 2007 | 0.04 | – | |
| Sesquiterpene hydrocarbons | ||||||||||
| 91 | 1080 | 0.95 | δ-Elemene | C15H24 | 1336 | 1335 | Adams, 2007 | 0.03 | – | |
| 92 | 1100 | 0.94 | α-Cubebene | C15H24 | 1345 | 1345 | Adams, 2007 | 0.02 | – | ✓ |
| 93 | 1115 | 1.42 | Longicyclene | C15H24 | 1372 | 1371 | Adams, 2007 | 0.04 | – | |
| 94 | 1115 | 0.98 | Copaene | C15H24 | 1372 | 1374 | Adams, 2007 | 0.02 | – | ✓ |
| 95 | 1165 | 1.01 | β-Elemene | C15H24 | 1388 | 1389 | Adams, 2007 | 0.13 | – | ✓ |
| 96 | 1185 | 0.95 | 7-epi-Sesquithujene | C15H24 | 1390 | 1390 | Adams, 2007 | 0.01 | – | |
| 97 | 1195 | 1.02 | α-Gurjunene | C15H24 | 1408 | 1409 | Adams, 2007 | 0.06 | – | |
| 98 | 1205 | 1.00 | cis- β-Beramotene | C15H24 | 1411 | 1411 | Adams, 2007 | 0.12 | – | ✓ |
| 99 | 1220 | 1.19 | (Z)-Caryophyllene | C15H24 | 1413 | 1408 | Adams, 2007 | 1.94 | 2.06 | ✓ |
| 100 | 1230 | 1.04 | trans-β-Copaene | C15H24 | 1419 | 1419 | Adams, 2007 | 0.02 | – | ✓ |
| 101 | 1235 | 0.98 | cis-α-Bergamotene | C15H24 | 1420 | 1420 | Nist, 2020 | 0.22 | 0.31 | ✓ |
| 102 | 1245 | 1.05 | cis-Thujopsene | C15H24 | 1432 | 1429 | Adams, 2007 | 0.01 | – | |
| 103 | 1255 | 1.03 | epi-β-Santalene | C15H24 | 1445 | 1447 | Adams, 2007 | 0.01 | – | |
| 104 | 1255 | 1.07 | cis-Muurola-3,5-diene | C15H24 | 1445 | 1450 | Adams, 2007 | 0.04 | – | ✓ |
| 105 | 1260 | 0.99 | (E)-β-Farnesene | C15H24 | 1450 | 1455 | Nist, 2020 | 0.02 | – | ✓ |
| 106 | 1270 | 1.14 | α-Humulene | C15H24 | 1455 | 1454 | Adams, 2007 | 0.25 | 0.32 | ✓ |
| 107 | 1280 | 1.53 | 9-epi-Caryophyllene | C15H24 | 1465 | 1464 | Adams, 2007 | 0.11 | – | ✓ |
| 108 | 1295 | 1.09 | γ-Muurolene | C15H24 | 1475 | 1478 | Adams, 2007 | 0.68 | 0.57 | ✓ |
| 109 | 1300 | 1.06 | γ-Curcumene | C15H24 | 1480 | 1481 | Adams, 2007 | 0.35 | 0.43 | |
| 110 | 1300 | 1.13 | α-Amorphene | C15H22 | 1480 | 1483 | Adams, 2007 | 0.35 | 0.41 | |
| 111 | 1325 | 1.10 | α-Zingiberene | C15H24 | 1493 | 1493 | Adams, 2007 | 0.05 | – | |
| 112 | 1325 | 1.13 | β-Vetispirene | C15H22 | 1493 | 1493 | Adams, 2007 | 0.43 | 0.47 | |
| 113 | 1330 | 1.10 | α-Muurolene | C15H24 | 1499 | 1500 | Adams, 2007 | 3.07 | 3.21 | ✓ |
| 114 | 1335 | 1.11 | α-Chamigrene | C15H24 | 1502 | 1503 | Adams, 2007 | 0.29 | 0.38 | |
| 115 | 1345 | 1.04 | β-Bisabolene | C15H24 | 1507 | 1505 | Adams, 2007 | 0.16 | – | |
| 116 | 1345 | 1.07 | α-Bulnesene | C15H24 | 1507 | 1511 | Adams, 2007 | 0.26 | 0.39 | |
| 117 | 1345 | 1.11 | δ-Amorphene | C15H22 | 1507 | 1511 | Adams, 2007 | 0.35 | 0.41 | |
| 118 | 1355 | 1.09 | γ-Cadinene | C15H24 | 1513 | 1513 | Adams, 2007 | 0.05 | – | ✓ |
| 119 | 1355 | 1.14 | Nootkatene | C15H22 | 1513 | 1517 | Adams, 2007 | 0.87 | 1.01 | |
| 120 | 1365 | 1.12 | trans-Calamenene | C15H22 | 1520 | 1521 | Adams, 2007 | 1.19 | 1.28 | |
| 121 | 1370 | 1.09 | (E)-γ-Bisabolene | C15H24 | 1529 | 1529 | Nist, 2020 | 0.03 | – | |
| 122 | 1370 | 1.13 | δ-Cadinene | C15H24 | 1529 | 1530 | Nist, 2020 | 0.04 | – | ✓ |
| 123 | 1380 | 1.15 | cis-Calamenene | C15H24 | 1531 | 1528 | Adams, 2007 | 0.34 | 0.39 | |
| 124 | 1385 | 1.24 | γ-Vetivenene | C15H22 | 1535 | 1536 | Adams, 2007 | 0.08 | – | |
| 125 | 1415 | 1.18 | β-Vetivenene | C15H22 | 1555 | 1554 | Adams, 2007 | 0.15 | 0.17 | |
| 126 | 1425 | 1.32 | β-Calacorene | C15H20 | 1562 | 1564 | Adams, 2007 | 0.03 | – | ✓ |
| Oxygenated sesquiterpenes | ||||||||||
| 127 | 1385 | 1.17 | (Z)-Nerolidol | C15H26O | 1535 | 1531 | Adams, 2007 | 0.08 | – | |
| 128 | 1390 | 1.19 | α-Copaen-11-ol | C15H24O | 1540 | 1539 | Adams, 2007 | 0.01 | – | |
| 129 | 1395 | 1.29 | Hedycaryol | C15H26O | 1545 | 1546 | Adams, 2007 | 0.05 | – | ✓ |
| 130 | 1405 | 1.19 | Elemol | C15H26O | 1549 | 1548 | Adams, 2007 | 0.04 | – | ✓ |
| 131 | 1410 | 1.12 | Occidentalol | C15H24O | 1550 | 1550 | Adams, 2007 | 0.22 | 0.28 | |
| 132 | 1420 | 1.08 | (E)-Nerolidol | C15H26O | 1560 | 1561 | Adams, 2007 | 0.12 | – | ✓ |
| 133 | 1425 | 1.25 | epi-Longipinanol | C15H26O | 1563 | 1562 | Adams, 2007 | 0.05 | – | |
| 134 | 1430 | 1.11 | Germacrene D-4-ol | C15H26O | 1572 | 1574 | Adams, 2007 | 0.03 | – | ✓ |
| 135 | 1435 | 1.18 | trans-Sesquisabinene hydrate | C15H26O | 1576 | 1577 | Adams, 2007 | 0.01 | – | |
| 136 | 1445 | 1.19 | Viridiflorol | C15H26O | 1580 | 1592 | Adams, 2007 | 0.17 | – | ✓ |
| 137 | 1450 | 1.36 | Carotol | C15H26O | 1592 | 1594 | Adams, 2007 | 0.21 | 0.27 | |
| 138 | 1455 | 1.28 | ar-dihydro-Turmerone | C15H22O | 1595 | 1595 | Adams, 2007 | 0.48 | 0.55 | |
| 139 | 1465 | 1.23 | Ledol | C15H26O | 1599 | 1601 | Adams, 2007 | 0.64 | 0.62 | ✓ |
| 140 | 1470 | 1.28 | trans-β-Elemenone | C15H22O | 1602 | 1601 | Adams, 2007 | 0.06 | – | |
| 141 | 1475 | 1.34 | Khusimone | C14H20O | 1605 | 1604 | Adams, 2007 | 1.48 | 1.57 | |
| 142 | 1480 | 1.24 | Sesquithuriferol | C15H26O | 1608 | 1604 | Adams, 2007 | 0.18 | – | |
| 143 | 1490 | 1.35 | Humulene epoxide II | C15H24O | 1612 | 1608 | Adams, 2007 | 0.38 | 0.36 | ✓ |
| 144 | 1495 | 1.18 | cis-Isolongifolanone | C15H24O | 1614 | 1611 | Adams, 2007 | 0.08 | – | |
| 145 | 1505 | 1.28 | β-Himachalene oxide | C15H24O | 1616 | 1615 | Adams, 2007 | 0.13 | – | |
| 146 | 1510 | 1.31 | epi-Cedrol | C15H26O | 1618 | 1618 | Adams, 2007 | 0.05 | – | |
| 147 | 1510 | 1.35 | 1-10-di-epi-Cubenol | C15H26O | 1618 | 1618 | Adams, 2007 | 0.38 | 0.34 | ✓ |
| 148 | 1515 | 1.25 | Epicubenol | C15H26O | 1625 | 1627 | Adams, 2007 | 0.18 | – | ✓ |
| 149 | 1515 | 1.3 | Ledene oxide-(II) | C15H24O | 1625 | 1631 | Adams, 2007 | 0.08 | – | |
| 150 | 1520 | 1.34 | γ-Eudesmol | C15H26O | 1630 | 1630 | Adams, 2007 | 0.81 | 0.94 | ✓ |
| 151 | 1520 | 1.31 | α-Acorenol | C15H26O | 1630 | 1633 | Nist, 2020 | 0.23 | 0.31 | |
| 152 | 1525 | 0.99 | cis-Cadin-4-en-7-ol | C15H26O | 1633 | 1635 | Adams, 2007 | 0.35 | 0.40 | |
| 153 | 1530 | 1.29 | Gossonorol | C15H22O | 1635 | 1636 | Adams, 2007 | 0.02 | – | |
| 154 | 1530 | 1.39 | β-Acorenol | C15H26O | 1635 | 1636 | Adams, 2007 | 0.05 | – | |
| 155 | 1535 | 1.25 | epi-α-Cadinol | C15H26O | 1640 | 1638 | Adams, 2007 | 0.40 | 0.45 | |
| 156 | 1535 | 1.37 | epi-α-Muurolol | C15H26O | 1640 | 1640 | Adams, 2007 | 0.20 | 0.27 | ✓ |
| 157 | 1540 | 1.34 | Cubenol | C15H26O | 1645 | 1645 | Adams, 2007 | 1.31 | 1.19 | |
| 158 | 1545 | 1.28 | β-Eudesmol | C15H26O | 1648 | 1649 | Adams, 2007 | 0.07 | – | ✓ |
| 159 | 1550 | 1.23 | Cedr-8(15)-en-10-ol | C15H24O | 1650 | 1650 | Adams, 2007 | 0.01 | – | |
| 160 | 1555 | 1.28 | α-Cadinol | C15H26O | 1652 | 1652 | Adams, 2007 | 0.38 | 0.42 | ✓ |
| 161 | 1555 | 1.41 | Valerianol | C15H26O | 1652 | 1656 | Adams, 2007 | 0.38 | 0.44 | |
| 162 | 1560 | 0.86 | Selin-11-en-4α-ol | C15H26O | 1657 | 1658 | Adams, 2007 | 0.18 | – | |
| 163 | 1560 | 1.24 | cis-Calamenen-10-ol | C15H22O | 1657 | 1660 | Adams, 2007 | 0.08 | – | |
| 164 | 1565 | 1.45 | dihydro-Eudesmol | C15H28O | 1660 | 1661 | Adams, 2007 | 0.08 | – | |
| 165 | 1570 | 1.19 | 7-epi-α-Eudesmol | C15H26O | 1662 | 1662 | Adams, 2007 | 0.05 | – | |
| 166 | 1575 | 1.32 | 14-hydroxy-(Z)-Caryophyllene | C15H24O | 1664 | 1666 | Adams, 2007 | 0.20 | – | |
| 167 | 1580 | 1.26 | (E)-Bisabol-11-ol | C15H26O | 1667 | 1667 | Adams, 2007 | 0.11 | – | |
| 168 | 1585 | 1.38 | ar-Turmerone | C15H20O | 1669 | 1668 | Adams, 2007 | 0.11 | – | |
| 169 | 1590 | 1.3 | epi-β-Bisabolol | C15H26O | 1672 | 1670 | Adams, 2007 | 0.04 | – | |
| 170 | 1595 | 1.2 | α-Bisabolol | C15H26O | 1679 | 1680 | Nist, 2020 | 0.13 | – | |
| 171 | 1600 | 0.82 | epi-α-Bisabolol | C15H26O | 1682 | 1683 | Adams, 2007 | 0.04 | – | |
| 172 | 1605 | 1.28 | (2Z,6Z)-Farnesal | C15H24O | 1685 | 1684 | Adams, 2007 | 0.26 | 0.31 | |
| 173 | 1605 | 1.35 | Shyobunol | C15H26O | 1685 | 1689 | Adams, 2007 | 0.31 | 0.35 | |
| 174 | 1610 | 0.82 | Junicedranol | C15H26O | 1690 | 1692 | Adams, 2007 | 0.05 | – | |
| 175 | 1615 | 1.4 | Germacrone | C15H22O | 1694 | 1693 | Adams, 2007 | 0.02 | – | ✓ |
| 176 | 1620 | 1.28 | α-trans-Bergamotenol | C15H24O | 1698 | 1697 | Nist, 2020 | 0.08 | – | |
| 177 | 1620 | 1.41 | Longifolol | C15H26O | 1710 | 1713 | Adams, 2007 | 0.07 | – | |
| 178 | 1625 | 1.04 | (Z)-epi-β-Santalol | C15H24O | 1714 | 1715 | Adams, 2007 | 0.13 | – | |
| 179 | 1630 | 1.19 | (E,E)-α-Farnesol | C15H26O | 1724 | 1725 | Nist, 2020 | 0.01 | – | |
| 180 | 1635 | 1.39 | (E)-Nuciferal | C15H20O | 1726 | 1727 | Nist, 2020 | 0.01 | – | |
| 181 | 1635 | 1.4 | Vetiselinenol | C15H24O | 1726 | 1730 | Nist, 2020 | 0.30 | 0.41 | |
| 182 | 1655 | 1.54 | Curcumenol | C15H22O2 | 1735 | 1733 | Adams, 2007 | 0.05 | – | |
| 183 | 1660 | 1.35 | (E)-β-Santalol | C15H24O | 1739 | 1738 | Adams, 2007 | 0.06 | – | |
| 184 | 1665 | 1.44 | (E)-Nuciferol | C15H22O | 1652 | 1754 | Adams, 2007 | 0.03 | – | |
| 185 | 1680 | 1.74 | α-Sinensal | C15H22O | 1758 | 1755 | Adams, 2007 | 0.57 | 0.46 | |
| 186 | 1705 | 1.37 | (Z)-β-Curcumen-12-ol | C15H24O | 1762 | 1761 | Nist, 2020 | 0.03 | – | |
| 187 | 1705 | 1.38 | cis-Lanceol | C15H24O | 1762 | 1761 | Adams, 2007 | 0.05 | – | |
| 188 | 1755 | 1.54 | 14-Hydroxy-α-muurolene | C15H24O | 1777 | 1779 | Adams, 2007 | 0.03 | – | |
| Furans | ||||||||||
| 189 | 940 | 1.3 | Perilla ketone | C10H14O2 | 1240 | 1244 | Adams, 2007 | 0.05 | – | |
| 190 | 1485 | 1.28 | Curzerenone | C15H18O2 | 1604 | 1605 | Adams, 2007 | 0.28 | 0.32 | |
| Fatty acids | ||||||||||
| 191 | 2115 | 1.43 | Palmitic acid | C16H32O2 | 1960 | 1959 | Adams, 2007 | 0.07 | – | |
| 192 | 2680 | 0.59 | Oleic Acid | C18H34O2 | 2140 | 2141 | Adams, 2007 | 0.05 | – | |
| Diterpenes | ||||||||||
| 193 | 2670 | 0.69 | Coronarin-E | C20H28O | 2133 | 2135 | Nist, 2020 | 0.02 | – | |
‘-’ refers to not detected.
t1R(s): first dimension retention time in seconds, t2R(s): second dimension retention time in seconds.
Retention index obtained through the modulated chromatogram.
Retention index reported for 5% phenyl polysilphenylene-siloxane GC column or equivalent column.
Reference index literature from Adams, 2007 or NIST, 2020.
Further, GCxGC enhances detection of trace compounds with peak area of 0.01%. A total of 9 compounds with peak area of 0.01% was identified in Hedychium spicatum essential oil (Table 1). Previous reports on H. spicatum essential oil have resulted in identification of nearly 53 compounds [[6], [7], [8], [9],14,20], contrary to the present study where 193 constituents were detected after the GCxGC-TOFMS analysis.
A low polarity stationary phase (Rtx-5MS) and a mid-polarity stationary phase (Rxi-17 Sil MS) was used as the 1st and 2nd dimensional column, respectively for GCxGC-TOFMS analysis. This combination of column could help to achieve independent two dimensional separation. Volatility and polarity were used as the criteria for separation in the 1st and 2nd dimension column, respectively. The employment of a 2nd dimension column improved the resolution of constituents. As shown in the GCxGC contour plot in Fig. 1A, the monoterpenes (oxygenated and hydrocarbons) were grouped at lower retention times, whereas sesquiterpenes (oxygenated and hydrocarbons) constituents were placed at the higher retention times in the contour plot. Thus, a structurally related grouping of components was observed in the GCxGC chromatogram.
Fig. 1.

Comprehensive characterization of H. spicatum rhizome essential oil (HSEO) by one dimensional (GC-TOFMS) and two dimensional time-of-flight mass spectrometry (GCxGC-TOFMS). (A) GCxGC-TOFMS contour plot displaying the structures of H. spicatum rhizome essential oil (HSEO). (B) Semi-quantitative class distribution of compounds in H. spicatum rhizome essential oil obtained by GC-TOFMS and GCxGC-TOFMS.
In GC-TOFMS, it appeared that due to use of a single column many peaks were coeluting and were not clearly resolved. A clear example establishing the usefulness of the GCxGC-TOFMS in resolving co-eluting peaks and separating them by mass spectral deconvolution is shown in Table 1. 2-Nonanone (peak 1, t1R = 665 s, t2R = 1.06 s) and dehydro-linalool (peak 2, t1R = 665 s, t2R = 1.17 s) had co-eluted on the 1st dimensional column (Rtx-5MS). On addition of a 2nd dimensional column (Rxi-17 Sil MS) they were separated as they had different polarities. Other co-eluting peaks were 2-decanone (peak 1, t1R = 840 s, t2R = 1.06 s) and dihydrocarveol (peak 2, t1R = 840 s, t2R = 1.45 s).
GCxGC-TOFMS analysis showed 193 volatile compounds in H. spicatum rhizome essential oil, 115 compounds more than detected by GC-TOFMS. This two and half fold increase in the constituents by GCxGC-TOFMS over GC-TOFMS may be attributed to the higher resolution of the compounds in the second dimensional column.
The differences in semi-quantitative classes in the H. spicatum rhizome essential oil analyzed by GCxGC-TOFMS and GC-TOFMS analysis has been shown in Fig. 1B. It can be observed that there is a reduction in the percentage area of monoterpene hydrocarbons and alkanes in GCxGC-TOFMS analysis as compared to GC-TOFMS analysis. Certain class of compounds such as alcohols, aldehydes, fatty acids and diterpenes that were not identified by GC-TOF were identified by GCxGC-TOF due to improved peak capacity and sensitivity of GCxGC-TOFMS over GC-TOFMS.
The presence of oxygenated terpenes, which are known to have pro-oxidant effects on cells, may be the cause of the cytotoxic effects of H. spicatum essential oil. Plants of Hedychium genus have been reported in the literature to possess anticancer activities. On the basis of the chemical composition, the compounds β-pinene and eucalyptol were the most predominant constituents of HSEO, suggesting that the antiproliferative action of HSEO might be possibly mediated by these two compounds. Previous studies have indicated that β-pinene and eucalyptol exert significant cytotoxic effects on different tumor cells [21,22]. However, it should not be ruled out that other dominant compounds such as terpinolene and linalool have also demonstrated strong anticancer effects in in vitro cancerous cells thereby indicating potential synergies among essential oil components [23,24].
3.2. Cytotoxic effects of HSEO against cancerous cells
The cytotoxic effects of H. spicatum rhizome essential oil (HSEO) were investigated against cancerous PC-3, HCT-116 and A-549 cells and non-tumorous 3T3-L1 cells using MTT assay. The MTT assay is widely used to determine cytotoxicity by measuring the reduction of MTT into an insoluble blue color formazan product mainly by the mitochondrial dehydrogenases [25]. H. spicatum rhizome essential oil (HSEO) exhibited a decrease in the cell viability with increasing concentration (0–200 μg/ml) in all the analyzed cell lines tested at 24 h. H. spicatum rhizome essential oil (HSEO) exhibited a significant cytotoxic effect on PC-3, HCT-116, A-549 cell line with IC50 values of 21.88, 39.31, 63.05 μg/ml, respectively (Fig. 2A).
Fig. 2.

Inhibition of cell viability by HSEO against cancerous cells. (A) PC-3, HCT-116, A-549, and 3T3-L1 cells were cultured in 96-well plates and treated with (0–200 μg/ml) concentrations of HSEO for 24 h and cell viability was determined by MTT assay. (B) HSEO treatment at a concentration of 20 and 40 μg/ml showed a clear reduction in cell colonies of PC-3 cells stained with crystal violet as compared to control. (C) Quantification of the colonies, showing a dose-dependent reduction compared to the control group. (For interpretation of the references to color in this figure legend, the reader is referred to the Web version of this article.)
Labdane diterpenes isolated from H. spicatum rhizomes are known to inhibit the growth of cancer cells such as A-549 (human alveolar carcinoma), A-375 (human malignant melanoma), A-431 (human epidermal carcinoma), Colo-205 (human colon carcinoma), MCF-7 (human breast carcinoma), HL-60 (human promyelocytic leukaemia) and THP-1 (human acute monocytic leukaemia). The cytotoxic effect displayed in the present study might be due to the presence of major constituents β-pinene and eucalyptol in the rhizome essential oil [26].
The selective index (SI) was used to assess the differentiation of treatment among cancerous and non-cancerous cells. The selectivity index was measured as the proportion of IC50 of non-cancerous cell/IC50 of cancerous cell. HSEO displayed a considerable selectivity towards human cancerous PC-3, HCT-116 and A-549 cells and its cytotoxicity was 3 times greater than that of a normal 3T3 cell line. A similar selectivity between human tumor cell line (K562) and non-cancerous cell line (MRC-5 and L929 cells) was also observed by Hedychium flavum essential oil [27]. Chemotherapeutic drugs should exhibit selective cytotoxicity by inhibiting the proliferation of tumor cells while sparing normal cells [28]. As a result, H. spicatum essential oil, which demonstrates in vitro selectivity for cancer cells can be used as promising candidate for anticancer drug development.
3.3. Effect of HSEO on colony formation in PC-3 cells
The clonogenic assay is a colony formation assay that assess the survival ability of a cell and become a colony after treatment with the drug [29]. In a tumor microenvironment, the ability to form colonies is critical for cells to grow and expand. It is widely established that a decrease in clonogenic capability is linked with a reduction in tumor development and progression [30]. Treatment of PC-3 cells with HSEO in the concentration range of 0–40 μg/ml after 24 h displayed reduction in the colony forming capacity compared to the control (Fig. 2B). Treatment with HSEO at a dose of 20 and 40 μg/ml reduced the number of colonies to 72% and 39%, respectively, compared to the untreated group (Fig. 2C).
3.4. Effect of HSEO on morphological alterations in PC-3 cells
Several morphological process occur during apoptosis [31]. Acridine orange (AO) is a fluorescent dye that stains the nucleus green, whereas ethidium bromide (EtBr) will stain cells whose cell membrane integrity is lost. To understand the morphological alterations in PC-3 cells upon treatment of H. spicatum rhizome essential oil (HSEO), AO/EtBr double staining was carried out. PC-3 cells treated at both the dose of HSEO (20 and 40 μg/ml) showed cell shrinkage, nuclear fragmentation and membrane blebbing (Fig. 3). Live cells with bright green nuclei and distinct chromatin structures are easily differentiated from apoptotic PC-3 cells. Early apoptotic (EA) PC-3 cells displayed green nucleus with chromatin condensation, whereas late apoptotic (LA) PC-3 cells are stained orange and showed fragmented DNA with formation of beads in the nucleus. PC-3 cells exhibited bright orange-red in appearance.
Fig. 3.

Apoptotic morphology detection by acridine orange-ethidium bromide (AO/EB) staining of PC-3 cells treated with control group and various concentration of HSEO (20 and 40 μg/ml). Green viable cells show normal morphology; green early apoptotic cells show nuclear margination and chromatin condensation. Late orange apoptotic cells showed fragmented chromatin and apoptotic bodies. VC = viable cells, EA = early apoptotic cells, LA = late apoptotic cell. (For interpretation of the references to color in this figure legend, the reader is referred to the Web version of this article.)
3.5. Apoptotic effects of HSEO in PC-3 cells
The proportion of PC-3 cells that underwent apoptosis after exposure to different concentration of HSEO was measured by Annexin-V-FITC/Propidium Iodide assay using flow cytometry (Fig. 4A). In normal cells, phosphatidylserine (PS), is confined to cytoplasmic space of the inner plasma membrane. The membrane is disrupted during apoptosis, and PS is translocated from the inner to the extracellular side of the membrane. Annexin V in conjugation with the fluorescent conjugate FITC binds to the PS and can detect PS in apoptotic cells [32]. Necrotic and late apoptotic cells are stained with PI. As a result, live, early apoptotic, late apoptotic and dead cells could be differentiated using Annexin-V-FITC/PI assay. Quantitative measurement of the percentages of apoptotic PC-3 cells increased from 0.04% ((0.02%) early apoptotic and (0.02%) late apoptotic cells) at untreated control to 65.80% ((12.97%) early apoptotic and (52.83%) late apoptotic cells) incubated at 40 μg/ml of HSEO (Fig. 4B). Interestingly at both the concentration of HSEO (20 and 40 μg/ml), PC-3 necrotic cells percentage was less than 5%. Along these lines, the TUNEL assay was carried out to validate the occurrence of DNA fragmentation as a hallmark of cell apoptosis (Fig. 4C). TdT (terminal deoxynucleotidyl transferase) catalyses the addition of dUTP nucleotides to the free 3′-OH of fragmented DNA in TUNEL assay [33]. The labelled dUTP exhibit fluorescence, thereby identifying apoptotic cells in the death process. The percentage of TUNEL-positive PC-3 cells as evidenced by flow cytometry increased significantly to 57.59% in HSEO (40 μg/ml) treated group from 1.07% in the control group after 24 h of incubation (Fig. 4D). Taken together, these results clearly show that HSEO induced cell death in PC-3 cell is due to apoptosis rather than necrosis.
Fig. 4.

Apoptosis examinations by AnnexinV-FITC/PI and TUNEL (terminal deoxynucleotidyl transferase biotin-dUTP nick end labeling) assay for PC-3 cells after treatment with HSEO. (A) Representative flow cytometric dot plots by AnnexinV-FITC/PI assay. (B) Quantification of viable (Annexin V-FITC/PI double negative cells), early apoptotic (Annexin V-FITC positive, PI negative cells), late apoptotic (Annexin V-FITC/PI double positive cells) and necrotic cells (PI positive, annexin V-FITC negative cells) by AnnexinV-FITC/PI assay. (C) TUNEL assay flow cytometric histograms of PC-3 cells treated with control and HSEO (20 and 40 μg/ml) (D) Percentage of TUNEL positive cells cell population undergoing apoptosis. Data are presented as the means ± standard deviation of triplicate experiments (n = 3). **P < 0.01, and ***P < 0.01, vs control.
3.6. Effect of HSEO on cell cycle arrest in PC-3 cells
Stress can cause cell cycle arrest at various stages by triggering apoptosis. Flow cytometry analysis was carried out to understand the potential effects of the HSEO on cell cycle arrest of PC-3 cells. HSEO exerted a higher degree of cell cycle arrest at the G2/M phase by increasing the proportion of PC-3 cells from 8.31% in control to 19.41% and 35.35% after treatment with 20 and 40 μg/ml of HSEO, respectively. Similarly, PC-3 cells exposed to HSEO at 20 and 40 μg/ml displayed cell cycle arrest, as evidenced by an increase in cells at S phase to 15.86% and 32.14%, respectively compared to 5.03% in the untreated control (Fig. 5A–D). On the other hand, the percentage of PC-3 cells in the G0/G1 and sub G0/G1 phase decreased with increasing concentration of HSEO. Therefore, it can be concluded that HSEO promotes apoptosis by promoting cell cycle arrest at G2/M and S phase in PC-3 cells.
Fig. 5.

H. spicatum rhizome essential oil (HSEO) induces G2/M and S phase cell cycle arrest in PC-3 cells. PC-3 cells were treated with HSEO and were stained with PI, and cell cycle distribution was analyzed by flow cytometer. (A) Control cells, Cells treated with (B) 20 and (C) 40 μg/ml of HSEO for 24 h at 37 °C, respectively. (D) The percentages of sub G0/G1, G0/G1, S and G2/M phase cells are displayed as histograms.
3.7. Effect of HSEO on intracellular ROS formation in PC-3 cells
Reactive oxygen species (ROS) has been established to be an early signal that mediates apoptosis. To ascertain whether ROS is really involved in HSEO mediated cell death of PC-3 cells, we assessed the intracellular ROS levels using a fluorescent probe, 2′,7′-dichlorofluorescein (DCF) by fluorescent microscope and flow cytometry. Fluorescence microscopy revealed a higher percentage of PC-3 cells to be positively stained for DCFDA dye in comparison to the untreated group (Fig. 6A). The green light intensity characterizing ROS content became intense after treatment with HSEO. The quantitative increase in fluorescence in PC-3 cells was analyzed by a flow cytometer. PC-3 cells treated with HSEO at a dose of 20 and 40 μg/ml revealed a dose-dependent increase in mean fluorescence intensity (seen as a shift towards right x-axis) (Fig. 6B and C). The results demonstrated that HSEO significantly induced oxidative stress and increase the levels of intracellular ROS in PC-3 cells.
Fig. 6.

Effect of H. spicatum essential oil (HSEO) on intracellular reactive oxygen species generation in PC-3 cells. (A) ROS detection in PC-3 cells treated with control and various concentration of HSEO (20 and 40 μg/ml) by fluorescent microscopy. (B) Measurements of ROS levels by flow cytometry with DCFDA dye. (C) Mean intensity of DCFH-DA fluorescence. Values are represented as mean ± standard deviation of three independent experiments (n = 3). p values were determined using one-way-ANOVA. **P < 0.01, vs control.
3.8. Effect of HSEO on mitochondrial membrane potential (ΔΨm)
Mitochondria membrane permeabilization is a crucial event responsible for caspase activation in the mitochondrial apoptosis pathway. The fluorescent JC-1 dye was used to measure changes in mitochondria membrane potential (MMP). JC-1 dye exhibits potential dependent accumulation in mitochondria. At lower MMP, JC-1 dye is predominantly a monomer and exhibits green fluorescence, whereas at higher MMP the emission shifts to red fluorescence and JC-1 becomes aggregated. As a result, MMP values were analyzed by staining with JC-1 to assess whether HSEO activated the mitochondrial apoptotic pathway. As the membrane potential is lowered, the mitochondrial membrane becomes more permeable thereby releasing apoptotic factors. PC-3 cells treated with the HSEO led to a loss in MMP in PC-3 cells (Fig. 7A). The decrease in MMP in PC-3 cells was 62.87% and 50.04% after treatment with 20 and 40 μg/ml of HSEO for 24 h, respectively (Fig. 7B).
Fig. 7.

Effects of HSEO treatment on changes in mitochondrial membrane potential in PC-3 cells by JC-1 assay. (A) Representative flow cytometry histogram showing JC-1 staining after treatment with control and various concentration of HSEO (20 and 40 μg/ml). Graph showing significant reduction in relative mitochondrial membrane potential in PC-3 cells treated with HSEO as compared to control. Data are expressed as mean ± SD (n = 3). p values were determined using one-way-ANOVA. ***P < 0.001, vs. control.
3.9. Effect of HSEO on caspases activation
Activation of the mitochondrial-mediated apoptosis can initiate the activation cascade of caspases. The activation of caspase-8 can activate caspases like caspase-3 that is a part of the extrinsic cascade of apoptosis. Caspases-9 is a key caspases involved in the intrinsic or mitochondrial pathway [34]. In order to comprehend the apoptotic mechanisms, it needs to be ascertained whether caspase-3, 8 and 9 were activated when the PC-3 cells were treated with HSEO. Therefore, caspases-3, 8 and 9 activity were quantified by flow cytometry. PC-3 cells exposed with HSEO showed an increase in the caspase-3, 8 and 9 levels. The proportions of the activated caspase-3, 8 and 9 levels induced by HSEO (40 μg/ml) increased from 4.36 to 38.22%, 0.05–69.9% and 0.53–33.89%, respectively as compared to control (Fig. 8A–C). These findings that HSEO induced apoptosis in PC-3 cells via intrinsic and extrinsic pathway.
Fig. 8.

Effects of HSEO on caspases activities in PC-3 cells. After treatment with 20 and 40 μg/ml of HSEO for 24 h, cell lysates were prepared and caspase activities were quantified by flow cytometry for (A) Caspase 3, (B) Caspase 8, and (C) Caspase 9.
3.10. Effect of HSEO on the expression levels of apoptosis regulating proteins
Anticancer drug regulate mitochondrial mediated apoptosis using tumor suppressor p53 or Bcl-2 family proteins. p53 is crucial for biological response to DNA damage, and when activated causes DNA repair and cell cycle arrest [35]. p21, a cyclin-dependent kinase (CDK) inhibitor, is upregulated by p53 on DNA damage [36]. Upregulation of p21 protein can lead to cell cycle arrest via association with cyclin/CDK complexes, transcription factors and other cofactors. As a result, p21 activation mediated by p53 is a critical factor in controlling cancer cell proliferation. Therefore, in the current research, we determined the levels of p53 and p21. HSEO-treated PC-3 cells led to an increase in the levels of p53 and p21 as compared to control. Bcl-2 family proteins including pro-apoptotic (e.g. Bax, Bak) and anti-apoptotic (e.g. Bcl-2, Bcl-xL) genes have a crucial role in regulating mitochondrial mediated cell death. Therefore, we analyzed the effect of HSEO on the expression levels of Bcl-2 family proteins in PC-3 treated cells using qRT-PCR. The quantitative gene expression analysis demonstrated that the levels of anti-apoptotic protein Bcl-2 and Bcl-xL reduced after exposure of PC-3 cells to HSEO (Fig. 9). On the contrary, the level of pro-apoptotic gene, Bax was upregulated with increasing HSEO concentrations. These results indicate that HSEO modulates the expression level of pro-apoptotic and anti-apoptotic genes.
Fig. 9.

Relative mRNA expression of the apoptosis-related genes after the PC-3 cells were treated with control and various concentration of HSEO (20 and 40 μg/ml).
4. Conclusions
The present research is the first study to carry out a comprehensive characterization of H. spicatum essential oil and establish its cancer chemotherapeutic activity on prostate cancer cells. The current study demonstrated the utility of GCxGC coupled with TOF for carrying out a detailed characterization of the H. spicatum essential oil. The combination of high chromatographic resolution and the ability to resolve first dimension coelutions in the second dimension were the major improvements of using a GCxGC-TOFMS. The number of identified compounds increased from 78 by GC-TOFMS to 193 using GCxGC-TOFMS analysis. The results clearly demonstrated that H. spicatum essential oil exerted significant anti-cancer effect against PC-3 cells. This effect was linked with cell cycle arrest and increase of cell apoptosis. Furthermore, pre-treatment with H. spicatum essential oil induced intracellular ROS accumulation, mitochondrial membrane depolarization, activation of caspases and modulation of expression of pro-apoptotic and anti-apoptotic genes involved in the apoptosis in PC-3 cells. Overally, H. spicatum essential oil induced apoptosis in PC-3 cells via both the intrinsic and extrinsic pathway. All together, these evidences suggest that H. spicatum essential oil can be considered as a promising source of anti-tumor agent for treatment of prostate cancer in addition to the current anticancer therapies.
Declarations
Author contribution statement
Asit Ray: Conceived and designed the experiments; Performed the experiments; Analyzed and interpreted the data; Contributed reagents, materials, analysis tools or data; Wrote the paper.
Ayushman Gadnayak, Sudipta Jena: Performed the experiments; Analyzed and interpreted the data; Contributed reagents, materials, analysis tools or data.
Ambika Sahoo: Performed the experiments.
Jeetendranath Patnaik, Pratap Chandra Panda and Sanghamitra Nayak: Conceived and designed the experiments; Analyzed and interpreted the data.
Funding statement
This research did not receive any specific grant from funding agencies in the public, commercial, or not-for-profit sectors.
Data availability statement
Data will be made available on request.
Declaration of interest’s statement
The authors declare that they have no known competing financial interests or personal relationships that could have appeared to influence the work reported in this paper.
References
- 1.Siegel R.L., Miller K.D., Goding Sauer A., Fedewa S.A., Butterly L.F., Anderson J.C., Cercek A., Smith R.A., Jemal A. Colorectal cancer statistics, 2020. CA Cancer J. Clin. 2020;70(3):145–164. doi: 10.3322/caac.21601. [DOI] [PubMed] [Google Scholar]
- 2.Stewart B.W., Wild C.P. International Agency for Research on Cancer, World Health Organization; Lyon, France: 2014. World Cancer Report; p. 630. [Google Scholar]
- 3.Bayala B., Bassole I.H., Scifo R., Gnoula C., Morel L., Lobaccaro J.M.A., Simpore J. Anticancer activity of essential oils and their chemical components-a review. Am. J. Cancer Res. 2014;4(6):591–607. [PMC free article] [PubMed] [Google Scholar]
- 4.Bhalla Y., Gupta V.K., Jaitak V. Anticancer activity of essential oils: a review. J. Sci. Food Agric. 2013;93(15):3643–3653. doi: 10.1002/jsfa.6267. [DOI] [PubMed] [Google Scholar]
- 5.Badola H.K. Hedychium spicatum-A commercial Himalayan herb needs entrepreneurship at local level. Non-Wood News. 2009;19:26–27. [Google Scholar]
- 6.Prakash O., Rajput M., Kumar M., Pant A.K. Chemical composition and antibacterial activity of rhizome oils from Hedychium coronarium Koenig and Hedychium spicatum Buch-Ham. J. Essent. Oil-Bear. Plants. 2010;13(2):250–259. [Google Scholar]
- 7.Verma R.S., Padalia R.C. Comparative essential oil composition of different vegetative parts of Hedychium spicatum Smith. from Uttarakhand, India. Int. J. Green Pharm. 2010;4(4):292–295. [Google Scholar]
- 8.Mishra T., Pal M., Meena S., Datta D., Dixit P., Kumar A., Meena B., Rana T.S., Upreti D.K. Composition and in vitro cytotoxic activities of essential oil of Hedychium spicatum from different geographical regions of western Himalaya by principal components analysis. Nat. Prod. Res. 2016;30(10):1224–1227. doi: 10.1080/14786419.2015.1049176. [DOI] [PubMed] [Google Scholar]
- 9.Ray A., Jena S., Kar B., Sahoo A., Panda P.C., Nayak S., Mahapatra N. Volatile metabolite profiling of ten Hedychium species by gas chromatography mass spectrometry coupled to chemometrics. Ind. Crop. Prod. 2018;126:135–142. [Google Scholar]
- 10.Rawat S., Jugran A.K., Bhatt I.D., Rawal R.S. Hedychium spicatum: a systematic review on traditional uses, phytochemistry, pharmacology and future prospectus. J. Pharm. Pharmacol. 2018;70(6):687–712. doi: 10.1111/jphp.12890. [DOI] [PubMed] [Google Scholar]
- 11.Dixit V.K., Varma K.C. Anthelmintic properties of essential oils from rhizomes of Hedychium coronarium Koeing and Hedychium spicatum Koeing. Indian J. Pharm. 1976;37:143–144. [Google Scholar]
- 12.Jadhav V., Kore A., Kadam V.J. In-vitro pediculicidal activity of Hedychium spicatum essential oil. Fitoterapia. 2007;78(7–8):470–473. doi: 10.1016/j.fitote.2007.02.016. [DOI] [PubMed] [Google Scholar]
- 13.Joshi S., Chanotiya C.S., Agarwal G., Prakash O., Pant A.K., Mathela C.S. Terpenoid compositions, and antioxidant and antimicrobial properties of the rhizome essential oils of different Hedychium species. Chem. Biodivers. 2008;5:299–309. doi: 10.1002/cbdv.200890027. [DOI] [PubMed] [Google Scholar]
- 14.Koundal R., Rawat K., Agnihotri V.K., Meena R.L., Gopichand, Singh R.D., Padwad Y.S. Temporal and spatial variation in quality of essential oil of Hedychium spicatum and evaluation of its antioxidant activity. J. Essent. Oil Res. 2015;27(3):217–224. [Google Scholar]
- 15.Tavares W.R., Barreto M.D.C., Seca A.M. Uncharted source of medicinal products: the case of the Hedychium genus. Medicines. 2020;7(5):23. doi: 10.3390/medicines7050023. [DOI] [PMC free article] [PubMed] [Google Scholar]
- 16.European Pharmacopoeia. sixth ed. Council of Europe; Strasbourg: 2008. [Google Scholar]
- 17.Adams R.P. vol. 456. Allured publishing corporation; Carol Stream: 2007. pp. 544–545. (Identification of Essential Oil Components by Gas Chromatography/mass Spectrometry). [Google Scholar]
- 18.Sharma M., Agrawal S.K., Sharma P.R., Chadha B.S., Khosla M.K., Saxena A.K. Cytotoxic and apoptotic activity of essential oil from Ocimum viride towards COLO 205 cells. Food Chem. Toxicol. 2010;48(1):336–344. doi: 10.1016/j.fct.2009.10.021. [DOI] [PubMed] [Google Scholar]
- 19.Lebanov L., Tedone L., Kaykhaii M., Linford M.R., Paull B. Multidimensional gas chromatography in essential oil analysis. Part 1: technical developments. Chromatographia. 2019;82(1):377–398. [Google Scholar]
- 20.Raina A.P., Negi K.S. Essential oil composition of Hedychium spicatum Buch.-Ham. ex Smith. From Uttarakhand, India. J. Essent. Oil-Bear. Plants. 2015;18(2):382–388. [Google Scholar]
- 21.Zhang Z., Guo S., Liu X., Gao X. Synergistic antitumor effect of α-pinene and β-pinene with paclitaxel against non-small-cell lung carcinoma (NSCLC) Drug Res. 2015;65(4):214–218. doi: 10.1055/s-0034-1377025. [DOI] [PubMed] [Google Scholar]
- 22.Rahaman A., Chaudhuri A., Sarkar A., Chakraborty S., Bhattacharjee S., Mandal D.P. Eucalyptol targets PI3K/Akt/mTOR pathway to inhibit skin cancer metastasis. Carcinogenesis. 2022;43(6):571–583. doi: 10.1093/carcin/bgac020. [DOI] [PubMed] [Google Scholar]
- 23.Sun X.B., Wang S.M., Li T., Yang Y.Q. Anticancer activity of linalool terpenoid: apoptosis induction and cell cycle arrest in prostate cancer cells. Trop. J. Pharmaceut. Res. 2015;14(4):619–625. [Google Scholar]
- 24.Kig C., Mertoglu E., Caliskan A., Hincal Agus H., Onay Ucar E., Guler V. Selective and oxidative stress-mediated cell death of MCF-7 cell line induced by terpinolene. Biologia. 2021;76(9):2757–2766. [Google Scholar]
- 25.Tolosa L., Donato M.T., Gómez-Lechón M.J. Humana Press; New York, NY: 2015. General Cytotoxicity Assessment by Means of the MTT Assay; pp. 333–348. (Protocols in in Vitro Hepatocyte Research). [DOI] [PubMed] [Google Scholar]
- 26.Mitić-Ćulafić D., Žegura B., Nikolić B., Vuković-Gačić B., Knežević-Vukčević J., Filipič M. Protective effect of linalool, myrcene and eucalyptol against t-butyl hydroperoxide induced genotoxicity in bacteria and cultured human cells. Food Chem. Toxicol. 2009;47(1):260–266. doi: 10.1016/j.fct.2008.11.015. [DOI] [PubMed] [Google Scholar]
- 27.Tian M., Wu X., Lu T., Zhao X., Wei F., Deng G., Zhou Y. Phytochemical analysis, antioxidant, antibacterial, cytotoxic, and enzyme inhibitory activities of Hedychium flavum rhizome. Front. Pharmacol. 2020;11 doi: 10.3389/fphar.2020.572659. [DOI] [PMC free article] [PubMed] [Google Scholar]
- 28.Johnstone R.W., Ruefli A.A., Lowe S.W. Apoptosis: a link between cancer genetics and chemotherapy. Cell. 2002;108(2):153–164. doi: 10.1016/s0092-8674(02)00625-6. [DOI] [PubMed] [Google Scholar]
- 29.Franken N.A., Rodermond H.M., Stap J., Haveman J., Van Bree C. Clonogenic assay of cells in vitro. Nat. Protoc. 2006;1(5):2315–2319. doi: 10.1038/nprot.2006.339. [DOI] [PubMed] [Google Scholar]
- 30.Nunez J.G., Pinheiro J.S., Padilha G.L., Garcia H.O., Porta V., Apel M.A., Bruno A.N. Antineoplastic potential and chemical evaluation of essential oils from leaves and flowers of Tagetes ostenii Hicken. An. Acad. Bras. Cienc. 2020;92 doi: 10.1590/0001-3765202020191143. [DOI] [PubMed] [Google Scholar]
- 31.Schultz D.R., Harringto W.J., Jr. Apoptosis: programmed cell death at a molecular level. Semin. Arthritis Rheum. 2003;32(6):345–369. doi: 10.1053/sarh.2003.50005. (WB Saunders) [DOI] [PubMed] [Google Scholar]
- 32.Demchenko A.P. Beyond annexin V: fluorescence response of cellular membranes to apoptosis. Cytotechnology. 2013;65(2):157–172. doi: 10.1007/s10616-012-9481-y. [DOI] [PMC free article] [PubMed] [Google Scholar]
- 33.Lawry J. Humana Press; 2004. Detection of Apoptosis by the TUNEL Assay; pp. 183–190. (Cancer Cell Culture). [Google Scholar]
- 34.Li P., Zhou L., Zhao T., Liu X., Zhang P., Liu Y., Zheng X., Li Q. Caspase-9: structure, mechanisms and clinical application. Oncotarget. 2017;8(14) doi: 10.18632/oncotarget.15098. [DOI] [PMC free article] [PubMed] [Google Scholar]
- 35.Helton E.S., Chen X. p53 modulation of the DNA damage response. J. Cell. Biochem. 2007;100(4):883–896. doi: 10.1002/jcb.21091. [DOI] [PubMed] [Google Scholar]
- 36.Gartel A.L., Tyner A.L. The role of the cyclin-dependent kinase inhibitor p21 in apoptosis. Mol. Cancer Therapeut. 2002;1(8):639–649. [PubMed] [Google Scholar]
Associated Data
This section collects any data citations, data availability statements, or supplementary materials included in this article.
Data Availability Statement
Data will be made available on request.