

Summary
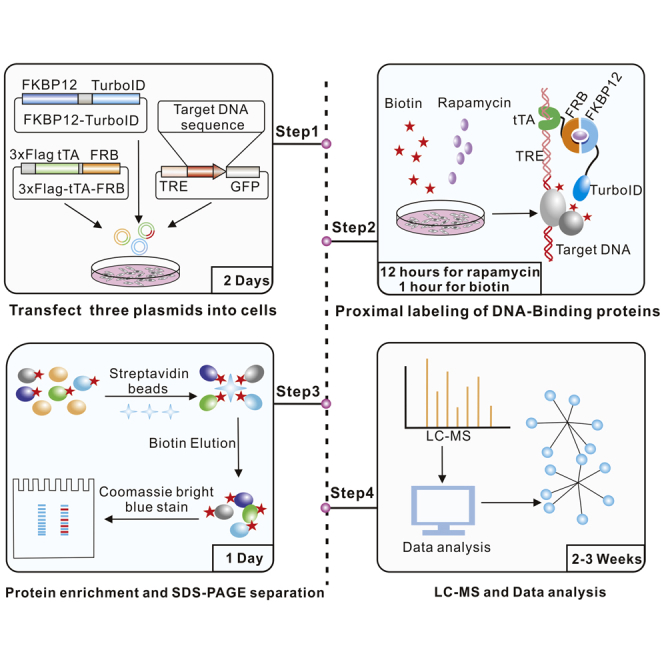
Biotin proximity labeling is a technique based on the TurboID enzyme that can be used to capture weak or dynamic interactions that had previously not been used to map proteins interacting with a specific DNA sequence. Here, we present a protocol for identifying specific DNA-sequence-binding proteins. We describe steps for biotin labeling of DNA-binding proteins, protein enrichment and sodium dodecyl sulfate polyacrylamide gel electrophoresis separation, and proteomic analysis.
For complete details on the use and execution of this protocol, please refer to Wei et al. (2022).1
Subject areas: Molecular/Chemical Probes, Protein Biochemistry, Proteomics, Mass Spectrometry
Graphical abstract
Highlights
-
•
A TurboID-based proximity labeling method to identify DNA-binding proteins
-
•
Rapamycin controls are required to generate specific proximity proteomes
-
•
A step-by-step TurboID protocol from plasmids design to protein identification
Publisher’s note: Undertaking any experimental protocol requires adherence to local institutional guidelines for laboratory safety and ethics.
Biotin proximity labeling is a technique based on the TurboID enzyme that can be used to capture weak or dynamic interactions that had previously not been used to map proteins interacting with a specific DNA sequence. Here, we present a protocol for identifying specific DNA-sequence-binding proteins. We describe steps for biotin labeling of DNA-binding proteins, protein enrichment and sodium dodecyl sulfate polyacrylamide gel electrophoresis separation, and proteomic analysis.
Before you begin
The protocol below describes the steps for identifying DNA-binding proteins in vitro/in cell culture. We have carried out the protocol to interrogate host factors binding with HBV core promoter. Using this strategy, we identified STAU1 as an important factor interacting with HBV core promoter.1
We have designed a proximity-labeling method based on TurboID enzyme2 for detecting binding proteins of specific DNA sequences. Firstly, we took advantage of the high affinity between the tetracycline response element (TRE) sequence and tetracycline-repressible transcriptional activator (tTA) protein,3,4 and placed the TRE sequence beside the specific DNA sequence. Secondly, we fused FKBP12/FRB, a binding pair which is easily regulated by rapamycin,5,6 to the TurboID and tTA proteins, respectively. In the presence of rapamycin, TurboID can be recruited to the TRE sequence and label neighboring proteins with biotin, and the biotinylated proteins can then be detected by LC-MS.
Taking the identification of HBV core promoter-binding proteins as an example, this protocol describes in detail how to identify DNA-binding proteins.
Plasmid construction
Timing: 1–2 weeks
Golden Gate Assembly provides a seamless and orderly strategy to clone multiple DNA fragments into a mammalian expression vector (Figure 1).7 In this protocol, all the plasmids were constructed through the Golden Gate Assembly based on the backbone of plasmid pCH9/3091 (Figure 2).8
Note: In this protocol, we chose the method of Golden Gate Cloning for plasmids construction, which has the advantages of seamless cloning, directed assembly of multi-fragments, and digestion and ligation in one tube. The plasmid map and sequence of pCH9/3091 can be obtained in the Figure S1 and Table S1. Other cloning methods and plasmid vectors can also be applied to the plasmid construction of this protocol.
-
1.Construction of the pTRE-pCore plasmid.
-
a.Synthesize the fusion sequence of TRE-PCORE (pCore: HBV core promoter sequence 1450-1850)).Note: We ordered the gene fragment from Tsingke Biotechnology (https://tsingke.com.cn/).
-
b.Amplify the GFP sequence from the plasmid of pEGFP-N1 by PCR reaction.
-
c.Amplify the vector sequence (the CMV promoter and HBV1.1 sequence were excluded) from the plasmid of pCH9/3091 by PCR reaction.Note: The details of sequences amplification are provided in steps 1 and 2.
-
d.Combine the fusion sequence of TRE-PCORE, and the sequence of GFP and the sequence of vector by Golden Gate Cloning method to form plasmid of pTRE-pCore. This plasmid was constructed based on plasmid pCMV-GFP by replacing the CMV-IE promoter with a fusing sequence of the TRE sequence and the HBV core promoter.Note: The HBV core promoter sequence can be replaced with various DNA sequences of interest.
-
a.
-
2.Construction of the 3×FLAG-tTA-FRB plasmid.
-
a.Synthesize the fusion sequence of 3×FLAG-tTA-FRB.Note: We ordered the fusion sequence from Tsingke Biotechnology (https://tsingke.com.cn/).
-
b.Amplify the vector sequence (the HBV1.1 sequence were excluded) from the plasmid of pCH9/3091 by PCR.Note: The condition and method for PCR are detailed in steps 1 and 2.
-
c.Link the fusion sequence of 3×FLAG-tTA-FRB with the sequence of vector by Golden Gate Cloning method to form plasmid of 3×FLAG-tTA-FRB. This plasmid is intended to express the fusion protein 3×FLAG-tTA-FRB, which is expected to bind to the TRE sequence via the tTA domain and recruit FKBP12-TurboID by the FRB domain.
-
a.
-
3.Construction of the pFKBP12-TurboID plasmid.
-
a.Synthesize the fusion sequence of FKBP12-TurboID.Note: We ordered the fusion sequence from Tsingke Biotechnology (https://tsingke.com.cn/).
-
b.Amplify the vector sequence (the HBV1.1 sequence were excluded) from the plasmid of pCH9/3091 by PCR.Note: The condition and method for PCR are detailed in steps 1 and 2.
-
c.Link the fusion sequence of FKBP12-TurboID with the sequence of vector by Golden Gate Cloning method to form plasmid of pFKBP12-TurboID. The FKBP-TurboID fusion protein expressed from this plasmid is expected to bind to the TRE-binding 3×FLAG-tTA-FRB, positioning the TurboID domain near to the pCore sequence.
-
a.
-
4.
Sequence the three plasmids using the sequence primers (R sv40 and F CMV).
-
5.
Store the plasmids at −20°C before experiments.
Figure 1.

Schematic illustration of Golden Gate Reaction
Schematic illustration of DNA fragments design and Golden Gate Reaction. BsmBI, a type IIS restriction enzyme that cuts DNA outside of its recognition site (CGTCTC). T7 DNA Ligase is an ATP-dependent dsDNA ligase from bacteriophage, and it can ligase cohesive-end DNA fragments.
Figure 2.

Establishment of a TurboID-based proximity labeling system
(A) Strategy of the screening system for mapping DNA-binding proteins of the HBV core promoter sequence.
(B–D) Structure of plasmids pTRE-pCore, 3×FLAG-tTA-FRB and FKBP12-TurboID.
Culture and seed HepG2 cells
-
6.
Culture HepG2 cells in a 10-cm dish with DMEM medium at 37°C under 5% CO2.
Note: Any cell line can be used. Here, we selected a hepatoma cell line (HepG2) that can support HBV replication in order to identify the host factors associated with HBV core promoter transcription.
CRITICAL: Supplement DMEM medium with 10% fetal bovine serum, 100 U/mL penicillin, and 100 mg/mL streptomycin.
-
7.
When HepG2 cells were 90%–100% confluent, remove the culture medium and wash the cells once with 5 mL 1× PBS.
-
8.
Add 1 mL of 0.25% (1×) Trypsin solution to the dish and place the dish in an CO2 cell incubator for digestion about 3 min at 37°C.
-
9.
Add 2 mL of DMEM medium supplemented with 10% fetal bovine serum to inactivate the trypsin. Collect the medium containing cells in a 15 mL tube, and spin the cells down at 500 g for 3 min at room temperature.
-
10.
Seed approximately 5 × 10⁶ HepG2 cells into a 10-cm dish in 10 mL culture medium before transfection.
Note: In transfection, the density of cells should reach 90%, in which case, the highest transfection efficiency will be achieved.
Key resources table
| REAGENT or RESOURCE | SOURCE | IDENTIFIER |
|---|---|---|
| Antibodies | ||
| Flag Tag antibody mouse | Sigma-Aldrich | Cat#P2983;RRID: AB_439685 |
| GAPDH Mouse Monoclonal Antibody | Beyotime | Cat#AG019;RRID: AB_2861160 |
| Streptavidin-HRP antibody | Cell Signaling Technology | Cat#3999;RRID: AB_10830897 |
| Bacterial and virus strains | ||
| DH5α chemically competent cell | TSINGKE | Cat#TSC-C01 |
| Chemicals, peptides, and recombinant proteins | ||
| DTT | Thermo Scientific | Cat#D1532 |
| ATP | New England Biolabs | Cat#P0756S |
| Tango buffer (10×) | Thermo Scientific | Cat#BY5 |
| BsmbI-V2 | New England Biolabs | Cat#R0739S |
| T7 DNA ligase | New England Biolabs | Cat#M0318S |
| PrimeSTAR Max DNA Polymerase | TAKARA | Cat#R045B |
| Collagen I, rat tail | BD BIOCOAT | Cat#354236 |
| Biotin | Sigma-Aldrich | Cat#B4501 |
| Protease inhibitor cocktail | Sigma-Aldrich | Cat#P8340 |
| RIPA | Beyotime | Cat#P0013C |
| Rapamycin | Solarbio | Cat#IR0010 |
| Tris | Solarbio | Cat#T8060 |
| Glycine | Solarbio | Cat#G8200 |
| SDS | Solarbio | Cat#S8010 |
| Urea | Sangon Biotech | Cat#A600148 |
| KCl | Sangon Biotech | Cat#A100395 |
| Na2CO3 | Sangon Biotech | Cat#A100585 |
| Methanol | Sangon Biotech | Cat#A601617 |
| NaCl | Sangon Biotech | Cat#A501218 |
| 20×TBS | Sangon Biotech | Cat#B548105 |
| Tween 20 | Sangon Biotech | Cat#A100777 |
| Antibody dilution buffer | Beyotime | Cat#P0256 |
| DEPC H2O | Sangon Biotech | Cat#B501005 |
| DMEM (high glucose) (Dulbecco’s Modified Eagle Medium) | Gibco | Cat#11995065 |
| PBS | Gibco | Cat#10010023 |
| Trypsin-EDTA (0.25% Trypsin, EDTA·4Na) (1×) | Gibco | Cat#25200056 |
| Opti-MEM medium | Gibco | Cat#31985070 |
| Critical commercial assays | ||
| 10-cm dish | Corning | Cat#354469 |
| 12-well plate | Corning | Cat#353503 |
| 6-well plate | Corning | Cat#354721 |
| Streptavidin-coated magnetic beads | Thermo Scientific | Cat#88817 |
| Lipofectamine 3000 Transfection Reagent | Thermo Scientific | Cat#L3000015 |
| QIAquick Gel Extraction Kit | QIAGEN | Cat#28704 |
| Endotoxin-free plasmid extraction kit | TIANGEN | Cat#DP118 |
| Experimental models: Cell lines | ||
| HepG2 | ATCC | Cat#HB-8065 |
| Oligonucleotides | ||
| R SV40 | CTCACCCGGGAAGATACATTGA | |
| F CMV | CGCAAATGGGCGGTAGGCGTG | |
| Recombinant DNA | ||
| Plasmid pCH9/3091 (HBV1.1) | In-house | N/A |
| Plasmid pEGFP-N1 | Addgene | Cat#172281 |
| Other | ||
| CO2 cell incubator (Heracell VIOS 160i) | Thermo Scientific | Cat#50145502 |
Materials and equipment
Below are recipes to prepare solutions needed for this protocol
PCR reaction mix
| Reagent | Final concentration | Amount |
|---|---|---|
| Forward primer (10 μM) | 0.2 μM | 0.4 μL |
| Reverse primer (10 μM) | 0.2 μM | 0.4 μL |
| Template | 1–100 ng/μL | 0.4 μL |
| PrimeSTAR Mix (2×) | 1× | 10 μL |
| ddH2O | N/A | 8.8 μL |
| Total | N/A | 20 μL |
Note: PrimeSTAR Mix, primers and templates need to be stored at −20°C for a year.
Golden Gate Cloning mix
| Reagent | Final concentration | Amount |
|---|---|---|
| Tango buffer (10×) | 1× | 1 μL |
| DDT (100 μM) | 10 μM | 1 μL |
| ATP (10 mM) | 1 mM | 1 μL |
| BsmBI-V2(10units/μL) | 0.75 units | 0.75 μL |
| T7 DNA Ligase (3,000 units/μL) | 75 units | 0.25 μL |
| Fragment (variable region) | 40 ng | 1 μL |
| Fragment (constant region) | 40 ng | 1 μL |
| ddH2O | N/A | 4 μL |
| Total | N/A | 10 μL |
Note: Golden Gate Cloning mix should be prepared freshly. These enzymes, DTT, ATP as well as DNA fragments need to be stored at −20°C about 1 year. Avoid multiple freeze-thaw cycles of ATP and DTT.
1 × SDS-Running buffer
| Reagent | Final concentration | Amount |
|---|---|---|
| Tris | 25 mM | 3.03 g |
| Glycine | 200 mM | 15 g |
| SDS | 0.1% | 1 g |
| ddH2O | N/A | 1 L |
| Total | N/A | 1 L |
Note: The buffer can be stored at 4°C–25°C for about a year. The SDS, Glycine and TRIS powder preparations should be stored away from direct sunlight.
1 × Transfer buffer
| Reagent | Final concentration | Amount |
|---|---|---|
| Tris | 25 mM | 3.03 g |
| Glycine | 200 mM | 15 g |
| Methanol | 20% | 200 mL |
| ddH2O | N/A | N/A |
| Total | N/A | 1 L |
Note: Store at 4°C for about a year. Add methanol just before use. The methanol solution should be stored protected from light and at room temperature.
20 × Tris-buffered saline (TBS)
| Reagent | Final concentration | Amount |
|---|---|---|
| Tris, pH 7.6 | 400 mM | 48.45 g |
| NaCl | 3 M | 175.32 g |
| ddH2O | N/A | N/A |
| Total | N/A | 1 L |
Note: Store at 4°C–25°C for about a year.
Tris-buffered saline with Tween 20 (TBS-T)
| Reagent | Final concentration | Amount |
|---|---|---|
| 20×TBS | 1× | 50 mL |
| Tween 20 | 0.1% | 1 mL |
| ddH2O | N/A | 950 mL |
| Total | N/A | 1 L |
Note: Store at 4°C–25°C for about a year. When the solution becomes cloudy or crystal precipitated, the fresh solution should be prepared.
Step-by-step method details
Plasmid cloning
The cloning is performed by DNA fragments amplification, gel extraction, Golden Gate cloning, transformation, and plasmid purification.
-
1.
Prepare the PCR reaction mix. Add primers and template into PCR reaction mix. Shock the PCR tube and mix evenly.
-
2.
Set up the PCR as follows:
| Step | Temperature | Time | Cycle |
|---|---|---|---|
| Pre-denaturation | 95°C | 3 min | 1 |
| Denaturation | 95°C | 15 s | 35 cycles |
| Annealing | 55°C | 15 s | |
| Extension | 72°C | 1 min | |
| Extension | 72°C | 3 min | 1 |
| Hold | 4°C | Forever |
-
3.
Electrophorese the PCR products in a 1% agarose gel at 120 V about 30 min.
-
4.
Image the gel on a blue light gel imager and excise the bands of interest with a sharp blade.
Note: When using the blue light imager, attention should be taken to protect your eyes from UV light.
-
5.
Purify the gel strips using QIAquick Gel Extraction Kit according to manufacturer’s instructions.
-
6.
Measure/estimate the concentration of the DNA fragments by a NanoDrop 2000 (Thermo Fisher).
Note: Other nucleic acid quantitative spectrophotometers can also be used. When using Nanodrop to detect DNA concentration, the peak UV absorption A260 / A280 ratio in the resulting parameters should be between 1.8 and 2.0, and the ratio of A260 / A230 ratio should be about 2.0.
-
7.
Add the DNA fragments and enzymes into the Golden Gate Cloning mix.
-
8.
Set up Golden Gate cloning system in PCR tubes, mix thoroughly and spin quickly by a MiniSpin Centrifuge (Eppendorf).
-
9.
Set up the Golden Gate reaction as follows:
| Step | Temperature | Time | Cycle |
|---|---|---|---|
| Digestion | 37°C | 4 min | 20 cycles |
| Ligation | 25°C | 4 min | |
| Denaturation | 80°C | 20 min | 1 |
| Hold | 4°C |
-
10.
Add 2–10 μL of Golden Gate product to 100 μL DH5α Chemically Competent Cells.
-
11.
Incubate the mix on ice for 20 min.
-
12.
Heat shock cells at 42°C for 45 s, and then place on ice for 3 min.
-
13.
Add 200 μL LB medium to cells and incubate at 37°C for 1 h.
-
14.
Plate cells onto LB agar plates with 100 mg/mL ampicillin (Ampicillin is the selection marker), and incubate the plates at 37°C for 14–16 h. Troubleshooting 1.
Note: Ampicillin is the selection marker for the screening of positive clones.
-
15.
Pick single clone into LB medium with 100 mg/mL ampicillin, and culture for 14–16 h.
-
16.
Purify plasmids from the medium using the kits following manufacturer’s recommendation.
Note: The plasmid extracted in this step will undergo cell transfection experiments, so we used an endotoxin-free plasmid extraction kit from TIANGEN. Other brands of endotoxin-free plasmid extraction kits can also be used.
-
17.
Sequence the plasmids and store the clones at −20°C.
Pause point: The plasmids can be stored at −80°C for at least one year.
Determine the concentrations of biotin and rapamycin
In this protocol, HepG2 cell line was used which supported HBV replication and is suitable for searching HBV transcription-related factors. The selection of cell lines depends on experimental purposes. It is necessary to experimentally determine the concentration and incubation time of biotin and rapamycin before the experiments. This section consists two steps: determining the treatment conditions of biotin, and determining the treatment conditions of rapamycin.
-
18.
Seed HepG2 cells into a 12-well plate at a density of 5 × 10⁵ cells using an automatic cell counter (Bio-Rad TC20), to achieve optimal cell density (80%–90%) at the time of transfection.
-
19.
Add the plasmid FKBP12-TurboID and lipo8000 transfection reagent into the 1.5 mL EP tube which containing Opti-MEM medium following manufacturer’s instructions, mix them gently with a pipette, incubate at room temperature for 10–20 min, and then add the mixture into cells.
-
20.
Remove the old medium and pipette 1 mL of fresh medium into cells at 12 h after transfection, and then culture the cells for another 48 h.
Note: Because the transfection efficiency of HepG2 cells is relatively low, we collected the cells at 48 h after transfection, in order to increase the expression of exogenous protein. When a cell line with a high efficiency, such as HEK293 cell line, is used, cells can be collected at 24 h after transfection.
-
21.
Incubate the cells with biotin at different concentrations for various periods of time post 48 h transfection.
-
22.
Transfer the cells onto ice to stop the biotin labeling reaction.
-
23.
Wash cells with ice-cold 1× PBS three times, 10 mL PBS each time.
-
24.
Add 200 μL cold RIPA buffer into each well, and lyse cells on ice for 20 min.
-
25.
Clarify the lysate by spinning at 12,000 × g for 10 min at 4°C, and collect the supernatant into new 1.5 mL centrifuge tubes for western blotting.
-
26.
Seed HepG2 cells into a 6-well plate at a density of 1 × 10⁶ cells, to achieve optimal cell density (80%–90%) at the time of transfection.
-
27.
Co-transfect the plasmids 3×FLAG-tTa-FRB and FKBP12-TurboID into HepG2 cells.
-
28.
Twenty-four hours post-transfection, incubate cells with rapamycin (the final concentration of 200 nM) for different periods. The time intervals were set as follows: 0 h, 1 h, 6 h, 12 h, 36 h, and 48 h.
-
29.
Incubate cells with biotin (the final concentration of 500 μM) at 37°C for 1 h.
-
30.
Terminate the biotin labeling reaction by transferring the cells to ice and washing three times with ice-cold PBS.
-
31.
Lyse the cells with 500 μL RIPA lysis buffer for 20 min at 4°C, and collect the cellular debris into 1.5 mL tubes.
-
32.
Centrifuge the lysate mixture at 12,000 × g for 10 min at 4°C, and transfer the suspension to new tubes.
-
33.
Prepare streptavidin-coated magnetic beads. Add 30 μL magnetic beads to each tube, wash with RIPA buffer three times, and place on ice for later use.
-
34.
Add the cellular suspension into the tubes containing streptavidin-coated magnetic beads, and shake the tubes on a Rotator (SI, America) overnight at 4°C.
Note: This step is a general guideline and needs to be optimized for particular applications. In our case, all the cell lysates were added to the magnetic beads to maximize the yield, considering the low level of exogenous protein expression due to the low transfection efficiency of HepG2 cells. The amount of cell lysates can be adjusted according to the expression levels of different cell lines.
-
35.
Collect the magnetic beads with magnetic racks and then remove the supernatant.
-
36.
Wash the beads twice with 800 μL RIPA buffer at 4°C, for 10 min each time.
-
37.
Wash the beads once with 1 M KCl and 0.1 M Na2CO3 for 10 min at 4°C, respectively.
-
38.
Wash the beads once with 2 M Urea (dissolved in 10 mM Tris-HCl, pH = 8.0) for 10 min at 4°C.
-
39.
Add 50 μL loading buffer into the beads, boil the buffer at 100°C for 20 min in a water bath to elute the biotinylated proteins.
-
40.
Collect the elution for western blotting.
Identify proteins binding to the specific DNA sequence by western blot and LC-MS
After determining the concentration and incubation time of biotin and rapamycin, these conditions can be used to identify proteins that bind to a particular DNA sequence. It mainly includes two steps: western blot analysis for detecting biotinylated proteins, and Coomassie brilliant blue staining for LC-MS analysis.
-
41.
Load protein samples into the lanes of the SDA-PAGE gel and electrophorese at 120 V for 90 min, or until the bromophenol blue dye reaches the gel-front.
-
42.
Prepare pre-cold 1×Transfer buffer and PVDF membrane (a pore size of 0.45 μM), and transfer protein onto PVDF membrane using wet transfer method. Electrophorese at 200 mA for 90 min at 4°C or on ice.
-
43.
Block the membranes in the blocking buffer for 1 h at room temperature or at 4°C for 16 h.
Note: The blocking buffer was prepared by adding 1 g of non-fat powdered milk into 20 mL of 1×TBST solution and mixing it well.
-
44.
Incubate the membrane with streptavidin-HRP antibody (1:1,000 dilution in Antibody Dilution Buffer) for 1 h at room temperature or at 4°C for 16 h.
-
45.
Wash the membranes three times with TBST, 10 min for each washing.
-
46.
Prepare and add 2 mL ECL substrate (mix solution A and solution B) onto the membranes, and expose the membranes with an imaging system such as a BIO-RAD Imager (ChemiDoc Touch). Troubleshooting 2.
Note: This ECL reagent should be stored at 4°C and protected from light.
-
47.
Seed HepG2 cells into a 10-cm dish at a density of 5 × 10⁶ cells, to achieve optimal cell density (80%–90%) at the time of transfection. Co-transfect the plasmids pTRE-pCore, 3×FLAG-tTA-FRB and FKBP12-TurboID (3 μg of each plasmid) into HepG2 cells.
-
48.
After 48 h, incubate the cells of the experimental group with 200 nM rapamycin for 12 h at 37°C, and incubate the cells of control group with DMSO (Figure 4A).
-
49.
Label proteins with 500 μM biotin for 1 h at 37°C.
-
50.
Transfer the cells to ice to stop the reaction, and wash the cells with ice-cold PBS.
-
51.
Extract and purify the biotinylated proteins following steps from 32 to 41.
-
52.
Load the elution samples into the SDS-PAGE gels. Run the gels at 110 V when the protein maker was just separated (see Figure 3).
-
53.
Prepare Coomassie blue dye, containing 0.1% Coomassie R-250 in 40% ethanol and 10% acetic acid.
-
54.
Incubate the gels in the Coomassie dye buffer with heating in a microwave oven for 2–3 min.
Note: Staining the gel for 30–60 min at room temperature is also possible. Alternatively, other staining methods are also recommended, such as Colloidal Coomassie brilliant blue or water-soluble Coomassie-based dyes.
-
55.
Shake the gels for 30 min at room temperature for staining.
-
56.
Pour off the dye buffer and wash the gels with distilled water twice, for 5 min each, at room temperature.
-
57.
Prepare decolorization solution which contains 7.5% acetic acid and 10% ethanol.
-
58.
Wash the gels with decolorization solution at room temperature, repeatedly.
-
59.
Shake the gels with decolorization solution until the desired background achieved.
-
60.
Cut the gel strips under a white light. Troubleshooting 3.
-
61.
Put the gel strips in the EP tubes and send them to a service provider for LC-MS analysis. Troubleshooting 4.
Note: We send our samples to Applied Protein Technologies in China for the LC-MS analysis. Any other qualified service providers, however, would be acceptable.
-
62.
Analyze the results of LC-MS, and select the interesting protein for verification. Troubleshooting 5.
Figure 4.

Identification of proteins binding to the HBV core promoter sequence
(A) The flow-chart for screening transcription-related factors of the HBV core promoter.
(B) Optimization of biotin treatment. Plasmid FKBP12-TurboID was transfected into HepG2 cells. Effects of different biotin treatment conditions on the efficiency of biotinylated labeling of intracellular protein was analyzed 48 h post-transfection by western blot.
(C) Optimization of rapamycin treatment. Plasmids 3×FLAG-tTa-FRB and FKBP12-TurboID were co-transfected into HepG2 cells. Effects of different rapamycin-treatment periods on the labeling efficiency were assayed by pull-down experiments.
(D) Evaluation of the efficacy of the proximity labeling system. Different plasmids or DNA fragments were transfected into HepG2 cells with the indicated combinations and pull-down and western blot were conducted to evaluate the labeling efficiency.
(E) The results of LC-MS were shown.
Figure 3.
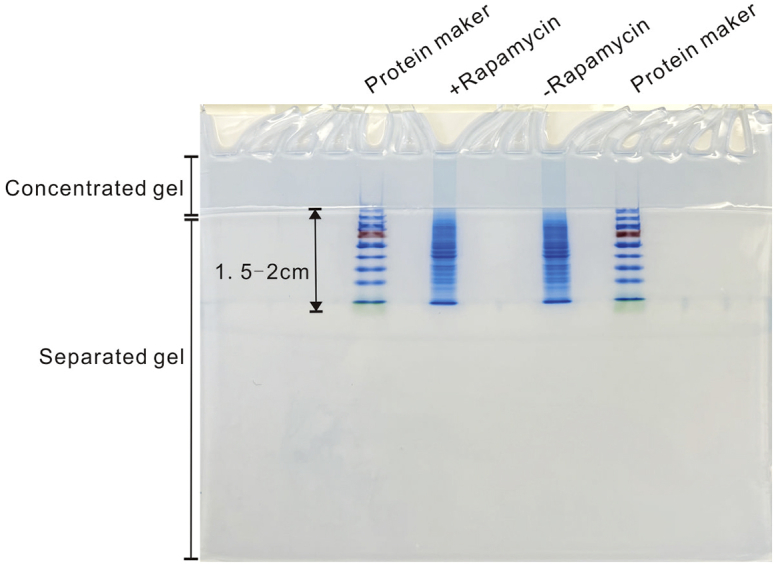
Coomassie blue staining results of SDS-PAGE gel for the LC-MS analysis
Expected outcomes
Successful proximity labeling based on TurboID to identify of DNA-binding proteins can be assessed by several factors.
Firstly, with the increase of biotin concentrations and incubation time, more biotinylated proteins can be detected in the western blot assay (Figure 4B). Secondly, the interaction between 3×FLAG-tTA-FRB and FKBP12-TurboID mediated by rapamycin results in biotinylated 3×FLAG-tTA-FRB. The amount of biotinylated 3×FLAG-tTA-FRB increases with the length of the rapamycin treatment (Figure 4C). Thirdly, the binding of 3×FLAG-tTA-FRB protein to the TRE sequence can be revealed by pull-down experiments, in which streptavidin-coated magnetic beads were used to capture 3×FLAG-tTA-FRB protein binding to a biotinylated TRE sequence (Figure 4D). Finally, those proteins identified by LC-MS in the rapamycin-treated samples but not in the control samples were candidates for further verification (Figure 4E).
Limitations
There are several limitations to this TurboID proximity labeling protocol for identifying DNA-binding proteins. First, the tTA-FRB binding to the TRE sequence and may affect the binding of candidate to the target DNA. Second, false negative results can occur when certain DNA-binding proteins are buried in protein complexes where the target residues are inaccessible. Third, false positive results can be reduced but not completely eliminated by using the rapamycin-negative control samples. Some of the identified proteins may still not interact with the target DNA directly or indirectly, and further experiments are required to confirm any of the interaction.
Troubleshooting
Problem 1
No or few clones grow in the plate for plasmid constructs (step 14).
Potential solution
-
•
Check the primers used for PCR to ensure that they are correctly designed.
Note: To avoid errors, primers can be designed and verified using software such as DNAMAN8 or SnapGene. Double check that the cohesive sequences retained after BsmbI digestion are correctly designed.
-
•
Adjust the Golden Gate reaction system or transformation conditions. For example, increase the amount of DNA fragments, or increase the concentration and time of action of BsmBI and T7 ligases. During transformation, increase the concentration of the competent cells or switch to other competent strain such as BL21 or Stbl3.
Problem 2
The biotin signal background is too weak or too strong during the western blot analysis. Significant non-specific binding was present in the controls after biotin pull-down assay (step 46).
Potential solution
-
•
Increase or decrease the biotin exposure time and concentration.
-
•
Optimize the amount of protein loaded onto the gel.
-
•
Extend or shorten the exposure time of PVDF membrane.
-
•
Check the quality of the HRP-conjugated streptavidin.
Note: Streptavidin (0.5 μg) can be separated by 15% SDS-PAGE, and the membrane can be decorated with HRP-conjugated streptavidin antibody diluted at 1:10000. Subsequently, use the ECL substrate was used to detect the HRP-conjugated primary antibody. Determine whether the antibody is effective according to the result. If the streptavidin protein can be detected effectively, then the quality of the antibody is deemed good.
Problem 3
On the Coomassie staining gel, the experimental group (with rapamycin) exhibits similar binds as those of the control group (step 60).
Potential solution
-
•
Replace Coomassie staining with a more sensitive method such as silver staining.
-
•
Optimize the ratio of cell lysate to the streptavidin beads.
-
•
Increase the washing times or increase the concentration of urea to 5 M to make the washing procedures more stringent.
Problem 4
Poor enrichment of biotinylated proteins in the biotin pull-down assay (step 61).
Potential solution
-
•
Increase the amount of streptavidin beads used in the enrichment step.
-
•
Improve the transfection efficiency or increase the amount of plasmids used in the transfection.
-
•
Optimize the concentration and exposure time of biotin and rapamycin.
Problem 5
In the LC-MS results, no proteins that had previously been discovered to bind the specific DNA were found (step 62).
Potential solution
-
•
The candidates identified are still worth further testing, since no method can probe all of the binding proteins of a specific DNA sequence.
-
•
Prepare multiple samples for the LC-MS analysis.
Problem 6
It is not clear whether the identified proteins bind to the DNA sequence in a direct or indirect manner.
Potential solution
Further experiments are required to confirm any of the interaction, such as EMSA assay or ChIP assay can be used to verify whether the protein is directly bound to the DNA sequence.
Resource availability
Lead contact
Further information and requests for resources and reagents should be directed to and will be fulfilled by the lead contact, Jie-li Hu (102564@cqmu.com).
Materials availability
The plasmids are available upon request to the lead contact. This study did not generate other unique reagents.
Acknowledgments
This work was supported by grants from the National Natural Science Foundation of China (81871635, 81671997, U20A20392, and 81902060), the Natural Science Foundation of Chongqing (cstc2021jcyj-msxmX0298, cstc2020jcyj-msxmX0764, and cstc2020jscx-dxwtBX0022), the 111 Project (no. D20028), Key Laboratory of Molecular Biology on Infectious Diseases, Ministry of Education, Chongqing Medical University (no. 202104), CQMU Program for Youth Innovation in Future Medicine (no. W0049), and the Talent Development Program of CQMU for Postgraduate (nos. BJRC201903).
Author contributions
Conceptualization, J.L.H., X.F.W.; experiment, X.F.W., S.L.; methodology, J.L.H., X.F.W.; writing – original draft, X.F.W.; writing – review & editing, J.L.H., X.F.W.
Declaration of interests
The authors declare no competing interests.
Footnotes
Supplemental information can be found online at https://doi.org/10.1016/j.xpro.2023.102139.
Contributor Information
Xia-fei Wei, Email: sofea909@163.com.
Jie-li Hu, Email: 102564@cqmu.edu.cn.
Supplemental information
Data and code availability
All data supporting the findings of this study are available within the paper. This paper does not report original code. Any additional information required to reanalyze the data reported in this paper is available from the lead contact upon request.
References
- 1.Wei X.F., Fan S.Y., Wang Y.W., Li S., Long S.Y., Gan C.Y., Li J., Sun Y.X., Guo L., Wang P.Y., et al. Identification of STAU1 as a regulator of HBV replication by TurboID-based proximity labeling. iScience. 2022;25:104416. doi: 10.1016/j.isci.2022.104416. [DOI] [PMC free article] [PubMed] [Google Scholar]
- 2.Branon T.C., Bosch J.A., Sanchez A.D., Udeshi N.D., Svinkina T., Carr S.A., Feldman J.L., Perrimon N., Ting A.Y. Efficient proximity labeling in living cells and organisms with TurboID. Nat. Biotechnol. 2018;36:880–887. doi: 10.1038/nbt.4201. [DOI] [PMC free article] [PubMed] [Google Scholar]
- 3.Baron U., Bujard H. Tet repressor-based system for regulated gene expression in eukaryotic cells: principles and advances. Methods Enzymol. 2000;327:401–421. doi: 10.1016/s0076-6879(00)27292-3. [DOI] [PubMed] [Google Scholar]
- 4.Furth P.A., St Onge L., Böger H., Gruss P., Gossen M., Kistner A., Bujard H., Hennighausen L. Temporal control of gene expression in transgenic mice by a tetracycline-responsive promoter. Proc. Natl. Acad. Sci. USA. 1994;91:9302–9306. doi: 10.1073/pnas.91.20.9302. [DOI] [PMC free article] [PubMed] [Google Scholar]
- 5.Chojnowski A., Sobota R.M., Ong P.F., Xie W., Wong X., Dreesen O., Burke B., Stewart C.L. 2C-BioID: an advanced two component BioID system for precision mapping of protein interactomes. iScience. 2018;10:40–52. doi: 10.1016/j.isci.2018.11.023. [DOI] [PMC free article] [PubMed] [Google Scholar]
- 6.Banaszynski L.A., Liu C.W., Wandless T.J. Characterization of the FKBP.rapamycin.FRB ternary complex. J. Am. Chem. Soc. 2005;127:4715–4721. doi: 10.1021/ja043277y. [DOI] [PubMed] [Google Scholar]
- 7.Engler C., Kandzia R., Marillonnet S. A one pot, one step, precision cloning method with high throughput capability. PLoS One. 2008;3:e3647. doi: 10.1371/journal.pone.0003647. [DOI] [PMC free article] [PubMed] [Google Scholar]
- 8.Nassal M. The arginine-rich domain of the hepatitis B virus core protein is required for pregenome encapsidation and productive viral positive-strand DNA synthesis but not for virus assembly. J. Virol. 1992;66:4107–4116. doi: 10.1128/jvi.66.7.4107-4116.1992. [DOI] [PMC free article] [PubMed] [Google Scholar]
Associated Data
This section collects any data citations, data availability statements, or supplementary materials included in this article.
Supplementary Materials
Data Availability Statement
All data supporting the findings of this study are available within the paper. This paper does not report original code. Any additional information required to reanalyze the data reported in this paper is available from the lead contact upon request.