

Abstract
Purpose:
To determine how subchondral bone microarchitecture is altered in patients with mild knee osteoarthritis.
Materials and Methods:
This study had Institutional Review Board approval. We recruited 24 subjects with mild radiographic knee osteoarthritis and 16 healthy controls. The distal femur was scanned at 7T using a high-resolution 3D FLASH sequence. We applied digital topological analysis to assess bone volume fraction, markers of trabecular number (skeleton density), trabecular network osteoclastic resorption (erosion index), plate-like structure (surface), rod-like structure (curve), and plate-to-rod ratio (surface-curve ratio). We used two-tailed t-tests to compare differences between osteoarthritis subjects and controls.
Results:
7T magnetic resonance imaging (MRI) detected deterioration in subchondral bone microarchitecture in both medial and lateral femoral condyles in osteoarthritis subjects as compared with controls. This was manifested by lower bone volume fraction (−1.03% to −5.43%, P<0.04), higher erosion index (+8.49 to +22.76%, P<0.04), lower surface number (−2.31% to −9.63%, P<0.007), higher curve number (+6.85% to +16.93%, P<0.03), and lower plate-to-rod ratio (−7.92% to −21.71%, P<0.05).
Conclusion:
The results provide further support for the concept that poor subchondral bone quality is associated with osteoarthritis and may serve as a potential therapeutic target for osteoarthritis interventions.
Keywords: osteoarthritis, 7T, bone microarchitecture, knee
OSTEOARTHRITIS is a degenerative joint disorder that causes pain, stiffness, and decreased mobility. It affects 46 million Americans (1), resulting in over 11 million medical office visits (2) and $127 billion in healthcare costs annually (3). There is no cure for osteoarthritis, and interventions are limited to pain control and ultimately joint replacement.
Although the hallmark of osteoarthritis is articular cartilage loss, abnormal subchondral bone also plays a key role in disease pathogenesis (4). In late-stage osteoarthritis, this manifests on radiographs as subchondral bone sclerosis and increased subchondral bone density. On the microarchitectural level, ex vivo studies have shown that subchondral bone sclerosis can be attributed to higher bone volume fraction, trabecular connectivity, and trabecular number (5–7). Because increased bone remodeling is responsible for these changes, drugs that inhibit bone remodeling, such as bisphosphonates, are being tested as therapies for osteoarthritis (8–10).
In early-stage osteoarthritis, the in vivo alterations in subchondral bone microarchitecture remain poorly understood. The goal of this study was to leverage the higher signal-to-noise ratio (SNR) provided by ultrahigh-field 7T magnetic resonance imaging (MRI) to image and quantitatively assess subchondral bone microarchitecture of the distal femur in subjects with mild knee osteoarthritis and healthy controls.
MATERIALS AND METHODS
Subject Recruitment
This study had Institutional Review Board approval, and we obtained written informed consent from all subjects. We recruited 24 subjects with mild osteoarthritis (graded by G.C., 3 years of experience as a musculoskeletal radiologist). The characteristics were: mean Kellgren-Lawrence grade within the medial compartment=1.56 ± 1.22, mean Kellgren-Lawrence grade within the lateral compartment=1.32 ± 1.62 (six subjects had Kellgren-Lawrence grade 3 in the lateral compartment), mean age=66.9 ± 10.1 years, mean body mass index=26.1 ± 10.4 kg/m2. We also recruited 16 healthy control subjects without knee pain or radiographic signs of osteoarthritis (mean age=38.6 ± 12.6 years, mean body mass Index=24.9 ± 4.2 kg/m2). We excluded patients with a history of obesity, inflammatory or crystalline arthritis, knee trauma, Paget’s disease, hyperparathyroidism, corticosteroid use, Crohn’s disease, or other nutritional, metabolic, or endocrinologic disorder that could affect the skeleton.
MRI Scanning
We scanned the distal femur (affected knee in osteoarthritis subjects, nondominant knee in control subjects) on a 7T whole-body MRI scanner (Siemens, Erlangen, Germany) using a 28-channel knee coil (Quality Electrodynamics, Mayfield Village, OH). We chose to scan the nondominant knee in control subjects because if there is preferential weight-bearing of the dominant lower extremity, then according to Wolff’s Law (11) there will be corresponding adaptations in bone structure, which may confound results. To limit the possibility of motion artifact, all subjects were made as comfortable as possible during the MRI scan and foam cushions were placed inside the coil to immobilize the knee. To image bone microarchitecture, we used a 3D fast low-angle shot (3D FLASH) sequence (TR/TE=20/5.1 msec, field of view [FOV]=120 mm, matrix=512 × 512, in-plane resolution 0.195 mm × 0.195 mm, slice thickness=1 mm, 80 axial images, generalized autocalibrating partially parallel acquisition [GRAPPA] parallel acceleration factor=2, scan time=7 min 9 sec).
Image Analysis
A musculoskeletal radiologist (G.C., 3 years of experience) selected a 10-mm-thick volume-of-interest (VOI) within the femoral condyles. We corrected for signal intensity variation across the FOV using a local thresholding approach (12). For each VOI, we generated a bone volume fraction (BVF) map by scaling voxel signal intensities from 0 to 100 (0=pure marrow, 100=pure bone). The BVF corresponds to the fractional occupancy of bone within a voxel. The VOIs were divided into the medial and lateral femoral condyles, and each condyle was divided into four subregions: anterolateral, anteromedial, posteromedial, and posterolateral (Fig. 1).
Figure 1.
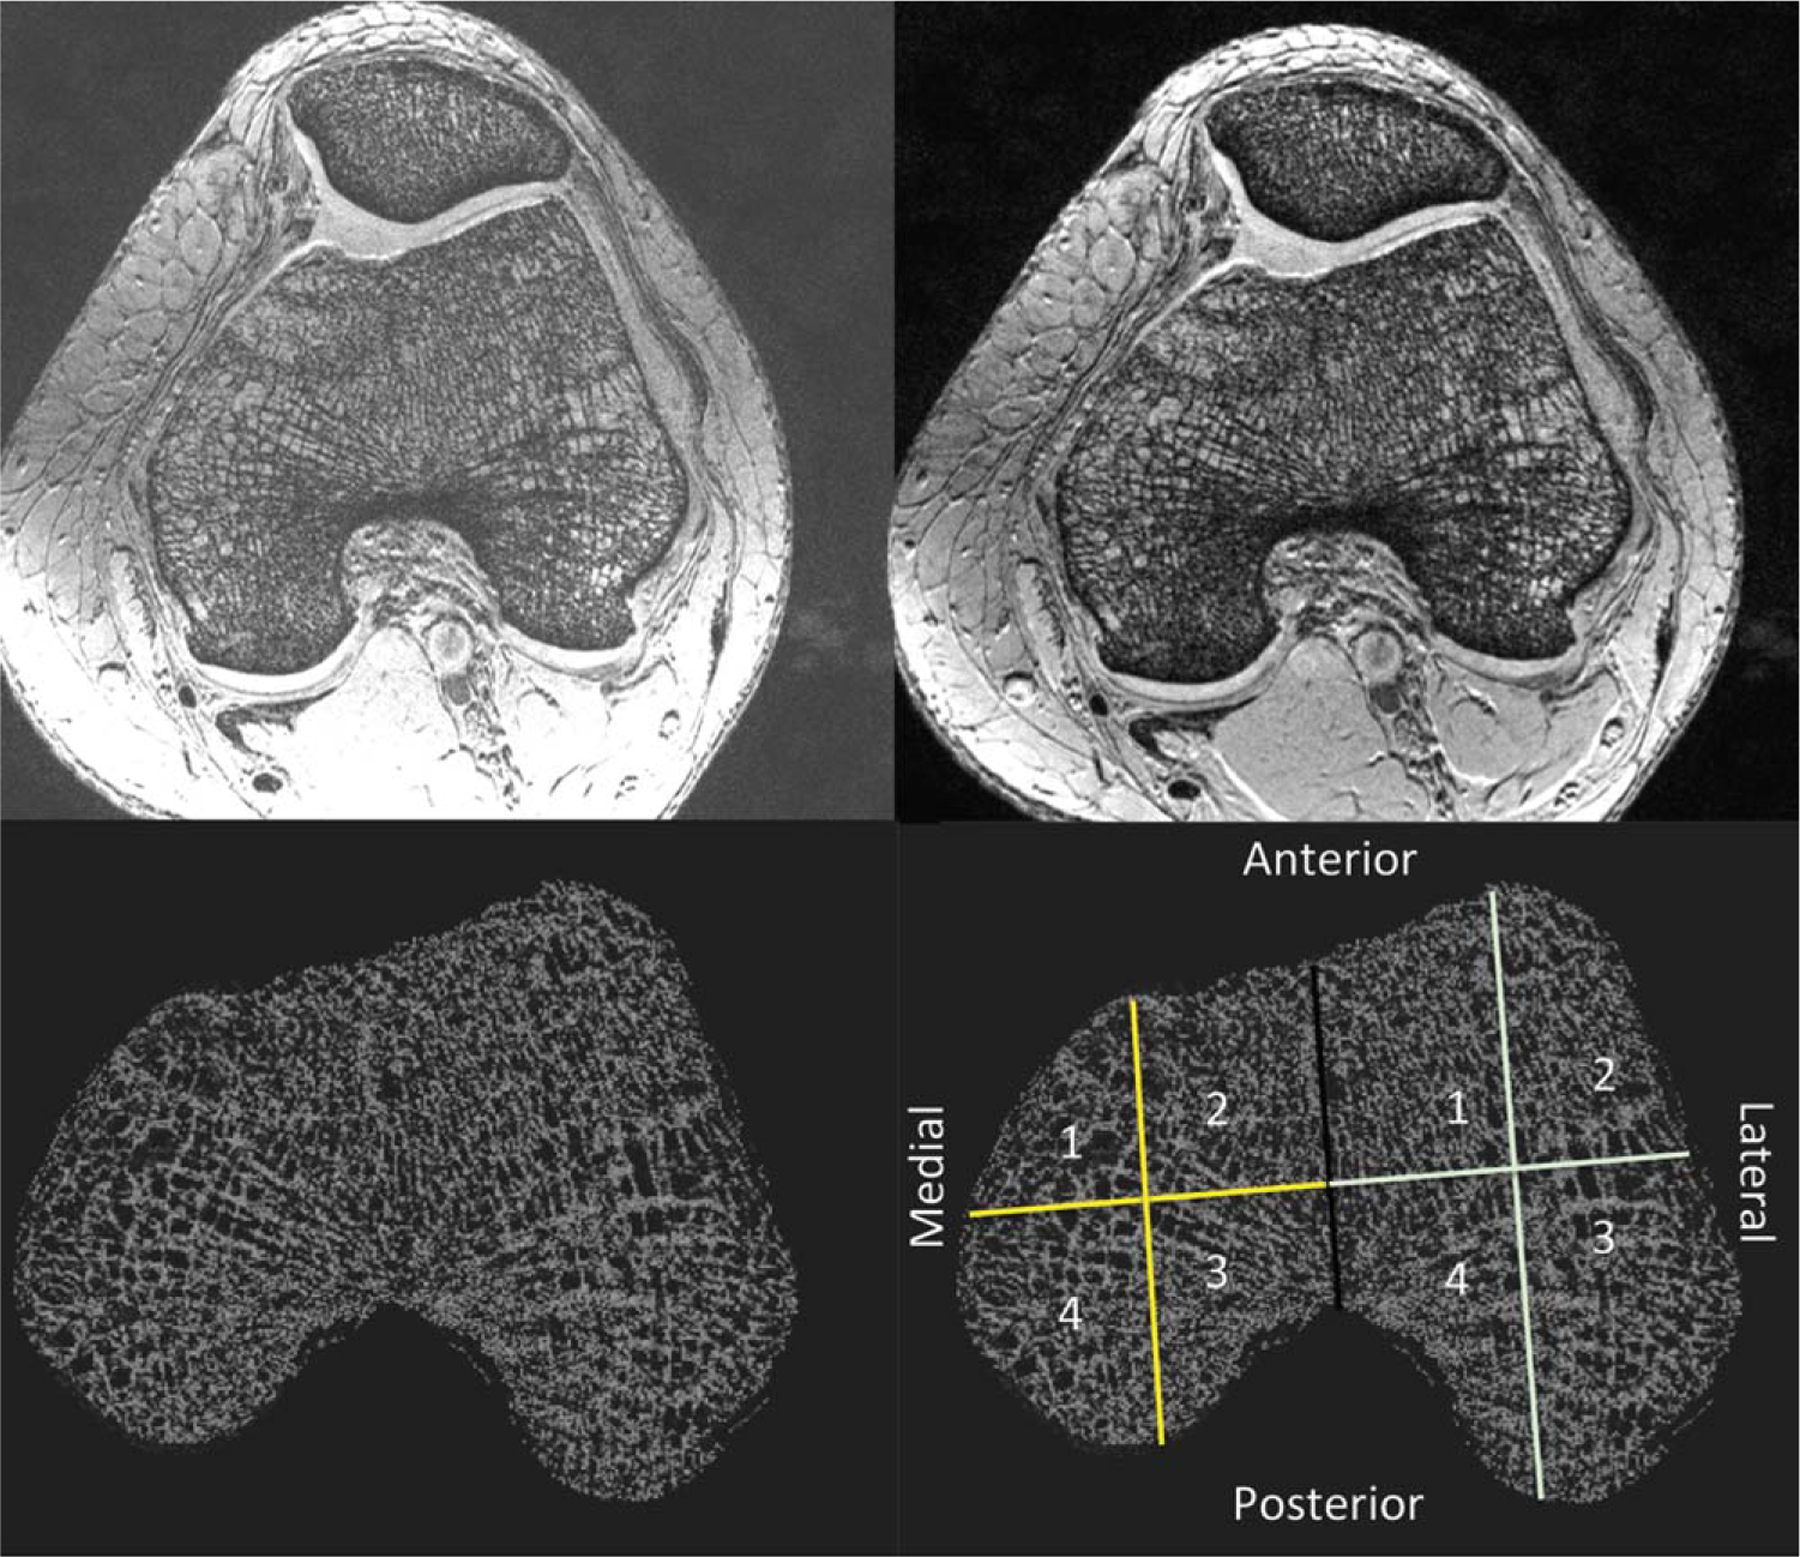
Image processing steps: 1) MRI scanning of the distal femur (top left); 2) correction for signal intensity variation across the FOV (top right); 3) generation of bone volume fraction map (bottom left); 4) analysis of the medial and lateral femoral condyles in four subregions (bottom right): anteromedial (1); anterolateral (2); posterolateral (3); posteromedial (4).
Within each subregion, we applied digital topological analysis (DTA). DTA (13,14) is a 3D method that accurately determines the topological class (eg, surfaces, curves, junctions, and edges) of each individual location in a digitized structure that has been applied for quantifying quality of trabecular bone architectural makeup. Before applying DTA, a binarized trabecular bone image is skeletonized to a network of 1D and 2D structures representing rods and plates, respectively. DTA involves three steps: the first is inspecting each bone voxel’s neighboring voxels (ie, the 26 other voxels within the voxel’s 3 × 3 × 3 kernel). A unique topological classification can be achieved using lookup tables solving for local topological ambiguities in digital manifolds and their junctions. These topological classes are used to compute several topological parameters for trabecular bone (TB) networks. We computed: BVF, as well as markers of: trabecular number (skeleton density, Sk.D), trabecular network osteoclastic resorption (erosion index), trabecular rod-like structure (curves), trabecular plate-like structure (surface, Surf), and trabecular plate-to-rod ratio (surface-curve, Surf-Curv).
Statistical Analysis
We computed mean values and standard deviations for each microarchitectural parameter within each subregion. Then we used analysis of variance (ANOVA) to compare the osteoarthritis subjects and control subjects with respect to each microarchitectural parameter in each of the four subregions. Specifically, a given subregion from osteoarthritis subjects was compared to the same corresponding region in controls. The error variance was allowed to differ across comparison groups to remove the assumption of variance homogeneity. P<0.05 was considered statistically significant.
RESULTS
Representative 7T MR images of subchondral bone microarchitecture from osteoarthritis subjects and control subjects are shown in Fig. 2a,b. Individual trabeculae are seen, including trabecular loss in the osteoarthritis subjects and spatial variation in bone microarchitecture in both the osteoarthritis subject and control subject.
Figure 2.
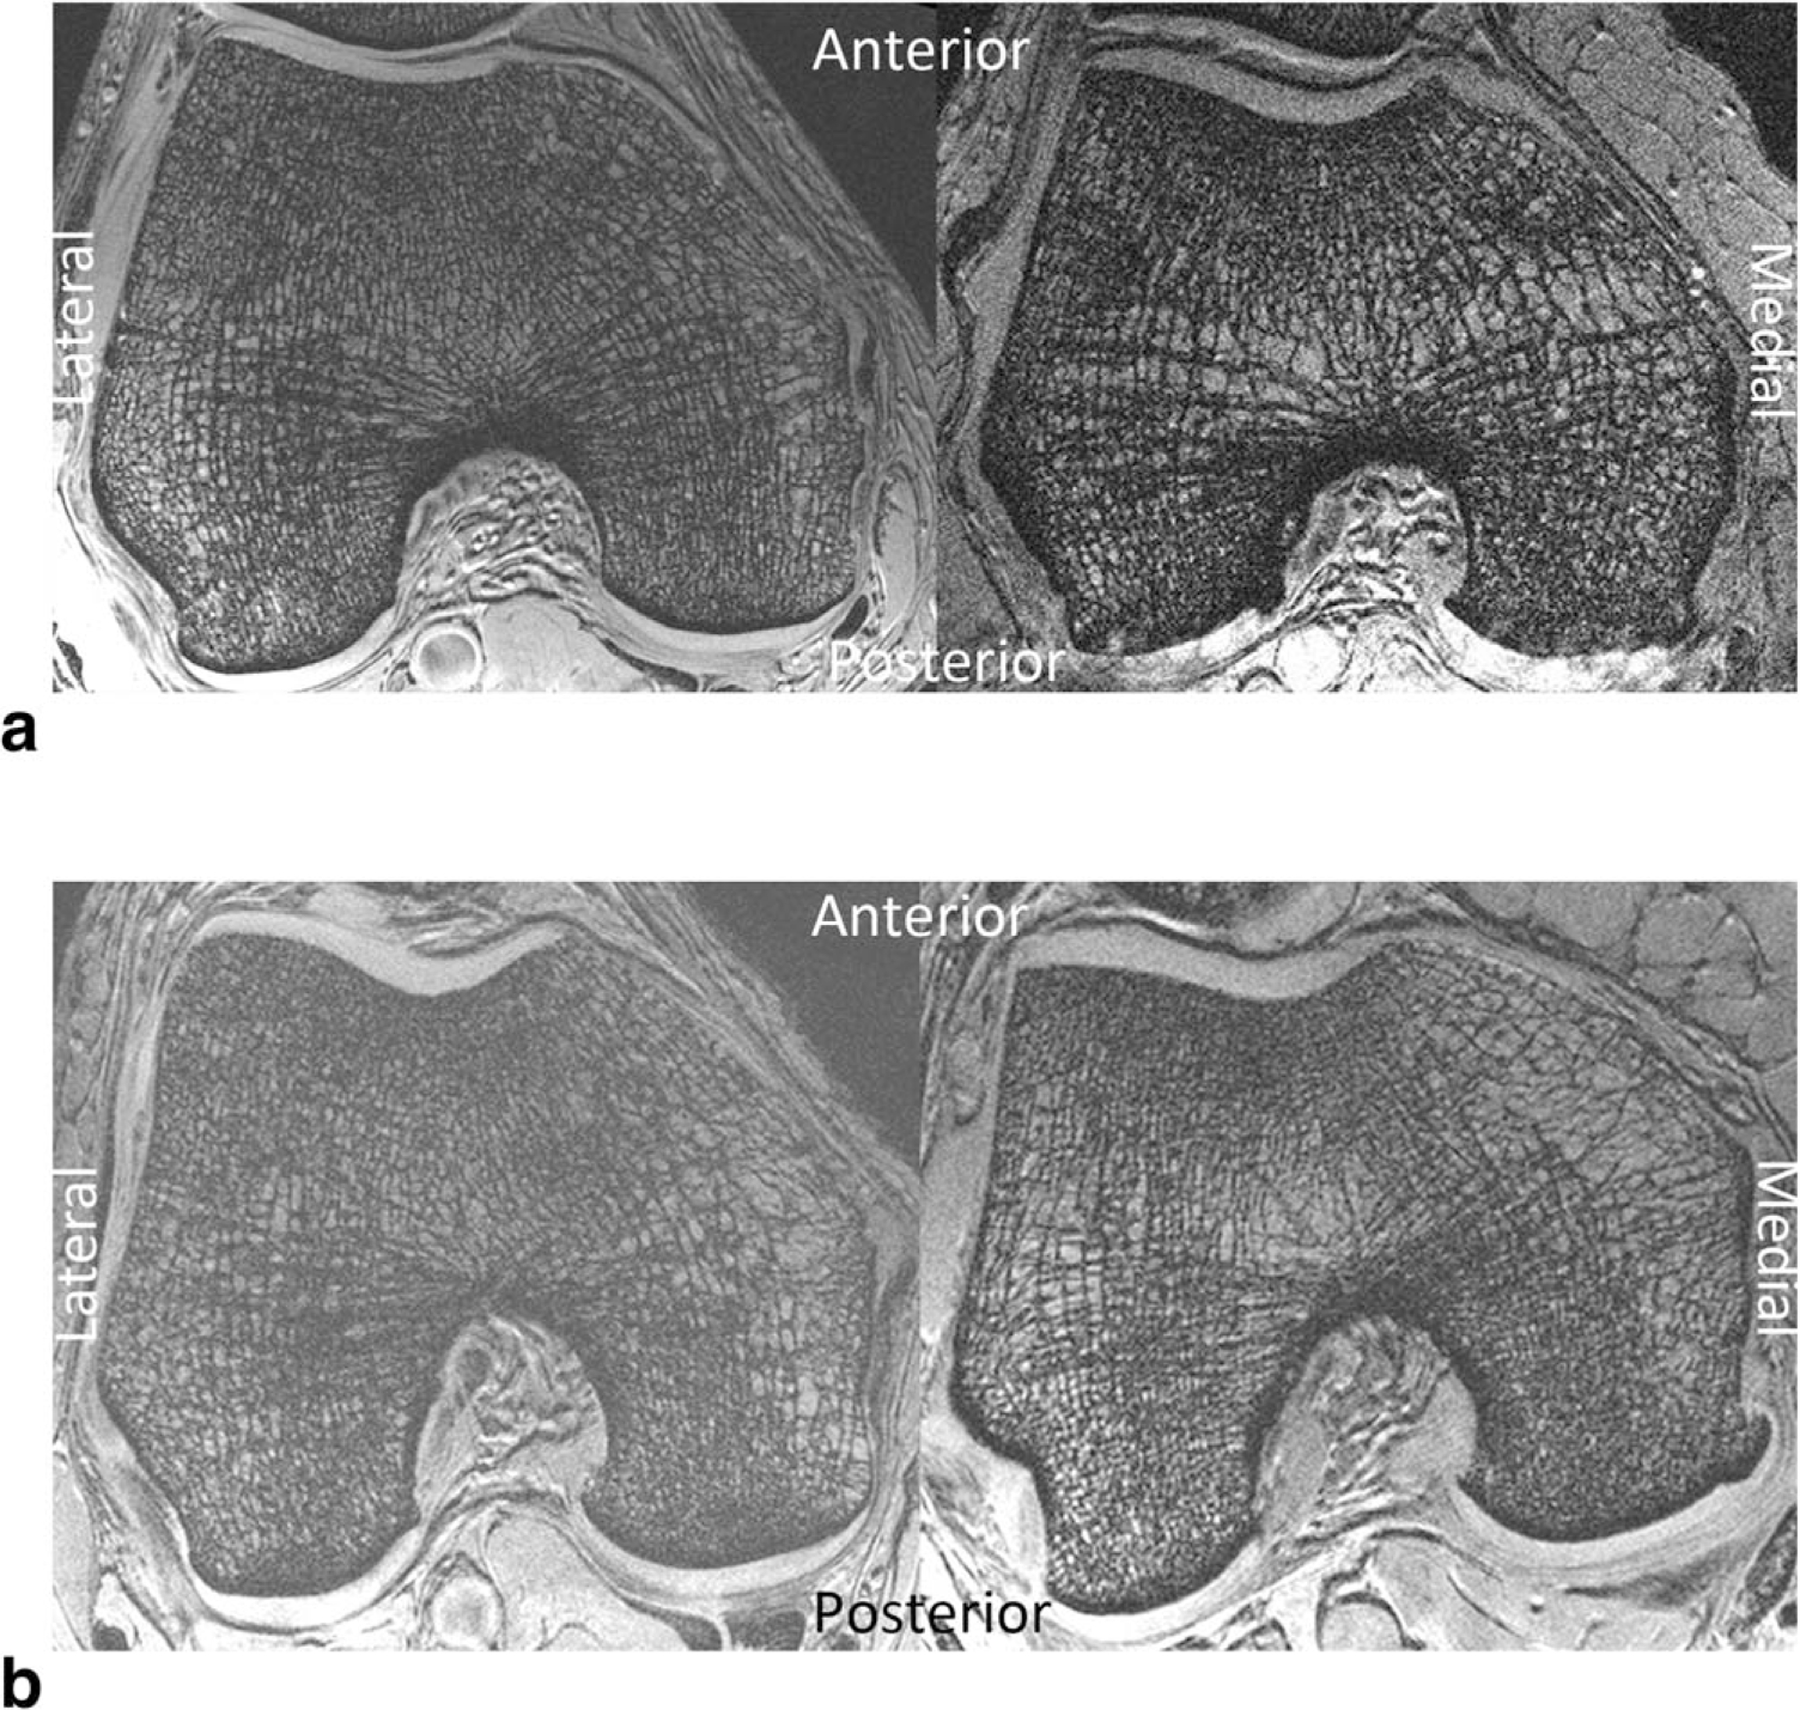
a: 7T MR images of bone microarchitecture in the distal femur of a healthy control subject (left) and a patient with mild osteoarthritis (right). There is microarchitectural deterioration in the patient with osteoarthritis compared with the control subject. b: 7T MR images of bone microarchitecture in the distal femur of another healthy control subject (left) and a patient with mild osteoarthritis (right). There is microarchitectural deterioration in the patient with osteoarthritis compared with the control subject.
Compared with the control subjects, the osteoarthritis subjects demonstrated deterioration in bone microarchitecture in the lateral femoral condyle (Table 1) and the medial femoral condyle (Table 2). Within the lateral femoral condyle, this was manifested by: lower bone volume fraction (anteromedially −2.89%, anterolaterally −5.43%, P<0.0001 for both); lower skeleton density (anterolaterally −5.09%, P=0.005); higher erosion index (all subregions, +9.95% to +22.76%, P<0.02 for all); lower surface number (all subregions, −3.46% to −9.63%, P<0.007 for all); higher curve number (anteromedially +10.0%, anterolaterally +16.93%, P<0.002); lower surface-curve ratio (all subregions, −8.05% to −21.71%, P<0.05 for all).
Table 1.
7T MRI Detected Deterioration in Subchondral Bone Microarchitecture Within the Lateral Femoral Condyle of Osteoarthritis Subjects Compared to Controls
| Subchondral bone | Control subjects (mean ± standard deviation) | Osteoarthritis subjects (mean ± standard deviation) | % Difference (osteoarthritis vs. control subjects) | P value | ||
|---|---|---|---|---|---|---|
| Lateral femoral condyle | ||||||
| Bone volume fraction | ||||||
| Anteromedial | 0.326 | ±0.005 | 0.316 | ±0.012 | −2.89 | <0.0001* |
| Posteromedial | 0.327 | ±0.004 | 0.323 | ±0.010 | −1.20 | 0.157 |
| Posterolateral | 0.329 | ±0.006 | 0.323 | ±0.014 | −2.04 | 0.020 |
| Anterolateral | 0.325 | ±0.010 | 0.307 | ±0.017 | −5.43 | <0.0001* |
| Skeleton density | ||||||
| Anteromedial | 0.387 | ±0.015 | 0.378 | ±0.019 | −2.39 | 0.146 |
| Posteromedial | 0.398 | ±0.010 | 0.392 | ±0.016 | −1.52 | 0.352 |
| Posterolateral | 0.394 | ±0.012 | 0.386 | ±0.021 | −2.15 | 0.187 |
| Anterolateral | 0.368 | ±0.020 | 0.349 | ±0.030 | −5.09 | 0.005* |
| Erosion index | ||||||
| Anteromedial | 0.888 | ±0.067 | 1.016 | ±0.165 | 14.40 | <0.0001* |
| Posteromedial | 0.885 | ±0.048 | 0.987 | ±0.210 | 11.55 | 0.005* |
| Posterolateral | 0.857 | ±0.074 | 0.942 | ±0.165 | 9.95 | 0.010* |
| Anterolateral | 0.928 | ±0.127 | 1.139 | ±0.247 | 22.76 | <0.0001* |
| Surfaces | ||||||
| Anteromedial | 0.294 | ±0.011 | 0.280 | ±0.021 | −4.86 | 0.0002* |
| Posteromedial | 0.303 | ±0.008 | 0.292 | ±0.020 | −3.46 | 0.005* |
| Posterolateral | 0.304 | ±0.011 | 0.291 | ±0.024 | −4.20 | 0.006* |
| Anterolateral | 0.284 | ±0.019 | 0.257 | ±0.031 | −9.63 | <0.0001* |
| Curves | ||||||
| Anteromedial | 0.038 | ±0.003 | 0.042 | ±0.006 | 10.00 | 0.001* |
| Posteromedial | 0.040 | ±0.003 | 0.042 | ±0.006 | 6.58 | 0.086 |
| Posterolateral | 0.037 | ±0.004 | 0.040 | ±0.006 | 7.85 | 0.057 |
| Anterolateral | 0.037 | ±0.005 | 0.043 | ±0.007 | 16.93 | <0.0001* |
| Surface–curve ratio | ||||||
| Anteromedial | 7.715 | ±0.826 | 6.787 | ±1.298 | −12.04 | 0.0004* |
| Posteromedial | 7.679 | ±0.799 | 7.062 | ±1.222 | −8.05 | 0.046* |
| Posterolateral | 8.359 | ±1.148 | 7.522 | ±1.407 | −10.01 | 0.026* |
| Anterolateral | 7.953 | ±1.540 | 6.226 | ±1.562 | −21.71 | <0.0001* |
Table 2.
7T MRI Detected Deterioration in Subchondral Bone Microarchitecture Within the Medial Femoral Condyle of Osteoarthritis Subjects Compared to Controls
| Subchondral bone | Control subjects (mean ± standard deviation) | Osteoarthritis subjects (mean ± standard deviation) | % difference (osteoarthritis vs. control subjects) | P value | ||
|---|---|---|---|---|---|---|
| Medial femoral condyle | ||||||
| Bone volume fraction | ||||||
| Anteromedial | 0.324 | ±0.010 | 0.318 | ±0.019 | −2.05 | 0.039* |
| Posteromedial | 0.328 | ±0.009 | 0.321 | ±0.014 | −2.13 | 0.054* |
| Posterolateral | 0.329 | ±0.005 | 0.326 | ±0.006 | −1.03 | <0.0001* |
| Anterolateral | 0.327 | ±0.004 | 0.320 | ±0.011 | −2.01 | 0.370 |
| Skeleton density | ||||||
| Anteromedial | 0.382 | ±0.015 | 0.375 | ±0.028 | −1.75 | 1.000 |
| Posteromedial | 0.381 | ±0.018 | 0.373 | ±0.025 | −2.18 | 0.759 |
| Posterolateral | 0.403 | ±0.009 | 0.400 | ±0.008 | −0.60 | 1.000 |
| Anterolateral | 0.398 | ±0.010 | 0.389 | ±0.014 | −2.21 | 0.006* |
| Erosion index | ||||||
| Anteromedial | 0.908 | ±0.119 | 1.028 | ±0.287 | 13.21 | 0.059 |
| Posteromedial | 0.864 | ±0.112 | 0.950 | ±0.166 | 9.94 | 0.037* |
| Posterolateral | 0.856 | ±0.045 | 0.929 | ±0.088 | 8.49 | <0.0001* |
| Anterolateral | 0.880 | ±0.063 | 0.981 | ±0.174 | 11.47 | 0.001* |
| Surfaces | ||||||
| Anteromedial | 0.291 | ±0.018 | 0.280 | ±0.032 | −3.86 | 0.392 |
| Posteromedial | 0.293 | ±0.017 | 0.282 | ±0.026 | −3.88 | 0.139 |
| Posterolateral | 0.307 | ±0.007 | 0.300 | ±0.012 | −2.31 | 0.004* |
| Anterolateral | 0.302 | ±0.007 | 0.288 | ±0.019 | −4.57 | <0.0001* |
| Curves | ||||||
| Anteromedial | 0.039 | ±0.005 | 0.042 | ±0.008 | 7.79 | 0.349 |
| Posteromedial | 0.037 | ±0.006 | 0.039 | ±0.006 | 6.40 | 0.755 |
| Posterolateral | 0.038 | ±0.003 | 0.041 | ±0.005 | 6.85 | 0.020* |
| Anterolateral | 0.038 | ±0.004 | 0.042 | ±0.006 | 10.16 | 0.002* |
| Surface–curve ratio | ||||||
| Anteromedial | 7.754 | ±1.556 | 7.003 | ±1.612 | −9.69 | 0.345 |
| Posteromedial | 8.154 | ±1.606 | 7.417 | ±1.637 | −9.03 | 0.439 |
| Posterolateral | 8.080 | ±0.884 | 7.440 | ±1.135 | −7.92 | 0.031* |
| Anterolateral | 7.943 | ±0.878 | 7.011 | ±1.368 | −11.73 | 0.001* |
Within the medial femoral condyle, microarchitectural deterioration in osteoarthritis subjects compared with control subjects was manifested by: lower bone volume fraction (anteromedially −2.05%, posterolaterally −1.03%, P<0.04 for both); lower skeleton density (−2.21%, P= 0.006); higher erosion index (all subregions except anteromedially, +8.49% to +11.47%, P<0.04); lower surface number (posterolaterally −2.31%, anterolaterally −4.57%, P<0.005 for both); higher curve number (posterolaterally +6.85%, anterolaterally +10.16%, P<0.03 for both); lower surface-curve ratio (posterolaterally −7.92%, anterolaterally −11.73%, P<0.04 for both).
DISCUSSION
In this study we used high-resolution 7T MRI to examine distal femur bone microarchitecture in subjects with mild osteoarthritis compared with healthy controls. The subjects with mild osteoarthritis demonstrated deterioration in topological parameters of subchondral bone microarchitecture compared with control subjects. Specifically, in the osteoarthritis subjects there were decreases in markers of trabecular plate-like-structure (surfaces) and plate-to-rod ratio (surface-curve ratio), and increases in markers of trabecular network resorption (erosion index) and rod-like structure (skeleton density). Overall, these results provide further support for the notion that poor subchondral bone quality plays a role in osteoarthritis disease pathogenesis and may serve as a potential therapeutic target for osteoarthritis interventions.
7T MRI scanners are not widely available. Furthermore, although imaging at 7T carries with it the challenges of maintaining B0 and B1+ field homogeneity and staying within specific absorption rate (SAR) limits, these obstacles are not insurmountable. In recent years, there have been an increasing number of studies describing MRI of the musculoskeletal system at 7T (16,17). We leveraged the higher SNR of 7T and the 28 channel knee coil (as opposed to a quadrature coil) in order to implement parallel imaging and obtain 80 high-resolution axial images of distal femur bone microarchitecture in only 7 minutes 9 seconds. Individual trabeculae were well visualized on the images that we acquired, and in the future we hope to further increase the spatial resolution, potentially through the use of more SNR-efficient pulse sequences (eg, balanced steady-state free precession (18)).
With regards to ultrahigh-field imaging of osteoarthritis, a few recent studies have applied diffusion tensor imaging (19), sodium imaging (20,21), and chemical exchange saturation transfer imaging (22,23) to investigate the biochemical composition of the cartilage extracellular matrix in the knee at 7T. The ultimate goal of these studies is to detect early, potentially reversible chondral degeneration in osteoarthritis. Like high-resolution microstructural imaging, 7T facilitates the performance of these biochemical imaging techniques, which require high baseline SNR. Because osteoarthritis is a disease involving both cartilage and bone, in the future a combination of biochemical cartilage imaging and high-resolution microstructural imaging may permit a comprehensive physiologic evaluation of joint health and detection of early, potentially reversible changes.
Our 7T in vivo results are in line with those of prior animal studies of osteoarthritis (24–26). In chemically induced and anterior cruciate ligament transection models of rat osteoarthritis, subchondral bone loss was detected via microcomputed tomography and histomorphometry as early as 2 weeks after the induction of osteoarthritis (24,25). And in another rat transection model of osteoarthritis, experimentally induced subchondral bone resorption and microarchitectural impairment (decreased trabecular thickness and increased trabecular separation) were found to aggravate degeneration in overlying articular cartilage (as assessed by histopathology) (26).
We focused on topologic parameters of bone microarchitecture in this study (eg, whether trabeculae are plate or rod-like, markers of osteoclastic resorption). The results are in line with those of two prior human studies in which morphologic parameters were evaluated. Lindsey et al (at 1.5T) (27) and Bolbos et al (at 3T) (28) detected lower trabecular thickness and number, and higher trabecular separation in osteoarthritis subjects compared to controls. Overall, the microarchitectural changes described in these prior studies and in our current work reflect worsening of subchondral bone quality. In the future, it will be of interest to determine which parameters of subchondral bone microarchitecture are the most important for the maintenance of bone and joint health, and the possible prevention of osteoarthritis. For example, because trabecular network resorption (erosion index) was increased by as much as 22.76% in this study (anterolateral region of the lateral femoral condyle), trabecular network resorption may be a more sensitive biomarker for monitoring the efficacy of an osteoarthritis intervention than bone volume fraction, which only decreased by up to 5.43%.
Poor subchondral bone quality is believed to contribute to the pathogenesis of osteoarthritis by facilitating a cycle of cartilage degeneration, abnormal joint loading, and further subchondral bone remodeling (4,29,30). Specifically, if subchondral bone microarchitecture deteriorates, it becomes weaker. This may lead to flattening of the articular surface and altered mechanical loading on overlying cartilage tissue. Such altered mechanical loading on cartilage may cause physical damage to cartilage tissue, which in turn would alter the stresses on underlying subchondral bone. Wolff’s Law states that bone remodels in response to the forces placed upon it (11). Therefore, in the setting of osteoarthritis, subchondral bone may be undergoing repeated cycles of remodeling depending on the status of the overlying cartilage and also an individual person’s biomechanics. Indeed, we observed regional variation in subchondral bone microarchitecture in our study, and based on Wolff’s Law, this probably reflects spatial variation and the history of local mechanical loading experienced by subchondral bone in different regions of the joint. As stated previously, whether inhibition of bone remodeling and preservation of bone quality could prevent the development of osteoarthritis remains a topic of ongoing investigation; in a 2013 animal study, the prevention of subchondral bone loss via the antiresorptive agent alendronate did protect against cartilage degeneration (31).
This study has limitations. First, we had a relatively small number of study subjects. However, the number of subjects was still enough to detect differences between groups. In the future, it will be important to carry out a longitudinal study of osteoarthritis subjects in order to determine the temporal changes in bone microarchitecture during the course of osteoarthritis disease progression. Second, as in any cross-sectional study, there is the potential for selection bias or unknown confounding factors. Finally, we recognize that 7T MRI scanners are not widely available.
In conclusion, we used high-resolution 7T MRI to detect deterioration in topologic parameters of subchondral bone microarchitecture in subjects with mild knee osteoarthritis compared with healthy controls. These results provide further support for the role of poor subchondral bone quality in the pathogenesis of osteoarthritis. In the future, this method might be used to help determine, in human studies, whether interventions that preserve subchondral bone microarchitecture and quality could help prevent the development of structural cartilage tissue loss and the onset of osteoarthritis.
Acknowledgments
Contract grant sponsor: National Institutes of Health (NIH); Contract grant numbers: NIH K23–059748 (to G.C.), NIH RO1-O56260 (to R.R.), NIH RO1–060238 (to R.R.).
REFERENCES
- 1.Pleis JR, Lethbridge-Cejku M. Summary health statistics for U.S. adults: National Health Interview Survey, 2005. Vital and health statistics. Series 10, Data from the National Health Survey 2006:1–153. [PubMed] [Google Scholar]
- 2.Initiative USBaJ. The burden of musculoskeletal diseases in the United States: prevalence, societal and economic cost American Academy of Orthopaedic Surgeons. 2008. [Google Scholar]
- 3.Yelin E, Murphy L, Cisternas MG, Foreman AJ, Pasta DJ, Helmick CG. Medical care expenditures and earnings losses among persons with arthritis and other rheumatic conditions in 2003, and comparisons with 1997. Arthritis Rheum 2007;56: 1397–1407. [DOI] [PMC free article] [PubMed] [Google Scholar]
- 4.Burr DB. Anatomy and physiology of the mineralized tissues: role in the pathogenesis of osteoarthrosis. Osteoarthritis Cartilage 2004;12(Suppl A):S20–30. [DOI] [PubMed] [Google Scholar]
- 5.Kamibayashi L, Wyss UP, Cooke TD, Zee B. Trabecular microstructure in the medial condyle of the proximal tibia of patients with knee osteoarthritis. Bone 1995;17:27–35. [DOI] [PubMed] [Google Scholar]
- 6.Chappard C, Peyrin F, Bonnassie A, et al. Subchondral bone micro-architectural alterations in osteoarthritis: a synchrotron micro-computed tomography study. Osteoarthritis Cartilage 2006;14:215–223. [DOI] [PubMed] [Google Scholar]
- 7.Bobinac D, Spanjol J, Zoricic S, Maric I. Changes in articular cartilage and subchondral bone histomorphometry in osteoarthritic knee joints in humans. Bone 2003;32:284–290. [DOI] [PubMed] [Google Scholar]
- 8.Buckland-Wright JC, Messent EA, Bingham CO 3rd, Ward RJ, Tonkin C. A 2 yr longitudinal radiographic study examining the effect of a bisphosphonate (risedronate) upon subchondral bone loss in osteoarthritic knee patients. Rheumatology (Oxford) 2007; 46:257–264. [DOI] [PubMed] [Google Scholar]
- 9.Spector TD, Conaghan PG, Buckland-Wright JC, et al. Effect of risedronate on joint structure and symptoms of knee osteoarthritis: results of the BRISK randomized, controlled trial (ISRCTN01928173). Arthritis Res Ther 2005;7:R625–633. [DOI] [PMC free article] [PubMed] [Google Scholar]
- 10.Carbone LD, Nevitt MC, Wildy K, et al. The relationship of antiresorptive drug use to structural findings and symptoms of knee osteoarthritis. Arthritis Rheum 2004;50:3516–3525. [DOI] [PubMed] [Google Scholar]
- 11.Wolff J The classic: on the significance of the architecture of the spongy substance for the question of bone growth: a preliminary publication. 1869. Clin Orthop Relat Res 2011;469:3077–3078. [DOI] [PMC free article] [PubMed] [Google Scholar]
- 12.Vasilic B, Wehrli FW. A novel local thresholding algorithm for trabecular bone volume fraction mapping in the limited spatial resolution regime of in vivo MRI. IEEE Trans Med Imaging 2005;24: 1574–1585. [DOI] [PubMed] [Google Scholar]
- 13.Saha PK, Chaudhuri BB. 3D digital topology under binary transformation with applications. Comput Vis Image Underst 1996;63: 418–429. [Google Scholar]
- 14.Saha PK, Gomberg BR, Wehrli FW. Three-dimensional digital topological characterization of cancellous bone architecture. Int J Imaging Syst Technol 2000;11:81–90. [Google Scholar]
- 15.Moser E, Stahlberg F, Ladd ME, Trattnig S. 7-T MR—from research to clinical applications? NMR Biomed 2012;25:695–716. [DOI] [PubMed] [Google Scholar]
- 16.Regatte RR, Schweitzer ME. Ultra-high-field MRI of the musculoskeletal system at 7.0T. J Magn Reson Imaging 2007;25:262–269. [DOI] [PubMed] [Google Scholar]
- 17.Krug R, Stehling C, Kelley DA, Majumdar S, Link TM. Imaging of the musculoskeletal system in vivo using ultra-high field magnetic resonance at 7 T. Invest Radiol 2009;44:613–618. [DOI] [PubMed] [Google Scholar]
- 18.Krug R, Carballido-Gamio J, Banerjee S, et al. In vivo bone and cartilage MRI using fully-balanced steady-state free-precession at 7 Tesla. Magn Reson Med 2007;58:1294–1298. [DOI] [PubMed] [Google Scholar]
- 19.Raya JG, Horng A, Dietrich O, et al. Articular cartilage: in vivo diffusion-tensor imaging. Radiology 2012;262:550–559. [DOI] [PubMed] [Google Scholar]
- 20.Trattnig S, Welsch GH, Juras V, et al. 23Na MR imaging at 7 T after knee matrix-associated autologous chondrocyte transplantation preliminary results. Radiology 2010;257:175–184. [DOI] [PubMed] [Google Scholar]
- 21.Madelin G, Babb J, Xia D, et al. Articular cartilage: evaluation with fluid-suppressed 7.0-T sodium MR imaging in subjects with and subjects without osteoarthritis. Radiology 2013;268:481–491. [DOI] [PMC free article] [PubMed] [Google Scholar]
- 22.Schmitt B, Zbyn S, Stelzeneder D, et al. Cartilage quality assessment by using glycosaminoglycan chemical exchange saturation transfer and (23)Na MR imaging at 7 T. Radiology 2011;260:257–264. [DOI] [PubMed] [Google Scholar]
- 23.Singh A, Haris M, Cai K, et al. Chemical exchange saturation transfer magnetic resonance imaging of human knee cartilage at 3 T and 7 T. Magn Reson Med 2012;68:588–594. [DOI] [PMC free article] [PubMed] [Google Scholar]
- 24.Mohan G, Perilli E, Parkinson IH, Humphries JM, Fazzalari NL, Kuliwaba JS. Pre-emptive, early, and delayed alendronate treatment in a rat model of knee osteoarthritis: effect on subchondral trabecular bone microarchitecture and cartilage degradation of the tibia, bone/cartilage turnover, and joint discomfort. Osteoarthritis Cartilage 2013;21:1595–1604. [DOI] [PubMed] [Google Scholar]
- 25.Hayami T, Pickarski M, Zhuo Y, Wesolowski GA, Rodan GA, Duong le T. Characterization of articular cartilage and subchondral bone changes in the rat anterior cruciate ligament transection and meniscectomized models of osteoarthritis. Bone 2006; 38:234–243. [DOI] [PubMed] [Google Scholar]
- 26.Bellido M, Lugo L, Roman-Blas JA, et al. Subchondral bone microstructural damage by increased remodelling aggravates experimental osteoarthritis preceded by osteoporosis. Arthritis Res Ther 2010;12:R152. [DOI] [PMC free article] [PubMed] [Google Scholar]
- 27.Lindsey CT, Narasimhan A, Adolfo JM, et al. Magnetic resonance evaluation of the interrelationship between articular cartilage and trabecular bone of the osteoarthritic knee. Osteoarthritis Cartilage 2004;12:86–96. [DOI] [PubMed] [Google Scholar]
- 28.Bolbos RI, Zuo J, Banerjee S, et al. Relationship between trabecular bone structure and articular cartilage morphology and relaxation times in early OA of the knee joint using parallel MRI at 3 T. Osteoarthritis Cartilage 2008;16:1150–1159. [DOI] [PMC free article] [PubMed] [Google Scholar]
- 29.Buckland-Wright C Subchondral bone changes in hand and knee osteoarthritis detected by radiography. Osteoarthritis Cartilage 2004;12(Suppl A):S10–S19. [DOI] [PubMed] [Google Scholar]
- 30.Goldring SR. Alterations in periarticular bone and cross talk between subchondral bone and articular cartilage in osteoarthritis. Ther Adv Musculoskelet Dis 2012;4:249–258. [DOI] [PMC free article] [PubMed] [Google Scholar]
- 31.Zhu S, Chen K, Lan Y, Zhang N, Jiang R, Hu J. Alendronate protects against articular cartilage erosion by inhibiting subchondral bone loss in ovariectomized rats. Bone 2013;53: 340–349. [DOI] [PubMed] [Google Scholar]