

Abstract
Spontaneous, volitional spatial exploration is crucial for building up a cognitive map of the environment. However, decades of research have primarily measured the fidelity of cognitive maps after discrete, controlled learning episodes. We know little about how cognitive maps are formed during naturalistic free exploration. Here, we investigated whether exploration trajectories predicted cognitive map accuracy, and how these patterns were shaped by environmental structure. In two experiments, participants freely explored a previously unfamiliar virtual environment. We related their exploration trajectories to a measure of how long they spent in areas with high global environmental connectivity (integration, as assessed by space syntax). In both experiments, we found that participants who spent more time on paths that offered opportunities for integration formed more accurate cognitive maps. Interestingly, we found no support for our pre-registered hypothesis that self-reported trait differences in navigation ability would mediate this relationship. Our findings suggest that exploration patterns predict cognitive map accuracy, even for people who self-report low ability, and highlight the importance of considering both environmental structure and individual variability in formal theory- and model-building.
Keywords: Spatial navigation, Cognitive map, Exploration, Virtual reality, Roaming, Environmental structure, Space syntax
Introduction
Spontaneous, volitional spatial exploration is a fundamental feature of human and animal behavior (E. Schulz et al., 2019; L. Schulz, 2012; Zurn & Bassett, 2018). Spatial exploration is valuable to an organism because it can facilitate constructing a representation of the spatial structure of the world—a cognitive map—which can then be used to guide goal-directed behaviors such as wayfinding, foraging, and returning to the home base (Calhoun & Hayden, 2015; Davidson & El Hady, 2019; Pfeiffer & Foster, 2013). In the classical formulation, exploration and curiosity are key signatures of a cognitive map. However, the relationship between exploration and cognitive maps is rarely studied, and we know little about how the acquisition of cognitive maps is shaped by different features of exploratory behavior.
Some indirect evidence for a relationship comes from neuroscience. Exploration and active information seeking are prominent drivers of activity in the medial temporal lobes (Gruber & Ranganath, 2019), key brain regions supporting cognitive maps (Bellmund et al., 2018; Epstein et al., 2017; Momennejad, 2020; Peer et al., 2021). Spatial exploration involves active movement, either of the body or the sense organs. In rodents, active foraging and exploration produce stronger hippocampal place cell firing compared to passive transportation (Song et al., 2005), better coding of spatial information in place cells (Terrazas et al., 2005), and stronger grid-like responses in entorhinal cortex (Winter et al., 2015). Visual exploration during spontaneous stop-and-scan events produces place cell firing (Monaco et al., 2014), and visual exploration in both primates and humans evokes entorhinal grid-cell-like representations (Julian et al., 2018; Killian et al., 2012). Exploration also involves decision making, and human neuroimaging studies have shown that hippocampal activity during naturalistic virtual navigation is stronger when active decision-making is required than when it is absent (Howard et al., 2014; Kaplan et al., 2012; Spiers & Maguire, 2006). Together, these data show that active navigation, visual sampling, and decision making—key elements of exploration—induce the activation of neural structures that mediate cognitive maps. This prompts the question of how exploration supports the formation of such maps (Chrastil & Warren, 2012), and how individual differences in exploratory behavior might explain the strikingly variability of the cognitive maps that different navigators can form of the same environment (Furman et al., 2014; Ishikawa & Montello, 2006; Uttal et al., 2013; Weisberg et al., 2014; Weisberg & Newcombe, 2016; Wolbers & Hegarty, 2010).
In the present study, we investigated the relationship between exploration and cognitive maps. Specifically, we extracted moment-to-moment dynamics of behavior as participants explored a new virtual environment (Virtual Silcton), and then related these exploration patterns to the fidelity of the cognitive maps that the participants formed. Our approach contrasts with that used in the typical cognitive map study, in which spatial memories are assessed by contrasting pre-learning and post-learning ‘snapshots”—a procedure that obscures the rich dynamical process that takes place during real-world learning episodes. We reasoned that if we wanted to understand how exploration allows a navigator to build up a representation of the environment, we needed to unravel the step-by-step process of exploration, the choices people make, where they tend to go, and where they tend to linger.
One aspect of navigational behavior we considered was the extent to which the environment was fully explored. Intuitively, one might consider that an optimal way to explore a novel environment would be to seek out new locations until every possible state in an environment is covered. Variations of this exploration approach have been implemented in machine learning agents (Chentanez et al., 2004; Vezzani et al., 2019), based on the assumption that we are intrinsically motivated to seek out novelty and biased towards visiting previously unseen or less visited spaces. If this is the optimal approach, more accurate spatial memory for a particular environment should stem from higher coverage of the environment. Roaming entropy provides a measure of how many different locations, or states, one visits in a given amount of time (Fig. 3A). Maximal roaming entropy would be achieved by spending equal amounts of time in each environmental location. Rodents reared in enriched environments show higher roaming entropy in new environments and higher hippocampal neurogenesis rates compared to rodents reared in impoverished environments (Freund et al., 2013). Further, humans with higher roaming entropy in their day-to-day GPS traces have stronger hippocampal-striatal connectivity relative to those who explore less (Heller et al., 2020). A recent study also found that patients with Alzheimer’s Disease show significantly reduced entropy compared to healthy older adults (Ghosh et al., 2022). To our knowledge, the inter-individual variability in this measure of exploration has not been linked to the subsequent structure of cognitive maps. A somewhat related measure is displacement from the starting point. A previous study showed that participants with lower displacement who revisited the same locations more often had less precise memory relative to those with higher displacement and less revisiting (Gagnon et al., 2018), replicating real world findings (Munion et al., 2019).
Figure 3.

A) Example low and high entropy participants. Roaming entropy was not a significant predictor of pointing accuracy, hand-drawn map accuracy, or model-building accuracy in B) Experiment 1 or B) Experiment 2.
Measures of coverage, however, are agnostic to environmental structure, and we know that the geometry of our environments shapes our behavior (Barhorst-Cates et al., 2021; Coutrot et al., 2022) and neural representations (Krupic et al., 2015). Thus, a second issue that we considered is how exploration is shaped by the spatial structure of the environment. This structure can be characterized by space syntax. This set of spatial analysis methods, which were originally developed in architecture, conceptualize the environment as a graph of connected locations (Hillier & Hanson, 1989; Penn, 2003). Previous work has shown that connectivity of individual street segments predicts people’s gaze patterns and mapping ability (Emo, 2014; Pagkratidou et al., 2020; Walter, Essmann, König, & König, 2022), and that human hippocampal activity when virtually navigating through a city neighborhood scales with step-by-step changes in both local and global connectivity of street segments (Javadi et al., 2017). In the current study, we examined whether the representations that participants form of a new environment are affected by the congruence of their exploration patterns with the spatial syntax of the environment. To do this, we derived a new measure of experienced integration, which describes the extent to which participants concentrate exploration on areas of high global connectivity.
We also considered issues related to individual differences in navigational ability. Prior work using the Virtual Silcton environment found that self-reported navigational ability, measured by the Santa Barbara Sense of Direction Scale (SBSOD; Hegarty et al, 2002), had a moderate but significant positive relationship with subsequent cognitive map accuracy, assessed by asking participants to point between locations (Weisberg et al., 2014). In the present work, we also used absolute pointing error (see Methods) as a measure of cognitive map accuracy. Experiment 1 was exploratory in nature and had no preregistered hypotheses. Based on significant relationships between exploration measures and subsequent cognitive map accuracy in this experiment, we preregistered hypotheses for Experiment 2, testing whether those who reported better navigational ability in everyday life (as assessed by SBSOD) would differ in their exploratory behavior from those who reported worse navigational ability in everyday life.
To anticipate our results, in Experiment 1, we found that experienced integration significantly predicted participants’ ability to point between locations and to draw a map of the environment, but roaming entropy did not predict either measure. Thus, participants who visit more interconnected parts of the environment form better cognitive maps. In Experiment 2, we tested two preregistered hypotheses stemming from Experiment 1. First, we hypothesized a replication of the link between experienced integration and cognitive map accuracy. Second, we predicted that experienced integration would mediate the relationship between trait differences in navigational abilities and cognitive map accuracy. We found evidence for the former, but not the latter, hypothesis. These results suggest that environmental structure shapes participants’ cognitive maps, but exploration patterns are not driven by self-reported navigational ability, highlighting the possibility of using directed exploration to construct more accurate cognitive maps.
Methods
Experiment 1
Participants
Data were collected from 84 participants at the University of Western Ontario (31 male). These participants were part of a larger sample of 172 participants, collected for a separate purpose (see Procedure below; Nantais, 2019), and included all participants in the larger sample who had complete navigation logs during exploration. The remaining participants in the larger sample had incomplete navigation logs due to a logging error in the Virtual Silcton software. Participants received course credit or $15. The study was approved by the University of Western Ontario Non-Medical Research Ethics Board.
Virtual Environment
The exploration of Virtual Silcton was implemented in Unity game software (https://unity.com/). The environment was presented to participants using the online Virtual Silcton platform (https://virtualsilcton.com), which automatically synced data to a server. Participants freely moved around the world by using the arrow keys on the keyboard, and could adjust their view by moving the mouse. In contrast to previous implementations of Virtual Silcton (Weisberg et al., 2014; Weisberg & Newcombe, 2016), participants were not guided along any predetermined routes, and were able to leave the paths (i.e., there were no invisible walls in the environment).
Procedure
All participants completed three phases of the experiment: 1) exploration, 2) on-site pointing, and 3) final map drawing. As part of the larger study, each participant was assigned to one of four conditions for the exploration phase: Sketch, Silcton Task, Non-Silcton Task, or Baseline. Participants in all groups were given 16 minutes in total to explore the environment and find all 8 named buildings. In the Sketch condition, participants were asked to pause exploring every four minutes and draw a map of the environment for one minute each time. In the Silcton Task condition, participants were again paused every four minutes and were given a checklist of items which included a mixture of landmarks seen in Silcton and foils. The Non-Silcton condition followed the same pattern, except that participants were given a coloring page for 1 minute following each 4-minute interval. Finally, in the Baseline condition, participants continuously explored with no breaks.
Cognitive Map Accuracy
The accuracy of participants’ cognitive maps was measured in two ways: 1) absolute pointing error in an on-site pointing task and 2) Gardony scores of the maps drawn by the participants. In the pointing task, participants were placed into the virtual environment in front of each of the buildings. They were asked to point in the direction of every other building by using their cursor to adjust their viewing direction and clicking to record their response. Absolute pointing error was calculated as the average absolute deviation, in degrees, from the correct direction. The Gardony map score was calculated for the participants’ hand-drawn maps of the environment using the Gardony Map Drawing Analyzer software (Gardony et al., 2016). The resulting measure is a correlation ranging from 0 to 1, where 0 indicates no correspondence between the drawing and the ground truth, and 1 indicates perfect correspondence.
The 78 participants included in the present study were relatively evenly distributed across the four learning conditions (20, 21, 20, and 17 in the Sketch, Silcton Task, Non-Silcton Task, and Baseline conditions, respectively). For the main analyses reported below, we collapsed participants across the four learning conditions as these were not relevant to our current hypothesis. Supplementary analyses found no significant effect of learning condition on absolute pointing error (F < 1) but a significant relationship between learning condition and Gardony scores (F(3, 74) = 2.98, p = .037). However, when we included learning condition as a covariate in the linear model reported below, we found that experienced integration remained a significant predictor (F(1, 72) = 4.56, p = .036), while learning condition was not significant (F(3, 72) = 2.15, p = .100). Learning condition also remained a non-significant predictor of absolute pointing error in the overall model (F < 1). There were also no significant differences in experienced integration scores between the four learning conditions (F(3, 74) = 1. 42, p = .243).
Dataset Subsetting
Out of the full sample of 172 participants, 5 were removed for falling more than 2 standard deviations below the mean in the pointing task, 1 due to experimenter error, and 2 participants for not disclosing their gender. While the present study made no predictions regarding gender differences, we were not able to recover gender data from these two participants. Of the 164 participants remaining after these exclusions, 78 had complete navigation logs. The other participants had complete pointing and map-drawing datasets but due to a technical issue with the Virtual Silcton website, their navigation logs were truncated, meaning that each contained no more than a few minutes of data.
Experiment 2
Participants
We recruited 52 participants to test the preregistered hypotheses (https://osf.io/8dj5x). Participants for this sample were recruited on SONA from the Temple Psychology and the University of Pennsylvania undergraduate research pools. All participants completed the task for credit. The experiment was approved by both university Institutional Review Boards.
Procedure
Participants completed the exploration task on the same online platform as in Experiment 1. Due to the Covid-19 pandemic, we were unable to test participants in person. Instead, participants joined a Zoom call with their camera off and shared their screen. This enabled the experimenter to provide participants with verbal instructions, answer any questions in real-time, and monitor progress throughout the task. The participants’ screens were not recorded during these sessions, but their locations when navigating in the virtual reality environments were logged.
All participants completed three phases: 1) exploration, 2) on-site pointing, and 3) model-building. During exploration, each participant was given 25 minutes to roam the environment freely. They were instructed to attempt to find the 8 named buildings and to remember the names and locations of these buildings. They explored the environment continuously, but they were alerted every 5 minutes to help them keep track of time. The on-site pointing task was the same as in Experiment 1: participants were placed next to each building in the virtual environment and asked to point to every other building. Because the study was completed remotely, we were not able to collect drawn maps. Instead, we asked the participants to complete a drag-and-drop model-building task. Participants were given a blank rectangle on the screen and bird’s eye view images of all eight buildings. They were instructed to drag and drop the images on the screen in the correct configuration to construct a map of the environment. The on-site pointing task and the model-building task are described in detail in Weisberg et al. (2014; 2015). Both tasks were untimed.
We also asked participants in this experiment to complete the Perspective-Taking Task (for Adults; Frick et al., 2014) and the Santa Barbara Sense of Direction Task (Hegarty et al, 2002). These standardized measures of spatial ability were included to test whether the exploration patterns we observed were related to trait differences in navigational ability. Participants filled out the SBSOD questionnaire prior to participating to avoid biasing their responses based on their perceived accuracy in the present task, and completed the PTT-A task at the very end of the experiment. We did not analyze the PTT-A results in the present experiment.
Cognitive Map Accuracy
Accuracy in the on-site pointing task was assessed using the same procedure as Experiment 1. For the drag-and-drop model building task, we used bidimensional regression to assess the consistency between the coordinates of the placed icons and the locations of the corresponding buildings in the environment. The resulting R2 value (ranging from 0-1) was used as the dependent variable.
Data preprocessing
Prior to running any analyses, we removed all periods during which participants were stationary for more than 30 seconds from the navigation logs. This approach served to filter out the 1-minute time periods when participants were completing tasks associated with their assigned condition in between periods of exploration in Experiment 1. Pointing scores collected via virtualsilcton.com in Experiment 1 were corrected using the algorithm described in (Weisberg et al., 2021). Pointing scores in Experiment 2 did not need to be corrected.
Data analysis
To test the relationship between experienced integration and subsequent cognitive map accuracy, we performed linear regression analyses in R (R Core Team). We report standardized beta estimates extracted using the lm.beta package in R (Behrendt, 2014). Effect sizes are expressed as partial eta squared values (ηρ2) for each predictor (calculated using the effectsize package; Ben-Shachar et al., 2020).
Experienced integration
To relate environmental characteristics to participants’ exploration patterns, we relied on axial integration values previously reported for Virtual Silcton by Pagkratidou et al. (2020). As a summary measure for each participant, we calculated the average integration value of their trajectory (= experienced integration). The integration value at each 100 ms time increment (data sampling rate) was added to a vector and averaged across the entire time each participant spent exploring (after filtering out stationary periods of over 30s, as described above). The experienced integration value is therefore a single number; the average of moment-by-moment values for each participant (Fig. 1A).
Figure 1.

A) To calculate experienced integration for each participant, we extracted the axial integration values reported by Pagkratidou et al. (2020) for each point along the participant’s trajectory and computed their average. The black dot indicates the start location for all participants. B) An example participant’s trajectory, color-coded according to the axial integration values, alongside all participants’ color-coded trajectories. C) Variability of experienced integration in Experiment 1 (left) was significantly related to participants’ pointing ability (middle) and to the accuracy of the maps they drew (right). D) Variability of experienced integration In Experiment 2 (left) was significantly related to participants’ pointing ability (middle), but was unrelated to the accuracy of their drag-and-drop maps (right). Panel B was visualized using matplotlib (Hunter, 2007), and the distribution plots in panels C and D were visualized using raincloud plots in R (Allen et al., 2021). The raincloud plots represent the full distribution of the data in scatterplots, and the accompanying boxplots use default ggplot2 settings: the middle notch represents the median, with the upper and lower bounds of the box representing the 25th and 75th quintiles, and the whiskers extending to 95% confidence intervals.
Participants who spent more time on high-integration segments would therefore have higher experienced integration values than those who spent more time exploring low-integration segments. When deriving this measure, all coordinates more than 10 virtual units away from the path were removed, as no integration value could be assigned to them. As a control covariate, we also calculated the proportion of off-path timepoints out of the total exploration time for each participant.
Roaming entropy
Roaming entropy was calculated as Shannon’s entropy, across 2,500 states in the environment (50 x 50 grid). Roaming entropy is based on the probability of a subject being in a particular state, or location, in a given environment across the entire time period of observation (Freund et al., 2013; Heller et al., 2020).
In this equation, pij represents the proportion of time across the entire exploration phase that participant i spent in location j. The total number of states in the environment (in our case, 2,500), is represented by n.
Speed: Mean squared displacement
As an additional measure, we also calculated speed of movement. Speed was expressed as the mean squared displacement (MSD), calculated as the squared value of the displacement at each time-step in any direction, following prior approaches (Gagnon et al., 2018). The step-wise values were then averaged to derive a single value for the entire exploration phase for each participant.
The speed of movement was fixed (i.e., no acceleration/deceleration), and MSD was calculated in 100 ms timesteps, the rate at which data was logged throughout the experiment. In this sense, MSD provides a measure of pausing during exploration.
Results
We first investigated whether the correspondence between exploration patterns and the graph structure of the environment (experienced integration) predicted cognitive map accuracy. We next compared participants’ performance to three alternative simulated model navigators. Finally, we related each participant’s coverage of the environment (roaming entropy) to their cognitive map accuracy.
Experienced integration
Our hypothesis was that participants who explored areas of high global connectivity would form better cognitive maps. In Experiment 1, higher experienced integration was related to lower absolute pointing error (β = −.477, p < .001, ηρ2 = .234; Fig. 1C) and more accurate hand-drawn maps (β = .295, p = .010, ηp2 = .09; Fig. 1C). The proportion of time spent off-path had no effect on pointing error (β = .042, p = .680, ηp2 = .002) or Gardony scores (β= −.044, p = .696, ηp2 = .002).
In Experiment 2, higher experienced integration again predicted lower absolute pointing error (β = −.347, p = .015, ηp2 = .100), in line with our pre-registered predictions (Fig. 1D). There was again no significant relationship between pointing accuracy and the time spent off-path (β = .164, p = .241, ηp2 = .030). Somewhat surprisingly, however, we did not find a significant relationship between experienced integration and the bidimensional regression R2 value for the drag-and-drop model building task (β = .077, p = .589, ηp2 < .001; Fig. 1D), and we observed a somewhat weak, but significant relationship between the proportion of time spent off-path and the R2 value (β = −.292, p = .044, ηp2 = .080).
Simulated navigation trajectories
The results above show that there is a relationship between exploration patterns and cognitive map formation. One possible driver of this relationship might be strategy: participants who are able to integrate across distal locations in the environment (Fig. 1C–D) might recognize the areas in the environment that are more informative and approach these areas with greater frequency compared to peripheral areas. Such a difference in strategy might be reflected in a tendency to choose paths at decision points that gravitate toward high-connectivity areas. In contrast, less accurate mappers might make choices at decision points that are more random. To formally model this idea, we generated simulated trajectories based on three different possible approaches to exploration: 1) random walk, 2) proportional connectivity bias, and 3) consistent connectivity bias. The code to generate these simulations is available on GitHub (https://github.com/ivabrunec/nav_free_exploration).1
The proportional and consistent connectivity bias simulations assume that the navigator can see alternative options at each intersection, or that the alternatives can be retrieved from memories formed during prior passage through the same area. However, we did not formally model the contributions of memory and perception in the present approach. The proportional connectivity approach simply assumes a tendency to prefer more connected nodes, while the consistent connectivity approach assumes a tendency to consistently take paths that lead to more connected nodes.
Random walk.
It is important to consider what random behavior is for a realistic human navigator. The simplest possibility would be to compare participants’ trajectories against Brownian motion patterns, in which they randomly reorient at each step. However, it is unlikely that human navigators, even very bad ones, would exhibit such behavior in a complex, structured environment with clearly defined paths. Instead, to generate ‘human-like random behavior’, we generated simulated trajectories following random walks through the environment expressed as a graph. Random walks were implemented by making a random choice at each decision point, with the constraint that backtracking was prohibited to prevent the navigator from bouncing between pairs of graph nodes.
Proportional connectivity bias.
The second approach we implemented was more directed and comprised weighing the options at each decision point based on their subsequent interconnectivity. Under this strategy, a navigator uses memories for local navigational information (e.g. which nodes have more paths) to make choices that will hopefully guide them to areas of higher global connectivity, and thus allow them to build up a better cognitive map. If we take an example of a decision point with two options, path 1 leading to a decision point with three connections would be given a weight of 3, while path 2 leading to a decision point with two connections would be given a weight of 2. Under a proportional connectivity bias, the simulated navigator picks path 1 60% of the time and path 2 40% of the time (rather than 50/50).
Consistent connectivity bias.
In our third approach, the simulated navigator was highly biased to choose the path leading to the most interconnected decision point. Weights were determined the same way as in the approach above, but in this case the navigator consistently chose the path leading to the most interconnected node. If there was more than one option with the highest weight, the navigator randomly selected between the maximally-weighted options. The choices made in both the proportional connectivity bias and the consistent connectivity bias simulations are independent of the navigator’s history, but both approaches assume that the navigator has some knowledge or intuition about the environment.
For each of these simulation approaches, we generated 1,000 trajectories for each experiment, which matched the average human trajectories in travel time and distance (see Supplementary Materials). We then calculated the average experienced integration for each of the simulated trajectories in the same way as we did for human participants. To relate the exploration behavior of the simulations to the exploration behavior of the human participants, we split participants into tertiles depending on their performance on the onsite pointing task (Fig. 2A–B). This split was not motivated by any belief that participants belong to different clusters, but rather was done to facilitate statistical comparisons between participants at different levels of cognitive mapping ability and the simulations. We then carried out 1,000 bootstrapped independent-samples t-tests with 1,000 samples each (Canty & Ripley, 2021; Davison & Hinkley, 1997) comparing experienced integration for participants in each of the tertiles against experienced integration for a matched number of randomly sampled simulated trajectories, and calculated the proportion of significant t-tests in each case. A non-significant t-test would indicate that human trajectories in a tertile could not be reliably differentiated from a given simulation approach.
Figure 2.
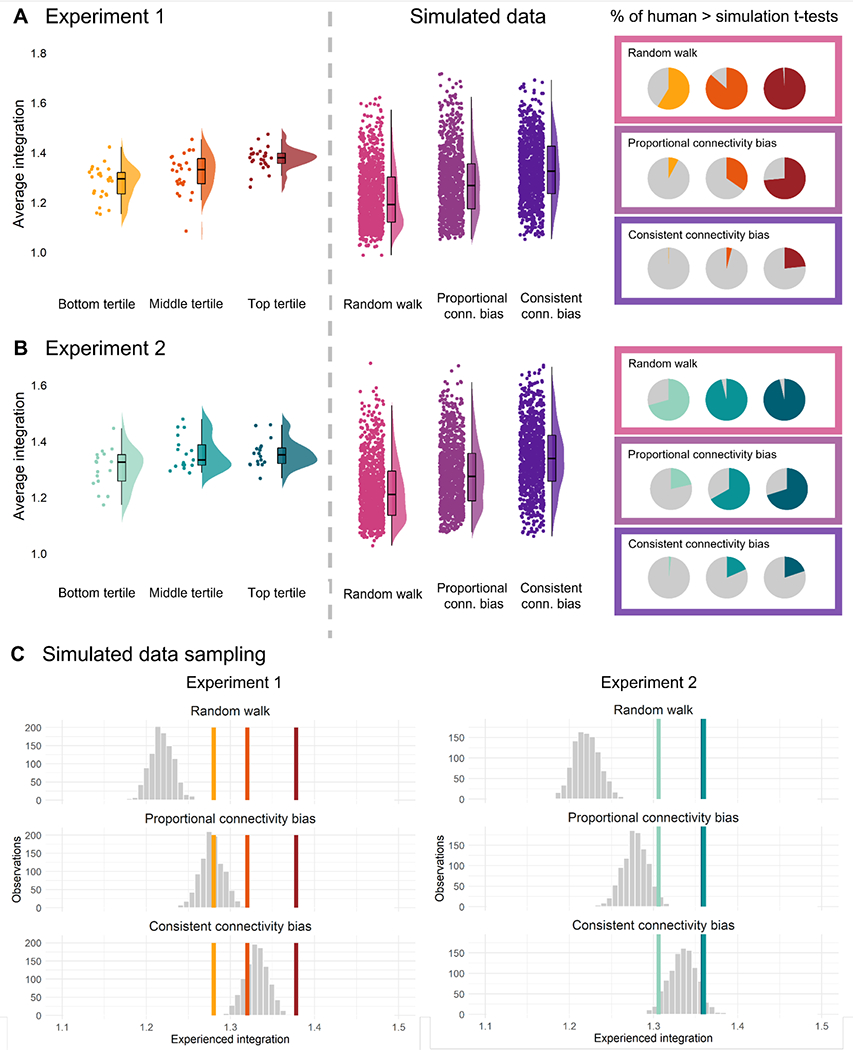
A) The integration values for each participant in Experiment 1 split into tertiles according to on-site pointing ability (left); integration values for simulated navigators using different strategies (middle); proportion of 1,000 bootstrapped t-tests for which the human navigators in each tertile perform better that the simulated navigators. B) The same data for Experiment 2. C) The distribution of means sampled from each simulated distribution (1,000 samples per mean) vs. the mean experienced integration in each human sample. The same colors denote the same tertiles, always following left-to-right from the bottom to the top tertile. Note that in Experiment 2, the middle and top tertile means were nearly identical, making them difficult to differentiate.
Experiment 1: Comparison of model to human data
In Experiment 1, human participants had higher integration values than the random walk simulation in 98.7% of comparisons for the top tertile, 86.5% of comparisons for the middle tertile, but only 58.8% of comparisons for the bottom tertile (Fig 2A). These data suggest that while the majority of human participants outperform a random walker, there is a subset of participants (i.e. those in the bottom tertile of mapping performance) whose exploration behavior matches the profile of making a random decision at each decision point.
An even more striking pattern was observed when we compared human participants to the proportional connectivity bias simulations. Human participants had higher integration values than this simulated navigator in 73.5% comparisons for the top tertile, but only 34.7% of comparisons for the middle tertile and 7.7% of comparisons for the bottom tertile.
Finally, we found that human participants had higher integration values than the consistent connectivity bias simulation in only 23.3% of the top tertile comparisons, 4.0% of the middle tertile comparisons, and 0.2% of the bottom tertile comparisons. These findings suggest that most human participants, even those with good mapping ability, fail to match the profile of a highly biased navigator who consistently detects and selects the most highly interconnected nodes in the underlying graph of the environment. This result is not surprising, as this latter simulation approach is based on the navigator possessing full knowledge of the environmental structure throughout the exploration phase.
Experiment 2: Comparison of model to human data
A similar pattern overall was observed in Experiment 2. Human integration values were significantly higher than the random walk integration values in 96.2% of comparisons for the top tertile, 96.1% of comparisons for the middle tertile, but only 70.6% of comparisons for the bottom tertile (Fig. 2).
Relating human values to the proportional connectivity bias simulations revealed that human navigators had higher integration values than the simulated navigators in 70.2% of comparisons for the top tertile, 66.8% for the middle tertile, and 21.4% for the bottom tertile (Fig. 2A). Thus integration values for participants with middling-to-poor navigational abilities are consistent with an exploration strategy of gravitating towards more interconnected nodes in the underlying graph, but not doing so consistently.
Finally, compared to the consistent connectivity bias, higher integration values were observed in 19.9% of comparisons with the top tertile, 18.4% for the middle tertile, and 1.8% for the bottom tertile in Experiment 2 (Fig. 2C).
Experiment 1 & 2: Comparison to model sample means
To generate group-level statistics, we took the following approach: we sampled each of the simulated datasets 1,000 times, randomly selecting as many simulated values as participants in each study in each sample (78 in Experiment 1 and 52 in Experiment 2). We then calculated the mean of each sample and plotted the distribution against the human mean in each tertile. In this way, the proportion of samples that are below the true mean for each human participant tertile can be interpreted as a p-value (Fig. 2C).
In Experiment 1, the mean integration values in all three tertiles were significantly greater than the random walk simulation distribution (all p-values < .001; Fig. 2C). Compared to the proportional connectivity bias simulation, the means of the participants in the top tertile (p <.001) and middle tertile (p = .005) were significantly greater than the simulations, while the bottom tertile mean did not significantly differ from this simulation (p = .545). The top tertile mean was significantly greater than the consistent connectivity bias as well (p < .001), while the middle tertile (p = .829) and the bottom tertile (p > .99) means were not.
Note that this analysis simply compared the means of the distributions and did not take into account the spread of values within each tertile and each sample of the simulation. This approach is different from our earlier analysis, in which we performed individual statistical tests on sampled distributions. Thus, it is possible to observe a significant difference in means in the current analysis even though in the previous analysis there were only a relatively small number of individual samples that reached significance. For example, the mean of human performance for the top tertile was greater than the mean of the consistent connectivity bias simulation, even though this difference only reached significance in 23.3% of individual samples.
In Experiment 2, the top two tertiles had nearly identical means (Fig. 2C). This was reflected in the significance values: all three tertile means were significantly greater than the random walk simulation (all ps < .001). In contrast to Experiment 1, all three tertile means were also significantly greater than the proportional connectivity bias simulation, though this effect was more pronounced for the top two tertiles (p < .001), compared to the bottom tertile (p = .042). As in Experiment 1, the bottom tertile mean was not significantly different from the consistent connectivity bias simulation (p = .978), but the middle (p = .085) and top tertiles (p = .095) were also not significantly different, though consistent with the trend in Experiment 1 (Fig. 2C).
Together, these data make it plausible that the individual variability that we observed in cognitive maps might reflect the use of different navigational strategies that vary in how successfully they draw navigators to regions of high integration.
Relationship to self-reported navigational ability
How do the individual differences in exploration that we observe relate to trait-level individual differences? Individual differences in navigational ability, measured by the Santa Barbara Sense of Direction scale (Hegarty et al, 2002) have previously been related to behavioral measures of navigation testing the ability to use cognitive maps. This raises the possibility that they might also relate to the ability to learn new cognitive maps through exploration.
Based on the results of Experiment 1, we preregistered the hypotheses that 1) self-reported navigational ability (SBSOD) should predict pointing ability, and 2) experienced integration should be a mediator of the relationship between SBSOD and pointing ability. To address hypothesis (1), we fit two multiple regression models, predicting absolute pointing error or the model-building R2 value from experienced integration, SBSOD score, and the time spent off-path.
Experienced integration was a significant predictor of absolute pointing error in the multiple regression (β = −.358, p = .010, ηp2 = .104), recapitulating our previous finding from the correlation analysis. SBSOD was also a significant predictor, but had an approximately 50% smaller effect size (β = −.272, p = .049, ηp2 = .051). The time spent off-path was not a significant predictor (β = .240, p = .091, ηp2 = .058). Applying the same model to the bidimensional regression R2 values, we found no significant effect of experienced integration (β = .090, p = .502, ηp2 < .001), but there was a significant effect of SBSOD (β = .350, p = .012, ηp2 = .071), as well as a significant negative effect of the proportion of time spent off-path (β = −.390, p = .007, ηp2 = .141). These data suggest that both experienced integration and SBSOD predicted cognitive map accuracy independently, insofar as cognitive map accuracy is indexed by pointing accuracy.
We next performed a mediation analysis predicting pointing accuracy from SBSOD, with experienced integration as a mediator. The analysis was implemented using the mediation package in R (Tingley et al., 2017), running 1,000 simulations with nonparametric bootstrapping. We found no significant evidence for a mediation effect (β = −.191, 95% CI [−2.95, 2.24], p = .856). We also found no significant evidence for a similar mediation effect on the bidimensional regression R2 from model-building (β =~0, 95% CI [−.001, .02], p = .802).
Together, these analyses suggest that experienced integration remains predictive of pointing accuracy when accounting for self-reported trait individual differences in navigational ability, but does not mediate the relationship between trait abilities and cognitive map accuracy. This suggests that exploration efficiency may not be captured by self-reported measures of navigational abilities.
Roaming entropy
Roaming entropy measures the extent to which a navigator covers the entire environment in their exploration. Despite starting at the same location and being given the same amount of time to navigate, participants showed a range of roaming entropy values. Some participants tended to remain in fewer locations in the environment for a longer period of time, while others covered a greater range in the same amount of time (Fig. 3A).
Roaming entropy was not a significant predictor of pointing error in Experiment 1 (β = −.002, p = .986, ηp2 < .001) or Experiment 2 (β = .216, p = .125, ηp2 = .046). Nor did it predict Gardony scores in Experiment 1 (β = −.070, p = .542, ηp2 = .005; Fig. 3B) or bidimensional R2 values in Experiment 2 (β = −.215, p = .126, ηp2 = .046; Fig. 3C). These data suggest that the overall coverage of the environment is not, by itself, predictive of better cognitive maps. Rather, it is greater coverage of segments which are more integrated that predicts cognitive map accuracy.
To further understand the effects of experienced integration and roaming entropy, we entered both exploration measures into a single regression model, along with the proportion of time spent off-path. In Experiment 1, pointing accuracy was significantly predicted by experienced integration (β = −.520, p < .001, ηp2 = .240), but not roaming entropy (β = −.173, p = .113, ηp2 = .028). The proportion of time spent off-path was also not a significant covariate (β = .083, p = .429, ηp2 = .008). Gardony scores were again significantly predicted by experienced integration (β = .303, p = .011, ηp2 = .091), but not roaming entropy (β = .030, p = .802, ηp2 < .001) or the proportion of time spent off-path (β = −.051, p = .662, ηp2 = .003).
In Experiment 2, experienced integration had a somewhat smaller effect size in the overall model to Experiment 1, and was a marginally significant predictor of pointing accuracy (β = −.332, p = .052, ηp2 = .097). Roaming entropy was again not a significant predictor of pointing accuracy (β = .031, p = .868, ηp2 = .015), nor was the proportion of time spent off-path (β = .146, p = .412, ηp2 = .015). Bidimensional R2 values were not significantly predicted by any of the measures: experienced integration (β = .030, p = .861, ηp2 < .001), , roaming entropy (β = −.094, p = .616, ηp2 = .054), or time off-path (β = −−.236, p = .169, ηp2 = .035).
Finally, we wanted to account for the effect of movement speed on these measures. We added movement speed, calculated as the mean displacement over time, to the overall regression models reported above. In Experiment 1, pointing accuracy was significantly predicted by both experienced integration (β = −.393, p < .001, ηp2 = .260) and movement speed (β = −.304, p = .005, ηp2 = .102) when all variables were entered into a single model. As before, roaming entropy and the amount of time spent off-path were not significant (both p-values > .4). Gardony map scores were significantly predicted only by experienced integration (β = .271, p = .036, ηp2 = .092; all other p-values > .5). In Experiment 2, only displacement speed was a significant predictor of pointing accuracy when all of the factors were entered into a single model, suggesting that movement speed may interact with other exploration measures (β = −.321, p = .030, ηp2 = .105). No other measure was significant (all p-values > .3). No measure was significantly predictive of the model-building R2 coefficient (all p-values > .2).
Discussion
In the present study, we investigated how humans explore a previously unfamiliar virtual reality environment and how these exploration patterns affect the accuracy of the cognitive maps that they form. We found that experienced integration, or the amount of time spent in highly-interconnected parts of the environment, predicted cognitive map accuracy in two experiments, whereas roaming entropy, or the overall coverage of the environment, did not. While self-reported navigational ability was weakly related to accurate pointing ability, it did not relate to experienced integration, and experienced integration did not mediate the relationship between self-reported navigational ability and spatial memory. It is also worth noting that the relationship between individual differences in experienced integration and cognitive mapping was somewhat weaker in Experiment 2. Together, these data illustrate how different exploration patterns give rise to variability in cognitive maps and suggest that the structure of the environment plays an important role in the structure of acquired knowledge.
In the present study, participants were given no specific guidance on how to explore the environment, they were simply instructed to find all 8 buildings and remember their names. Despite the open-ended nature of this task, we found consistent differences in strategies between those participants who were able to build a relatively accurate map of the environment, and those who were not. Put simply, better mappers’ exploration patterns tended to track the network structure of the environment more closely than the patterns of less accurate mappers (experienced integration), and they tended to pause less while navigating (mean squared displacement). These findings suggest that moment-to-moment behavioral patterns can provide a window into the likely nature of the subsequent spatial representation.
Our findings replicate prior work suggesting that navigators with higher levels of spatial exploratory behavior form more accurate cognitive maps (Farran et al., 2021; Gagnon et al., 2018; Munion et al., 2019). Also mirroring prior results, we found no relationship between exploration measures and self-reported navigational abilities (Gagnon et al., 2018), despite significant relationships between 1) exploration and pointing performance and 2) self-reported spatial abilities and pointing performance. The present study also replicates the observation that participants who navigated more consistently and paused less and for shorter periods of time subsequently showed higher spatial memory performance (Gagnon et al., 2018).
Higher levels of exploration have also been linked to lower spatial anxiety (Gagnon et al., 2016, 2018) and higher well-being in general, as measured by day-to-day experience sampling (Heller et al., 2020). These findings converge on questions to be addressed in future research: are individuals with higher exploration tendencies less anxious in general, and does the tendency to explore in the spatial domain translate to curiosity and information sampling in non-spatial domains? This notion would fit with a previous finding that trait-level curiosity is predictive of knowledge network-building patterns in participants exploring Wikipedia pages (Lydon-Staley et al., 2021). Further, recent work suggests that both spatial and conceptual learning are captured by the same Bayesian generalization model (Wu et al., 2020), but it is unclear whether this would also extend to spatial knowledge acquired by active first-person navigation.
Simulated trajectories.
Our simulation approach suggested that the navigation patterns of participants with different cognitive mapping abilities can be captured by the use of different strategies at decision points. Even the least accurate mappers’ exploration patterns did not tend to be random, but rather consistent with a slight preference for interconnected nodes. In contrast, the most accurate mappers’ patterns were most akin to a directed walk, preferring to take paths that lead to nodes with highest connectivity values. These findings suggest that humans tend to select paths with many interconnections, relying on either visual information or memory for previously visited locations. The balance between these alternatives remains to be explored in future studies, but recent work suggests that even eye movement patterns during navigation are reflective of the graph structure of the environment (Walter et al., 2022).
Importantly, the similarity between human and simulated trajectories suggests that participants were relying on a forward-looking search strategy, as the decision of which path segment to take was reached based on the connectivity value of the subsequent decision point. These data are broadly consistent with the notion that mammals form predictive maps by extracting regularities and structure from the environment (de Cothi et al., 2021; Momennejad, 2020; Stachenfeld et al., 2017). Beyond the convergence with this theoretical viewpoint, our results also highlight the importance of carefully characterizing human navigational behavior when building computational models or artificial agents (Devlin et al., 2021) and for better understanding human exploration tendencies in new environments.
The structure of the task at hand and the structure of the environment are important drivers of learning. The nature of connections between bits of information shapes the speed of learning and nature of representations humans can form (Karuza et al., 2016; Lynn et al., 2020; Qian et al., 2021; Solway et al., 2014). For example, when information is organized as a structured graph, humans tend to pick up on clusters that are closest together on relevant dimension, such as time, space, or semantic distance. Establishing these clusters, or communities, enables us to represent tasks hierarchically and flexibly (Karuza et al., 2016; Solway et al., 2014) as we build structured knowledge by accumulating pieces of information over time (Duncan & Schlichting, 2018; Schapiro et al., 2013, 2016). Simulations and human behavioral experiments suggest that the structure of such information graphs is most useful to us if the communities are tightly clustered into ‘neighborhoods’ of information, highlighting that environments or knowledge structures with different levels of complexity also have different levels of learnability (Karuza et al., 2016; Lynn et al., 2020).
Correspondence between environmental features and exploration measures.
In the spatial domain, the geometry of the environment that one grew up in appears to affect subsequent navigation and spatial learning abilities (Barhorst-Cates et al., 2021; Coutrot et al., 2022). However, it has not yet been systematically tested whether individuals are similarly affected on all new spatial learning or whether there are gradations in strategy flexibility, rather than general ability. Future work will be necessary to determine whether individuals who are successful in a given exploration task would succeed at wayfinding in any new environment, or whether there are systematic interactions between individuals’ ability and environmental structures. A recent investigation of millions of participants suggests that growing up in an environment with a more regular structure impairs the ability to flexibly integrate across locations in new complex environments (Coutrot et al., 2022). Evidence from non-spatial associative structure learning in humans suggests that different stimulus presentation sequences corresponding to different walks through the graph of the task shape the observed behavioral biases (Karuza et al., 2017). Moreover, when participants are able to freely navigate such non-spatial graphs, their planning reflects the underlying hierarchical structure of the task (Solway et al., 2014; see also Balaguer et al., 2016). These observations dovetail with our present findings which suggest that participants generally showed sensitivity to the connectivity between the nodes in the present environment. However, we also present evidence that there are substantial individual differences in how efficient participants are at extracting such structure, and formal models of learning and exploration should account for these differences.
Interestingly, in the present experiment, the overall coverage of the environment (roaming entropy) was not predictive of cognitive map accuracy, again suggesting that the connectivity of the world was more relevant than the total amount of new territory covered. However, it is important to consider that the environment used in the present study was highly structured, with clearly defined paths. In such environments, the underlying graph properties may be the key factor constraining navigational strategy (Wiener et al., 2004; Wiener & Mallot, 2003). In large-scale open environments, on the other hand, navigational strategies fundamentally shift due to the difference in reference frames (Wolbers & Wiener, 2014), and direction-free displacement measures, such as diffusion or roaming entropy, might capture more navigational variance. Future studies should compare how well different measures capture exploration success in different environmental structures, and examine whether better navigators are able to adapt their strategy flexibly across these environments.
Limitations of the present work.
The present study had two key limitations. First, the effects we observed in Experiment 2 were somewhat attenuated relative to Experiment 1. In contrast to Experiment 1, we observed no significant relationship between exploration measures and the R2 value in the model-building task. There are multiple possible reasons for this discrepancy, but it is worth noting that participants were explicitly told that they would have to draw a map in Experiment 1 but not in Experiment 2. The absence of such a requirement may have led Experiment 2 participants to focus on encoding the buildings and their names, but not the relationships between them. Participants were also given more time to explore in Experiment 2 (25 minutes vs. 16 minutes) and each person completed the task on their own personal computer. While the participants were on a video call with the experimenter throughout the entire experiment, remote data collection meant that we were unable to standardize aspects such as screen size and resolution, distance from the screen, and potential brief glitches due to network/processor issues. Anecdotally, the longer exploration time in Experiment 2 meant that some participants indicated that they were ‘done’ exploring before the time was up, and were prompted by the experimenter to continue. This may have contributed to more aimless roaming in this experiment and diluted the strength of the effect of initial exploration.
Second, while we observed an otherwise consistent effect of environmental structure on cognitive map accuracy, we did not manipulate it, nor did we direct participants along more vs. less integrated paths. Because we did not manipulate the structure of the environment, we cannot be confident that the differences in strategies between more and less accurate mappers are not incidental. Nonetheless, the nature of the observed exploration patterns shaped subsequent performance, even if the exploration patterns themselves were incidental. Future studies will be necessary to disentangle the contributions of active navigational decision-making vs. the optimality of the route one experiences in a given environment. For example, it might be the case that simply being guided along inter-connected paths is sufficient for forming an accurate cognitive map. Alternatively, it is possible that less accurate mappers are also less efficient at extracting environmental structure from ongoing experience. This issue is important because it relates to the potential efficacy of guidance and signage designed to aid wayfinding in the real world.
Conclusions.
In everyday life, we often actively seek out new information and connections between existing elements of knowledge through exploration – be it in space, social contexts, or existing elements of semantic knowledge (Lydon-Staley et al., 2021). According to some estimates, we consume approximately 34 gigabytes of information in media alone on a daily basis (Bohn & Short, 2012), which is a daunting amount of content to explore, but somehow we are able to seamlessly organize and structure the new knowledge acquired through everyday experience. The present findings suggest that, in the spatial domain at least, this challenge is accomplished in part by the use of intelligent information sampling strategies, and that fine-grained differences in these sampling strategies are reflected in subsequent cognitive maps.
Supplementary Material
Acknowledgments
This research was supported by a Discovery grant from the Natural Sciences and Engineering Research Council to J.E.S., National Institutes of Health grant R01 EY031286 to R.A.E., and National Science Foundation grant EHR 1660996 to N.S.N. We thank Sarah Hendricks and Mitchell Decasere for their help with data collection for Experiment 2.
Footnotes
Publisher's Disclaimer: This is a PDF file of an unedited manuscript that has been accepted for publication. As a service to our customers we are providing this early version of the manuscript. The manuscript will undergo copyediting, typesetting, and review of the resulting proof before it is published in its final form. Please note that during the production process errors may be discovered which could affect the content, and all legal disclaimers that apply to the journal pertain.
Note that the precise values will change slightly if the simulation code is re-run, since the generated integration values will differ, as will the sampling in the bootstrapping procedure.
CRediT author statement: Exploration patterns shape cognitive map learning
Iva K. Brunec: Conceptualization, Methodology, Software, Formal analysis, Investigation, Writing - Original Draft, Visualization. Melissa M. Nantais: Conceptualization, Methodology, Formal Analysis, Investigation, Resources, Writing - Review & Editing. Jennifer E. Sutton: Conceptualization, Methodology, Resources, Writing - Review & Editing, Supervision, Project administration, Funding acquisition. Russell A. Epstein: Conceptualization, Methodology, Writing - Review & Editing, Supervision, Project administration, Funding acquisition. Nora S. Newcombe: Conceptualization, Methodology, Writing - Review & Editing, Supervision, Project administration, Funding acquisition.
References
- Allen M, Poggiali D, Whitaker K, Rhys Marshall T, van Langen J, & Kievit RA (2021). Raincloud plots: A multi-platform tool for robust data visualization. Wellcome Open Research, 4(63). [DOI] [PMC free article] [PubMed] [Google Scholar]
- Balaguer J, Spiers H, Hassabis D, & Summerfield C (2016). Neural Mechanisms of Hierarchical Planning in a Virtual Subway Network. Neuron, 90(4), 893–903. 10.1016/j.neuron.2016.03.037 [DOI] [PMC free article] [PubMed] [Google Scholar]
- Barhorst-Cates EM, Meneghetti C, Zhao Y, Pazzaglia F, & Creem-Regehr SH (2021). Effects of home environment structure on navigation preference and performance: A comparison in Veneto, Italy and Utah, USA. Journal of Environmental Psychology, 74, 101580. [Google Scholar]
- Behrendt S (2014). Im.beta: Add Standardized Regression Coefficients to Im-Objects (1.5-1) [Computer software].
- Bellmund JLS, Gärdenfors P, Moser EI, & Doeller CF (2018). Navigating cognition: Spatial codes for human thinking. Science, 362(6415), eaat6766. 10.1126/science.aat6766 [DOI] [PubMed] [Google Scholar]
- Ben-Shachar M, Lüdecke D, & Makowski D (2020). effectsize: Estimation of effect size indices and standardized parameters. Journal of Open Source Software, 5(56), 2815. [Google Scholar]
- Bohn R, & Short J (2012). Measuring consumer information. International Journal of Communication, 6, 980–1000. [Google Scholar]
- Calhoun AJ, & Hayden BY (2015). The foraging brain. Current Opinion in Behavioral Sciences, 5, 24–31. 10.1016/j.cobeha.2015.07.003 [DOI] [Google Scholar]
- Canty A, & Ripley B (2021). boot: Bootstrap R (S-Plus) Functions (1.3-28) [Computer software].
- Chentanez N, Barto A, & Singh S (2004). Intrinsically motivated reinforcement learning. Advances in Neural Information Processing Systems, 17. [Google Scholar]
- Chrastil ER, & Warren WH (2012). Active and passive contributions to spatial learning. Psychonomic Bulletin & Review, 19(1), 1–23. 10.3758/s13423-011-0182-x [DOI] [PubMed] [Google Scholar]
- Cothi W. de, Nyberg N, Griesbauer E-M, Ghanamé C, Zisch F, Lefort JM, Fletcher L, Newton C, Renaudineau S, Bendor D, Grieves R, Duvelle É, Barry C, & Spiers HJ (2021). Predictive Maps in Rats and Humans for Spatial Navigation: The Successor Representation Explains Flexible Behaviour. BioRxiv, 2020.09.26.314815. 10.1101/2020.09.26.314815 [DOI] [Google Scholar]
- Coutrot A, Manley E, Goodroe S, Gahnstrom C, Filomena G, Yesiltepe D, Dalton RC, Wiener JM, Hölscher C, Hornberger M, & Spiers HJ (2022). Entropy of city street networks linked to future spatial navigation ability. Nature, 604, 104–110. [DOI] [PubMed] [Google Scholar]
- Davidson JD, & El Hady A (2019). Foraging as an evidence accumulation process. PLoS Computational Biology, 15(7), e1007060. [DOI] [PMC free article] [PubMed] [Google Scholar]
- Davison AC, & Hinkley DV (1997). Bootstrap Methods and Their Applications. Cambridge University Press. [Google Scholar]
- Devlin S, Georgescu R, Momennejad I, Rzepecki J, Zuniga E, Costello G, Leroy G, Shaw A, & Hofmann K (2021). Navigation Turing Test (NTT): Learning to Evaluate Human-Like Navigation. ArXiv Preprint ArXiv:2105.09637. [Google Scholar]
- Duncan KD, & Schlichting ML (2018). Hippocampal representations as a function of time, subregion, and brain state. Neurobiology of Learning and Memory, 153, 40–56. [DOI] [PubMed] [Google Scholar]
- Emo B (2014). Seeing the axial line: Evidence from wayfinding experiments. Behavioral Sciences, 4(3), 167–180. [DOI] [PMC free article] [PubMed] [Google Scholar]
- Epstein RA, Patai EZ, Julian JB, & Spiers HJ (2017). The cognitive map in humans: Spatial navigation and beyond. Nature Neuroscience, 20(11), 1504–1513. 10.1038/nn.4656 [DOI] [PMC free article] [PubMed] [Google Scholar]
- Farran EK, Blades M, Hudson KD, Sockeel P, & Courbois Y (2021). Spatial exploration strategies in childhood; exploration behaviours are predictive of successful navigation. PsyArXiv. https://scholar.google.com/citations?view_op=view_citation&hl=en&user=oXuesi4AAAAJ&sortby=pubdate&citation_for_view=oXuesi4AAAAJ:PR6Y55bgFSsC [Google Scholar]
- Freund J, Brandmaier AM, Lewejohann L, Kirste I, Kritzler M, Krüger A, Sachser N, Lindenberger U, & Kempermann G (2013). Emergence of individuality in genetically identical mice. Science, 340(6133), 756–759. [DOI] [PubMed] [Google Scholar]
- Frick A, Möhring W, & Newcombe NS (2014). Picturing perspectives: Development of perspective-taking abilities in 4-to 8-year-olds. Frontiers in Psychology, 5, 386. [DOI] [PMC free article] [PubMed] [Google Scholar]
- Furman AJ, Clements-Stephens AM, Marchette SA, & Shelton AL (2014). Persistent and stable biases in spatial learning mechanisms predict navigational style. Cognitive, Affective, & Behavioral Neuroscience, 14(4), 1375–1391. [DOI] [PubMed] [Google Scholar]
- Gagnon KT, Cashdan EA, Stefanucci JK, & Creem-Regehr SH (2016). Sex Differences in Exploration Behavior and the Relationship to Harm Avoidance. Human Nature, 27(1), 82–97. 10.1007/s12110-015-9248-1 [DOI] [PubMed] [Google Scholar]
- Gagnon KT, Thomas BJ, Munion A, Creem-Regehr SH, Cashdan EA, & Stefanucci JK (2018). Not all those who wander are lost: Spatial exploration patterns and their relationship to gender and spatial memory. Cognition, 180, 108–117. 10.1016/j.cognition.2018.06.020 [DOI] [PubMed] [Google Scholar]
- Gardony AL, Taylor HA, & Brunyé TT (2016). Gardony Map Drawing Analyzer: Software for quantitative analysis of sketch maps. Behavior Research Methods, 48(1), 151–177. [DOI] [PubMed] [Google Scholar]
- Ghosh A, Puthusseryppady V, Chan D, Mascolo C, & Hornberger M (2022). Machine learning detects altered spatial navigation features in outdoor behaviour of Alzheimer’s disease patients. Scientific Reports, 12(1). https://scholar.google.com/citations?view_op=view_citation&hl=en&user=w968axsAAAAJ&sortby=pubdate&citation_for_view=w968axsAAAAJ:5n9gSBKMxCsC [DOI] [PMC free article] [PubMed] [Google Scholar]
- Gruber MJ, & Ranganath C (2019). How curiosity enhances hippocampus-dependent memory: The prediction, appraisal, curiosity, and exploration (PACE) framework. Trends in Cognitive Sciences, 23(12), 1014–1025. [DOI] [PMC free article] [PubMed] [Google Scholar]
- Hegarty M, Richardson AE, Montello DR, Lovelace K, & Subbiah I (2002). Development of a self-report measure of environmental spatial ability. Intelligence, 30(5), 425–447. [Google Scholar]
- Heller AS, Shi TC, Ezie CEC, Reneau TR, Baez LM, Gibbons CJ, & Hartley CA (2020). Association between real-world experiential diversity and positive affect relates to hippocampal–striatal functional connectivity. Nature Neuroscience, 23(7), 800–804. 10.1038/s41593-020-0636-4 [DOI] [PMC free article] [PubMed] [Google Scholar]
- Hillier B, & Hanson J (1989). The social logic of space. Cambridge university press. [Google Scholar]
- Howard LR, Javadi AH, Yu Y, Mill RD, Morrison LC, Knight R, Loftus MM, Staskute L, & Spiers HJ (2014). The Hippocampus and Entorhinal Cortex Encode the Path and Euclidean Distances to Goals during Navigation. Current Biology, 24(12), 1331–1340. 10.1016/j.cub.2014.05.001 [DOI] [PMC free article] [PubMed] [Google Scholar]
- Hunter JD (2007). Matplotlib: A 2D Graphics Environment. Computing in Science & Engineering, 9(3), 90–95. [Google Scholar]
- Ishikawa T, & Montello DR (2006). Spatial knowledge acquisition from direct experience in the environment: Individual differences in the development of metric knowledge and the integration of separately learned places. Cognitive Psychology, 52(2), 93–129. 10.1016/j.cogpsych.2005.08.003 [DOI] [PubMed] [Google Scholar]
- Javadi A-H, Emo B, Howard LR, Zisch FE, Yu Y, Knight R, Pinelo Silva J, & Spiers HJ (2017). Hippocampal and prefrontal processing of network topology to simulate the future. Nature Communications, 8, 14652. 10.1038/ncomms14652 [DOI] [PMC free article] [PubMed] [Google Scholar]
- Julian JB, Keinath AT, Frazzetta G, & Epstein RA (2018). Human entorhinal cortex represents visual space using a boundary-anchored grid. Nature Neuroscience, 21(2), 191–194. [DOI] [PMC free article] [PubMed] [Google Scholar]
- Kaplan R, Doeller CF, Barnes GR, Litvak V, Düzel E, Bandettini PA, & Burgess N (2012). Movement-Related Theta Rhythm in Humans: Coordinating Self-Directed Hippocampal Learning. PLOS Biology, 10(2), e1001267. 10.1371/journal.pbio.1001267 [DOI] [PMC free article] [PubMed] [Google Scholar]
- Karuza EA, Kahn AE, Thompson-Schill SL, & Bassett DS (2017). Process reveals structure: How a network is traversed mediates expectations about its architecture. Scientific Reports, 7(1), 12733. [DOI] [PMC free article] [PubMed] [Google Scholar]
- Karuza EA, Thompson-Schill SL, & Bassett DS (2016). Local Patterns to Global Architectures: Influences of Network Topology on Human Learning. Trends in Cognitive Sciences, 20(8), 629–640. 10.1016/j.tics.2016.06.003 [DOI] [PMC free article] [PubMed] [Google Scholar]
- Killian NJ, Jutras MJ, & Buffalo EA (2012). A map of visual space in the primate entorhinal cortex. Nature, 491(7426), 761–764. [DOI] [PMC free article] [PubMed] [Google Scholar]
- Krupic J, Bauza M, Burton S, Barry C, & O’Keefe J (2015). Grid cell symmetry is shaped by environmental geometry. Nature, 518(7538), 232–235. [DOI] [PMC free article] [PubMed] [Google Scholar]
- Lydon-Staley DM, Zhou D, Blevins AS, Zurn P, & Bassett DS (2021). Hunters, busybodies and the knowledge network building associated with deprivation curiosity. Nature Human Behaviour, 5(3), 327–336. 10.1038/s41562-020-00985-7 [DOI] [PMC free article] [PubMed] [Google Scholar]
- Lynn CW, Kahn AE, Nyema N, & Bassett DS (2020). Abstract representations of events arise from mental errors in learning and memory. Nature Communications, 11(1), 2313. 10.1038/s41467-020-15146-7 [DOI] [PMC free article] [PubMed] [Google Scholar]
- Momennejad I (2020). Learning Structures: Predictive Representations, Replay, and Generalization. Current Opinion in Behavioral Sciences, 32, 155–166. 10.1016/j.cobeha.2020.02.017 [DOI] [PMC free article] [PubMed] [Google Scholar]
- Monaco JD, Rao G, Roth ED, & Knierim JJ (2014). Attentive scanning behavior drives one-trial potentiation of hippocampal place fields. Nature Neuroscience, 17(5), 725–731. [DOI] [PMC free article] [PubMed] [Google Scholar]
- Munion AK, Stefanucci JK, Rovira E, Squire P, & Hendricks M (2019). Gender differences in spatial navigation: Characterizing wayfinding behaviors. Psychonomic Bulletin & Review, 26(6), 1933–1940. 10.3758/s13423-019-01659-w [DOI] [PubMed] [Google Scholar]
- Nantais M (2019). Exploring Cognitive Maps through Sketching. Electronic Thesis and Dissertation Repository, https://ir.lib.uwo.ca/etd/6788 [Google Scholar]
- Pagkratidou M, Galati A, & Avraamides M (2020). Do environmental characteristics predict spatial memory about unfamiliar environments? Spatial Cognition and Computation, 20(1), 1–32. [Google Scholar]
- Peer M, Brunec IK, Newcombe NS, & Epstein RA (2021). Structuring Knowledge with Cognitive Maps and Cognitive Graphs. Trends in Cognitive Sciences, 25(1), 37–54. 10.1016/j.tics.2020.10.004 [DOI] [PMC free article] [PubMed] [Google Scholar]
- Penn A (2003). Space syntax and spatial cognition: Or why the axial line? Environment and Behavior, 35(1), 30–65. [Google Scholar]
- Pfeiffer BE, & Foster DJ (2013). Hippocampal place-cell sequences depict future paths to remembered goals. Nature, 497(7447), 74–79. [DOI] [PMC free article] [PubMed] [Google Scholar]
- Qian W, Lynn CW, Klishin AA, Stiso J, Christianson NH, & Bassett DS (2021). Optimizing the Human Learnability of Abstract Network Representations. ArXiv:2111.12236 [Physics]. http://arxiv.org/abs/2111.12236 [DOI] [PMC free article] [PubMed] [Google Scholar]
- R Core Team. (n.d.). R: A language and environment for statistical computing (3.5.1) [Computer software]. R Foundation for Statistical Computing. https://www.R-project.org/ [Google Scholar]
- Schapiro AC, Rogers TT, Cordova NI, Turk-Browne NB, & Botvinick MM (2013). Neural representations of events arise from temporal community structure. Nature Neuroscience, 16(4), 486–492. 10.1038/nn.3331 [DOI] [PMC free article] [PubMed] [Google Scholar]
- Schapiro AC, Turk-Browne NB, Norman KA, & Botvinick MM (2016). Statistical learning of temporal community structure in the hippocampus. Hippocampus, 26(1), 3–8. 10.1002/hipo.22523 [DOI] [PMC free article] [PubMed] [Google Scholar]
- Schulz E, Wu CM, Ruggeri A, & Meder B (2019). Searching for rewards like a child means less generalization and more directed exploration. Psychological Science, 30(11), 1561–1572. [DOI] [PubMed] [Google Scholar]
- Schulz L (2012). The origins of inquiry: Inductive inference and exploration in early childhood. Trends in Cognitive Sciences, 16(7), 382–389. [DOI] [PubMed] [Google Scholar]
- Solway A, Diuk C, Córdova N, Yee D, Barto AG, Niv Y, & Botvinick MM (2014). Optimal Behavioral Hierarchy. PLOS Computational Biology, 10(8), e1003779. 10.1371/journal,pcbi.1003779 [DOI] [PMC free article] [PubMed] [Google Scholar]
- Song EY, Kim YB, Kim YH, & Jung MW (2005). Role of active movement in place-specific firing of hippocampal neurons. Hippocampus, 15(1), 8–17. 10.1002/hipo.20023 [DOI] [PubMed] [Google Scholar]
- Spiers HJ, & Maguire EA (2006). Thoughts, behaviour, and brain dynamics during navigation in the real world. NeuroImage, 31(4), 1826–1840. 10.1016/j.neuroimage.2006.01.037 [DOI] [PubMed] [Google Scholar]
- Stachenfeld KL, Botvinick MM, & Gershman SJ (2017). The hippocampus as a predictive map. Nature Neuroscience, 20(11), 1643–1653. 10.1038/nn.4650 [DOI] [PubMed] [Google Scholar]
- Terrazas A, Krause M, Lipa P, Gothard KM, Barnes CA, & McNaughton BL (2005). Self-Motion and the Hippocampal Spatial Metric. Journal of Neuroscience, 25(35), 8085–8096. 10.1523/JNEUROSCI.0693-05.2005 [DOI] [PMC free article] [PubMed] [Google Scholar]
- Tingley D, Yamamoto T, Hirose K, Keele L, & Imai K (2017). mediation: Causal Mediation Analysis (4.4.6) [Computer software].
- Uttal DH, Meadow NG, Tipton E, Hand LL, Alden AR, Warren C, & Newcombe NS (2013). The malleability of spatial skills: A meta-analysis of training studies. Psychological Bulletin, 139(2), 352–402. 10.1037/a0028446 [DOI] [PubMed] [Google Scholar]
- Vezzani G, Gupta A, Natale L, & Abbeel P (2019). Learning latent state representation for speeding up exploration. ArXiv Preprint ArXiv: 1905.12621. [Google Scholar]
- Weisberg SM, & Newcombe NS (2016). How do (some) people make a cognitive map? Routes, places, and working memory. Journal of Experimental Psychology: Learning, Memory, and Cognition, 42(5), 768. [DOI] [PubMed] [Google Scholar]
- Weisberg SM, Schinazi VR, Newcombe NS, Shipley TF, & Epstein RA (2014). Variations in cognitive maps: Understanding individual differences in navigation. Journal of Experimental Psychology: Learning, Memory, and Cognition, 40(3), 669. [DOI] [PubMed] [Google Scholar]
- Weisberg S, Schinazi V, Ferrario A, & Newcombe N (2021). Evaluating the Effects of a Programming Error on a Virtual Environment Measure of Spatial Navigation Behavior. PsyArXiv. 10.31234/osf.io/c8a5z [DOI] [PMC free article] [PubMed] [Google Scholar]
- Wiener JM, & Mallot HA (2003). ‘Fine-to-coarse’route planning and navigation in regionalized environments. Spatial Cognition and Computation, 3(4), 331–358. [Google Scholar]
- Wiener JM, Schnee A, & Mallot HA (2004). Use and interaction of navigation strategies in regionalized environments. Journal of Environmental Psychology, 24(4), 475–493. [Google Scholar]
- Winter SS, Mehlman ML, Clark BJ, & Taube JS (2015). Passive Transport Disrupts Grid Signals in the Parahippocampal Cortex. Current Biology, 25(19), 2493–2502. 10.1016/i.cub.2015.08.034 [DOI] [PMC free article] [PubMed] [Google Scholar]
- Walter JL, Essmann L, König SU, & König P (2022). Finding landmarks–An investigation of viewing behavior during spatial navigation in VR using a graph-theoretical analysis approach. PLOS Computational Biology, 18(6), e1009485. [DOI] [PMC free article] [PubMed] [Google Scholar]
- Wolbers T, & Hegarty M (2010). What determines our navigational abilities? Trends in Cognitive Sciences, 14(3), 138–146. 10.1016/j.tics.2010.01.001 [DOI] [PubMed] [Google Scholar]
- Wolbers T, & Wiener JM (2014). Challenges for identifying the neural mechanisms that support spatial navigation: The impact of spatial scale. Frontiers in Human Neuroscience, 8, 571. 10.3389/fnhum.2014.00571 [DOI] [PMC free article] [PubMed] [Google Scholar]
- Wu CM, Schulz E, Garvert MM, Meder B, & Schuck NW (2020). Similarities and differences in spatial and non-spatial cognitive maps. PLOS Computational Biology, 16(9), e1008149. 10.1371/journal.pcbi.1008149 [DOI] [PMC free article] [PubMed] [Google Scholar]
- Zurn P, & Bassett DS (2018). On Curiosity: A Fundamental Aspect of Personality, a Practice of Network Growth. Personality Neuroscience, 1. 10.1017/pen.2018.3 [DOI] [PMC free article] [PubMed] [Google Scholar]
Associated Data
This section collects any data citations, data availability statements, or supplementary materials included in this article.