Abstract
Assessment of mucus velocity variations under different conditions including viscosity variation and boundary conditions is useful to develop mucosal-based medical treatments. This paper deals with the analytical investigation of mucus–periciliary velocities under mucus–periciliary interface movements and mucus viscosity variations. The results for mucus velocity show that there is no difference between the two cases under the free-slip condition. Therefore, power-law mucus can be substituted with a high viscosity Newtonian fluid since the upper boundary of the mucus layer is exposed to the free-slip condition. However, when the upper boundary of the mucus layer is under nonzero shear stress levels, including cough or sneeze, the assumption of a high viscosity Newtonian mucus layer is invalid. Moreover, mucus viscosity variations are investigated for both Newtonian and power-law mucus layers under sneeze and cough to propose a mucosal-based medical treatment. The results indicate by varying mucus viscosity up to a critical value, the direction of mucus movement changes. The critical values of viscosity in sneezing and coughing for Newtonian and power-law mucus layers are 10–4 and 5 × 10⁻⁵ and 0.0263 and 006.024 m2 s−1, respectively. Therefore, the pathogen entry into the respiratory system can be prevented by varying mucus viscosity during sneeze and cough.
Introduction
The whole respiratory system has been covered by the protecting airway surface liquid (ASL) layer. The ASL layer prevents the contact of inhaled pathogens with the airway epithelium and moves them outward the airway system or toward the stomach [1–6]. The movement of the ASL layer is known as mucociliary clearance (MCC). The main mechanism of MCC is to clean the airway by beating the cilia array located over the epithelial cells. To quantify the rate of the MCC process, Saccharin test is used [7]. Modeling the MCC functionality is a computational challenge due to the complicated rheological properties of mucus and becomes more difficult if the effects of pathogens or drugs are considered on the MCC structure.
The study of mucus properties had attracted a lot of attention through experimental and numerical investigations [8–19]. Some studies evaluated mucus flow characteristics using various types of fluids, including viscoelastic [16, 17, 19], power-law [8], and Newtonian [7, 19] ones. Some other researchers [9–15, 18] modeled mucus flow using cylindrical cultures to obtain a detailed description of the MCC process. One of the comprehensive experimental investigations of ASL layer characteristics was performed by Vasquez et al. [19] inside a cylinder geometry. They used different types of fluids, including viscoelastic and Newtonian ones, to evaluate the shape of the air–mucus interface. They considered the ASL layer as a single layer and substituted the cilia movement with a cyclic rotational disk at the bottom plate. On the other hand, several investigations were performed to model the transfer of viscous and viscoelastic fluids concerned with mucus flow in cell culture [17, 20–23]. One of the important experimental investigations of MCC was the optimal mucus viscosity to replace viscoelastic mucus with a high viscosity Newtonian one. The optimal mucus viscosity was reported 12 Pa s based on experimental tests [24].
There were two traditional and new assumptions to treat the ASL layer as a single- or two-layer model. The ciliary stroke analysis and hypotonic-defensin model stated the periciliary layer was stationary compared to the mucus layer (ML) [7]. These researchers ignored the effects of the periciliary layer and considered the ASL layer as a single mucus layer. The mucus layer was considered Newtonian, power-law, or viscoelastic [7, 19, 25–27]. However, the new investigations stated that the transport rate of mucus and periciliary layers were the same and considered the ASL layer as two mucus–periciliary layers [3, 16, 17, 28, 29]. The actual scale of the ASL layer was in the range of micrometer such that the height of the periciliary and mucus layers was 10 and 5 µm, respectively [2, 7].
The complicated relationship between MCC and cilia beating frequency, variations of MCC structure against pathogens and drugs, and limitation of measurement devices drew attention to the mathematical modeling of MCC [30–44]. However, a detailed study of MCC structure using mathematical modeling was not possible due to the complicated rheological properties of the ASL layer. Therefore, simplification of the ASL layer rheology was an innate part of mathematical modeling. Neglecting the flow field effect on cilia beating [37–40, 42, 45], omitting the impact of inertia terms in the mucus flow [30, 34, 38, 45], or using simple fluids [16, 17] were some mathematical simplifications. Furthermore, the natural boundary conditions at the mucus–periciliary interface were encountered the analytical solutions to challenge. To this end, researchers considered the ASL layer as a single mucus layer or used simple boundary conditions. The common boundary condition was used as the cilia beating frequency was a continuous oscillating movement (sine or cosine functions) imposed at the lower boundary of the periciliary layer. However, to evaluate the MCC process, the natural boundary condition (a discrete function that is composed of two different functions) should be set at the mucus–periciliary interface [2, 3, 46].
Several numerical simulations were performed [17, 21–23, 47–49] to avoid the simplifications of analytical solutions. The majority of numerical studies evaluated different fluids as mucus similar to experimental ones [7, 8, 16, 17, 50, 51]. Numerical investigations of the MCC process showed the dependency of mucus flow on mucus viscosity variations and cilia beating frequency [16, 46]. These studies only considered the free-slip condition at the interface of mucus–air due to the low dynamic viscosity of air. The effect of different defensive mechanisms on the MCC process against the trapped pathogens in the mucus layer, including sneezing and coughing, had received minimal attention based on our knowledge. Therefore, quantification of sneeze and cough effects on the MCC process is a new challenge and can be used for future medical treatments against pathogens.
Nowadays, researchers investigate virus effects on the respiratory system [52–55]. A detailed description of viruses impacts the human body has been discussed in Ref. [55]. The ASL layer is the first defensive layer to prevent the entry of pathogens [54], where the body reacts as the first factor of mucosal immunity by the production of immunoglobulin A antibodies [56]. Stimulation of respiratory mucosa sensitivity by the immune system to increase the rate of mucus secretion is the first response of the body, while pathogens enter the respiratory system [53]. Although good mathematical models and numerical simulations had been performed for different aspects of MCC, its effects inside the airway system were ignored due to various micro- and macro-length scales vicinity (mucus and airflow) [57–59].
According to the literature review, the investigation of mucus flow was complex because mucus flow depended on different subjects, including mucus rheology, cilia movement, stability of metachronal wave, mucus viscosity, and the periciliary layer effect. Therefore, some researchers only focused on mucus rheology [2, 3, 8, 17, 19] and developed mathematical models for cilia movement [30, 35–38]. The results of mucus rheology were applied to numerical simulations and the effect of cilia beating frequency was investigated on the MCC process [3, 16, 30, 35–38, 46]. However, several issues need to investigate more precisely, including the effect of different shear stress levels on the upper boundary of the mucus layer, the impact of mucus–periciliary interface discrete movement on the velocity of both mucus and periciliary layers, the necessary condition for replacement of non-Newtonian mucus with a high viscosity Newtonian one, the impact of viscosity variation on the mucus velocity and investigation of defensive mechanisms (sneeze and cough) to get out the pathogens from airway system.
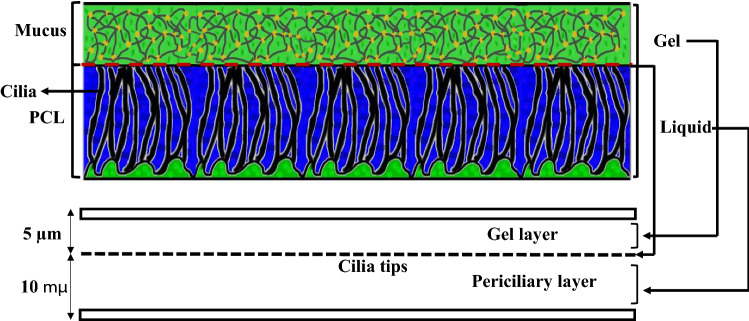
In the present study, an analytical solution of the mucus–periciliary velocities is performed using Newtonian/Newtonian and power-law/Newtonian cases for mucus and periciliary layers. The main goal of this research is to evaluate the mucus layer velocity under different boundary conditions. To this end, the periciliary layer is considered a simple layer though it surrounds the moving cilia and resembles a porous medium. The reason that strengthens this assumption is the thickness of the periciliary layer, which is approximately equal to the size of a cilium length. Due to the high cilia density in the periciliary layer, the effect of the cilia tips can be considered as a flat plate whose movement is similar to the cilia metachronal wave. Therefore, the mucus–periciliary layers are modeled with three infinite parallel plates (as two Couette flows) and cilia motion is applied by the middle plate (Fig. 1). Four types of cyclic boundary conditions are imposed on the mucus–periciliary interface (middle plate) as cilia motion. The continuous constant effective stroke, discrete constant effective and recovery strokes, continuous cyclic effective stroke, and discrete cyclic effective stroke along with constant recovery stroke are the cyclic boundary conditions. The analytical solution challenge is considering the flow history when a discrete function (cilia motion) is applied as a boundary condition. The complicated mathematical procedures of a discrete function lead to the employ of two simple Newtonian and power-law fluids for mucus as an approximation. By evaluating the analytical solution constants, the flow history challenge can be solved when the cilia motion tends to zero graduate or suddenly. Furthermore, the upper boundary of the mucus layer is exposed to different shear stress levels, including the free-slip condition (quiet breathing), cough shear stress, sneeze shear stress, and the shear stress of laminar airflow. Therefore, three major problems are discussed in the present research; first, the effects of interface velocity profiles (discrete and continuous functions) on the velocity distribution inside the periciliary and mucus layers. Second, different shear stress levels to assess the assumption of replacing the non-Newtonian mucus with a high viscosity Newtonian one. Third, the effects of mucus viscosity reduction in the mucus flow affected by cough and sneeze to propose medical treatment for preventing the pathogen entry into the respiratory system.
Fig. 1.
Modeling of the MCC structure with two infinite parallel plates
Physiology of the ASL layer
The ASL layer consists of two different layers [3] (Fig. 1). The bottom layer is an aqueous ‘sol’ layer, also called the periciliary layer, and is a low viscosity Newtonian fluid similar to water [7]. The upper layer is a non-Newtonian gel called the mucus layer. The total thickness of the ASL layer is 15 µm [60], and the depth of the periciliary and the mucus layers are 10 µm [2] and 5 µm [7], respectively. The mucus layer comprises 95% water and 5% proteins, glycoproteins, lipids, and minerals [2]. There are a lot of thin and small organs called cilia, which are surrounded by the periciliary layer [61]. The cilia perform rhythmic back and forth movement (metachronal wave) as the main transferring mechanism of the ASL layer [33, 62, 63]. The cilia transfer the ASL layer with an average velocity of 5 mm min−1 [7] toward the posterior of the nasopharynx [2]. Each cycle of cilia beating consists of effective and recovery strokes. The effective stroke activity is greater than the recovery stroke [22]. Several investigations considered the effects of cilia frequency on mucus flow [7, 16, 46, 60], and the frequencies 15 Hz (T = 1/15 s) and 30 Hz (T = 1/30 s) [64–66] are investigated in this study. The Newtonian layer allows the cilia to move in a two-way direction that leads to a one-way movement of the mucus layer [2].
When the mucus overloads under the influence of some diseases, including cold or allergenic factors, it is get out of the airway system (Rhinorrhoea) [67]. The process of mucus discharging happens to ward off pathogens and harmful bacteria. Two other mechanisms that intensify the process of mucus discharging are cough and sneeze [68]. Cough and sneeze phenomena exert more significant levels of shear stress than that quiet breathing on the upper boundary of the mucus layer. According to the American Lung Association, the maximum air velocity in sneezing and coughing is 44.7 and 22.35 m s−1, respectively [69]. There are no scientific reports about the shear stress levels exerted on the upper boundary of the mucus layer due to coughing and sneezing, based on our knowledge. Therefore, in the present research, the levels of shear stress affected by sneezing and coughing are estimated. Equations for four velocity profiles as the cilia movement are given in Table 1. These velocity profiles are imposed at the mucus–periciliary interface (Fig. 1).
Table 1.
Equations for each velocity profile (mm min−1)
| Velocity profile (a): |
| Velocity profile (b): |
| Velocity profile (c): |
| Velocity profile (d): |
All velocity profiles are repeated over time, and T is the cilia motion period which is equal to 1/15 s. The velocity profile (a) is considered the simplest movement of cilia. It means there is permanent contact between the cilia and the mucus layer. The velocity profile (b) combines attaching and detaching duration of cilia and the mucus layer. One-half of a cycle relates to the effective stroke and the rest belongs to the recovery stroke. The frequency of the cycle is 15 Hz. The velocity profile (c) is based on the gradual contact of the cilia and mucus layer at 30 Hz. This profile shows the cilia tips attach and detach the mucus layer gradually. The velocity profile (d) consists of effective and recovery strokes with a frequency of 15 Hz. Three points P1 (t/T = 1/8), P2 (t/T = 2/8) and P3 (t/T = 3/8) show maximum acceleration, maximum flow and maximum deceleration, respectively.
Mathematical formulations
The governing equations of mass and momentum conservation for an incompressible flow are as follows [70]:
| 1 |
| 2 |
where ρ is the fluid density, t is time, ui (i = 1, 2, 3) denotes the velocity components and xi shows components of the Cartesian coordinate system. The coordinate system is fixed at the interface of the mucus–periciliary layer (Fig. 1). Moreover, p denotes the pressure field and τij (i, j = 1, 2, 3) is the Cauchy shear stress tensor.
A two-dimensional unsteady and incompressible form of Eqs. (1) and (2) are considered for the analytical solution, and the variations of all variables are neglected in the third direction (i = 3 = z). Considering a parallel flow results in v = 0, and leads to the functionality of u to y using Eq. (1). Since the ASL layer (15 µm) is very thin, the pressure gradient in the y-direction is zero. Furthermore, the slow movement of the ASL layer (5 mm min−1) between two infinite parallel plates (Re ≪ 1) [71] results in negligible nonlinear advection terms in Eq. (2). By using the above assumptions, the simplified form of the governing equation is achieved (Eq. 3). Note that ui = u(y,t) and τij = τ12 = τxy.
| 3 |
The pressure gradient term is omitted from Eq. (3) by defining a new variable as follows:
| 4 |
Substituting Eq. (4) to Eq. (3) results in Eq. (5).
| 5 |
where is expressed in the following sections based on the fluid type. The boundary conditions are no-slip, different velocity profiles (Table 1), and different shear stress levels at the bottom, middle and upper plates of the ASL layer (Fig. 1), respectively.
Newtonian/Newtonian solution
The Newtonian/Newtonian case is examined as the first approximation. The mucus and periciliary layers are considered as high and low viscosity Newtonian fluids, respectively. The characteristics of the two Newtonian layers are given in Table 2. In this case, the relationship between shear stress and shear strain rate tensors is linear (Eq. 6).
| 6 |
Table 2.
Properties of working fluids [7]
| ASL layer components | Density (ρ) (kg m−3) | Kinematic viscosity (ν) (m2 s−1) | Height of ASL layer components (h) (µm) |
|---|---|---|---|
| Periciliary layer | 1000 | 10–6 | 10 |
| Mucus layer | 1000 | 0.012 | 5 |
Substituting Eq. (6) to Eq. (5) yields Eq. (7).
| 7 |
The mathematical procedures for the analytical solution are given in Appendix A.
The mucus–periciliary interface (a) and (b)
The separation of variables method along with Fourier expansion is used to solve Eq. (7) for both mucus and periciliary layers affected by velocity profiles (a) and (b) at the mucus–periciliary interface. By using a constant pressure gradient along with no-slip and velocity profiles (a) and (b) boundary conditions at the lower and upper (mucus–periciliary interface) boundaries of the periciliary layer, the velocity distribution is obtained as follows (Eq. 8):
| 8 |
where DpDx, DT, U, and t are maximum pressure gradient, constant time step, maximum velocity, and time, respectively. The pressure gradient is set to 5 Pa m−1 [72–74].
By using a similar solution as discussed above besides a specific shear stress level at the upper boundary of the mucus layer, the final solution can be expressed as follows (Eq. 9):
| 9 |
where μ is dynamic viscosity and τ0 shows the different shear stress levels at the upper boundary of the mucus layer, which can be zero or a value proportional to cough (1 Pa) or sneeze (2 Pa) conditions. Indices 1 and 2 refer to the periciliary and mucus layers, respectively. Note that the lower boundary of the mucus is also exposed to velocity profiles (a) and (b) boundary conditions. Both Eqs. (8) and (9) satisfy Eq. (7).
The mucus–periciliary interface (c) and (d)
The analytical solution of Eq. (7) leads to Eq. (10) for both mucus and periciliary layers under the influence of velocity profiles (c) and (d) at the mucus–periciliary interface. All other boundary conditions are the same as the ones in the previous section.
| 10 |
where ω is the oscillation frequency of the ASL layer velocity, which is determined based on cilia beating frequency. Img and || denote the imaginary part and magnitude, respectively, and f(y) can be expressed as follows:
| 11 |
Constants of Eq. (11) for periciliary and mucus layers are determined using the boundary conditions mentioned above as follows (Eqs. 12–14):
| 12 |
| 13 |
Equation (11) governs the mucus layer with different constants (Eq. 14).
| 14 |
Due to the same velocity profiles at the mucus–periciliary interface, D1 is the same as C1.
| 15 |
D2 obtains by solving Eq. (16) using the Newton–Raphson method.
| 16 |
All equations satisfy Eq. (7).
Power-law/Newtonian solution
Although real mucus is a viscoelastic fluid with a shear-thinning property, a shear-thinning power-law mucus is used instead. The shear-thinning property causes a better movement of the mucus layer under the influence of forces entering it from cilia motion in the effective stroke. The reason for using a shear-thinning power-law mucus is its simplicity than viscoelastic fluids. Moreover, the use of shear-thinning power-law mucus is acceptable for analytical solution [4] and good insights can be obtained.
The mucus and periciliary layers are modeled as power-law and Newtonian fluids, respectively. Therefore, the mucus layer solution is only discussed in this section. By substituting the power-law relation between the stress and the shear rate (Eq. 17) into Eq. (5), the final solution is obtained for the power-law fluid (Eq. 18).
| 17 |
where k and n are the flow consistency and flow characteristic indexes, respectively.
| 18 |
By using the similarity solution and some manipulation (Appendix A), the velocity field inside the mucus layer is obtained (Eq. 19). η is a dimensionless variable and defined in Appendix A.
| 19 |
Equation (19) satisfies Eq. (18). The adaptive Simpson Quadrature method is also used to solve the integral of Eq. (19). The constant D1 is determined using Eq. (20).
| 20 |
Results and discussion
The shear stress levels during sneezing, coughing, and quiet breathing are estimated using the fully developed turbulent and laminar flows inside a pipe, respectively. The pipe diameter is considered equal to the average diameter of a nasal cavity (1.6 cm) [57] to get the shear stress levels proportional to a nasal cavity. The one-seventh velocity profile is used for sneezing and coughing, where the maximum air velocity is 44.7 and 22.35 m s−1 [69], respectively. Furthermore, the fully developed laminar flow profile is used for a volume flow rate of 20 L min−1 [75]. Then, the calculated shear stress levels are imposed on the upper boundary of the mucus layer. The shear stress levels are 2, 1, and 0.01 Pa for sneezing, coughing, and quiet breathing, respectively. All shear stress levels are set in a reverse direction than the ASL layer velocity. The analytical solutions are performed in more than 150 and 75 cycles for middle plate frequencies 30 HZ and 15 HZ, respectively. The following results are related to the last cycle.
Comparison of the analytical results with the numerical results
Reference [76] is used for the validation of the analytical solution. A two-layer model of the ASL layer was used and the mucus layer velocity was investigated numerically. The mucus velocity was evaluated by altering its thickness, while the thickness of the periciliary layer was constant. Figure 2 shows a comparison between the analytical solution results and available data [76] for the mucus velocity. As the thickness of the mucus layer grows and decays too much, the mucociliary transport is reduced. Although growing mucus layer thickness leads to deceleration of MCC, it handles mucus overloads. On the other hand, the shallow mucus thickness reduces the mucus throughput and can cause dangerous contaminations of the unprotected bronchus. The maximum error between the results of the present analytical solution and Chatelin and Poncet [76] is below 0.01%. hML and hASL are the heights of ML and ASL layers, respectively.
Fig. 2.
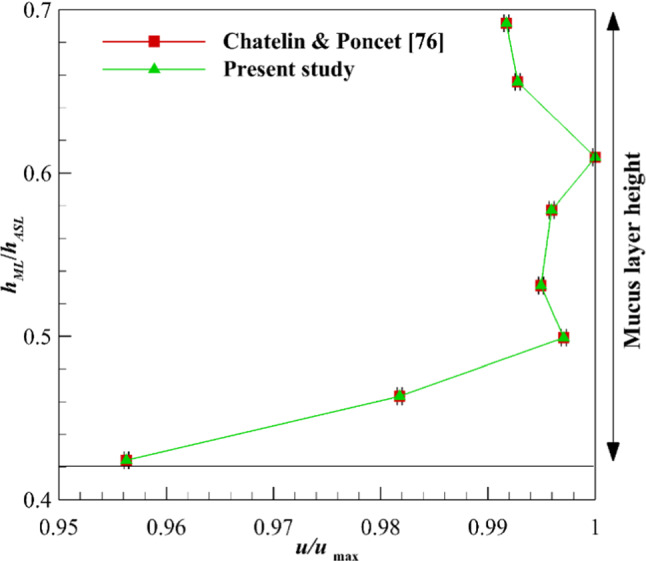
Validation of analytical solution by investigating the MCC under the influence of mucus layer thickness
Newtonian/Newtonian results
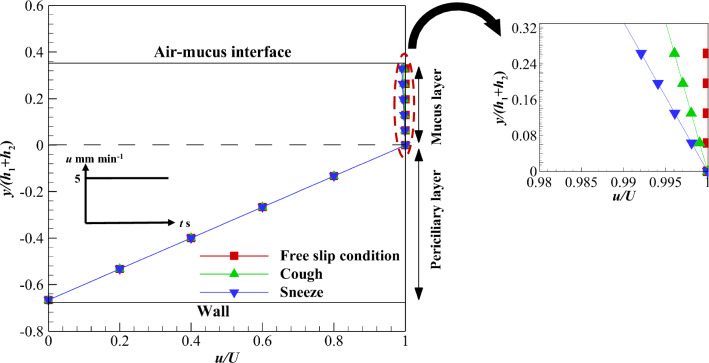
Newtonian mucus is used to determine the differences between non-Newtonian and Newtonian mucus under the influence of different cilia movement patterns. Figure 3 shows velocity variations inside the mucus and periciliary layers under the influence of velocity profile (a). Exerting velocity profile (a) on the interface of the two layers along with different shear stress levels at the mucus upper boundary results in different velocity profiles inside the layers. Two factors play an important role in these velocity variations including different viscosity of the layers and low-velocity magnitude of the interface (5 mm min). As can be seen, linear velocity variation and plug flow (uniform velocity variation) are observed inside the periciliary and mucus layers due to their low and high viscosities, respectively. Although the velocity gradient is zero inside the mucus layer under the free-slip condition, nonzero shear stress levels cause a slight relative movement inside the mucus layer. Maximum mucus velocity variations in sneezing and coughing are 1 and 0.5%, respectively, in comparison with the free-slip condition (see the zoomed section in Fig. 3). Therefore, the effects of sneeze and cough shear stress levels are negligible on the Newtonian mucus layer velocity.
Fig. 3.
Velocity variations of the ASL layer using velocity profile (a) at the interface along with different shear stress levels on the upper boundary of the mucus layer
To consider the effect of recovery stroke, velocity profile (b) is imposed on the interface of the two layers. Figure 4a shows the velocity variation affected by different shear stress levels at t/T = 4/8. The shear stress in sneezing and coughing causes a lower velocity inside the mucus layer than the interface velocity. Therefore, the mucus velocity becomes negative when the interface velocity tends to zero and the upper mucus layer is exposed to nonzero shear stress. The negative velocity indicates the mucus flows in the opposite direction in the recovery stroke than the effective one.
Fig. 4.
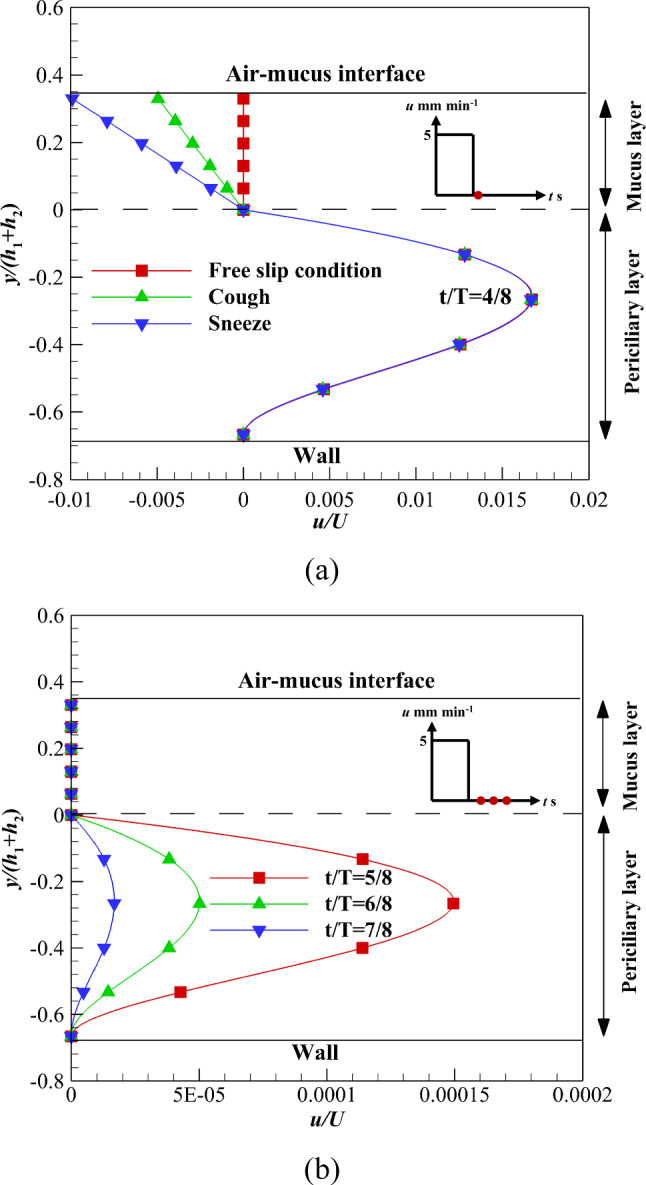
Velocity variations of the ASL layer using velocity profile (b) at the interface and in the recovery stroke a At t/T = 4/8 along with different shear stress levels on the upper boundary of the mucus layer b At different times along with zero shear stress on the upper boundary of the mucus layer
The sneeze and cough mechanisms transfer the pathogens outward to the respiratory system. Figure 4b shows the velocity variations of both layers over time affected by the free-slip condition. The velocity variation inside both layers illustrates the interface effect propagates across the mucus layer faster than the lower layer due to both the high viscosity and low velocity of the mucus layer. Therefore, the mucus layer stops suddenly while the periciliary layer velocity tends to zero gradually.
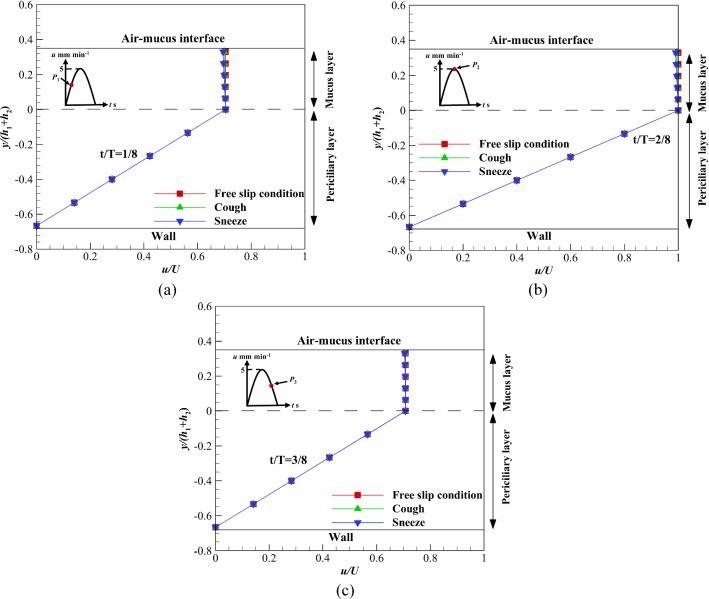
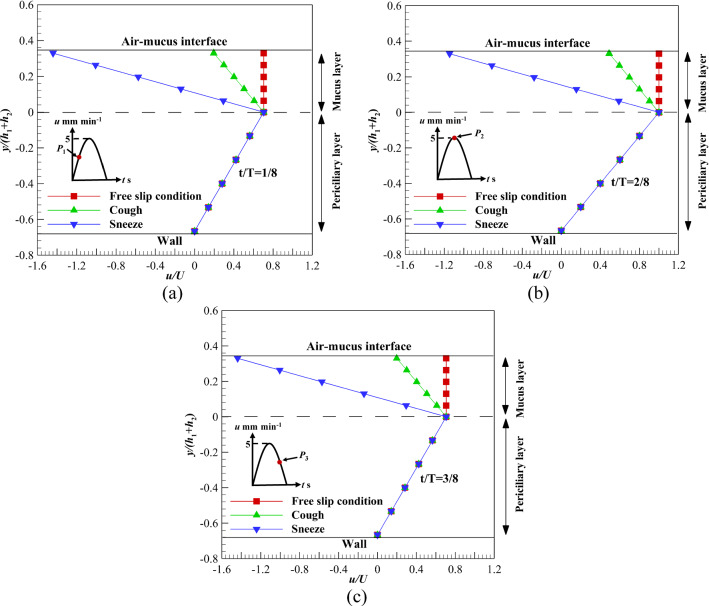
Figure 5a–c illustrates the velocity variations of mucus and periciliary layers under the influence of velocity profile (c) over time. Different levels of shear stress are exerted on the upper boundary of the mucus layer and the results are extracted on three different points including, P1, P2, and P3 [77]. According to Fig. 5a–c, the velocity variation of the mucus layer at P1 and P3 is higher than the P2 in sneezing and coughing. For sneezing, the velocity variation at P1, P2, and P3 is 1.4%, 1, and 1.4%, respectively. These differences are due to different mucus velocities at P1, P2, and P3. However, velocity variation at P1, P2, and P3 are 0.65, 0.5, and 0.65% for coughing, respectively. Although flow characteristics for acceleration and deceleration cycles are different [78], results show velocity variations at P1 and P3 are the same for different shear stress levels (Fig. 5a and c). This is due to the low velocity of the ASL layer (5 mm min−1).
Fig. 5.
Velocity variations of the ASL layer using velocity profile (c) affected by different shear stress levels on the upper boundary of mucus layer a At t/T = 1/8, b At t/T = 2/8, c At t/T = 3/8
The effect of the recovery stroke is investigated on the ASL layer velocity using velocity profile (d) over time (Fig. 6). Similar to the velocity profile (b), the mucus layer stops suddenly when the interface velocity tends to zero while the periciliary layer velocity gradually tends to zero. The difference between velocity profiles (b) and (d) is the reduction rate of the periciliary layer velocity toward zero. The periciliary layer velocity reaches zero using velocity profile (d) faster than velocity profile (b). Because the ASL layer flow enters the recovery stroke with a velocity close to zero using velocity profile (d).
Fig. 6.
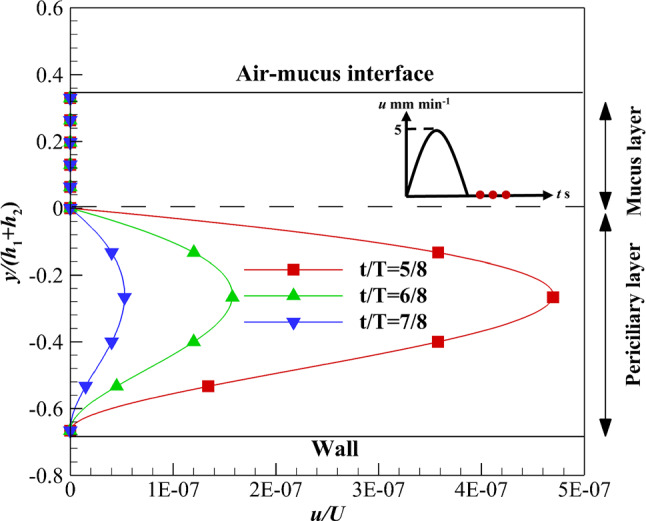
Velocity variations of the ASL layer using velocity profile (d) in the recovery stroke over time along with zero shear stress on the upper boundary of the mucus layer
The mucus layer traps pathogens, irritants allergies, and respiratory viruses and transports them to the posterior of the throat [1–6]. The percentage of virus deposition like COVID-19 depends on the size of the viruses and the different forces exerted on them. One of the important forces imposed on COVID-19 viruses is the Brownian force due to the Nanosize of viruses. The Brownian force increases the diffusion mechanism and causes more deposition rate of Nanoparticles [79]. Therefore, by irritating the mucus layer such that it gets out of the respiratory system (sneeze and cough mechanisms) or moves faster toward the stomach (viscosity reduction), a load of viruses can be reduced inside the airways system [80–83]. Figure 7a and b shows viscosity variations of the Newtonian mucus layer in sneezing and coughing to find the critical viscosity. The critical viscosity is a value in which mucus layer velocity changes under the influence of different shear stress levels. Equation (21) is used to calculate the viscosity reduction rates.
| 21 |
where νoriginal is the optimal viscosity for replacement of the non-Newtonian mucus layer with the Newtonian one. The value of optimal viscosity is equal to 0.012 m2 s−1 [24].
Fig. 7.
Critical values of the mucus layer kinematic viscosity a Sneeze, b Cough
The critical viscosities of Newtonian mucus are 10–4 and 5 × 10⁻⁵ m2 s−1 for sneezing and coughing, respectively. Therefore, the sneeze mechanism is more effective than the cough to get out the viruses deposited on the mucus layer. The reduction rate of viscosity is 99.17 and 99.6% for sneeze and cough mechanisms, respectively.
If the process of viscosity reduction is imposed on quiet breathing, the mucus layer viscosity must be reduced up to 6 × 10⁻⁷ m2 s−1 (Fig. 8). The presented results in Figs. 7 and 8 are obtained using the Newtonian mucus layer, while the mucus has a shear-thinning property [8], and there is no need to reduce the mucus viscosity too much (see next section). Reduction in mucus viscosity too much can also lead to viruses and other pathogens reaching cells much faster.
Fig. 8.
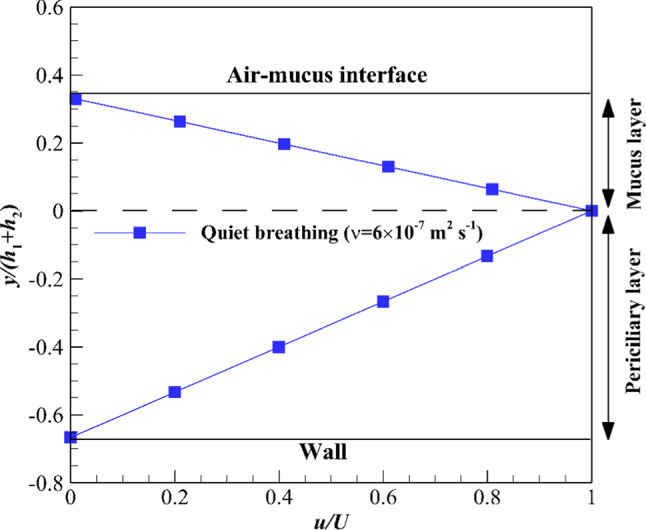
Critical value of mucus layer kinematic viscosity for quiet breathing
Power-law/Newtonian results
The results of power-law mucus are discussed in this section. The flow consistency (k) and flow characteristic (n) indexes are 0.355 and 0.482 [8], respectively. These values are related to healthy mucus. Therefore, the velocity variation of the power-law mucus layer is more than a high viscosity Newtonian one at the same shear stress (Fig. 9). Velocity variations of the mucus layer under the influence of cough for power-law and Newtonian mucus layers are 50 and 0.5%, respectively. Since there is a direct relationship between velocity variation and viscosity reduction rate of the mucus layer, the viscosity reduction rate and the critical viscosity can be calculated using Eqs. (22–24), respectively. The viscosity reduction rate and the critical viscosity are 49.8% and 0.006024 m2 s−1 in coughing, respectively.
| 22 |
| 23 |
| 24 |
Fig. 9.
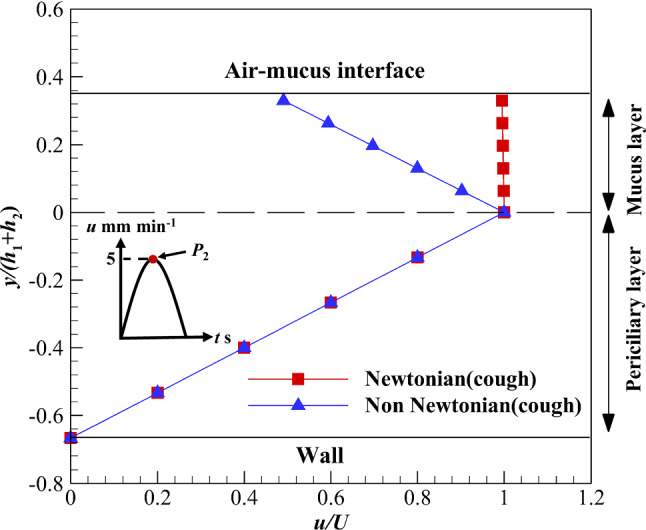
Velocity variation of the mucus layer using Newtonian and non-Newtonian shear-thinning fluids along with cough shear stress on the upper boundary of the mucus layer
Velocity variations in sneezing and coughing are shown in Fig. 10a–c at P1, P2, and P3. Due to the low velocity of the ASL layer, there is no difference between P1 and P3 under different shear stress levels. Velocity variations are 314.3 and 220% at P1 and P2 for sneezing, respectively. These values for coughing are 71.4 and 50% at P1 and P2, respectively. For sneezing, the viscosity reduction rate and critical viscosity are − 119.004% and 0.0263 m2 s−1, respectively. The negative viscosity reduction rate in sneezing means the critical viscosity is 0.0143 m2 s−1 higher than the optimal value (0.012 m2 s−1). According to Fig. 10a–c, the shear-thinning property of the mucus layer is clear. A slight enhancement in the shear stress leads to a high-velocity variation of the mucus layer.
Fig. 10.
Velocity variations of the ASL layer using velocity profile (c) affected by different shear stress levels on the upper boundary of mucus layer a At t/T = 1/8, b At t/T = 2/8, c At t/T = 3/8
A comparison of velocity variation at the free-slip condition in the recovery stroke shows the velocity reduction rate using velocity profile (b) is lower than (d). The interface of both layers flows with a constant velocity using velocity profile (b) up to t/T ≤ 4/8; however, at t/T > 4/8, the interface stops suddenly (Fig. 11). Therefore, the high-viscosity mucus layer stops suddenly, while the low-viscous periciliary layer velocity reduces at a lower rate than the mucus layer. On the other hand, the interface velocity increases up to t/T ≤ 2/8 and reduces at t/T > 2/8 using velocity profile (d) (Fig. 11b). The velocity reduction using velocity profile (d) starts faster (t/T > 2/8) than velocity profile (b) (t/T > 4/8). Therefore, the order of velocity using velocity profile (d) is lower than velocity profile (b) in the recovery stroke. As can be seen, there is no difference between Figs. 6 and 11b under the free-slip condition.
Fig. 11.
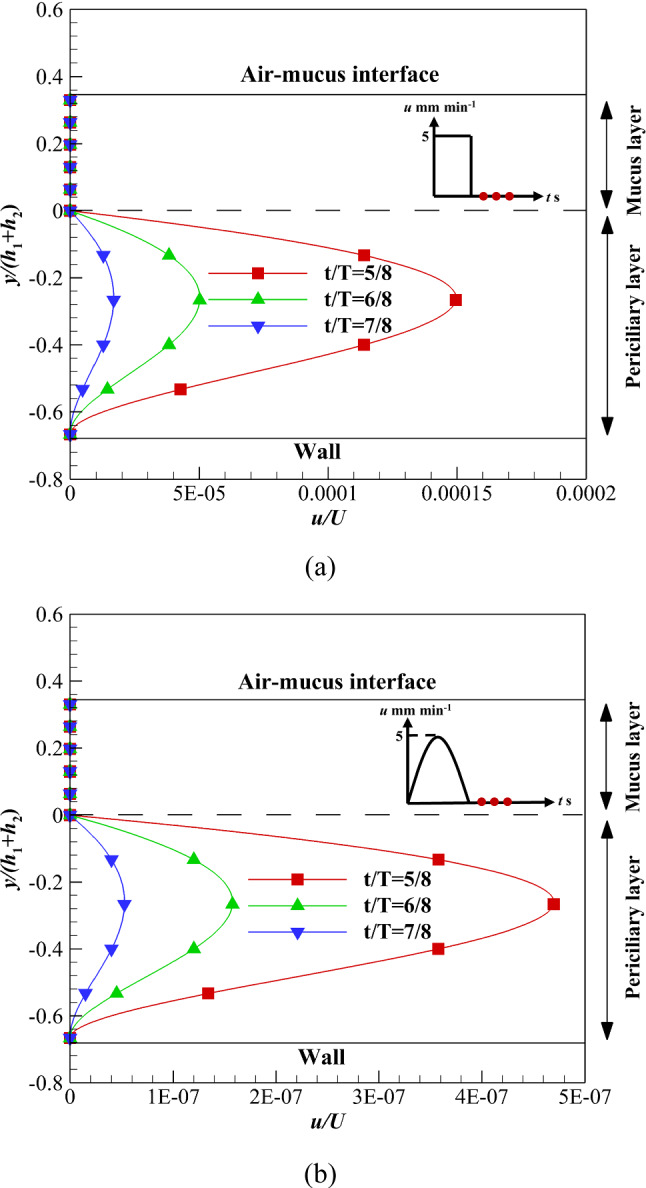
Velocity variations of the ASL layer velocity in the recovery stroke over time along with zero shear stress on the upper boundary of the mucus layer a Velocity profile (b), b Velocity profile (d)
Figure 12 shows velocity variations of the ASL layer over time using two different mucus layers including, Newtonian and non-Newtonian mucus layers. In both cases, the upper boundary of mucus is exposed to the free-slip condition. In the acceleration phase (P1 to P2), the mucus velocity increases, while velocity decreases in the deceleration phase (P2 to P3). Due to the shallow velocity of the mucus layer, there is no difference between acceleration and deceleration phases. The low viscosity of the periciliary layer leads to linear velocity distribution in both cases. However, there is uniform velocity distribution inside the mucus layer due to high viscosity. By comparing non-Newtonian and Newtonian mucus layers velocity (Fig. 12a and b), there is no difference between power-law and high viscosity Newtonian mucus layers at the free-slip condition. Therefore, replacing the power-law mucus with a high viscosity Newtonian one is acceptable at zero shear stress [7]. This is a suitable result for future numerical simulations inside the respiratory system.
Fig. 12.
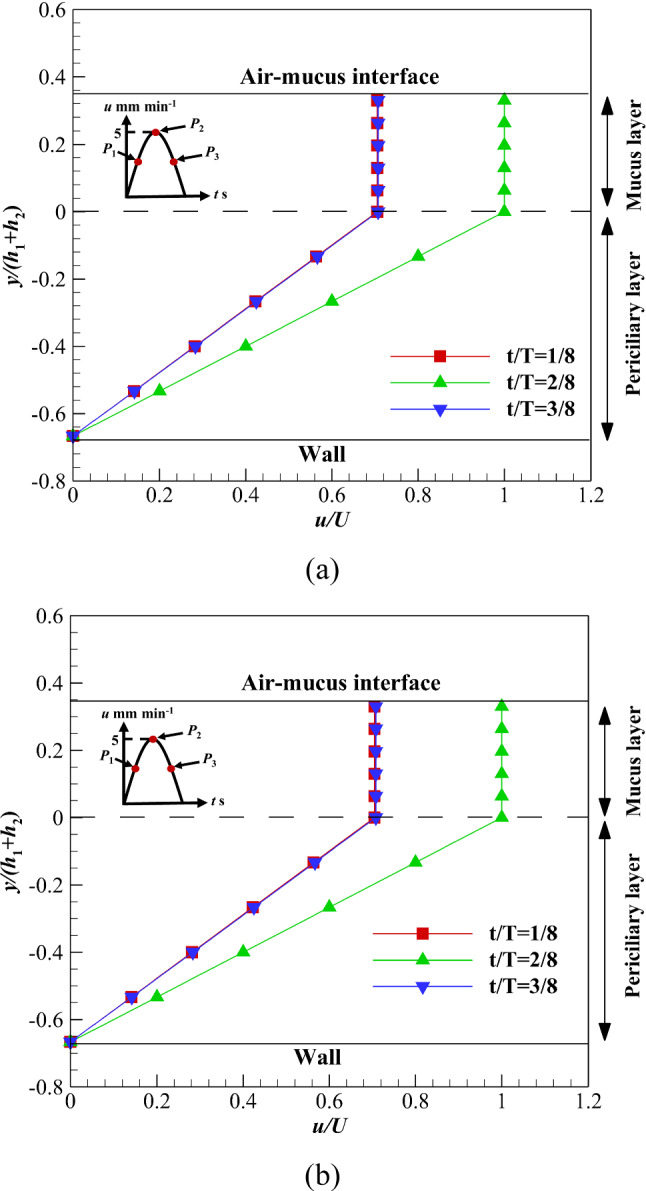
Velocity variations of the ASL layer over time with no shear stress on the upper boundary of mucus layer a Power-law, b Newtonian
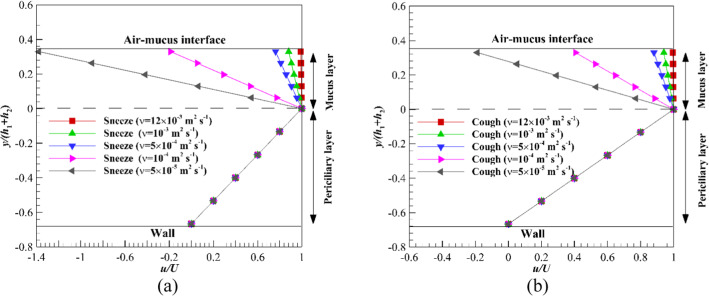
The effect of nonzero shear stress levels on the variation of the ASL layer velocity is another vital issue. Figure 13 shows the velocity variation of the ASL layer affected by different shear stress levels at the maximum mucus flow. The significant velocity gradient is observed inside the non-Newtonian mucus layer due to the influence of nonzero shear stress levels and the shear-thinning property (n < 1) of fluid (Fig. 13a), while the velocity gradient is negligible inside the Newtonian mucus layer and affected by nonzero shear stress levels (Fig. 13b). By imposing nonzero shear stress levels on the mucus layer, the difference between non-Newtonian and Newtonian mucus is revealed. In sneezing and coughing, the non-Newtonian mucus velocity changes significantly (Fig. 13a), while the effect of these mechanisms on Newtonian mucus is negligible (Fig. 13b). Therefore, replacing power-law mucus with Newtonian one would be invalid when the upper mucus layer is exposed to nonzero shear stress levels.
Fig. 13.
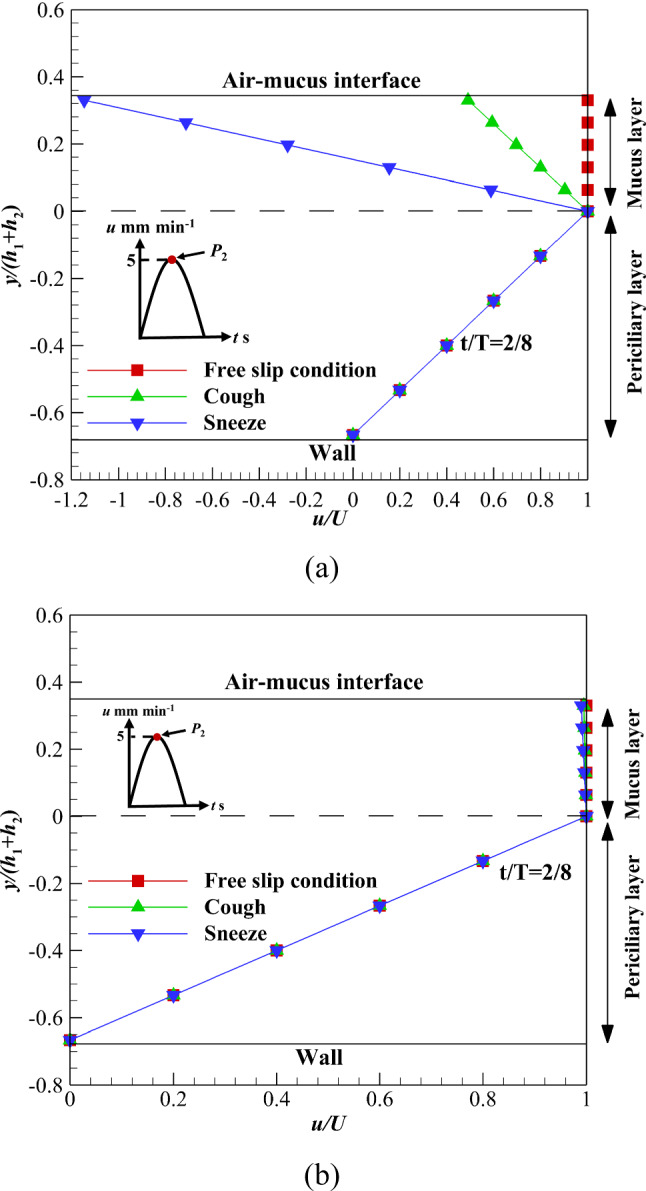
Velocity variations of the ASL layer over time with different shear stress levels on the upper boundary of mucus layer a Power-law, b Newtonian
Conclusions
In this study, an analytical solution was presented for the mucus–periciliary velocities under mucus viscosity variation and different mucus–periciliary interface velocities during cough and sneeze for two Newtonian and power-law mucus layers. Four continuous and discrete velocity profiles were applied to the mucus–periciliary interface along with sneeze and cough shear stresses at the upper boundary of the mucus layer. The results of mucus velocity showed that the power-law mucus could be substituted with a high viscosity Newtonian mucus if the upper boundary of the mucus layer was exposed to the free shear stress. Imposing different shear stress levels on the upper boundary of the mucus layer, including sneezing and coughing, made the aforementioned assumption invalid. The effects of sneeze and cough were negligible (1 and 0.5%, respectively) on the Newtonian mucus velocity variation. However, by replacing the high viscosity Newtonian mucus with a power-law one, the effects of sneeze and cough were 220 and 50% on the mucus velocity, respectively. Different mucus viscosities were also examined to find the critical values in sneezing and coughing to prevent the pathogen entry into the respiratory system. The critical viscosities in sneezing for Newtonian and power-law mucus layers were 10–4 and 0.0263 m2 s−1, respectively. These values in coughing were 5 × 10⁻⁵ and 0.006024 m2 s−1 for Newtonian and power-law mucus layers, respectively. Moreover, by reacting as cough or sneeze, it was possible to move out the viruses from the respiratory system. The main result of this study can be used to solve the challenge of mucus–airflow (micro–macro-length scales) vicinity inside the airway system for further numerical simulations.
Acknowledgements
The authors appreciated Tarbiat Modares University for their support in achieving the results presented in this research.
Appendix A: Mathematical details for the analytical solution
NewtonianNewtonian solution
The mathematical procedures for Newtonian mucus can be expressed as follows.
The mucus-periciliary interface (a) and (b)
The analytical solution of Eq. (25) using the separation of variables method can be expressed by a Fourier series (26). Equation (26) shows that the time-dependent solution is a deviation from the steady solution.
| 25 |
| 26 |
where uC and l are the steady-state solution and distance between plates. Substituting Eq. (26) into Eq. (25) and assuming a constant pressure gradient (Eq. 27), Bn(t) is determined as Eq. (28).
| 27 |
| 28 |
By substituting Eq. (28) into Eq. (26), the velocity field can be expressed as Eq. (29).
| 29 |
To obtain an, the initial condition u*(y, t = 0) = 0 is used.
The mucus-periciliary interface (c) and (d)
The analytical solution of Eq. (25) is Eq. (30) under the influence of velocity profiles (c) and (d).
| 30 |
where ω is the oscillation frequency of the ASL layer velocity, which is determined based on cilia beating frequency. By substituting Eq. (30) into Eq. (25), f(y) can be expressed as follows (Eq. 31).
| 31 |
| 32 |
where px and ωp are the amplitude and oscillation frequency for the pressure field, respectively. ωp is assumed to equal to ω, and px is set to 5 Pa in the present study. Constants are as follows.
| 33 |
| 34 |
| 35 |
D2 is obtained by solving Eq. (36) using the Newton–Raphson method.
| 36 |
Power-law/Newtonian solution
The mathematical procedures for Power-law mucus can be expressed as follows.
| 37 |
where k and n are the flow consistency and flow characteristic indexes, respectively.
| 38 |
By applying a similarity solution to Eq. (38) and some manipulation, the velocity field inside the mucus layer is obtained (Eq. 43). Equations (39–42) describe the similarity solution procedures.
| 39 |
| 40 |
| 41 |
| 42 |
| 43 |
where δ is a characteristic length scale for the ASL layer thickness. To solve the integral of Eq. (43), an adaptive Simpson Quadrature method is used with the maximum possible error below 10–6. D1 is determined using Eq. (44).
| 44 |
Data Availability Statement
This manuscript has associated data in a data repository. [Authors’ comment: Data will be made available on request.]
Contributor Information
M. A. Modaresi, Email: mohamad.ali.modaresi@gmail.com
E. Shirani, Email: eshirani@gmail.com
References
- 1.Norton MM, Robinson RJ, Weinstein SJ. Model of ciliary clearance and the role of mucus rheology. Phys. Rev. E. 2011;83(1):011921. doi: 10.1103/PhysRevE.83.011921. [DOI] [PubMed] [Google Scholar]
- 2.Quraishi M, Jones N, Mason J. The rheology of nasal mucus: a review. Clin. Otolaryngol. Allied Sci. 1998;23(5):403–413. doi: 10.1046/j.1365-2273.1998.00172.x. [DOI] [PubMed] [Google Scholar]
- 3.P.-F. Zhu, et al., Simulation study on the mass transport based on the ciliated dynamic system of the respiratory tract. Comput. Math. Methods Med. (2019). [DOI] [PMC free article] [PubMed]
- 4.Lafforgue O, et al. Rheological properties of synthetic mucus for airway clearance. J. Biomed. Mater. Res. Part A. 2018;106(2):386–396. doi: 10.1002/jbm.a.36251. [DOI] [PubMed] [Google Scholar]
- 5.Button BM, Button B. Structure and function of the mucus clearance system of the lung. Perspect. Med. 2013;3(8):a009720. doi: 10.1101/cshperspect.a009720. [DOI] [PMC free article] [PubMed] [Google Scholar]
- 6.P. Basser, T. McMahon, P. Griffith, The mechanism of mucus clearance in cough (1989) [DOI] [PubMed]
- 7.Shang Y, Inthavong K, Tu J. Development of a computational fluid dynamics model for mucociliary clearance in the nasal cavity. J. Biomech. 2019;85:74–83. doi: 10.1016/j.jbiomech.2019.01.015. [DOI] [PubMed] [Google Scholar]
- 8.Chatelin R, et al. Numerical and experimental investigation of mucociliary clearance breakdown in cystic fibrosis. J. Biomech. 2017;53:56–63. doi: 10.1016/j.jbiomech.2016.12.026. [DOI] [PubMed] [Google Scholar]
- 9.Hill DB, Button B. Mucins. Springer; 2012. Establishment of respiratory air–liquid interface cultures and their use in studying mucin production, secretion, and function; pp. 245–258. [DOI] [PubMed] [Google Scholar]
- 10.Liu L, et al. An autoregulatory mechanism governing mucociliary transport is sensitive to mucus load. Am. J. Respir. Cell Mol. Biol. 2014;51(4):485–493. doi: 10.1165/rcmb.2013-0499MA. [DOI] [PMC free article] [PubMed] [Google Scholar]
- 11.Matsui H, et al. Osmotic water permeabilities of cultured, well-differentiated normal and cystic fibrosis airway epithelia. J. Clin. Investig. 2000;105(10):1419–1427. doi: 10.1172/JCI4546. [DOI] [PMC free article] [PubMed] [Google Scholar]
- 12.Matsui H, et al. Coordinated clearance of periciliary liquid and mucus from airway surfaces. J. Clin. Investig. 1998;102(6):1125–1131. doi: 10.1172/JCI2687. [DOI] [PMC free article] [PubMed] [Google Scholar]
- 13.Rossi AH, et al. Calcium signaling in human airway goblet cells following purinergic activation. Am. J.Physiol.-Lung Cellular Molec. Physiol. 2007;292(1):L92–L98. doi: 10.1152/ajplung.00081.2006. [DOI] [PubMed] [Google Scholar]
- 14.Sears PR, et al. Mucociliary interactions and mucus dynamics in ciliated human bronchial epithelial cell cultures. Am. J.Physiol.-Lung Cellular Molec. Physiol. 2011;301(2):L181–L186. doi: 10.1152/ajplung.00321.2010. [DOI] [PMC free article] [PubMed] [Google Scholar]
- 15.Sears PR, Yin W-N, Ostrowski LE. Continuous mucociliary transport by primary human airway epithelial cells in vitro. Am. J.Physiol.-Lung Cellular Molec. Physiol. 2015;309(2):L99–L108. doi: 10.1152/ajplung.00024.2015. [DOI] [PMC free article] [PubMed] [Google Scholar]
- 16.Sedaghat M, et al. Effect of cilia beat frequency on muco-ciliary clearance. J. Biomed. Phys. Eng. 2016;6(4):265. [PMC free article] [PubMed] [Google Scholar]
- 17.Sedaghat M, et al. On the effect of mucus rheology on the muco-ciliary transport. Math. Biosci. 2016;272:44–53. doi: 10.1016/j.mbs.2015.11.010. [DOI] [PubMed] [Google Scholar]
- 18.Sloane PA, et al. A pharmacologic approach to acquired cystic fibrosis transmembrane conductance regulator dysfunction in smoking related lung disease. PLoS ONE. 2012;7(6):e39809. doi: 10.1371/journal.pone.0039809. [DOI] [PMC free article] [PubMed] [Google Scholar]
- 19.Vasquez PA, et al. Modeling and simulation of mucus flow in human bronchial epithelial cell cultures–Part I: Idealized axisymmetric swirling flow. PLoS Comput. Biol. 2016;12(8):e1004872. doi: 10.1371/journal.pcbi.1004872. [DOI] [PMC free article] [PubMed] [Google Scholar]
- 20.Dillon RH, et al. Fluid dynamic models of flagellar and ciliary beating. Ann. N. Y. Acad. Sci. 2007;1101(1):494–505. doi: 10.1196/annals.1389.016. [DOI] [PubMed] [Google Scholar]
- 21.Mitran SM. Metachronal wave formation in a model of pulmonary cilia. Comput. Struct. 2007;85(11–14):763–774. doi: 10.1016/j.compstruc.2007.01.015. [DOI] [PMC free article] [PubMed] [Google Scholar]
- 22.Lee W, et al. Muco-ciliary transport: effect of mucus viscosity, cilia beat frequency and cilia density. Comput. Fluids. 2011;49(1):214–221. doi: 10.1016/j.compfluid.2011.05.016. [DOI] [Google Scholar]
- 23.Lubkin D, Gaffney E, Blake J. A viscoelastic traction layer model of muco-ciliary transport. Bull. Math. Biol. 2007;69(1):289. doi: 10.1007/s11538-005-9036-x. [DOI] [PubMed] [Google Scholar]
- 24.Puchelle E, Zahm J, Quemada D. Rheological properties controlling mucociliary frequency and respiratory mucus transport. Biorheology. 1987;24(6):557–563. doi: 10.3233/BIR-1987-24606. [DOI] [PubMed] [Google Scholar]
- 25.King M, Agarwal M, Shukla J. A planar model for mucociliary transport: effect of mucus viscoelasticity. Biorheology. 1993;30(1):49–61. [PubMed] [Google Scholar]
- 26.Satir P, Sleigh MA. The physiology of cilia and mucociliary interactions. Annu. Rev. Physiol. 1990;52(1):137–155. doi: 10.1146/annurev.ph.52.030190.001033. [DOI] [PubMed] [Google Scholar]
- 27.Sleigh M. The nature and action of respiratory tract cilia. Respiratory Defense Mech. 1977;1:247–288. [Google Scholar]
- 28.Ross S, Corrsin S. Results of an analytical model of mucociliary pumping. J. Appl. Physiol. 1974;37(3):333–340. doi: 10.1152/jappl.1974.37.3.333. [DOI] [PubMed] [Google Scholar]
- 29.Matar O, Craster R, Warner M. Surfactant transport on highly viscous surface films. J. Fluid Mech. 2002;466:85. doi: 10.1017/S0022112002001106. [DOI] [Google Scholar]
- 30.Cortez R, Fauci L, Medovikov A. The method of regularized Stokeslets in three dimensions: analysis, validation, and application to helical swimming. Phys. Fluids. 2005;17(3):031504. doi: 10.1063/1.1830486. [DOI] [Google Scholar]
- 31.Barton C, Raynor S. Analytical investigation of cilia induced mucous flow. Bull. Math. Biophys. 1967;29(3):419–428. doi: 10.1007/BF02476581. [DOI] [PubMed] [Google Scholar]
- 32.Blake J. A model for the micro-structure in ciliated organisms. J. Fluid Mech. 1972;55(1):1–23. doi: 10.1017/S0022112072001612. [DOI] [Google Scholar]
- 33.Blake JR. A spherical envelope approach to ciliary propulsion. J. Fluid Mech. 1971;46(1):199–208. doi: 10.1017/S002211207100048X. [DOI] [Google Scholar]
- 34.Cortez R. The method of regularized Stokeslets. SIAM J. Sci. Comput. 2001;23(4):1204–1225. doi: 10.1137/S106482750038146X. [DOI] [Google Scholar]
- 35.D. B. Dusenbery, Living at micro scale: the unexpected physics of being small. Harvard University Press, Harvard (2009).
- 36.Eloy C, Lauga E. Kinematics of the most efficient cilium. Phys. Rev. Lett. 2012;109(3):038101. doi: 10.1103/PhysRevLett.109.038101. [DOI] [PubMed] [Google Scholar]
- 37.Fauci LJ, Dillon R. Biofluidmechanics of reproduction. Annu. Rev. Fluid Mech. 2006;38:371–394. doi: 10.1146/annurev.fluid.37.061903.175725. [DOI] [Google Scholar]
- 38.Flores H, et al. A study of bacterial flagellar bundling. Bull. Math. Biol. 2005;67(1):137–168. doi: 10.1016/j.bulm.2004.06.006. [DOI] [PubMed] [Google Scholar]
- 39.Gray J. The kinetics of locomotion of Nereis diversicolor. J. Exp. Biology. 1939;23:101–120. doi: 10.1242/jeb.23.2.101. [DOI] [Google Scholar]
- 40.Gueron S, Liron N. Ciliary motion modeling, and dynamic multicilia interactions. Biophys. J . 1992;63(4):1045–1058. doi: 10.1016/S0006-3495(92)81683-1. [DOI] [PMC free article] [PubMed] [Google Scholar]
- 41.Illum L. Nasal drug delivery—possibilities, problems and solutions. J. Control. Release. 2003;87(1–3):187–198. doi: 10.1016/S0168-3659(02)00363-2. [DOI] [PubMed] [Google Scholar]
- 42.Lauga E, Powers TR. The hydrodynamics of swimming microorganisms. Rep. Prog. Phys. 2009;72(9):096601. doi: 10.1088/0034-4885/72/9/096601. [DOI] [Google Scholar]
- 43.Mistry A, Stolnik S, Illum L. Nanoparticles for direct nose-to-brain delivery of drugs. Int. J. Pharm. 2009;379(1):146–157. doi: 10.1016/j.ijpharm.2009.06.019. [DOI] [PubMed] [Google Scholar]
- 44.Osterman N, Vilfan A. Finding the ciliary beating pattern with optimal efficiency. Proc. Natl. Acad. Sci. 2011;108(38):15727–15732. doi: 10.1073/pnas.1107889108. [DOI] [PMC free article] [PubMed] [Google Scholar]
- 45.Gray J, Hancock G. The propulsion of sea-urchin spermatozoa. J. Exp. Biol. 1955;32(4):802–814. doi: 10.1242/jeb.32.4.802. [DOI] [Google Scholar]
- 46.Xu L, Jiang Y. Mathematical modeling of mucociliary clearance: a mini-review. Cells. 2019;8(7):736. doi: 10.3390/cells8070736. [DOI] [PMC free article] [PubMed] [Google Scholar]
- 47.Smith D, Gaffney E, Blake J. A model of tracer transport in airway surface liquid. Bull. Math. Biol. 2007;69(3):817–836. doi: 10.1007/s11538-006-9163-z. [DOI] [PubMed] [Google Scholar]
- 48.Smith D, Gaffney E, Blake J. Modelling mucociliary clearance. Respir. Physiol. Neurobiol. 2008;163(1–3):178–188. doi: 10.1016/j.resp.2008.03.006. [DOI] [PubMed] [Google Scholar]
- 49.Lintermann A, Schröder W. Simulation of aerosol particle deposition in the upper human tracheobronchial tract. Euro. J. Mech.-B/Fluids. 2017;63:73–89. doi: 10.1016/j.euromechflu.2017.01.008. [DOI] [Google Scholar]
- 50.Shang Y, et al. Computational fluid dynamics analysis of wall shear stresses between human and rat nasal cavities. Euro. J. Mech.-B/Fluids. 2017;61:160–169. doi: 10.1016/j.euromechflu.2016.09.024. [DOI] [Google Scholar]
- 51.Xi J, Kim J, Si XA. Effects of nostril orientation on airflow dynamics, heat exchange, and particle depositions in human noses. Euro. J. Mech.-B/Fluids. 2016;55:215–228. doi: 10.1016/j.euromechflu.2015.08.014. [DOI] [Google Scholar]
- 52.Zanin M, et al. The interaction between respiratory pathogens and mucus. Cell Host Microbe. 2016;19(2):159–168. doi: 10.1016/j.chom.2016.01.001. [DOI] [PMC free article] [PubMed] [Google Scholar]
- 53.Khashkhosha HK, Elhadi M. A hypothesis on the role of the human immune system in covid-19. Med. Hypotheses. 2020;143:110066. doi: 10.1016/j.mehy.2020.110066. [DOI] [PMC free article] [PubMed] [Google Scholar]
- 54.A. Sundararaman, et al., Role of probiotics to combat viral infections with emphasis on COVID-19. Appl. Microbiol. Biotechnol., 1–16 (2020). [DOI] [PMC free article] [PubMed]
- 55.Chowdhury MA, et al. Immune response in COVID-19: A review. J. Infect. Public Health. 2020;13(11):1619–1629. doi: 10.1016/j.jiph.2020.07.001. [DOI] [PMC free article] [PubMed] [Google Scholar]
- 56.Corthésy B. Multi-faceted functions of secretory IgA at mucosal surfaces. Front. Immunol. 2013;4:185. doi: 10.3389/fimmu.2013.00185. [DOI] [PMC free article] [PubMed] [Google Scholar]
- 57.Bahmanzadeh H, et al. Numerical simulation of airflow and micro-particle deposition in human nasal airway pre-and post-virtual sphenoidotomy surgery. Comput. Biol. Med. 2015;61:8–18. doi: 10.1016/j.compbiomed.2015.03.015. [DOI] [PubMed] [Google Scholar]
- 58.Lai SK, et al. Micro-and macrorheology of mucus. Adv. Drug Deliv. Rev. 2009;61(2):86–100. doi: 10.1016/j.addr.2008.09.012. [DOI] [PMC free article] [PubMed] [Google Scholar]
- 59.Shang Y, Inthavong K, Tu J. Detailed micro-particle deposition patterns in the human nasal cavity influenced by the breathing zone. Comput. Fluids. 2015;114:141–150. doi: 10.1016/j.compfluid.2015.02.020. [DOI] [Google Scholar]
- 60.S. Gizurarson, The effect of cilia and the mucociliary clearance on successful drug delivery. Biol. Pharmaceutical Bull., b14–00398 (2015) [DOI] [PubMed]
- 61.Brennen C, Winet H. Fluid mechanics of propulsion by cilia and flagella. Annu. Rev. Fluid Mech. 1977;9(1):339–398. doi: 10.1146/annurev.fl.09.010177.002011. [DOI] [Google Scholar]
- 62.Blake J. On the movement of mucus in the lung. J. Biomech. 1975;8(3–4):179–190. doi: 10.1016/0021-9290(75)90023-8. [DOI] [PubMed] [Google Scholar]
- 63.Brennen C. An oscillating-boundary-layer theory for ciliary propulsion. J. Fluid Mech. 1974;65(4):799–824. doi: 10.1017/S0022112074001662. [DOI] [Google Scholar]
- 64.Cornaz A-L, Buri P. Nasal mucosa as an absorption barrier. Eur. J. Pharm. Biopharm. 1994;40(5):261–270. [Google Scholar]
- 65.Ugwoke MI, Verbeke N, Kinget R. The biopharmaceutical aspects of nasal mucoadhesive drug delivery. J. Pharm. Pharmacol. 2001;53(1):3–22. doi: 10.1211/0022357011775145. [DOI] [PubMed] [Google Scholar]
- 66.Sanderson MJ, Sleigh MA. Ciliary activity of cultured rabbit tracheal epithelium: beat pattern and metachrony. J. Cell Sci. 1981;47(1):331–347. doi: 10.1242/jcs.47.1.331. [DOI] [PubMed] [Google Scholar]
- 67.Myon L, et al. Palatal necrosis due to cocaine abuse. Rev. Stomatol. Chir. Maxillofac. 2010;111(1):32. doi: 10.1016/j.stomax.2009.01.009. [DOI] [PubMed] [Google Scholar]
- 68.Dhand R, Li J. Coughs and sneezes: their role in transmission of respiratory viral infections, including SARS-CoV-2. Am. J. Respir. Crit. Care Med. 2020;202(5):651–659. doi: 10.1164/rccm.202004-1263PP. [DOI] [PMC free article] [PubMed] [Google Scholar]
- 69.Tang JW, et al. Airflow dynamics of human jets: sneezing and breathing-potential sources of infectious aerosols. PLoS ONE. 2013;8(4):e59970. doi: 10.1371/journal.pone.0059970. [DOI] [PMC free article] [PubMed] [Google Scholar]
- 70.N.-T. Nguyen, S.T. Wereley, and S.A.M. Shaegh, Fundamentals and applications of microfluidics. (Artech House, 2019).
- 71.Ma B, Wang Y, Kikker A. Analytical solutions of oscillating Couette-Poiseuille flows for the viscoelastic Oldroyd B fluid. Acta Mech. 2019;230(6):2249–2266. doi: 10.1007/s00707-019-02391-1. [DOI] [Google Scholar]
- 72.Nadeem S, et al. Physiological flow of Carreau fluid due to ciliary motion. AIP Adv. 2016;6(3):035125. doi: 10.1063/1.4945270. [DOI] [Google Scholar]
- 73.Khaderi S, Den Toonder J, Onck P. Fluid flow due to collective non-reciprocal motion of symmetrically-beating artificial cilia. Biomicrofluidics. 2012;6(1):014106. doi: 10.1063/1.3676068. [DOI] [PMC free article] [PubMed] [Google Scholar]
- 74.A. Siddiqui, A. Farooq, and M. Rana, A mathematical model for the flow of a Casson fluid due to metachronal beating of cilia in a tube. Sci. World J. (2015). [DOI] [PMC free article] [PubMed]
- 75.Hahn I, Scherer PW, Mozell MM. Velocity profiles measured for airflow through a large-scale model of the human nasal cavity. J. Appl. Physiol. 1993;75(5):2273–2287. doi: 10.1152/jappl.1993.75.5.2273. [DOI] [PubMed] [Google Scholar]
- 76.Chatelin R, Poncet P. A parametric study of mucociliary transport by numerical simulations of 3D non-homogeneous mucus. J. Biomech. 2016;49(9):1772–1780. doi: 10.1016/j.jbiomech.2016.04.009. [DOI] [PubMed] [Google Scholar]
- 77.Shahcheraghi N, et al. Unsteady and three-dimensional simulation of blood flow in the human aortic arch. J. Biomech. Eng. 2002;124(4):378–387. doi: 10.1115/1.1487357. [DOI] [PubMed] [Google Scholar]
- 78.Afzalimehr H, Najafabadi EF, Gallichand J. Effects of accelerating and decelerating flows in a channel with vegetated banks and gravel bed. Int. J. Sedim. Res. 2012;27(2):188–200. doi: 10.1016/S1001-6279(12)60027-4. [DOI] [Google Scholar]
- 79.Yin Z-Q, et al. Thermophoresis and Brownian motion effects on nanoparticle deposition inside a 90 square bend tube. Aerosol Air Qual Res. 2018;18(7):1746–1755. doi: 10.4209/aaqr.2018.02.0047. [DOI] [Google Scholar]
- 80.Elsamadony M, et al. Possible transmission of viruses from contaminated human feces and sewage: Implications for SARS-CoV-2. Sci. Total Environ. 2021;755:142575. doi: 10.1016/j.scitotenv.2020.142575. [DOI] [PMC free article] [PubMed] [Google Scholar]
- 81.Wilson M, Wilson PJ. Close Encounters of the Microbial Kind. Springer; 2021. The Common Cold; pp. 159–173. [Google Scholar]
- 82.Vadakedath S, et al. Immunological aspects and gender bias during respiratory viral infections including novel Coronavirus disease-19 (COVID-19): A scoping review. J. Med. Virol. 2021;93(9):5295–5309. doi: 10.1002/jmv.27081. [DOI] [PMC free article] [PubMed] [Google Scholar]
- 83.Bovbjerg DH, Stone AA. Psychoneuroimmunology, stress, and infection. CRC Press; 2020. Psychological stress and upper respiratory illness; pp. 195–213. [Google Scholar]
Associated Data
This section collects any data citations, data availability statements, or supplementary materials included in this article.
Data Availability Statement
This manuscript has associated data in a data repository. [Authors’ comment: Data will be made available on request.]


