Abstract
Purpose
Age-related macular degeneration (AMD) is a leading cause of blindness among the elderly worldwide. Clinical imaging and histopathologic studies are crucial to understanding disease pathology. This study combined clinical observations of three brothers with geographic atrophy (GA), followed for 20 years, with histopathologic analysis.
Methods
For two of the three brothers, clinical images were taken in 2016, 2 years prior to death. Immunohistochemistry, on both flat-mounts and cross sections, histology, and transmission electron microscopy were used to compare the choroid and retina in GA eyes to those of age-matched controls.
Results
Ulex europaeus agglutinin (UEA) lectin staining of the choroid demonstrated a significant reduction in the percent vascular area and vessel diameter. In one donor, histopathologic analysis demonstrated two separate areas with choroidal neovascularization (CNV). Reevaluation of swept-source optical coherence tomography angiography (SS-OCTA) images revealed CNV in two of the brothers. UEA lectin also revealed a significant reduction in retinal vasculature in the atrophic area. A subretinal glial membrane, composed of processes positive for glial fibrillary acidic protein and/or vimentin, occupied areas identical to those of retinal pigment epithelium (RPE) and choroidal atrophy in all three AMD donors. SS-OCTA also demonstrated presumed calcific drusen in the two donors imaged in 2016. Immunohistochemical analysis and alizarin red S staining verified calcium within drusen, which was ensheathed by glial processes.
Conclusions
This study demonstrates the importance of clinicohistopathologic correlation studies. It emphasizes the need to better understand how the symbiotic relationship between choriocapillaris and RPE, glial response, and calcified drusen impact GA progression.
Keywords: age-related macular degeneration, Müller cells, choroid, geographic atrophy, calcified drusen
Age-related macular degeneration (AMD) is the leading cause of irreversible vision loss and blindness among the elderly worldwide.1 According to the Centers for Disease Control and Prevention, 19.8 million Americans over the age of 40 years had AMD in 2019. Treatments may soon get approved for the more advanced stage of dry AMD, known as geographic atrophy (GA).2,3 Challenges in treating GA include its complexity and the phenotypic heterogeneity among affected individuals.
Adding to the complexity of AMD is the involvement of many different cell types. To date, most research has focused on changes in photoreceptors, retinal pigment epithelium (RPE), Bruch's membrane (BM), and choriocapillaris (CC). Histopathologic studies have shown that the CC is extremely attenuated in GA,4,5 and its function may be compromised due to loss of endothelial transport systems ahead of atrophy.6,7 Recent reports have also demonstrated remodeling and membrane formation on the pre- and subretinal surface by Müller cells, the primary retinal glial cell, in AMD.8–10 Given the neuronal dependence on Müller cells, changes to their structure alone could have detrimental consequences to the retina. In addition, activated Müller cells release cytokines that could exacerbate inflammation in AMD. It has also recently been observed on optical coherence tomography (OCT) that changes to the external limiting membrane (ELM), which is formed by Müller cells and photoreceptor segments, precede RPE and CC loss.11 Therefore, it is crucial that changes to Müller cells in AMD be investigated along with changes in the RPE/BM/CC complex.
One way to advance the current understanding of GA is to study how disease progression varies among related individuals. Another important step is correlating clinical diagnostics with histopathologic assessment. Recent clinical advances in imaging enable clinicians to visualize retinal and choroidal changes over time in each patient and, potentially, identify novel biomarkers for assessing disease progression. The addition of histopathologic analysis enables concrete identification of structures observed in clinical imaging and expansion on these findings.
The present study reports on clinical and histopathologic features in eyes of three brothers diagnosed with GA and followed for 18 to 20 years. The progression of disease and clinical images were correlated with histopathologic features of the choroidal and retinal vessels, RPE, retina glia, and calcified drusen. These studies expand our previous research examining glial remodeling and choroidal vascular loss in AMD.
Methods
Image Acquisition
At the Bascom Palmer Eye Institute, patients referred to as GA2 and GA3 underwent color fundus imaging centered on the fovea using a device with a 50-degree field of view (FOV) (TRC-50DX; Topcon Medical Systems, Oakland, NJ, USA) and a 200-degree FOV (Optos, Inc., Marlborough, MA, USA). Swept-source optical coherence tomography angiography (SS-OCTA) imaging (PLEX Elite 9000; Carl Zeiss Meditec, Dublin, CA, USA) was performed using a 12 × 12-mm foveal-centered scan with a 40-degree FOV. The instrument used a central wavelength of 1050 nm and a scanning rate of 100,000 A-scans per second. This scan pattern consisted of 500 A-scans per B-scan at 500 B-scan positions, with each B-scan repeated twice at each position, resulting in a uniform spacing of 24 µm between adjacent A-scans.
The SS-OCTA 12 × 12-mm volume scan was used to prepare two en face images: a sub-RPE slab, extending 64 to 400 µm below the BM, and an RPE-BM slab, extending from the boundary of the RPE to the BM. The en face sub-RPE slab was used to detect regions with increased choroidal light transmission, known as choroidal hypertransmission defects, and regions of decreased choroidal light transmission, known as choroidal hypotransmission defects.7,12,13 The multilayer segmentation algorithm provided by the device was used to generate the boundaries for the en face images. These segmentations were manually revised and edited if needed.
Donor Eyes
Human donor eyes were obtained from five aged control subjects without AMD through the National Disease Research Interchange (Philadelphia, PA, USA) and three siblings with GA (arranged in advance directly with the donors’ families by GAL). All tissue was received within 22 to 48 hours of death after shipping on wet ice. Utilization of this human tissue was in accordance with the Declaration of Helsinki with approval of the Joint Committee on Clinical Investigation at Johns Hopkins University School of Medicine. All donors were white. Table 1 summarizes the general characteristics of each donor subject. The clinical diagnosis of GA for siblings was determined by clinical examination (JSS and PR) and postmortem gross examination of posterior eyecups, using transmitted and reflected illumination with a dissecting microscope (Stemi 2000; Carl Zeiss, Inc., Thornwood, NY, USA). All aged control eyecups were unremarkable.
Table 1.
Aged Control and GA Donor Eyes Used in This Study
| Donor | Age at Death, y | COD | DET/PMT | Ethnicity/Sex | Eye | Postmortem Gross Observation |
|---|---|---|---|---|---|---|
| AC1 | 84 | MI | 9.0/27.8 | C/M | OS | Unremarkable |
| AC2 | 75 | UTI | 5.0/30.0 | C/F | OD | Unremarkable |
| AC3 | 76 | CA | 5.0/22.0 | C/F | OS | Unremarkable |
| AC4 | 71 | CA | 4.9/24.5 | C/M | OS | Unremarkable |
| AC5 | 100 | CA | 5.6/27.5 | C/F | OD | Unremarkable |
| GA1 | 90 | CA | 5.8/32.0 | C/M | OD | RPE atrophy in macula |
| GA2 | 92 | CA | ?/27 | C/M | OD | RPE atrophy in posterior pole and peripapillary region, scattered drusen outside atrophic area |
| GA3 | 98 | CAN | 14.0/48.0 | C/M | OS | RPE atrophy in posterior pole and peripapillary region, scattered drusen outside atrophic area |
Postmortem definitions: Unremarkable = no signs of pathology in retina, RPE, or choroid; no drusen present. AC, aged control; C, Caucasian; CA, cardiac arrest; CAN, cancer; COD, cause of death; DET, death to enucleation; MI, myocardial infarct; PMT, post mortem time; UTI, urinary tract infection.
Tissue Preparation
Whole globes were opened at the limbus, anterior segments were removed, and the posterior eyecups were examined microscopically (Zeiss Stemi 2000-C Stereo Microscope; Carl Zeiss, Inc.). One eye from each donor was cryopreserved while the second eye was processed for retinal and choroidal flat-mounts. Digital images of the eyecups were captured (Gryphax NAOS 20 Megapixel Full HD USB 3.0 Color Digital Microscope Camera; Jenoptik, Rochester Hills, MI, USA) using reflected and transmitted illumination prior to further dissection. Vitreous was removed and retinas were then excised from the RPE/choroid and placed overnight in 2% paraformaldehyde (PFA) in 0.1 M cacodylate buffer at 4°C. Eye cups containing the choroid with the RPE intact were reimaged before they were immersed in 1% EDTA (disodium salt; dihydrate crystal; Baker Chemical Co., Radnor, PA) in distilled water for 2 hours at room temperature to facilitate removal of the RPE. Any adherent RPE cells were removed by pipetting the choroid with EDTA solution from a syringe with a blunted 25-gauge needle. Gross digital images of choroids were captured again without RPE. RPE-denuded choroids were then dissected from the sclera, washed briefly in 0.1 M cacodylate, and fixed overnight in 2% PFA in 0.1 M cacodylate buffer at 4°C.
Flat-Mounted Immunohistochemistry
Flat-mounted retinas and choroids were processed for immunohistochemistry as previously described.4,5,8,9 Briefly, fixed tissue was washed and then blocked in 5% normal goat serum prepared in Tris-buffered saline (TBS) with 0.1% bovine serum albumin and 1% Triton X-100 (TBST-BSA). Tissue was then incubated in primary antibody cocktail for 72 hours, washed in TBST three times, and incubated in secondary antibody cocktail for 48 hours. Ulex europaeus agglutinin (UEA) lectin/FITC conjugated (1:100, cat. GTX01512; GeneTex, Inc., Irvine, CA, USA) was included with the secondary antibody cocktail for vascular labeling in all choroids and most retinal samples. Some nonmacular pieces of retina were incubated with peanut agglutin (PNA; 1:500, FL-1075-2; Vector Lab, Newark, CA, USA) to label cone outer segment sheaths. Blocking, all antibody incubations, and washes were done at 4°C. Antibodies used are listed in Table 2. Retinas and choroids were then imaged on a Zeiss LSM 710 confocal microscope (Carl Zeiss Microscopy, LLC, Thornwood, NY, USA) using Zen software. For choroids, only the UEA lectin staining will be discussed herein.
Table 2.
List of Antibodies Used
| Antibody | Source | Catalog # | Dilution |
|---|---|---|---|
| Rb-a-GFAP | Dako | Z0334 | 1:200 |
| Rb-a-vimentin | Abcam | AB45939 | 1:200 |
| Ck-a-GFAP | Millipore/Sigma | AB5541 | 1:500 |
| Ck-a-vimentin | Millipore/Sigma | AB5733 | 1:500 |
| Rb-a-laminin | Millipore/Sigma | L-9393 | 1:200 |
| Rb-a-CD44 | Abcam | 1:200 | |
| UEA lectin | Genetex | GTX01512 | 1:100 |
| Gt-a-Rabbit-cy3 | Jackson Immunoresearch | 111-165-003 | 1:200 flat 1:500 cyro |
| Gt-a-Rabbit AF647 | Invitrogen | A21244 | 1:200 flat 1:500 cyro |
| Gt-a-Chicken-cy3 | Jackson Immunoresearch | 103-165-155 | 1:200 flat 1:500 cyro |
| Gt-a-Mouse-Cy3 | Jackson Immunoresearch | 103-165-155 | 1:200 flat 1:500 cyro |
| DAPI | Invitrogen | D21490 | 1:1000 |
| PNA, fluorescein | Vector Labs | FL-1071-5 | 1:500 |
Antibodies used for flat-mount or cryopreserved immunohistochemistry. Ck, chicken; Gt, goat; Rb, rabbit.
Cryopreservation and Immunohistochemistry on Cryosections
One eye from each donor was fixed in 2% PFA in PBS containing 5% sucrose for 2 hours and then incubated in increased concentrations of sucrose as previously described.8,9,14 Eyes were cut into pieces and embedded using a solution containing 20% sucrose and Tissue-Tek optimal cutting temperature medium (Sakura Finetek, Torrance, CA, USA). Immunohistochemistry was performed as previously described.9 Briefly, sections were permeabilized with methanol, air dried, and then washed in TBS before incubating in primary antibody for 2 hours, followed by a cocktail of secondary antibodies (1:500) with 4′,6-diamidino-2-phenylindole (DAPI; 1:1000) and UEA lectin (blood vessels; 1:100). Antibodies are listed in Table 2. Slides were coverslipped using Dako cytomation mounting media (Agilent, Santa Clara, CA, USA). Images were collected on a Zeiss 710 confocal microscope. Images were pseudocolored for analysis and image presentation.
Image Acquisition and Analysis
An area from the posterior pole region of approximately 7 × 8 mm2 (larger in some GA cases to include the entire area of atrophy) was excised from each intact choroid. The trimmed tissue included the region just nasal to the optic nerve opening, beyond the inferior and superior vascular arcades of retina, and several millimeters beyond the macula temporally as previously described.15 The tissue was flat-mounted in TBS on a glass microscope slide, coverslipped, and imaged at 5×, 10×, and 20× magnification on a Zeiss 710 Confocal Microscope (Carl Zeiss, Inc.) with BM nearest the objective. The submacular region was centered in the oculars, and tiled overlapping fields (10% overlap) at 2048 × 2048-pixel resolution were collected as Z stacks using Zen Software (Carl Zeiss, Inc.). Laser power, pinhole, gain, and other capture parameters were saved and used for imaging each choroid under identical conditions. The number of Z slices collected varied somewhat depending on the tissue thickness. The inner boundary of the Z stack was set at the focus level just above the CC, and the outer-limit of the Z stack was set where large choroidal vessels were no longer visible.
Retinal pieces were imaged at 5× and 20× magnifications on a Zeiss 710 Confocal Microscope (Carl Zeiss, Inc.) with the inner limiting membrane (ILM) en face, for retinal vessel analysis, and then with the ELM en face. Tissue maps were first obtained with the 5× objective and captured as Z stacks of tiled overlapping fields (10% overlap) at 1024 × 1024 resolution. The maps were designed to cover the entire tissue piece and varied in size between 5 × 7 mm and 7 × 8 mm. For tissues maps with the ILM en face, the inner-limit was the appearance of vessels, and the outer was the deep vasculature. For maps with the ELM en face, the inner-limit Z plane was set at the start of any staining, and the outer-limit Z plane was set just beyond Müller cell staining at the ELM. Images taken with the 20× objective were collected from the first appearance to the disappearance of staining with a 2048 × 2048 resolution.
For image analysis, maximum-intensity projection, 5× stitched images of UEA-stained flat-mounts were exported from Zen Software as full-resolution TIFF images and opened in Adobe Photoshop (CS6; Adobe Systems Incorporated, San Jose, CA, USA). Other antibody channels were turned off for this analysis. The total area of degenerated CC was measured by hand. Three square marquee tool selections (equivalent to 1 mm2) were randomly made of regions in the submacular and paramacular choroid and the macular and paramacular, retina as described previously,15 and pasted into new image documents. Paramacular defined herein included regions outside the arcades with zero overlap with areas of RPE loss. Paramacular fields were 5 to 6 mm peripherally from the submacular center. For CC diameter analysis, a minimum of 30 measurements were made from each region. Retinal and choroidal images were then adjusted using levels and thresholding and saved for analysis as had been done previously.15 The images were converted to binary, noise reduction was applied, and the calculation of black and white pixel macro in FIJI16 was used to perform percent vascular area (% VA) determinations as described previously.4
Alizarin Red S Staining
Cryosections were air dried before incubating in 1% alizarin red S (AR; Millipore Sigma, St. Louis, MO, USA) for 2 minutes at room temperature. Following AR staining, sections were coverslipped using Permount and imaged on a Zeiss Photomicroscope II (Carl Zeiss, Inc.) with a Gryphax NAOS 20 Megapixel Full HD USB 3.0 Color Digital Microscope Camera (Jenoptix). For calcium removal, sections were incubated in 1% EDTA for 15 minutes before staining with AR.
JB-4
After imaging retinal and choroidal flat-mounts, select areas were excised and postfixed flat in one-quarter strength Karnovsky's paraformaldehyde–glutaraldehyde fixative at 4°C. Tissues were dehydrated and embedded in glycol methacrylate (JB-4; Polysciences, Inc., Warrington, PA, USA) as previously described.17 Sections (2.5 microns thick) were cut using a dry glass knife on a Sorvall MT2-B Microtome (Norwalk, CT, USA), dried on glass slides, and stained with periodic acid/Schiffs and hematoxylin. Images were captured on a Zeiss Photomicroscope II (Carl Zeiss, Inc.) using a Gryphax NAOS 20 Megapixel Full HD USB 3.0 Color Digital Microscope Camera (Jenoptik).
Transmission Electron Microscopy
Choroid and retinal pieces were cut from the GA border region of GA2 and fixed for a minimum of 24 hours at 4°C in 2% paraformaldehyde and 2.5% glutaraldehyde (EMS, Hatfield, PA, USA) in 1 M cacodylate buffer (Millipore Sigma), pH 7.3. The pieces were washed twice for 10 minutes with 1.0 M sodium cacodylate buffer followed by postfixation in 1% osmium tetroxide (EMS) in 0.05 M cacodylate buffer, pH 7.3, at 4°C for 90 minutes. Tissues were then washed twice in 0.1 M cacodylate buffer and dehydrated in a graded series of ethanol. Tissues were stained en bloc with 1% uranyl acetate (EMS) in absolute ethanol. Ethanol was cleared with two 15-minute washes of propylene oxide (EMS). Resin infiltration was started with a 1:1 mixture of LX112 (Ladd Research, Williston, VT, USA) and propylene oxide in tightly capped vials on a rotator overnight at room temperature. The specimens were transferred to a 100% resin mixture for 5 hours at room temperature under vacuum before being transferred to embedding molds and polymerized at 60°C for 36 hours.
One-micron semithin sections for light microscopy were cut on a Sorvall MT ultramicrotome and stained with a filtered solution of 1% toluidine blue O (Millipore Sigma) and 1% sodium borate (EMS). Areas for transmission electron microscopy (TEM) were selected and trimmed for ultramicrotomy. Ultra-thin sections (68–72 nm) were cut on a Leica EM UC7 ultramicrotome (Leica Microsystems, Vienna, Austria) using a 3.5-mm Diatome diamond knife (EMS), transferred to 3.5-mm thin bar copper grids, and stained for 10 minutes with 2% aqueous uranyl acetate (EMS) and 3 minutes with lead citrate (EMS). Images were captured with a Hitachi H7600 (Tokyo, Japan) transmission electron microscope at 80 kV.
Statistical Analysis
Data are reported as means ± standard deviation. Statistical evaluation of the data involved hypothesis testing using the Student's t-test for two samples with unequal variances assumed. A P value of 0.05 or less was considered statistically significant.
Results
Clinical History of GA
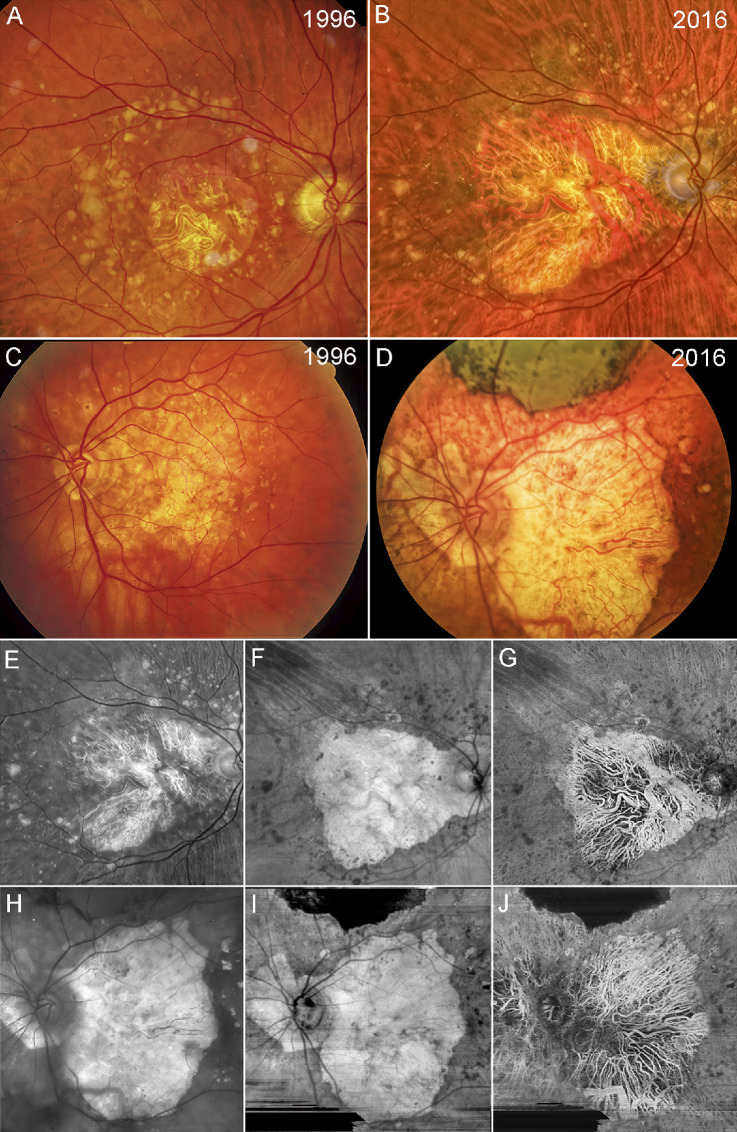
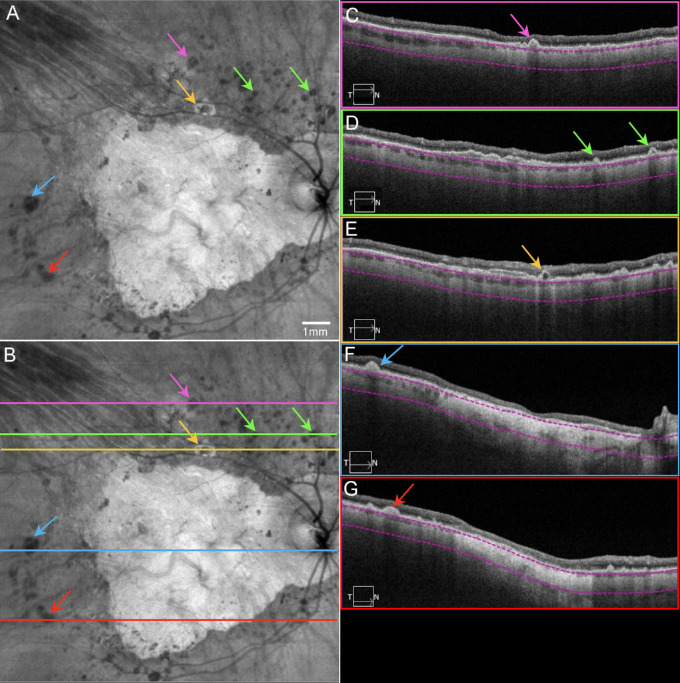
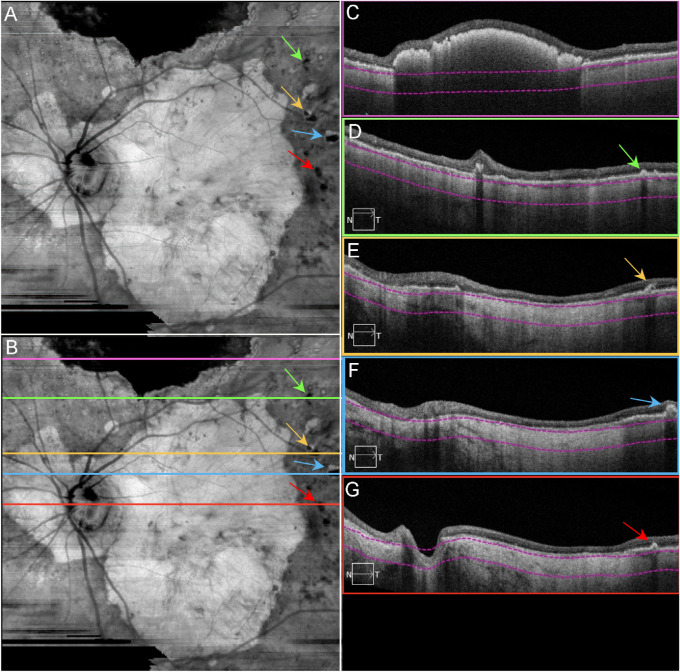
All three brothers with GA were seen by Dr. Janet Sunness from 1995 to 2000. Donor 1 (GA1) had drusen but no GA when last seen by Dr. Sunness in 2000. The enlargement rate of the GA was calculated using linear regression, including all visits from 1995 through 2000 (six visits for GA2 and five for GA3) with measurable areas of atrophy. The only ocular history from 2000 to 2016 on this donor is a clinical diagnosis of GA before he died. The other two brothers (GA2 and GA3) had GA as early as 1995. Between 1995 and 2000, when last seen by Dr. Sunness, GA2 had a rate of progression of 1.26 mm2/y (OD) and 1.53 mm2/y (OS). GA3 had a faster rate of progression in both eyes: 2.73 mm2/y (OD) and 3.15 mm2/y (OS). These two brothers were seen by Dr. Philip Rosenfeld and had clinical images taken in 2016 at the Bascom Palmer Eye Institute (Figs. 12–3). The best-corrected visual acuity was 200/400 from both eyes of patient GA2. The best-corrected visual acuity was counting fingers at 2 feet from both eyes of patient GA3. Based on clinical examination and multimodal images, both patients GA2 and GA3 were diagnosed with late-stage atrophic AMD. The pattern of GA was similar between eyes in each patient.
Figure 1.
Fundus photographs and swept source OCT angiography images. Color fundus imaging of patient GA2 (A, B) and patient GA3 (C, D) in 1996 and 2016. (A) Patient GA2 has a circular region of central foveal-involving GA with surrounding drusen along the vascular arcades. (B) The region of GA in patient GA2 has enlarged over 10 years with surrounding drusen beyond the vascular arcades. (C) Patient GA3 has an irregular region of GA involving the central macula with surrounding drusen and hyperpigmentation. (D) Over 10 years, the region of GA has enlarged with extension to the peripapillary area along with surrounding drusen and hyperpigmentation. Note that along the superior region of the macula, scarring has resulted from the area with the previous macular hemorrhage. Red-free fundus image and SS-OCTA en face imaging of patient GA2 (E–G) and patient GA3 (H–J) in 2016. (E) Red-free imaging of the same eye as in B. (F) En face sub-RPE structural image showing GA corresponding to the hypertransmission defect (hyperTD) along with surrounding calcified drusen, which correspond to the dark regions or hypotransmission defects (hypoTDs). (G) En face sub-RPE SS-OCTA image showing the large choroidal vessels within the GA lesion that correspond with those shown in the color and red-free fundus photo. (H) Red-free fundus image of the same eye as in D. (I) En face sub-RPE structural image showing a hyperTD that corresponds to GA surrounded by hypoTDs that correspond to calcified drusen. The scarring corresponds to the dark hypoTD since it blocks the light from penetrating into the choroid. (J) En face sub-RPE angiographic image showing the large choroidal vessels within the region of GA that correspond to the choroidal vessels seen in the color and red-free fundus images.
Figure 2.
Final OCT scans acquired from patient GA2. SS-OCT en face and B-scan images from patient GA2 in 2016, the same eye as in Figures 1A and 1B. (A) En face sub-RPE structural image showing GA as a hyperTD with surrounding calcified druse as hypoTDs (arrows). Note the yellow arrow pointing to a lesion described as a donut. (B) Same image as A with lines indicating the B-scan locations. (C) B-scan image corresponding to the pink line in B, showing a calcified drusen (pink arrow). (D) B-scan image corresponding to the green line in B, showing a calcified drusen (green arrows) and a double-layer sign (see Fig. 9). (E) B-scan image corresponding to the yellow line in B, showing a donut lesion (yellow arrow) as a hyperTD surrounding the hypoTD. Note this lesion has a hyporeflective core. (F) B-scan image corresponding to the blue line in B, showing a calcified druse (blue arrow) and GA as a hyperTD involving the fovea. (G) B-scan image corresponding to the red line in B, showing a calcified druse (red arrow) and other smaller drusen, as well as GA as a hyperTD in the middle. Note in C–G, the choroid is significantly thin. The property of calcified drusen was confirmed by histopathology in Figure 15.
Figure 3.
Final OCT scans acquired from patient GA3. SS-OCT en face and B-scan images from patient GA3 in 2016, the same eye in Figures 1C and D. (A) En face sub-RPE structural image showing GA lesion as a hyperTD with surrounding calcified drusen as hypoTDs (arrows). (B) Same image as A with lines indicating the B-scan locations. (C) B-scan image corresponding to the pink line in B, showing the hyperreflective scarring within the retina that blocks the light from penetrating into the choroid. (D) B-scan image corresponding to the green line in B, showing a calcified druse (green arrow). (E) B-scan image corresponding to the yellow line in B, showing a calcified druse with a hyporeflective core (yellow arrow) and GA as a hyperTD. (F) B-scan image corresponding to the blue line in B, showing a calcified druse (blue arrow) and GA as a hyperTD. (G) B-scan image corresponding to the red line in B, showing a calcified druse (red arrow) and GA as a hyperTD. Note in C–G, the choroid is significantly thin. The property of calcified drusen was confirmed by histopathology in Figure 15.
Gross Observations and Area of Atrophy in GA Eyes
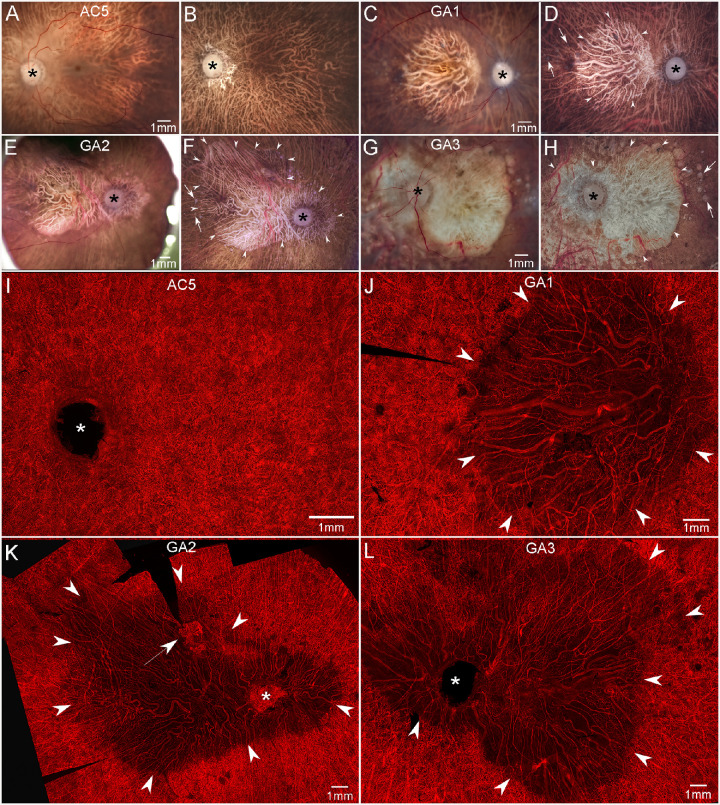
The mean age for control eyes was 81.2 ± 11.5 years, and the mean age for the GA siblings was 93.3 ± 4.2 years (Table 1). All aged control eyes were free of maculopathy in gross examination. No posterior pole drusen or RPE changes were observed (Figs. 4A, 4B). All three siblings with GA demonstrated RPE atrophy in the posterior pole. The pattern of atrophy was similar in both eyes from each donor. Therefore, we randomly selected which eye from each donor to analyze as a flat-mount. In GA donor 1 (GA1), the area of atrophy was ovoid in shape with a well-demarcated border that was confined to the macular region and measured 34.75 mm2 in area in gross images (Figs. 4C, 4D). In GA donor 2 (GA2), the area of atrophy was irregularly shaped, showed a fairly well-demarcated border, extended beyond the macula, and included the peripapillary region (Figs. 4E, 4F). The area of atrophy measured 84.82 mm2 in gross images. In the third sibling (GA3), the area of atrophy was mostly rounded in shape, showed a well-demarcated border in most regions, extended beyond the macula, and included the peripapillary region (Figs. 4G, 4H). The atrophic area measured approximately 83.67 mm2 in gross images. The long postmortem time and resulting sloughing of RPE made accurate atrophy measurement in this eye more difficult.
Figure 4.
Gross photographs and choroidal flat-mounts. Gross photos of posterior eyecups from an aged control and GA donors with retinas intact (A, C, E, G) and after retinal dissection (B, D, F, H). The control eye (A, B) is free of maculopathy, and no posterior pole drusen or RPE changes are observed. In GA eyes (C–H), large areas of RPE atrophy (arrowheads in D, F, H) are present in the macula of GA1 (C, D) and extending beyond macula to the major retinal arcades and peripapillary regions of GA2 (E, F) and GA3 (G, H). Drusen are seen beyond the border of atrophy in all GA eyes (arrows in D, F, H). UEA-stained choroidal flat-mount from a 100-year-old control eye (I) demonstrates a dense, uniform, and freely interanatomosing pattern of CC in the posterior pole. In GA eyes (J–L), severe CC dropout is evident in regions of RPE atrophy (arrowheads). In these areas, few capillaries remained viable and blood vessels were composed primarily of intermediate and large choroidal vessels. In GA2, CNV is present superiorly to macula near the border of CC dropout (arrow in K). Scale bars represent 1 mm in all panels. The asterisk shows the optic nerve head.
Choroidal Percent Vascular Area and CC Diameter
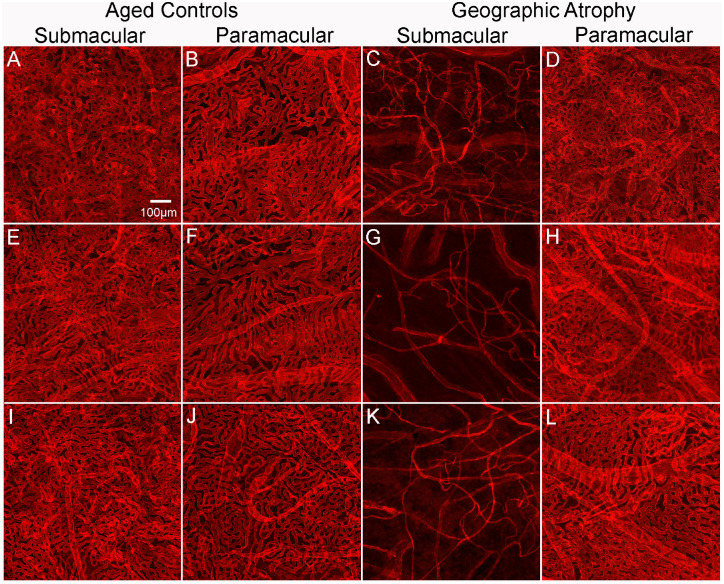
Microscopic examination of choroidal flat-mounts from aged control eyes revealed a uniform interconnecting pattern of CC in the posterior pole (Fig. 4I). In GA eyes, severe CC dropout was evident in a pattern and size that directly corresponded to regions of RPE atrophy (Figs. 4J–L). In these areas, few capillaries remained viable and blood vessels were composed primarily of intermediate and large choroidal vessels. The surviving capillaries appeared constricted. The % VA analysis demonstrated that in the submacular (Figs. 5A, 5E, 5I) and the paramacular (Figs. 5B, 5F, 5J) choroid of the aged control eyes, vessel density was 78.1% ± 3.2% and 79.7% ± 5.1%, respectively. The CC luminal diameters were 16.5 ± 2.25 µm in the submacular and 15.8 ± 1.98 µm in the paramacular regions. These values are similar to those we have reported previously.15 In GA eyes, the % VA was 20.6% ± 5% and 77.8% ± 2.6% in the submacular (Figs. 5C, 5G, 5K) and paramacular regions (Figs. 5D, 5H, 5L), respectively. CC luminal diameters in GA eyes were 9.6 ± 2.9 µm in the submacular region and 16.5 ± 3.1 µm in the paramacular region. While both % VA and CC diameters in the paramacular regions were not statistically different in GA compared to aged control eyes, submacular values were significantly reduced in GA eyes (CC diameter, P < 0.001; % VA, P < 0.0005).
Figure 5.
Percent VA in choroids in aged control and subjects with GA. Representative higher-magnification images of UEA-stained choroidal flat-mounts showing the submacular and paramacular choroidal vasculature in three aged control eyes and three GA donor eyes. Reduced vascular area is observed in the submacular region (C, G, K) of GA choroids compared to that in controls (A, E, I). In the paramacular region, the vascular area was similar in control (B, F, J) and GA (D, H, L) choroids. Remaining viable CC luminal diameters in GA submacula is also significantly constricted compared to aged controls. Scale bar in A indicates 100 µm for all panels.
Choroidal Neovascularization
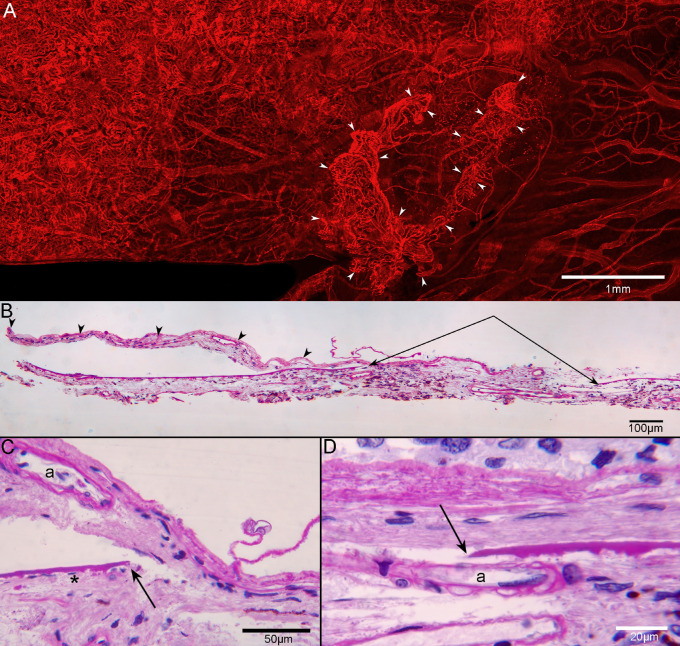
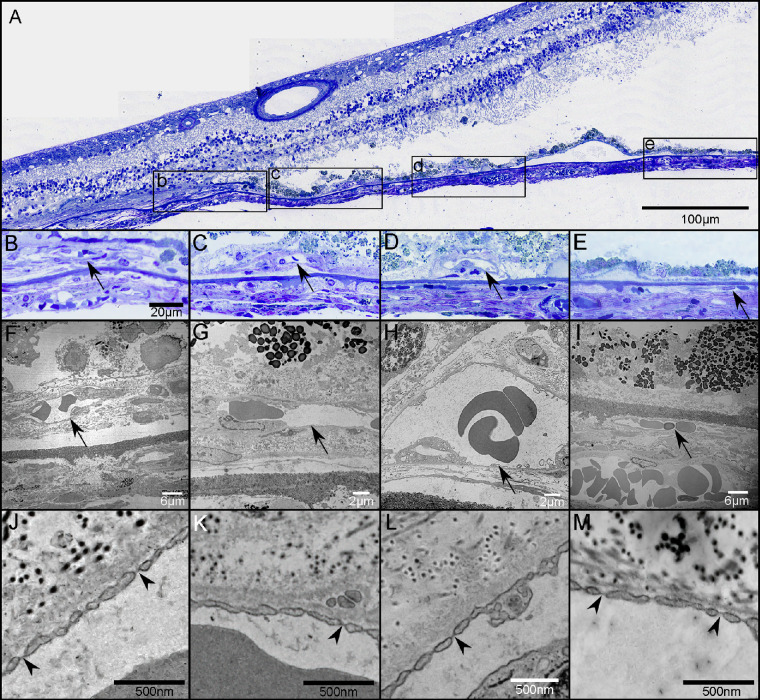
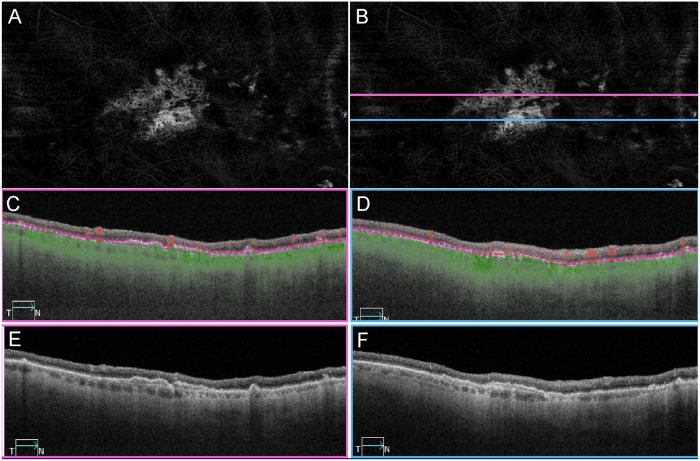
In addition to the atrophy of the RPE and CC degeneration noted, there were several regions with active neovascularization (NV) in GA2’s choroid. In GA2’s superior choroid, near the border of RPE atrophy and degenerating CC, active choroidal neovascularization (CNV) was present that measured 1.32 mm2 in area (Fig. 6A). The lesion was composed of some large vessels branching and extending outwardly, anastomotic and looping vessels in the periphery, and branching capillaries at its border, terminating in blind ends. The CNV was fed via choroidal arteries that extended through a large break in BM (Figs. 6B–D). TEM revealed that many of the endothelial cells in the NV had fenestrations, some of which appeared typical for those found in surviving CC, outside the area of RPE atrophy (Fig. 7). When reanalyzing the SS-OCTA images, the RPE-BM slab was used to detect type 1 CNV in GA2 (Fig. 8) and GA3 (data not shown). This slab identified neovascular lesions arising from the CC and residing between the RPE and BM.18 We reviewed both the angiographic and structural images using both en face and B-scan images to confirm that both the flow and structural profiles were consistent with type 1 CNV.
Figure 6.
CNV in flat-mounted and sectioned choroid. UEA flat-mount of the superior choroid from GA2 near the border of RPE atrophy and degenerating CC (A), showing CNV (arrowheads), which is 1.32 mm2 in area. The lesion is composed of some large vessels branching and extending outwardly, anastomotic and looping vessels in the periphery, and branching capillaries at its border, terminating in blind ends. In PAS/hematoxylin-stained JB-4 sections of this choroid, the CNV (arrowheads in B) extends from a large defect in BM (paired arrows in B). The CNV is fed via choroidal arterioles (“a” in C, D), which are seen traversing the discontinuous BM (arrows in C, D). Scale bars: 1 mm (A), 100 µm (B), 50 µm (D), and 20 µm (D).
Figure 7.
Choroidal neovascularization in transmission electron micrographs. Thick section of an epoxy embedded region of superior retina/choroid from the atrophic border of G2 (A). Higher magnification of boxed regions in A showing CNV (arrows in B–D) at the border of atrophy (B) and beyond the atrophic border (C, D). There is no CNV in region E. Low-magnification TEM images from the regions shown in B–E showing CNV internal to BM (arrows in F–H) and a choroidal capillary more peripherally (arrow in I). Many of the endothelial cells in the CNV had fenestrations (arrowheads in J–L), some of which appeared typical for those found in surviving CC outside the area of RPE atrophy (arrowheads in M). Scale bars: 100 µm (A), 20 µm (B–E), 6 µm (F, I), 2 µm (G, H), 500 µm (J–M).
Figure 8.
OCTA imaging of CNV in patient GA2. SS-OCTA en face and B-scan imaging of the same eye in Figures 2A–C and Figure 3 from patient GA2 in 2016. (A) En face angiography image using the RPE to BM slab to illustrate type 1 CNV. (B) Same image as A with lines indicating the B-scan locations. (C, D) Angiographic B-scan images with segmentation lines (purple) corresponding to the RPE and BM. The corresponding locations of the B-scan images were indicated as pink and blue lines in B. (E, F) Structural B-scan images at the same location as in C and D, showing a separation between the RPE and BM, known as a double-layer sign.
Retinal Macular % VA
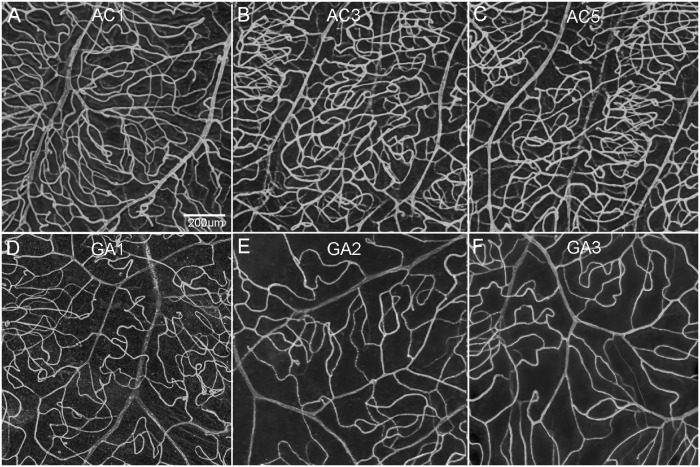
Retinas were initially imaged with the ILM nearest the objective to visualize the vasculature. Retinal vasculature in the macula of aged control eyes (Figs. 9A–C, Fig. 10A) showed a normal arrangement and branching pattern of arteries, veins, arterioles, venules, and capillaries. Both the arterioles and venules in the ganglion cell layer and two deeper capillary networks above and below the inner nuclear layer were present (based on Z stack images). The % VA in aged controls was 33.94% ± 2.79%. In GA eyes (Figs. 9D–F, Figs. 10E, 10I, 10M), fewer branches were observed from arterioles, and venules and deeper capillaries appeared to be far fewer or completely absent (based on Z stack images and cross sections). The % VA was 16.5% ± 1.84%, which was significantly reduced compared to aged controls (P < 0.0001). This reduction in % VA in GA eyes extended at least 4 mm temporally from the foveal center (aged controls, 24.4% ± 3.3%; GA, 17.5% ± 2.8%). The retina % VA was significantly less in both areas of the macula compared to aged controls (P < 0.0001). While the foveal avascular zone (FAZ) area was not used for the retinal vascular density measurements in macula, the FAZ was included in our images and appeared enlarged in eyes with GA compared to controls. Unfortunately, a tear in one retina at the fovea prevented us from accurately measuring the FAZ in these donors to conclusively state if there are changes in this region.
Figure 9.
Retinal vascular changes. UEA staining of retinal flat-mounts from three age-matched controls (A–C) and three GA donor eyes (D–F) demonstrates reduced vascular area in the macular retina of patients with GA. Scale bar: 200 µm.
Figure 10.
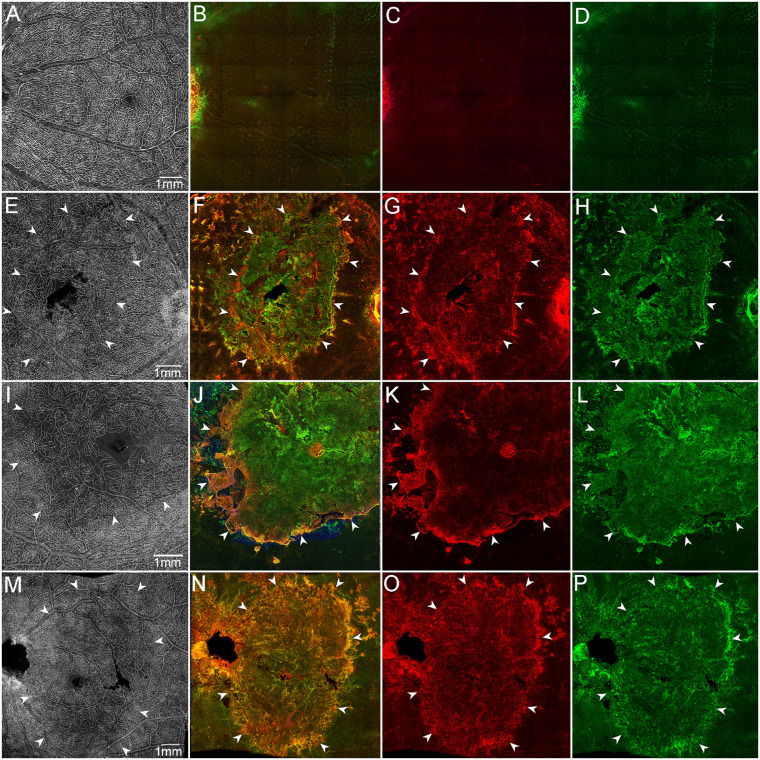
Retinal glia and vascular changes in areas of RPE atrophy. Aged control (A–D), GA1 (E–H), GA2 (I–L), and GA3 (M–P). Retinas were stained with UEA lectin (white), GFAP (red), and vimentin (green). Aged control retinal flat-mount imaged en face with the ILM uppermost exhibits a uniform vasculature in the posterior pole (A). Control retina imaged en face with the ELM uppermost was nondescript (B–D). GA retinas imaged with the ILM uppermost (E, I, M) exhibit a clear reduction in retinal vascular density in the atrophic area (arrowheads) located in the posterior pole. GA retinas imaged with the ELM uppermost present a large subretinal GFAP/vimentin double-positive membrane-like structure (E–P). Arrowheads indicate the atrophic areas. (A–D) Control, (E–H) GA1, (I–L) GA2, and (M–P) GA3. Scale bars: 1 mm.
Retinal Glia
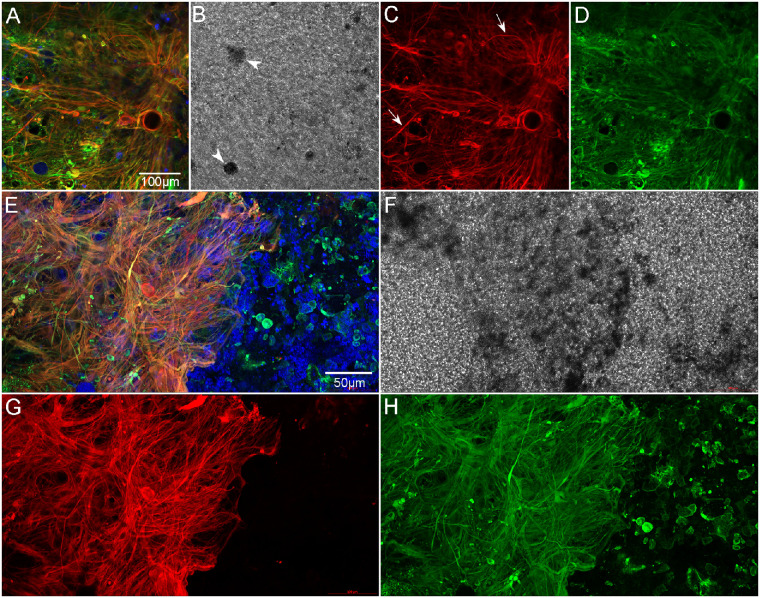
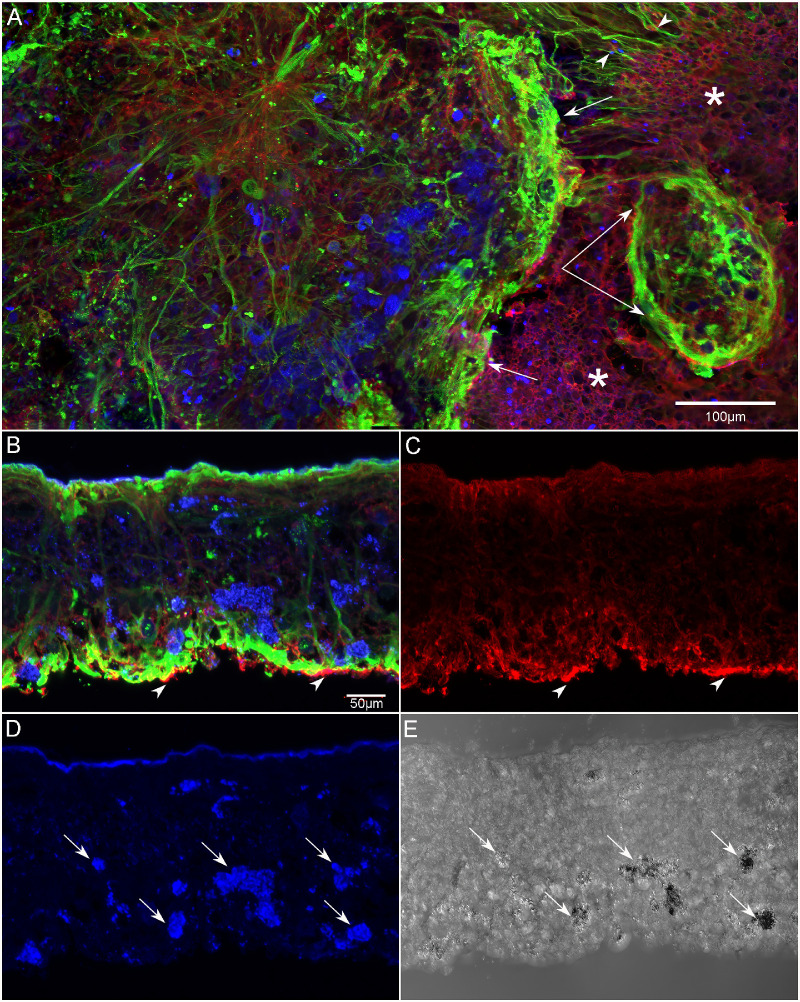
Retinas were also imaged en face with the ELM or subretinal surface closest to the objective. While the control posterior poles imaged with the ELM uppermost were nondescript at low magnification (Figs. 10B–D), all three GA eyes had large areas with glial fibrillary acidic protein (GFAP) and vimentin-positive glial processes covering the subretinal surface (Figs. 10F–H, J–L, N–P). The area of the subretinal glia closely matched the area of RPE atrophy in all three GA eyes. Moreover, this area coincided with reduced retinal vascular density (Figs. 10E, 10I, 10M). Imaging of GA retinas at higher magnification better demonstrated the complexity of these glial structures. These dense, multilayered membranes were composed primarily of GFAP and vimentin double-positive Müller cell processes. There were isolated cell processes that expressed only GFAP, suggesting they were astrocytes (Figs. 11A–D). Differential interference contrast (DIC) imaging revealed pigmented cells among the glial processes in the subretinal focal plane (Fig. 11B). At the border, glial processes extended from the membrane toward the RPE cells that had remained with the retina during the dissection (Figs. 11E–H). DIC imaging and UEA lectin staining both revealed numerous pigmented cells at the edge of and adjacent to the glial membrane (Fig. 11F). Some of these pigmented cells outside the atrophy were also positive for vimentin. In a region of superior retina, stained with CD44 and vimentin, the glial membrane had a succinctly well-defined border bounded by CD44-positive processes (Fig. 12A). The CD44-positive ELM was observed directly adjacent to the membranous border. Within the glial membrane, the vimentin-positive processes projected from the retina and along the subretinal surface. Some of these formations resembled glial blooms observed on the vitreoretinal surface. PNA-positive, or autofluorescent, pigmented cells were observed within the glial membrane (Fig. 12A). Müller cell processes did extend beyond this CD44-positive border, making contact with neighboring cells (Fig. 12A). Müller cell processes from the nonatrophic area also extended toward the subretinal membrane, disrupting the ELM organization. In addition, an unusual vimentin-positive structure was observed outside that atrophic area. This structure appeared to be composed of glial processes encircling a deposit or debris. CD44 staining was also observed in this structure but was not as intense as that in the atrophic area or at the ELM (Fig. 12A).
Figure 11.
Retina imaged with ELM uppermost, high magnification. Retina of GA2 shown here is representative of all three GA eyes. The retina is stained with GFAP (red), vimentin (green), and UEA lectin (blue). The center of the subretinal glial membrane is composed of glial cells positive for GFAP (red) and vimentin (green) (A–D). A few cell processes that only express GFAP are also observed (arrows). DIC imaging demonstrates pigmented cells (arrowheads in B). At the membrane's border (E–H), glial processes are very disorganized and intertwined, with some extending toward vimentin-positive cells outside the atrophic area. A band of UEA lectin-positive (or autofluorescent) pigmented cells is observed within the glial membrane at the border (E, F). Scale bars: 100 µm (A–D) and 50 µm (E–H).
Figure 12.
Subretinal glial membrane at the border of geographic atrophy (patient GA2). The area of atrophy extended into the superior retina in GA2. Retinas were stained with CD44 (red), vimentin (green), and PNA (blue). A glial membrane creates a dense band at the border of RPE atrophy (arrows) and is positive for vimentin and CD44 (A). Blue cells within the membrane appear, based on their pigmentation, to be migrating RPE cells that are either binding PNA or autofluorescing at the 488 wavelength. Outside the glial membrane, the area marked by asterisks, the CD44-positive ELM has a normal staining pattern, and PNA-positive outer segments were observed (blue dots). At the top right, the Müller cell processes extend linearly within the nonatrophic area toward the glial membrane, disrupting the appearance of the ELM (arrowheads). Below this, a smaller, oval-shaped structure created by glial cell processes is also visible (paired arrow). These structures were observed in all three GA donors just outside the atrophic area. After imaging in the flat-mount, a portion of the superior retina was cryopreserved for cross-sectional analysis (B–E). In cross section, the disorganization of Müller cell processes is clearly visible, as is the subretinal glial structure, which is positive for both CD44 and vimentin (arrowheads in B, C). CD44 staining was observed throughout Müller cell processes in the atrophic areas of all three GA donor eyes. In addition, PNA-positive (or autofluorescent at 488 wavelength) cells (arrows in D) are observed throughout the retina (D). DIC imaging demonstrated these cells were pigmented, suggesting they are migrating RPE (E). Scale bars: 100 µm (A) and 50 µm (B–E).
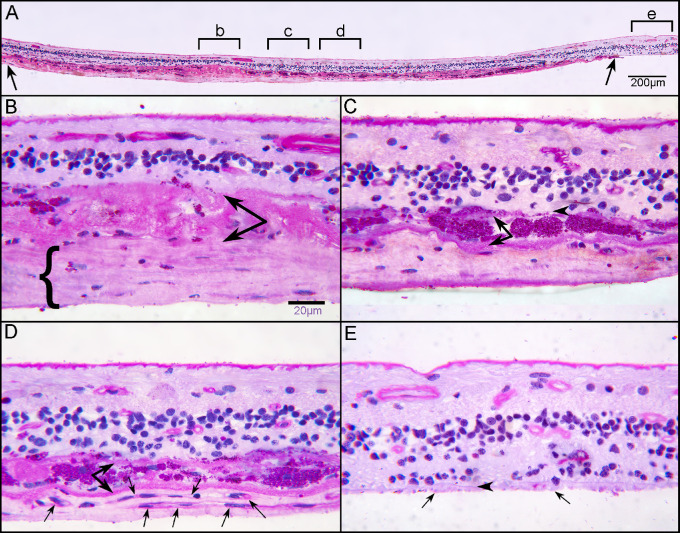
After imaging, retinas were embedded in JB-4 or cryopreserved for cross-sectional analysis. RPE migration into retina was also observed in cross sections of both the posterior pole and the superior retina (Figs. 12B–D). The glial membranes on the subretinal surface were confirmed in cross sections (Figs. 12B–D). JB-4 sections stained with periodic acid–Schiff (PAS) and hematoxylin demonstrated a subretinal gliovascular membrane in the posterior pole of GA2 (Fig. 13A). While an apparent neovascular network was observed in the retinal flat-mount associated with the subretinal glial processes of GA2, its precise origination was not clear. JB-4 sections revealed RPE encapsulated in a multilayered basal laminar deposit with glial cell processes and scattered blood vessels (Fig. 13). JB-4 also demonstrated the thickness of the glial membrane that occupied the subretinal space (Fig. 13).
Figure 13.
Histologic analysis of retina at posterior pole. Transverse sections of flat-mounted retina embedded in JB-4 were stained with PAS and hematoxylin (H). At low magnification, a clear subretinal structure (between arrows) can be observed in the atrophic area where the outer nuclear layer is absent (A). Higher magnification of area “b” demonstrates a thick fibrous structure (bracket) below a thick basal laminar deposit (paired arrow) (B). This fibrous membrane represents the subretinal glial membrane observed in the flat perspective (Figures 10–12). Subducted RPEs in area “c” of panel A are observed between two membranes (C). In area “d” of panel A, neovascularization is observed with capillaries (arrows) below subducted RPE (paired arrows). Scale bars: 200 µm (A) and 20 µm (B, C).
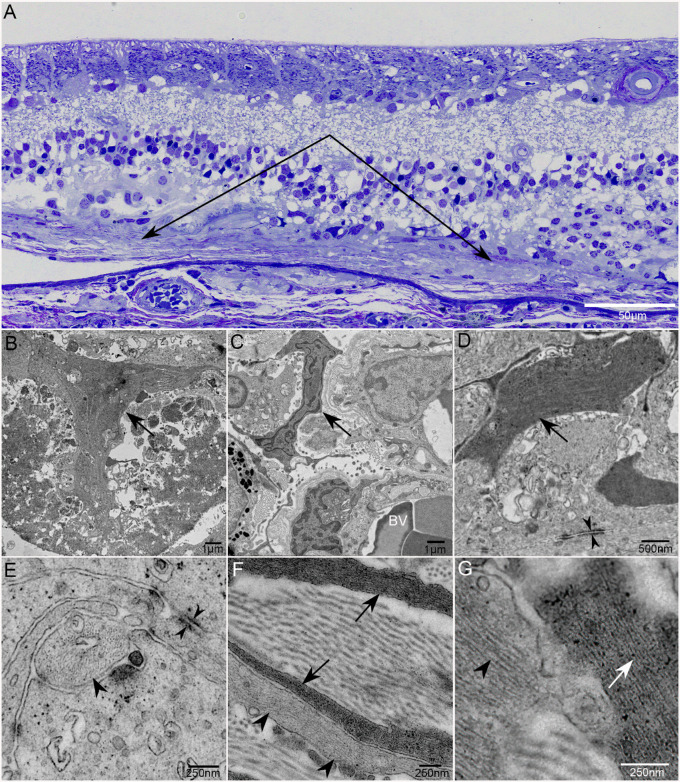
TEM analysis of GA2 and GA3 confirmed the presence of the subretinal glia (Fig. 14). In multiple areas, Müller cell processes at the level of the ELM and subretinal space created footplates similar to those observed at the ILM (Fig. 14B). Müller cell processes could be seen extending through BM and terminating near choroidal vessels (Fig. 14C). Intracellular junctions were observed between Müller cell processes in the subretinal space (Figs. 14D, 14E). In addition to processes with dark filaments, reminiscent of Müller cells, some glia with lighter filaments, reminiscent of astrocytes, were also observed in the subretinal space (Fig. 14G). Collagen could also be observed interspersed with the glial processes (Figs. 14F, 14G). A double-layered membrane was detected below some Müller cell processes above the level of BM.
Figure 14.
Transmission electron micrographs of subretinal glia. Thick section of an epoxy-embedded region of superior retina/choroid from the atrophic border of G2 demonstrates a thick subretinal membrane (A; paired arrows). At higher magnification, multiple Müller cell processes are visible. Müller cell processes also aligned to create a pattern reminiscent of endfeet (arrow) observed at the ILM (B). Müller cell processes extend into the choroid (C). Intracellular junctions are observed between Müller cell processes in the subretinal space (opposing arrowheads; D, E). Astrocyte processes, with lighter intermediate filaments (arrowheads), are also present in the subretinal structures, as are collagen bundles (F, G). Arrows indicate Müller cell processes in all images. Arrowheads indicate processes with lighter filament typical of astrocytes. BV indicates blood vessels in B. Scale bars: 50 µm (A), 1 µm (B, C), 500 µm (D), and 250 µm (E–G).
Cross-Sectional Analysis and OCT Correlation Revealed Calcified Drusen
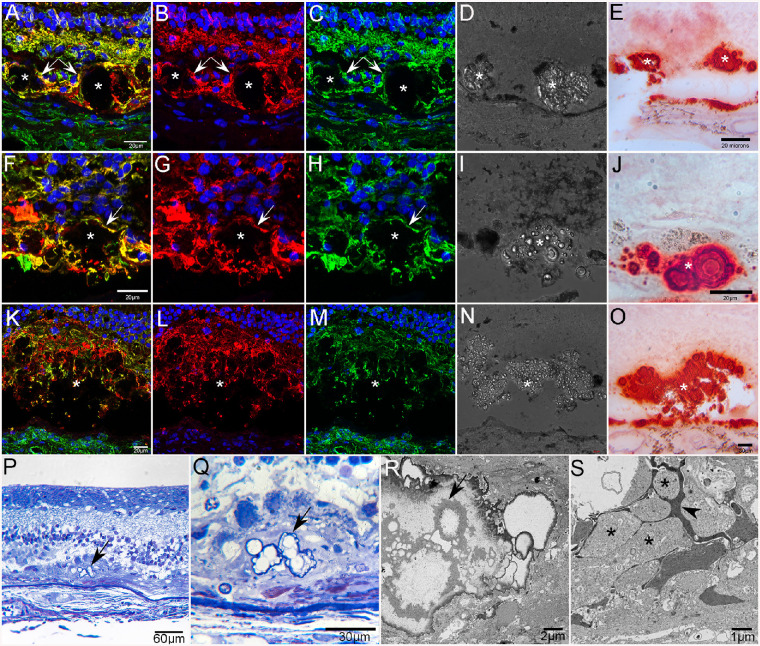
Cross sections of the posterior pole cryoblocks stained with GFAP, vimentin, and DAPI confirmed that Müller cells in the atrophic area had lost their organized, linear morphology. This analysis also demonstrated glial processes, positive for both GFAP and vimentin, surrounding and extending into deposits at a level just external to the ELM. DIC imaging revealed that these deposits had a nodular morphology and were filled with refractile spherules (Fig. 15). Review of the clinical SS-OCT images from GA2 and GA3 revealed presumed calcified drusen adjacent to the area of atrophy (Figs. 2, 3). Staining of cross sections with 1% alizarin red S, a calcium stain, confirmed the presence of alizarin red S in drusen and BM (Fig. 15). Calcium spherules ranged in size from 1.46 to 18.21 µm in diameter. Many of the larger spherules contained a series of concentric rings as recently described.19 Pretreatment of adjacent sections with 1% EDTA, a calcium chelating agent, at room temperature for 15 minutes prevented staining of calcium in drusen and BM (data not shown). Similar structures were observed in cross sections taken from retinal flat-mounts. Based on the position adjacent to atrophy, these calcified drusen appear to be the same glial-ensheathed deposits observed in the flat perspective and shown in Figure 12. Calcified drusen were confirmed in all three GA donors, primarily adjacent to atrophy.
Figure 15.
Calcified drusen in GA donor eyes. Cross sections from the posterior pole of GA2 stained with GFAP (red), vimentin (green), and DAPI (blue) reveal subretinal deposits (asterisks in A–O) ensheathed by glial processes (arrows in A–C and F–H) positive for GFAP and vimentin (A–C, F–H, K–M). DIC of these same sections shows refractive spherules within these deposits (D, I, N). Adjacent sections stained with alizarin red S demonstrate that deposits contain calcium spherules (E, J, O). Calcium is also seen in BM. Toluidene blue–stained semithin sections from GA donor 2 taken near the border of RPE atrophy showing spherical calcium particles within a subretinal deposit (arrows) at low (P) and higher (Q) magnification. Ultrathin section (R) of calcium spherules (arrow) in the subretinal deposit shown in P and Q. The deposit (S) is surrounded by Müller cell (arrowhead) and astrocyte processes (asterisks).
Discussion
This study investigated the morphometric, immunohistochemical, histologic, and ultrastructural features of the retina and choroid in three aged siblings with GA. Two of the brothers, GA2 and GA3, were followed clinically for several decades prior to death. Their most recent ophthalmologic findings provided for clinicopathologic correlates to be examined. All three brothers presented herein had a classical GA appearance with RPE, photoreceptor, and CC loss. Subretinal glial membranes were observed in all three donors, confirming earlier observations made in GA eyes.8 Correlation of histopathology with clinical images resulted in identification of previously undiagnosed CNV in GA2 and GA3. All three donors had what appeared to be calcified drusen just outside the atrophic areas.
Choroidal Degeneration in GA
The OCT images from 2016 (GA2 and GA3) show a choroidal thickness that appears reduced, consistent with previously documented choroidal thinning in eyes with GA.7 However, choroidal thickness measurements from the preserved specimens would be unreliable due to varied postmortem times, fixation, and further tissue processing. Histopathologic results from this study confirm previous reports of choroidal vascular degeneration in regions of RPE atrophy in eyes with GA.4,5,7 All three siblings in this study had severe CC attenuation in the submacular region compared to aged controls. In paramacular regions with intact RPE, there was no significant difference in the % VA between GA and aged control groups. Despite longstanding atrophy (clinically documented over 20 years earlier), there were still some scattered surviving capillaries in the submacular regions with RPE atrophy in all eyes with GA. However, these surviving capillaries were extremely constricted compared to capillaries in both the aged control group and in nonatrophic areas of the GA group (42% decrease in luminal diameters). This finding suggests that these vessels would not be functioning normally. In fact, we have reported that CC remaining in GA eyes has reduced fenestrations.4 Fenestrations are unique pore-like structures that have a diaphragm, which allows passive transit of some fluids and macromolecules. These fenestrations are critical to providing the outer retina, including RPE, with nutrients and oxygen while also transporting and clearing RPE waste to the choroidal circulation.20 In regions where RPE were present, fewer fenestrations per capillary were observed compared with aged control CC. In border regions, fenestrations were even more reduced, with few, if any, remaining in regions of complete RPE atrophy. Therefore, although CC was viable in regions with nonatrophic RPE, normal endothelial transport to and from the outer retina via fenestrations was likely affected.4 In addition to loss of fenestrations, we have reported alterations to other CC endothelial cell transport systems in GA eyes.6 The reduced functionality of CC endothelial cells at the border of atrophy and beyond could further exacerbate RPE degeneration.
At the same time, however, the choroidal vessels are dependent on vascular endothelial growth factor (VEGF) derived by RPE cells, which stimulates the formation of fenestrations and acts as a potent vasodilator and endothelial cell survival factor. Therefore, the loss of RPE in GA likely leads to choroidal capillaries either constricting and losing fenestrations or degenerating.21 This idea is supported by experimental animal studies demonstrating that destruction of RPE by sodium iodate or mechanical debridement leads to CC atrophy.22,23 The unique symbiotic relationship between RPE and CC is an important factor when considering stem cell replacement therapy as a treatment. In a recent article by Iyer et al.,24 the choriocapillaris associated with an RPE tear was found to persist for up to 16 months after the overlying RPE was removed with evidence of some reproliferation of nonpigmented RPE. However, the CC associated with the denuded RPE would be unlikely to maintain its fenestrations.
CNV in Eyes With GA
Interestingly, the two siblings who were followed clinically in this study were found to have CNV in postmortem analysis. Review of their final clinical images revealed that the CNV, although present at the time, initially eluded detection. Based on the clinical and histopathologic data, this CNV was nonexudative because no subretinal or intraretinal fluid was observed. Given that 2 to 3 years elapsed between clinical imaging and histopathology, it is reasonable to assume that the nonexudative CNV observed in these donors at the time of imaging and subsequent death had not yet progressed to symptomatic exudation. The observation of CNV that occurs in conjunction with GA may be subtle in appearance and is not uncommon.25–28 While the prevalence of this combined entity is more often reported in histologic studies than in clinical studies, improved OCTA technology is leading to increased diagnosis of nonexudative CNV associated in eyes with GA.27,29–31 We have previously found CNV in a small percentage of eyes with GA as well as in eyes with intermediate and early AMD,5,32 as shown in SS-OCTA reports.31,33 The lesions in the present study were observed at the atrophic border outside of macula as well as in the submacular region, as reported by Trivizki et al.33 In areas outside of macula, the CNV at the border regions of atrophy arises where some surviving RPE still existed, possibly creating a proangiogenic hypoxic milieu and providing a stimulus for vessel growth. Another possible source of VEGF in GA eyes, particularly in atrophic areas and at the edge of atrophy, are glial cells in the subretinal space. Both Müller cells and astrocytes express VEGF, and expression can be increased when these cells are activated. In fact, VEGF has been observed in subretinal glial cells in eyes with GA, with expression particularly high at the border of subretinal glial membranes in GA eyes (Edwards MM, unpublished data, 2021).
Although it is common to think of CNV as damaging, there is evidence suggesting that nonexudative CNV in GA could be a compensatory mechanism to recapitulate the native CC and prevent the formation of atrophy.30,34 Further supporting the potential beneficial side of nonexudative CNV is histologic evidence that it contains fenestrations and caveolae, similar to that seen in CC endothelial cells.30,34 In fact, fenestrations were observed in the endothelium of the CNV reported herein. Therefore, these nonexudative vessels could indicate that CC remodeling is a mechanism to compensate for CC loss.30,35,36 At the same time, however, one must remember that the RPE create the outer blood–retinal barrier. Therefore, in areas without RPE, vessels with fenestrations could enhance movement of fluid and macromolecules into the subretinal space. Perhaps in these areas, Müller cells in the subretinal space help create the outer blood–retinal barrier. Further research is required to fully understand the consequences of this CNV and to identify ways of determining when nonexudative CNV will transition to exudation.
Retinal Vascular Reduction in Eyes With GA
A significant reduction in retinal vascular density was observed in the atrophic region in all three GA eyes presented herein. The reduced vascular density supports a recent spectral domain OCTA study that demonstrated reduced vascular density in all three vascular layers in the atrophic region in patients with GA.37 These authors concluded that vessel density may be more sensitive than retinal layer thickness measurement in the detection of inner retinal change in eyes with GA. Although not quantified individually in the present study, all three vascular plexi appeared to be affected. The reduced vascular density in outer retina is not surprising given the degeneration of photoreceptors and first-order neurons in retina overlying GA.
Retinal Glial Changes in Eyes With GA
The present study demonstrated significant glial remodeling with both astrocytes and Müller cell processes extending into the subretinal space. Within the retina of all three GA eyes, Müller cells in the atrophic region had lost their linear structure, indicating their remodeling. At the border of atrophy, Müller cells remained linear but did express GFAP, indicating their presumed activation. The observation of footplate-like structures, normally created by Müller cells at the ILM, within the subretinal space indicates that these glial cells may have altered polarity as well. Although not previously observed in AMD, loss of Müller cell polarity has been reported in choroideremia.38 Additional studies are under way to better understand the potential shift in Müller cell polarity. Since Müller cells express proteins at different locations along their distal processes, a shift in polarity could have detrimental consequences for retinal neurons and possibly blood vessels.
The amount of preretinal glia varied between these siblings and did not correlate with the degree of RPE atrophy. Therefore, this appears to be idiopathic and not related to GA. By contrast, the subretinal glial membrane observed herein was confined to the area of RPE, CC, and photoreceptor loss. This membrane was similar to those previously reported in eyes with GA.8,10 Similar glial membranes were also recently reported in human donor eyes with Stargardt disease and choroideremia.39,40 Glial “seals” or scars have also been observed in animal models of retinal degeneration and human donor eyes with retinitis pigmentosa.41 Although these glial “seals” were first reported decades ago, the consequences of these structures are poorly understood. The term glial “seal” gives the impression that these structures are simply a thin layer of glial cell processes creating a seal to protect the retina from the subretinal space. While cross-sectional analysis supports this idea of a simple glial seal, the flat-mount analysis and TEM presented herein and previously published demonstrate a much more complex structure.8,10 Confocal images of flat-mounts demonstrated that Müller cell processes, GFAP and vimentin double positive, as well as the occasional astrocyte, positive for only GFAP, created a complex, multilayered structure. The presence of both Müller cells and astrocytes was confirmed with TEM analysis. Cells with a myofibroblast morphology were also observed with TEM (data not shown). It is possible that Müller cells undergo glial mesenchymal transition. TEM analysis also demonstrated intracellular junctions between these glial cells and identified a collagen component. This observation demonstrates that Müller cell and astrocyte processes are creating a true membrane in the subretinal space. Such a membrane could protect the retina from inflammatory factors in the subretinal space but at the same time create a barrier for treatments, including stem cell–derived therapy.
In some areas along the atrophic border, glial processes created a thick band separating the membrane from the nonatrophic area. This band was also positive for CD44, a protein expressed primarily by Müller cells at the ELM. In other areas, however, the Müller cell processes extended beyond the membrane and contacted RPE cells that were subretinal but remained with the retina during the dissection. Müller cell processes at the atrophic border with processes contacting the RPE are highly significant since this is the site of GA progression. Müller cells, particularly when activated, release proinflammatory cytokines and could, therefore, contribute to the inflammatory environment in AMD.42
RPE Anterior Migration in Eyes With GA
Müller cells could also act as a scaffold for RPE migration into the retina, which has been shown to occur in AMD.43 In fact, intraretinal RPE migration was noted in all three GA donors reported herein. This migration was demonstrated by immunohistochemistry and PAS and hematoxylin staining at the border and in nonatrophic areas, extending all the way through the retina. It has been suggested that RPEs leave their monolayer, particularly when over drusen, and migrate into retina due to their separation from the CC.43 It has also been suggested that RPE at the border of AMD undergo epithelial–mesenchymal transition (EMT).44,45 This idea is supported by our observation that migrated RPE in the border region expressed vimentin. In addition to vimentin, a known marker for EMT, many of these RPE also expressed PNA, another marker associated with EMT. However, one must consider that the PNA staining could also be autofluorescence caused by lipofuscin. Further analysis is under way to determine whether these cells are in fact undergoing EMT.
Calcified Drusen in Eyes With GA
In addition to the glial cells observed in the subretinal space anterior to RPE atrophy, smaller glial projections were noted. These were primarily observed adjacent to atrophy, but isolated projections were observed even toward the peripheral retina. In these areas, glial cells appeared to be ensheathing debris or deposits. Cross sections and comparison with clinical OCT images demonstrated the presence of calcified drusen ensheathed by glial cell processes. Ultrastructural analysis confirmed that glial processes were intertwined in these calcified nodular drusen. Interestingly, it has been speculated that Müller cells phagocytose drusen and may be responsible for the formation of calcified drusen.43 This is supported by evidence that Müller cells phagocytose debris in degenerating retinas.46
The present report also provides verification that what was observed clinically as suspected calcified drusen contained highly refractile spherules under DIC microscopy and were intensely stained by alizarin red S. This corroboration should give clinicians more confidence in identifying calcified drusen on OCT imaging using both B-scans and en face images. More important, as it has been suspected that calcified drusen are associated with an increased risk of developing GA,13,19 the confirmation of these calcified drusen on histopathology set the stage for further investigation on the mechanism of how these form and lead to GA.
Studying siblings provides the advantage of similar genetics and childhood, which may make their disease pathology similar. At the same time, it may help explain how potential epigenetic factors and other medical conditions influence disease presentation. The disadvantages are that similar genetics also may mean similar underlying factors, such as genetic modifiers, that could influence the progression of GA. This progression may not be typical of all patients with GA. The other disadvantage of the present study was the long postmortem time for GA3, caused by shipping delays.
Conclusions
In conclusion, this study demonstrates the importance of clinicopathologic correlations to increasing our understanding of AMD. This study confirmed previous studies showing that atrophy of CC is associated with RPE loss while also identifying isolated nonexudative CNV in eyes with GA. It also demonstrated that subretinal glial cells create a membrane with junctions and a collagen component anterior to the region of RPE atrophy and CC loss in GA. This membrane could create a barrier for treatments, including stem cell–derived therapy. This study also confirmed the presence of calcium in presumed calcified drusen seen on OCT imaging in two of the three brothers reported herein.
Acknowledgments
The authors dedicate this manuscript to their late mentor and colleague, Jerry Lutty, who designed this study, organized the clinical imaging in 2016, led the histopathologic assessment, and inspired the writing of this manuscript. They also express deep gratitude to the donors and their families for their generous gift to science.
Supported by NIH/NEI R01EY031044 (MME), R01EY016151 (MME and GL), and EY001765 (Wilmer Core Grant); BrightFocus Foundation (ME); Altsheler-Durell Foundation (GL and MME); and Foundation Fighting Blindness (unrestricted funds to Wilmer).
Disclosure: M.M. Edwards, None; D.S. McLeod, None; M. Shen, None; R. Grebe, None; J.S. Sunness, Avoro (C), Bluebird Bio (C), Starlit (C), Acuta (C), Apellis (F); I.A. Bhutto, None; E. McDonnell, None; A.M. Pado, None; G. Gregori, Carl Zeiss Meditec (F); P.J. Rosenfeld, Alexion Pharmaceuticals (F), Carl Zeiss Meditec (F), Gyroscope Therapeutics (F), Stealth BioTherapeutics (F), Valitor (F), Verana Health (F), Annexon (C), Apellis (C, F), Boehringer-Ingelheim (C), Carl Zeiss Meditec (C), Chengdu Kanghong Biotech (C), Ocunexus Therapeutics (C), Ocudyne (C, F), Regeneron Pharmaceuticals (C), Unity Biotechnology; G.A. Lutty, None
References
- 1. Fleckenstein M, Keenan TDL, Guymer RH, et al. Age-related macular degeneration. Nat Rev Dis Primers. 2021; 7: 31. [DOI] [PubMed] [Google Scholar]
- 2. Jaffe GJ, Westby K, Csaky KG, et al. C5 inhibitor avacincaptad pegol for geographic atrophy due to age-related macular degeneration: a randomized pivotal phase 2/3 trial. Ophthalmology. 2021; 128: 576–586. [DOI] [PubMed] [Google Scholar]
- 3. Liao DS, Grossi FV, El Mehdi D, et al. Complement C3 inhibitor pegcetacoplan for geographic atrophy secondary to age-related macular degeneration: a randomized phase 2 trial. Ophthalmology. 2020; 127: 186–195. [DOI] [PubMed] [Google Scholar]
- 4. McLeod DS, Grebe R, Bhutto I, Merges C, Baba T, Lutty GA. Relationship between RPE and choriocapillaris in age-related macular degeneration. Invest Ophthalmol Vis Sci. 2009; 50: 4982–4991. [DOI] [PMC free article] [PubMed] [Google Scholar]
- 5. Seddon JM, McLeod DS, Bhutto IA, et al. Histopathological insights into choroidal vascular loss in clinically documented cases of age-related macular degeneration. JAMA Ophthalmol. 2016; 134: 1272–1280. [DOI] [PMC free article] [PubMed] [Google Scholar]
- 6. Grebe R, Mughal I, Bryden W, et al. Ultrastructural analysis of submacular choriocapillaris and its transport systems in AMD and aged control eyes. Exp Eye Res. 2019; 181: 252–262. [DOI] [PubMed] [Google Scholar]
- 7. Shi Y, Zhang Q, Zhou H, et al. Correlations between choriocapillaris and choroidal measurements and the growth of geographic atrophy using swept source OCT imaging. Am J Ophthalmol. 2021; 224: 321–331. [DOI] [PMC free article] [PubMed] [Google Scholar]
- 8. Edwards MM, McLeod DS, Bhutto IA, Grebe R, Duffy M, Lutty GA. Subretinal glial membranes in eyes with geographic atrophy. Invest Ophthalmol Vis Sci. 2017; 58: 1352–1367. [DOI] [PMC free article] [PubMed] [Google Scholar]
- 9. Edwards MM, McLeod DS, Bhutto IA, Villalonga MB, Seddon JM, Lutty GA. Idiopathic preretinal glia in aging and age-related macular degeneration. Exp Eye Res. 2016; 150: 44–61. [DOI] [PMC free article] [PubMed] [Google Scholar]
- 10. Ramirez JM, Ramirez AI, Salazar JJ, de Hoz R, Trivino A. Changes of astrocytes in retinal ageing and age-related macular degeneration. Exp Eye Res. 2001; 73: 601–615. [DOI] [PubMed] [Google Scholar]
- 11. Li M, Huisingh C, Messinger J, et al. Histology of geographic atrophy secondary to age-related macular degeneration: a multilayer approach. Retina. 2018; 38: 1937–1953. [DOI] [PMC free article] [PubMed] [Google Scholar]
- 12. Laiginhas R, Shi Y, Shen M, et al. Persistent hypertransmission defects detected on en face swept source optical computed tomography images predict the formation of geographic atrophy in age-related macular degeneration. Am J Ophthalmol. 2022; 237: 58–70. [DOI] [PMC free article] [PubMed] [Google Scholar]
- 13. Liu J, Laiginhas R, Shen M, et al. Multimodal imaging and en face OCT detection of calcified drusen in eyes with age-related macular degeneration. Ophthalmol Sci. 2022; 2: 100162. [DOI] [PMC free article] [PubMed] [Google Scholar]
- 14. Bhutto IA, Baba T, Merges C, Juriasinghani V, McLeod DS, Lutty GA. C-reactive protein and complement factor H in aged human eyes and eyes with age-related macular degeneration. Br J Ophthalmol. 2011; 95: 1323–1330. [DOI] [PMC free article] [PubMed] [Google Scholar]
- 15. McLeod DS, Bhutto I, Edwards MM, Silver RE, Seddon JM, Lutty GA. Distribution and quantification of choroidal macrophages in human eyes with age-related macular degeneration. Invest Ophthalmol Vis Sci. 2016; 57: 5843–5855. [DOI] [PMC free article] [PubMed] [Google Scholar]
- 16. Schindelin J, Arganda-Carreras I, Frise E, et al. Fiji: an open-source platform for biological-image analysis. Nat Methods. 2012; 9: 676–682. [DOI] [PMC free article] [PubMed] [Google Scholar]
- 17. McLeod DS, Lutty GA, Wajer SD, Flower RW. Visualization of a developing vasculature. Microvasc Res. 1987; 33: 257–269. [DOI] [PubMed] [Google Scholar]
- 18. Spaide RF, Jaffe GJ, Sarraf D, et al. Consensus nomenclature for reporting neovascular age-related macular degeneration data: consensus on Neovascular Age-Related Macular Degeneration Nomenclature Study Group. Ophthalmology. 2020; 127: 616–636. [DOI] [PMC free article] [PubMed] [Google Scholar]
- 19. Tan ACS, Pilgrim MG, Fearn S, et al. Calcified nodules in retinal drusen are associated with disease progression in age-related macular degeneration. Sci Transl Med. 2018; 10: eaat4544. [DOI] [PMC free article] [PubMed] [Google Scholar]
- 20. Bhutto I, Lutty G. Understanding age-related macular degeneration (AMD): relationships between the photoreceptor/retinal pigment epithelium/Bruch's membrane/choriocapillaris complex. Mol Aspects Med. 2012; 33: 295–317. [DOI] [PMC free article] [PubMed] [Google Scholar]
- 21. Mullins RF, Johnson MN, Faidley EA, Skeie JM, Huang J. Choriocapillaris vascular dropout related to density of drusen in human eyes with early age-related macular degeneration. Invest Ophthalmol Vis Sci. 2011; 52: 1606–1612. [DOI] [PMC free article] [PubMed] [Google Scholar]
- 22. Bhutto IA, Ogura S, Baldeosingh R, McLeod DS, Lutty GA, Edwards MM. An acute injury model for the phenotypic characteristics of geographic atrophy. Invest Ophthalmol Vis Sci. 2018; 59: AMD143–AMD151. [DOI] [PMC free article] [PubMed] [Google Scholar]
- 23. Hayashi A, Majji AB, Fujioka S, Kim HC, Fukushima I, de Juan E Jr.. Surgically induced degeneration and regeneration of the choriocapillaris in rabbit. Graefes Arch Clin Exp Ophthalmol. 1999; 237: 668–677. [DOI] [PubMed] [Google Scholar]
- 24. Iyer PG, Chu Z, Shen M, et al. Change in choriocapillaris flow deficits within tears of the retinal pigment epithelium imaged with swept-source optical coherence tomography angiography. Retina. 2022; 42: 2031–2038. [DOI] [PubMed] [Google Scholar]
- 25. Green WR, Key SN III. Senile macular degeneration: a histopathologic study. Trans Am Ophthalmol Soc. 1977; 75: 180–254. [PMC free article] [PubMed] [Google Scholar]
- 26. Kaszubski P, Ben Ami T, Saade C, Smith RT. Geographic atrophy and choroidal neovascularization in the same eye: a review. Ophthalmic Res. 2016; 55: 185–193. [DOI] [PMC free article] [PubMed] [Google Scholar]
- 27. Shen M, Zhang Q, Yang J, et al. Swept-source OCT angiographic characteristics of treatment-naive nonexudative macular neovascularization in AMD prior to exudation. Invest Ophthalmol Vis Sci. 2021; 62: 14. [DOI] [PMC free article] [PubMed] [Google Scholar]
- 28. Sunness JS, Gonzalez-Baron J, Bressler NM, Hawkins B, Applegate CA. The development of choroidal neovascularization in eyes with the geographic atrophy form of age-related macular degeneration. Ophthalmology. 1999; 106: 910–919. [DOI] [PubMed] [Google Scholar]
- 29. Capuano V, Miere A, Querques L, et al. Treatment-naive quiescent choroidal neovascularization in geographic atrophy secondary to nonexudative age-related macular degeneration. Am J Ophthalmol. 2017; 182: 45–55. [DOI] [PubMed] [Google Scholar]
- 30. Sacconi R, Fragiotta S, Sarraf D, et al. Towards a better understanding of non-exudative choroidal and macular neovascularization. Prog Retin Eye Res. 2022;92: 101113. [DOI] [PubMed] [Google Scholar]
- 31. Yang J, Zhang Q, Motulsky EH, et al. Two-year risk of exudation in eyes with nonexudative age-related macular degeneration and subclinical neovascularization detected with swept source optical coherence tomography angiography. Am J Ophthalmol. 2019; 208: 1–11. [DOI] [PMC free article] [PubMed] [Google Scholar]
- 32. Lutty GA, McLeod DS, Bhutto IA, Edwards MM, Seddon JM. Choriocapillaris dropout in early age-related macular degeneration. Exp Eye Res. 2020; 192: 107939. [DOI] [PMC free article] [PubMed] [Google Scholar]
- 33. Trivizki O, Moult EM, Wang L, et al. Local geographic atrophy growth rates not influenced by close proximity to non-exudative type 1 macular neovascularization. Invest Ophthalmol Vis Sci. 2022; 63: 20. [DOI] [PMC free article] [PubMed] [Google Scholar]
- 34. Heiferman MJ, Fawzi AA. Progression of subclinical choroidal neovascularization in age-related macular degeneration. PLoS One. 2019; 14: e0217805. [DOI] [PMC free article] [PubMed] [Google Scholar]
- 35. Friedman E. The pathogenesis of age-related macular degeneration. Am J Ophthalmol. 2008; 146: 348–349. [DOI] [PubMed] [Google Scholar]
- 36. Li M, Dolz-Marco R, Messinger JD, et al. Clinicopathologic correlation of anti-vascular endothelial growth factor-treated type 3 neovascularization in age-related macular degeneration. Ophthalmology. 2018; 125: 276–287. [DOI] [PubMed] [Google Scholar]
- 37. You QS, Wang J, Guo Y, et al. Detection of reduced retinal vessel density in eyes with geographic atrophy secondary to age-related macular degeneration using projection-resolved optical coherence tomography angiography. Am J Ophthalmol. 2020; 209: 206–212. [DOI] [PMC free article] [PubMed] [Google Scholar]
- 38. Cameron JD, Fine BS, Shapiro I. Histopathologic observations in choroideremia with emphasis on vascular changes of the uveal tract. Ophthalmology. 1987; 94: 187–196. [DOI] [PubMed] [Google Scholar]
- 39. Edwards MM, McLeod D, Grebe R, et al. Glial remodeling and choroidal vascular pathology in eyes from two donors with choroideremia. Front Ophthalmol. 2022; 2: 994566. [DOI] [PMC free article] [PubMed] [Google Scholar]
- 40. Edwards MM, Bonilha VL, Bhutto IA, et al. Retinal glial and choroidal vascular pathology in donors clinically diagnosed with Stargardt disease. Invest Ophthalmol Vis Sci. 2020; 61: 27. [DOI] [PMC free article] [PubMed] [Google Scholar]
- 41. Jones BW, Pfeiffer RL, Ferrell WD, Watt CB, Marmor M, Marc RE. Retinal remodeling in human retinitis pigmentosa. Exp Eye Res. 2016; 150: 149–165. [DOI] [PMC free article] [PubMed] [Google Scholar]
- 42. Reichenbach A, Bringmann A. New functions of Müller cells. Glia. 2013; 61: 651–678. [DOI] [PubMed] [Google Scholar]
- 43. Curcio CA, Zanzottera EC, Ach T, Balaratnasingam C, Freund KB. Activated retinal pigment epithelium, an optical coherence tomography biomarker for progression in age-related macular degeneration. Invest Ophthalmol Vis Sci. 2017; 58: BIO211–BIO226. [DOI] [PMC free article] [PubMed] [Google Scholar]
- 44. Ghosh S, Shang P, Terasaki H, et al. A role for betaA3/A1-crystallin in type 2 EMT of RPE cells occurring in dry age-related macular degeneration. Invest Ophthalmol Vis Sci. 2018; 59: AMD104–AMD113. [DOI] [PMC free article] [PubMed] [Google Scholar]
- 45. Shu DY, Butcher E, Saint-Geniez M. EMT and EndMT: emerging roles in age-related macular degeneration. Int J Mol Sci. 2020; 21: 4271. [DOI] [PMC free article] [PubMed] [Google Scholar]
- 46. Nomura-Komoike K, Saitoh F, Fujieda H. Phosphatidylserine recognition and Rac1 activation are required for Müller glia proliferation, gliosis and phagocytosis after retinal injury. Sci Rep. 2020; 10: 1488. [DOI] [PMC free article] [PubMed] [Google Scholar]


