

Abstract
We introduce a PCR-based procedure for generating a gene disruption construct. This method depends on DNA fragment fusion by the PCR technique and requires only two steps of PCR to obtain a sufficient amount of the gene disruption construct for one transformation experiment. The first step involves three separate PCR syntheses of a selectable marker cassette and the 5′- and 3′-regions of a target gene. Of the four primers used in amplification of the 5′- and 3′-regions of the target gene, two primers placed proximal to the site of the marker cassette are designed to have sequence tags complementary to the 5′- or 3′-side of the marker cassette. The two primers used in PCR synthesis of the marker cassette are complementary to the tagged primers. By fusion PCR, the 5′ and 3′ PCR products are linked to the marker cassette via the regions of tagged primers that overlap. A sufficient amount of the disruption construct can be directly amplified with the outermost primers. This method is simple, rapid and relatively inexpensive. In addition, there is the freedom of attaching long flanking regions to any selectable marker cassette.
INTRODUCTION
Dictyostelium discoideum is a simple amoeboid eukaryote that feeds on bacteria and multiplies as single cells (1). Upon starvation, formation of a simple multicellular structure starts with chemotaxis-mediated cell aggregation and leads to two types of terminally differentiated cells: spore and stalk cells. Thus, this microorganism has led to important insights into the basic mechanisms of how higher multicellular organisms have evolved from unicellular organisms and acquired the biological systems of development and differentiation.
Due to its haploid genome, D.dicoideum has been studied using the technique of gene disruption. Through this technique, it has been possible to clarify a number of intriguing mechanisms of cellular processes, such as amoeboid cell motility (2), intracellular signal transduction (3) and development (4). Recently, the D.discoideum cDNA project (http://www.csm.biol.tsukuba.ac.jp/cDNAproject.html) and genome project (http://dictygenome.bcm.tmc.edu/) have revealed more than 5000 expressed sequence tags (5; Morio et al., in preparation; Urushihara et al., in preparation) and 8000 open reading frames. This development increases the need for rapid and efficient gene disruption strategies.
Currently, however, the conventional strategy requires complicated steps and takes from several days to several weeks depending on the success of intermediate subcloning of a target gene into a suitable plasmid and digestion with restriction enzymes to insert a selectable marker cassette. To make matters worse, it is occasionally difficult to subclone D.discoideum genome sequences, because its genomic DNA has a highly biased AT-rich content as well as repetitive sequences and is thus sometimes unstable in Escherichia coli. Moreover, the low number of restriction enzyme sites prevents researchers from designing a gene disruption construct with a flexible configuration. To overcome these issues, a method that does not require subcloning should be applied to the study of D.discoideum.
In yeast, PCR-based construction of a gene disruption construct has been established. This widely used method involves the synthesis of a marker cassette flanked by short homology regions (6). Compared with yeast, D.discoideum generally requires much longer homologous flanking sequences (usually longer than 1 kb) for successful recombination. Although PCR methods that enable the addition of long flanking homology regions to a selectable marker cassette, such as the double fusion PCR (7) and PCR ligation-mediated methods (8), have already been developed in the yeast system, these methods still require complicated procedures.
In this study we describe an improved method for fusion PCR-based construction of a gene disruption construct for D.discoideum together with its application to a test case, the disruption of pkaC, which encodes a catalytic subunit of cyclic adenosine 3′,5′-monophosphate-dependent protein kinase. This method requires only one standard PCR and one fusion PCR and can directly amplify the gene disruption construct to a sufficient amount required for transformation. Not only does the procedure described here require less time and less cost than the conventional strategy, it enables the production of massive numbers of disruptants, thus making it possible to conduct a genome-wide analysis of gene function in D.discoideum.
MATERIALS AND METHODS
Materials
Blasticidin S was purchased from Funakoshi Co. (Japan). The Expand Long Template PCR amplification kit was obtained from Roche.
Cell culture and transformation
Ax2 cells were grown at 21°C in HL5 medium with 100 µg/ml streptomycin sulfate and 100 U/ml benzylpenicillin potassium (9). When transformed cells were grown with selection, HL5 medium was supplemented with 10 µg/ml blasticidin S (10–12).
It has been reported previously that cells in the DNA synthesis phase (S phase) give a 2–3-fold higher transformation efficiency than unsynchronized cells (13). Thus, we enriched cells in S phase using temperature shift cell cycle synchronization (14). Synchronized Ax2 cells were prepared by incubation for 14 h at 9.6°C followed by incubation at 22°C for 2.5 h at a density of 1.0 × 10⁶ cells/ml. Synchronization was confirmed by monitoring cell density. Synchronized cells were centrifuged at 350 g for 3 min and resuspended in electroporation buffer (10 mM NaPO4, 50 mM sucrose, pH 6.1) at a density of 5 × 10⁷ cells/ml. The cells were then kept on ice until electroporation.
Just before electroporation, a 400 µl aliquot of the cell suspension was mixed with 10 µg amplified DNA fragment of the pkaC gene disruption construct and transferred to a 2 mm gap cuvette. Electroporation was performed with a Transfector 800 (BTX) under the following conditions: number of square pulses, 15; charging voltage, 500 V; width of pulse, 99 µs (12). After healing in 1 mM CaCl2 and 1 mM MgCl2 for 15 min at 22°C in a Petri dish, the cells were suspended in 20 ml of HL2.5 medium (7.7 g glucose, 3.57 g Difco yeast extract and 7.15 g Difco peptone, 0.485 g KH2PO4, 1.28 g Na2HPO4·12H2O, pH 6.5). A 100 µl aliquot of the electroporated cell suspension was transferred to each well of two 96-well microtiter plates.
To allow the cells to recover from the damage caused by electroporation, they were incubated at 21°C for 8 h. Then, 100 µl aliquots of HL2.5 mixed with 20 µg/ml blasticidin S were added to each well. The medium was changed for the first time after 24 h and thereafter was changed every 3 days. Clones that were alive in the selection medium were isolated between 7 and 10 days. Clonal analysis of the morphogenetic phenotype of each clone was accomplished by plating the cells on a 5LP medium plate (0.5% lactose and 0.5% Difco peptone with 1.5% agar) with Klebsiella aerogenes. The clones were then observed under a stereoscopic microscope (Olympus SZX12).
PCR reactions and primers
If not mentioned, all PCR reactions in the construction of the disruption construct were executed in 10 µl total volume with an Expand Long Template PCR amplification kit with buffer 2 and extra magnesium (5 µl of 25 mM MgCl2) following the manufacturer’s instructions. For amplification of the full-length region of pkaC, Ax2 genomic DNA was prepared according to a previously published protocol (15). We used a blasticidin S resistance gene (bsr) for the selection process because only a single copy of the bsr cassette in the genome is sufficient for efficient isolation of transformed clones (12). The pUCBsrΔBam plasmid, carrying bsr under the control of the actin 15 promoter and the actin 8 terminator, was used in amplification of the marker cassette (11). Amplification of the full-length region of pkaC and the bsr cassette were performed using 10 ng genomic DNA with 5 pmol primers 1 and 4 and 0.1 ng plasmid with 5 pmol primers 5 and 6, respectively. Each PCR reaction was performed as follows: heating to 94°C for 2 min; 30 cycles of 94°C for 30 s, 50°C for 20 s and 68°C for 2 min; followed by a final extension for 2 min.
Each PCR product was then size-fractionated on a 1% agarose gel in TAE buffer. The corresponding band was excised and then purified with Ultrafree-MC centrifugal filter units (Millipore) following the manufacturer’s protocol.
After quantification of each fragment, 1 ng of the purified full-length region of pkaC was used for amplification of 5′-pkaC or 3′-pkaC with 5 pmol of primers 1 and 2 or primers 3 and 4, respectively. The PCR conditions were as above except that the extension and final extension times were 1 instead of 2 min.
The fusion PCR reaction was performed in 10 µl total volume or 200 µl total volume (executed in four separate PCR tubes of 50 µl total volume) using 1 or 20 ng of the purified 5′-pkaC, 3′-pkaC and bsr cassette DNA fragments and 5 or 100 pmol primers 1 and 4, respectively. The fusion PCR conditions were as follows: heating to 94°C for 2 min; 30 cycles of 94°C for 30 s, 50°C for 20 s and 68°C for 4 min; followed by a final extension for 4 min.
As shown in Figure 1, the pkaC DNA (accession no. P34099) fragment was amplified with oligonucletide primers 1 (5′-CATTAAACCCAACACATTTATTG-3′) and 4 (5′-TATTTGTAGATATTGACACAAACC-3′). Verification of the amplified DNA fragment was accomplished using nested PCR with primer A (5′-CATGAGTAACTCAAATAAT-3′) and primer B (5′-CCTTGAAAAGATGTGCATATGGAT-3′), which annealed at the head and tail of the pkaC open reading frame. The 5′-region of the gene was amplified with primers 1 and 2 (5′-GTCATAGCTGTTTCCTGGTTTAAATTCTTTTAATC-3′) and the 3′-region was amplified with primer 3 (5′-TACAACGTCGTGACTGGGGTAGAGCATTTAAATTCA-3′) and primer 4. The marker cassette DNA fragment was amplified with primer 5 (5′-GATTAAAAGAATTTAAACCAGGAAACAGCTATGAC-3′, complementary to primer 2) and primer 6 (5′-TGAATTTAAATGCTCTACCCCAGTCACGACGTTGTA-3′, complementary to primer 3). Primers bsr-up (5′-CCTATATACGCTTCAATATGTAC-3′) and bsr-down (5′-GTACATATTGAAGCGTATATAGG-3′) were designed to be complementary to each other and to anneal within the bsr open reading frame 0.64 kb from the 5′-end (10). The underlined regions correspond to commercially available M13 forward or reverse sequences flanking the marker cassette in pUCBsrΔBam.
Figure 1.

Schematic illustration of PCR-based construction of the pkaC gene disruption construct. Step 1, the three primary PCR reactions. The 5′- and 3′-flanking regions are amplified with primers (primers 1–4) specific for the sequence of the target gene, pkaC of Dictyostelium discoideum. The primers distal to the selectable marker insertion site are simple primers complementary to the target gene (primers 1 and 4). The primers directly adjacent to the marker cassette are chimeric (primers 2 and 3). They contain the M13 reverse (primer 2) and forward (primer 3) sequences at their 5′-ends because bsr is cloned into the pUC118 vector (11). Primers complementary to primers 2 and 3 are used to amplify bsr (primers 5 and 6). Step 2, fusion PCR. The 5′- and 3′-flanking regions are joined to bsr and the final PCR product is amplified with the outermost primers 1 and 4. The order in which the flanking sequences are joined to the ends of the selectable marker cassette is discretionary. The final PCR reaction mix containing the PCR product is subjected to ethanol precipitation and can be directly used to transform D.discoideum cells.
RESULTS
Amplification of the 5′- and 3′-regions of pkaC and the marker cassette
The strategy for constructing a gene disruption construct requires a total of five PCR reactions (Fig. 1). First, amplification of the pkaC allele with primers 1 and 4 was performed with Ax2 genomic DNA. The size of the product observed on 1% agarose gel electrophoresis was in good agreement with the predicted size of 2.8 kb (Fig. 2A). To verify that the product encoded pkaC, we performed nested PCR with primers A and B that annealed to the head or tail regions of the pkaC open reading frame. The observed length of the nested PCR product corresponded with the predicted length of 2.0 kb (Fig. 2A, lane 2) and indicated that the product resulting from PCR using primers 1 and 4 is the pkaC gene itself.
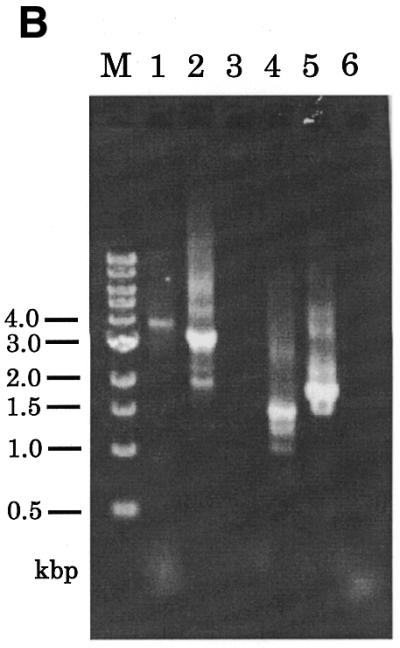
Figure 2.

Amplification of the pkaC gene and the three primary products. (A) The PCR product of the pkaC gene synthesized by genomic PCR with primers 1 and 4 is in lane 1. The nested PCR product amplified with primers A and B and the purified full-length pkaC fragment as template are in lane 2. Lane M is the molecular size marker (kb ladder). (B) The PCR products of the full-length and 5′- and 3′-regions of pkaC are in lanes 1–3, respectively. The PCR product of the bsr cassette was amplified using plasmid pUCBsrΔBam as template with primers 5 and 6 (lane 4). A fusion PCR product was produced using the 5′- and 3′-fragments and bsr fragment as template with primers 1 and 4 (lane 5).
In the next step, 1.65 kb of the 5′-region and 1.1 kb of the 3′-region of pkaC were amplified using the synthesized fragment of pkaC as template (Fig. 2B). The primers used in these amplifications fall into two classes: primers 1 and 4 are simple, while primers 2 and 3 are chimeric (see Materials and Methods).
The 1.4 kb marker cassette fragment was amplified with primers 5 and 6, which are complementary to primers 2 and 3, respectively (Fig. 2B, lane 4).
Construction of a gene disruption construct
The gene disruption construct was prepared by only one fusion PCR with the outermost primers, primers 1 and 4, and was performed using a mixture of the three PCR fragments: 5′-pkaC, 3′-pkaC and the bsr cassette. In the configuration of the gene disruption construct, the bsr cassette was designed to be in the same location and orientation as that of the pkaC gene, because its strong actin 8 terminator blocks transcriptional read-through. PCR resulted in a 4.1 kb product that agreed with the predicted size of the gene disruption construct (Fig. 2B, lane 5). An extra band was observed at ∼900 bp in the same lane. As this band was seen in several independent experiments, we suppose that the band is not due to a contaminant but is probably due to non-specific annealing of the primers. To confirm that the 4.1 kb product contained the 5′- and 3′-regions and that the marker cassette was in the order designed, as well as in the predicted orientation, we performed six sets of nested PCR with primers as illustrated in Figure 3A. The product synthesized using primers A and B was detected at 3.3 kb (Fig. 3B). The signals obtained from PCR with inverse directional primers (primers A and bsr-up, primers B and bsr-down) were of the predicted sizes, 1.9 and 1.4 kb, respectively. On the other hand, no signals were obtained when unidirectional primers were combined, primer A with primer bsr-down and primer B with primer bsr-up. These results indicate that the final PCR product obtained from fusion PCR was the expected gene disruption construct for pkaC.
Figure 3.

Verification of the constructed gene disruption construct by nested PCR. (A) Schematic drawing of the pkaC gene disruption construct and the locations of specific primers used in verification of the fusion PCR product. (B) The amplified fragment from fusion PCR (Fig. 2B, lane 5) was used as template for nested PCR reactions with the following primer combinations: lane1, primers 1 and 4; lane 2, primers A and B; lane 3, primers A and bsr-down; lane 4, primers A and bsr-up; lane 5, primers B and bsr-down; lane 6, primers B and bsr-up.
Gene replacement with the pkaC gene disruption construct
The final fusion PCR was performed on the 200 µl scale and resulted in production of ∼10 µg of the final gene disruption product (data not shown). The PCR mixture containing 10 µg product was subjected to ethanol precipitation without removing the primers and directly used for electroporation of Ax2 cells. As the mutant strain with a disrupted pkaC gene was shown to have an aggregation-negative phenotype (3), the phenotype of the isolated stable transformants was assessed to be either aggregation-positive or aggregation-negative (Table 1). We obtained 40 independent clones, on average, from three independent transformations and ∼90% of the clones in all the isolates were identified as aggregation-negative. Using genomic PCR with primers 1 and 6, eight randomly selected aggregation-negative and one aggregation-positive clones were tested to see if the pkaC gene was effectively disrupted (Fig. 4). In all of the eight aggregation-negative clones there was only one product detected and it corresponded to the expected size of the disrupted gene allele. The PCR product from the single aggregation-positive phenotype clone resulted in two products corresponding to both the intact and the disruption construct gene alleles. These results indicate that all the aggregation-negative clones have an effectively disrupted pkaC gene and the non-specifically amplified 900 bp product in lane 5 of Figure 2B is not detrimental to generation of the gene disruptants.
Table 1. Homologous recombination efficiency.
| Experiment | Total no. of transformants | Total no. of aggregation-negative transformants | Relative no. of aggregation-negative transformants (%) |
|---|---|---|---|
| 1 | 39 | 33 | 85 |
| 2 | 40 | 37 | 93 |
| 3 | 42 | 40 | 95 |
| Average | 40 ± 1 | 37 ± 3 | 91 ± 4 |
The results are shown as means ± SD of the three independent experiments.
Figure 4.
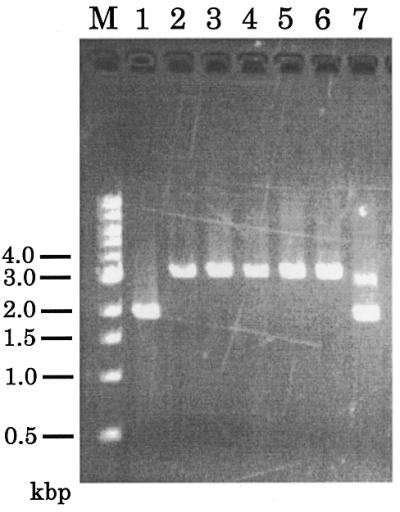
Genomic PCR of the transformants. Genomic PCR was performed on wild-type strain Ax2 (lane 1), five aggregation-negative transformants (lanes 2–6) and one aggregation-positive transformant (lane 7) using primers A and B. The 3.6 kb band corresponds to the gene disrupted allele and the 2.0 kb band corresponds to the intact pkaC gene.
DISCUSSION
In this report we have introduced a simple PCR method for the generation of a gene disruption construct in D.discoideum. This method requires only one standard PCR and one fusion PCR and is faster and more versatile than conventional methods that depend on DNA ligase and plasmid vectors. This method also allows researchers to design the exact configuration of the length and sequence of the homologous regions flanking a selectable marker cassette by choosing the primer binding sites at the target locus. Furthermore, we have shown that two-step PCR can produce a sufficient amount of disruption construct for effective transformation.
In combination with the technique of cell cycle synchronization, we obtained a very high homologous recombination efficiency of ∼90%. This efficiency is much higher than the previous 10–50% obtained using the auxotrophic selectable marker thy1 in strains HPS400 and JH010, requiring thymidine for growth (3). It is known, however, that different gene disruption constructs result in different frequencies of homologous recombination efficiency, ranging from 0.9 to 0.01. We are now investigating these frequencies with several known and unknown genes of D.discoideum.
There are several important technical points that should be taken into consideration. First, all primers should be designed to have almost the same Tm value, which is crucial for annealing and amplification of the final PCR product in fusion PCR. Secondly, a high fidelity DNA polymerase should be used to ensure that the selectable marker gene product will function properly in vivo. Thirdly, purification of the three PCR products should be done without any contamination of the primers, as contaminated, tagged primers inhibit the precision of the fusion process.
Further improvements to this method are possible. We designed the primers for amplification of the selectable marker cassette to be chimeric and 35 or 36 nt long, so as to have sufficiently long sequences in the annealing step of fusion PCR. However, even when the M13 reverse and forward sequence primers were used directly, the gene disruption construct was successfully obtained (data not shown). This indicates that a length of 17 or 18 nt is sufficient for a proper fusion reaction. Therefore, only four specific primers for amplification of the 5′- and 3′-regions of a target gene need to be prepared for construction of a particular gene disruption construct. Also, although we amplified the 5′- and 3′-fragments using amplified pkaC as the template, it would be possible to amplify these fragments directly using genomic DNA (data not shown). Finally, nested PCR of the fusion PCR product is sufficient to confirm that the construct is as designed.
In summary, this is the first report of a method for all-PCR-based construction of a transformation construct in D.discoideum. Since this advanced method is easy, rapid and efficient, in addition to being applicable to any D.discoideum genes in principle, even AT-rich genomic sequences, it should be possible to efficiently generate large-scale gene disrupted strains. A genome-wide analysis of gene function using the artificial targeted gene disruptants will provide an unprecedented opportunity to advance our understanding of the genes required in the building of a multicellular structure.
Acknowledgments
ACKNOWLEDGEMENTS
We deeply thank Prof. William Loomis (University of California, San Diego) for his critical reading of the manuscript and his relevant comments. This work was partly supported by the Japan Society for the Promotion of Science JSPS-RFTF (no. 00L01412) and a Grant-in-Aid for Scientific Research on Priority Areas C (no. 12206001).
REFERENCES
- 1.Kessin R. (2001) Dictyostelium; Evolution, Cell Biology and the Development of Multicellularity. Cambridge University Press, Cambridge, UK.
- 2.De Lozanne A. and Spudich,J.A. (1987) Disruption of the Dictyostelium myosin heavy chain gene by homologous recombination. Science, 236, 1086–1091. [DOI] [PubMed] [Google Scholar]
- 3.Mann S.K. and Firtel,R.A. (1991) A developmentally regulated, putative serine/threonine protein kinase is essential for development in Dictyostelium. Mech. Dev., 35, 89–101. [DOI] [PubMed] [Google Scholar]
- 4.Harwood A., Plyte,S.E., Woodgett,J., Strutt,H. and Kay,R.R. (1995) Glycogen synthetase kinase 3 regulates cell fate in Dictyostelium. Cell, 80, 139–148. [DOI] [PubMed] [Google Scholar]
- 5.Morio T., Urushihara,H., Saito,T., Ugawa,Y., Mizuno,H., Yoshida,M., Yoshino,R., Mitra,B.N., Pi,M., Sato,T., Takemoto,K., Yasukawa,H., Williams,J., Maeda,M., Takeuchi,I., Ochiai,H. and Tanaka,Y. (1998) The Dictyostelium developmental cDNA project: generation and analysis of expressed sequence tags from the first-finger stage of development. DNA Res., 31, 335–340. [DOI] [PubMed] [Google Scholar]
- 6.Baudin A., Ozier-Kalogeropoulos,O., Denouel,A., Lacroute,F. and Cullin,C. (1993) A simple and efficient method for direct gene deletion in Saccharomyces cerevisiae. Nucleic Acids Res., 21, 3329–3330. [DOI] [PMC free article] [PubMed] [Google Scholar]
- 7.Amberg D.C., Botstein,D. and Beasley,E.M. (1995) Precise gene disruption in Saccharomyces cerevisiae by double fusion polymerase chain reaction. Yeast, 11, 1275–1280. [DOI] [PubMed] [Google Scholar]
- 8.Nikawa J. and Kawabata,M. (1998) PCR- and ligation-mediated synthesis of marker cassettes with long flanking homology regions for gene disruption in Saccharomyces cerevisiae. Nucleic Acids Res., 26, 860–861. [DOI] [PMC free article] [PubMed] [Google Scholar]
- 9.Watts D.J. and Ashworth,J.M. (1970) Growth of myxamoebae of the cellular slime mold Dictyostelium discoideum in axenic culture. Biochem. J., 119, 171–174. [DOI] [PMC free article] [PubMed] [Google Scholar]
- 10.Sutoh K. (1993) A transformation vector for Dictyostelium discoideum with a new selectable marker bsr. Plasmid, 30, 150–154. [DOI] [PubMed] [Google Scholar]
- 11.Adachi H., Hasebe,T., Yoshinaga,K., Ohta,T. and Sutoh,K. (1994) Isolation of Dictyostelium discoideum cytokinesis mutants by restriction enzyme-mediated integration of blasticidin S resistance marker. Biochem. Biophys. Res. Commun., 205, 1808–1814. [DOI] [PubMed] [Google Scholar]
- 12.Morio T., Adachi,H., Sutoh,K., Yanagisawa,K. and Tanaka,Y. (1995) Bsr-REMI: an improved method for gene tagging using a new vector in Dictyostelium. J. Plant Res., 108, 111–114. [Google Scholar]
- 13.Nellen W. and Saur,U. (1988) Cell-cycle dependent transformation competence in Dictyostelium discoideum. Biochem. Biophys. Res. Commun., 154, 54–59. [DOI] [PubMed] [Google Scholar]
- 14.Maeda Y. (1986) A new method for inducing synchronous growth of Dictyostelium discoideum cells using temperature shift. J. Gen. Microbiol., 132, 1189–1196. [Google Scholar]
- 15.Nellen W., Datta,S., Reymond,D., Sivertsen,A., Mann,S., Crowley,T. and Firtel,R.A. (1987) Molecular biology in Dictyostelium: tools and applications. Methods Cell Biol., 28, 67–100. [DOI] [PubMed] [Google Scholar]