

Abstract
Drawing on results from a panel of 2778 workers interviewed during and after the 68-day hard lockdown imposed in India, the following study examines the livelihood impact of the pandemic and the extent of subsequent recovery or lack thereof. Focussing specifically on workers located in the informal economy, the study is a useful addition to the burgeoning body of work on the economic impacts of Covid-19 by providing an insight into the employment and earnings recovery of those located at the margins. These findings are spliced across socio-economic groups to showcase the differential impact of the pandemic on different demographics within the informal sector. Our results show that six months after the hard lockdown, one out five persons were still out of work. Conditioned on being employed prior to the lockdown and having lost work during the lockdown, we find that urban respondents, women, workers above 60 and graduates were significantly less likely to recover from the shock. A similar exercise carried out for women workers showed that middle aged women, never married women and women who were not-literate or educated up until primary and middle school were significantly more likely to recover from job loss. Older women, those located in urban areas and Muslim women were on the other hand significantly less likely to recover from the job loss. Earnings on the whole were half of what they used to be prior to the pandemic. Some better off workers shifted to more precarious types of employment. Given the fall in earnings, poorer worker households were forced to borrow and the amount of loan taken was multiple times their average monthly income. In the context of loss in employment and reverse migration, the survey results show a substantial unmet demand for work under the MGNREGA programme even after the lockdown was lifted. We conclude that despite a partial recovery in the subsequent period, the pandemic-induced lockdown has undermined the material conditions for subsistence for a large segment within the informal economy. Moreover, any attempts made to re-imagine what a social protection programme for the informal economy should look like must take into account the segments most susceptible to an economic shock on their livelihoods.
Keywords: Informal, Pandemic, Recovery, Employment, Livelihoods
Introduction
As has been well documented, the Covid-19 pandemic has brought about severe distress to people’s lives and livelihoods across the world. Close to 255 million full-time equivalent jobs were estimated to have been lost in the first full year of the pandemic.1 The subsequent recovery has been slow, uneven and disruptive with the latest estimates from the ILO suggesting that global unemployment levels are set to remain above pre-pandemic levels until at least 2023.2
Developing countries, in addition to being low-income economies, have not been able to rely on social safety nets for recovery due to high levels of informality, and thus, the adverse effects of the pandemic have been felt even more acutely here. Estimates suggest that over 2 million workers in Asia and the Pacific have fallen below the extreme poverty line in 2020 (ILO 2022). The segments most vulnerable to the pandemic in this region have been those located in the informal economy (ILO 2021). Evidence from nine developing countries in Asia, Africa and Latin America suggests that living standards have fallen with a median income loss of 70 per cent recorded across these geographies. Between 9 and 45 per cent of people have been forced to reduce or skip meals (with a median share of 45 per cent) (Egger et al. 2021).
With respect to the Indian labour market in particular, data from CMIE-CPHS (Centre for Monitoring Indian Economy-Consumer Pyramids Household Survey) inform us that the overall work participation rate in December 2021 was still 2.5 percentage points below pre-pandemic levels.3 Average monthly per capita income4 was still around 10 per cent lower than what was recorded for February 2019. These overall numbers of impact and recovery, as a large body of literature testify, hide substantial intra and inter group variations.
The first wave of the pandemic itself exacerbated the existing inequalities both spatially and socially along the line of caste, class, and gender. According to Deshpande and Ramachandran (2020), job losses suffered by the lowest rank of scheduled castes were thrice as large as that for the upper castes. Individuals having low levels of human capital and working in precarious forms of employment faced more severe job loss and distress (ibid). Moreover, the pandemic’s impact was not gender neutral. It is well known that women’s participation in the Indian workforce has been low (Menon 2019); the pandemic widened this gap between men and women further. Though the absolute number of men who lost jobs due to the lockdown was higher than women, it was seen that women who had jobs pre-lockdown were 20 per cent less likely to have a job post-lockdown (Deshpande 2020). It was also seen that conditional on being in the workforce prior to the pandemic, women were seven times more likely to lose work during the nationwide lockdown and conditional on losing work, eleven times more likely to not return to work subsequently, compared to men (Abraham et al. 2021). In terms of its sectoral impact, industries and services sector fared relatively worse off than agriculture. The construction industry has been working at only 60 per cent capacity and not all workers could retain their jobs.5
It must be stressed over here that the socio-economic consequences of the pandemic outlined above were informed by the dynamics of capitalist development that predate Covid-19 (Pattenden et al. 2021). The pandemic struck India at a time when its economy, especially the informal sector, had suffered serious setbacks in the last quinquennium. As Harriss-White (2020) notes, the ill-conceived policy of Demonetisation in 2016 dealt a massive blow to the informal economy. That was followed by the implementation of the goods and service tax (GST) in 2017. GST resulted in perverse redistribution in favour of large firms from small firms due to delays in refunds. It also undermined the states in relation to the centre through delays in payment of GST compensation that are due to the states. Together Demonetisation and GST disrupted the informal economy resulting in loss of livelihood and income for the classes of labour. For a segment reeling from the impacts of the aforementioned policy choices, the pandemic could not have come at a worse time.
The current study
What was the impact of the first wave of pandemic along this axis of informality-formality? Which segments amongst the informal economy were more susceptible to livelihood loss and what has been the subsequent track of recovery? These are some of the major questions that we try to address through this study. Drawing on results from a panel of 2778 workers interviewed during and after the 68-day hard lockdown imposed in India, we examine the livelihood impact of the pandemic and the extent of subsequent recovery or lack thereof. The study serves a dual purpose. First is the immediate-capturing of the employment dynamics observed within the informal sector as a result of the lockdown. The second is to use this as an entry point to examine which demographics or groups within this sector are in general more prone/vulnerable to shocks of an external nature. Given the recent debates surrounding what a social security scheme for the informal workers should look like (Shyam Sundar 2020), the findings of this study suggest that the informal economy itself cannot be seen as a monolith and special attention needs to be given to certain specific groups and occupations.
About the Survey
The Azim Premji University Covid-19 Livelihoods Phone Survey (CLIPS) was conducted in two rounds in collaboration with several civil society organisations (CSOs).6Phone-based interviews were carried out with respondents whom we contacted via the networks of these aforementioned organisations. The first round was conducted between April 13 and May 23, 2020 covering 4942 respondents across 12 states in India. The month of February 2020 was used to document the baseline estimates of the respondents, i.e., the respondent’s primary work activity status and earnings, prior to the lockdown. The first round also captured information about the work and earnings of the respondent during the period of lockdown, beginning from March 24th, till the date of the survey. The work and earnings estimates over these two periods were compared to identify the immediate impact of the lockdown on livelihoods. As expected, a massive increase in unemployment was observed alongside an equally dramatic fall in earnings. Two-thirds of the respondents had lost work. The few informal workers who were still employed during the lockdown saw their earnings drop by more than half (Kesar et al. 2021).
The second round took place between 7th October and 23rd December 2020. This was a re-visit round where we tried to reach out to the same respondents with whom we had spoken to earlier. We were able to re-interview 2778 out of the 4924 respondents. Respondents in this round were asked about their work status and earnings for the months of September, October, and November, depending upon the month when the survey took place (Fig. 1). Thus, combining the information gathered over these two rounds, we constructed a panel comprising 2778 individuals whose information was captured for roughly three different time points: (i) the month of February, (ii) the months of April and May, and (iii) the months of September, October and November (since the reference period of the second round was the last month). These three time points have been referred to as pre-lockdown, lockdown and post lockdown respectively.
Fig. 1.

Timeline of the Survey
Sampling Design
The respondents in this survey belong to communities that our partner CSOs work with, and we relied upon the phone databases provided by these organisations to contact the same. Thus, the sample frame adopted for this study is purposive and non-random in nature.
An alternative sampling strategy that could have been pursued was a random digit dialling (RDD) frame. However, given that our focus was on vulnerable communities working in the informal sector, we decided against pursuing random digit dialling as it does not offer the flexibility to focus on only one segment of the population. Additionally, we find that in developing countries the response rates of RDD’s are usually low—between 15 and 20 per cent.7Utilising the phone numbers provided by our CSOs, we managed to achieve a higher response rate of around 74 per cent.8Carrying out the survey using an RDD method would have, moreover, required a considerable expansion of time and resources. Despite the fact that using the CSOs database makes our sample non-random, we tried to ensure that our sample was both geographically and occupationally diverse. Overall, our respondents were from 131 districts covering 12 states. It must be noted that given the purposive nature of sampling adopted, the findings presented in this paper pertain only to the sample and are not representative of the larger population. Furthermore, the estimates are unweighted.
Sample Description
Table 1 presents the descriptive statistics of the panel of our 2778 respondents. Overall, the sample primarily consisted of those working in the informal economy and included occupational categories such as farmers, agricultural labourers, self-employed women, NREGA workers, construction workers, domestic help, and street vendors. Nearly 6 in 10 persons interviewed by us were women workers. Forty per cent of the sample resided in urban areas. The average age was around 39 years. Scheduled caste and scheduled tribe workers together formed more than half of the sample. 84 per cent of our sample identified themselves as Hindus. Half of our respondents worked as casual wage workers while self-employed (excluding unpaid labour) constituted a further quarter of the sample. The share of regular wage workers was around 19 per cent. The majority hailed from low income households whose average monthly household income in February 2020 was around ₹10,100.9 To put this into context, the average monthly household income as reported by respondents of nationally representative surveys such as the CMIE for the same time period is around ₹20,600.
Table 1.
Sample Demographics
| APU livelihoods survey (Round 2) | |
|---|---|
| Number of respondents (N) | 2778 |
| Female workers (%) | 58 |
| Urban workers (%) | 40 |
| Social group of workers (%) | (n = 2432) |
| Scheduled castes | 29 |
| Scheduled tribes | 23 |
| Other backward class | 31 |
| General | 16 |
| Religion of workers (%) | (n = 2576) |
| Hindu | 84 |
| Muslim | 8 |
| Others | 8 |
| Average age (in years) | 39 |
| Employment type (%) | (n= 2600) |
| Self-employed (excluding unpaid) | 25 |
| Regular wage worker | 19 |
| Casual wage worker | 50 |
| Unpaid workers | 5 |
| Educational status of workers (%) | (n = 2598) |
| Not literate | 36 |
| Literate up to primary | 16 |
| Middle | 16 |
| Secondary | 18 |
| Senior secondary | 7 |
| Diploma/Graduate and above | 7 |
| Mean monthly HH income (February) | ₹10,102 |
Source: Azim Premji University CLIPS (Round 2)
Contributions: Understanding the Impact of the Pandemic on the Informal Workforce
Despite there being a plethora of works highlighting the impact of the pandemic on India’s labour markets, we believe the following work makes a unique contribution to the overall literature on account of the specific nature of the sample that we have captured in our phone survey. For one, as we have already highlighted above, this is one of the few studies that uses a panel dataset of individuals dependent upon the informal economy. Studies based on nationally representative surveys such as the Periodic Labour Force Survey (PLFS) and CMIE, while crucial in understanding the macro picture when it comes to employment dynamics during the pandemic, also include relatively well off segments in their sample. We, on the other hand, capture those relegated to the margins.
To get a better sense of who these marginalised workers are, we use data from the 2018–2019 PLFS to provide some characteristic features about the same. Approached from the employment side, the unorganised sector10 which harbours approximately 379 million workers constitutes an overwhelmingly large segment of the Indian economy (Table 7 in the Appendix). More than 8 out of 10 workers belong to the same with the agrarian workforce almost entirely located here. Even the major non-agrarian sectors such as construction, manufacturing and services see the bulk of their workers engaged in the unorganised sector (Fig. 8 in the Appendix). The organised sector also harbours its fair share of workers (around 42%) who are employed on entirely informal terms, i.e. they have no job security nor are they protected by any social security mechanism. This combined pool of unorganised sector workers and informal workers in the organised sector represent the segment of the workforce most vulnerable to shocks of this nature.
Fig. 8.
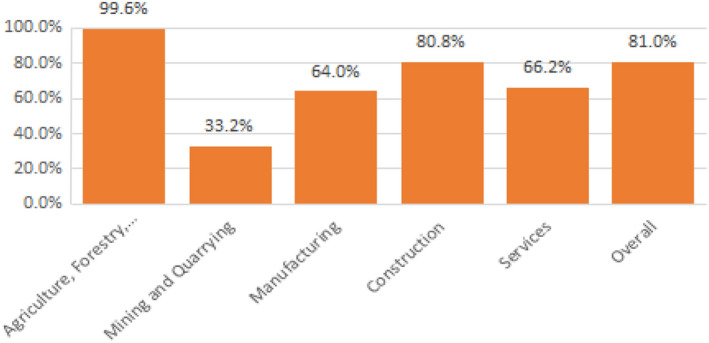
Share of Workers Engaged in the Rnorganised Sector by Industry, 2018–2019. Source: Author’s calculation from the unit level PLFS 2018–2019 data
Unorganised workers unsurprisingly earn much lower incomes than their organised counterparts. The earnings of a typical worker engaged in the unorganised sector of the economy is only 0.6 times that of a worker engaged in the organised sector (Table 8 in the Appendix) We also note that there is a more than proportionate concentration of unorganised sector workers in the lower earning deciles. The share of unorganised workers starts decreasing as we move up the earnings strata (Fig. 9 in the Appendix).
Table 8.
Median Monthly Earnings of Organised and Unorganised Sector Workers, 2018–2019
| Organised sector | Unorganised sector | |
|---|---|---|
| Self-employed workers | 22,000 | 8000 |
| Regular wage workers | 15,000 | 8000 |
| Casual wage workers | 6000 | 5600 |
| All worker categories | 12,000 | 7200 |
Source: Author’s calculation from the unit level PLFS 2018–2019 data
Fig. 9.

Representation Index of Unorganised Workers by Earning Decile, 2018–2019.. Source: Author’s calculation from the unit level PLFS 2018–2019 data
The bulk of workers in the unorganised sector carry on with a hand to mouth existence where their default tendency is to remain engaged in low paying jobs throughout. Analysis of a panel of urban individuals interviewed across the four quarters of PLFS 2018–2019 survey informs us that the urban unorganised labour market is characterised by very little fluctuations in and out of the workforce. In fact, 87% of all those employed in the first quarter continue to remain employed across the next three quarters (see Fig. 10 in Appendix). A further 4.6% exit the workforce only to subsequently return back to employment. Seven out of 10 women workers remain employed throughout. The default tendency, thus of a majority of unorganised sector workers, is to continuously remain employed.
Fig. 10.

Transition Patterns of Unorganised Sector Workers (Urban) across Four Quarters, 2018–2019. Source: Author’s calculation from the unit level PLFS 2018–19 data
A second unique feature of our study is what whilst being purposive and non-representative of the region it covers, it has a much larger share of women workers in its respondent set as against nationally representative surveys such as CMIE-CPHS which suffer from a relative underestimation of women’s labour force participation owing to their restrictive definition of employment (Abraham and Shrivastava 2022). As Deshpande (2020) has highlighted, women workers on the whole were significantly more likely to be the first to be fired and the last to be hired during the pandemic. Using our set, we investigate whether this holds true for women workers in the unorganised segment as well and if so, how does it fare in comparison to the overall female workforce.
Thirdly, our study, unlike similar exercises carried out in the wake of the lockdown, incorporates an expansive definition of employment that places emphasis on a priority-cum-major time criterion rather than simply a majority time criterion in determining one’s activity status. Simply put, the status of ‘working’ is given a priority over being unemployed which in turn is prioritised over being out of the labour force. In our analysis, a person was considered employed even if they had worked for just one day during the reference period of the past one month.11 If they had not been working for even a day yet were seeking and were available for work, they were marked as unemployed. The rest were considered to be out of the labour force. Having determined the respondent’s activity status on the basis of the above, those who were employed were asked if they had engaged in multiple economic activities, and details of their ‘major’ activity status were explored in detail.12The priority-cum-major time criterion helps us in capturing a wider range of economic activities, particularly short-term, informal forms of work that people might be engaged in for only some days in a month. For example, a person working as an unpaid helper in their family business for only 4 days in the past 30 days and assisting in household chores for the rest of the time would be listed as employed by this criterion and out of the labour force by the majority criterion. It is to be noted that we also provide estimates of employment using the majority criterion approach in order to show the recovery pattern of relatively more long-term employment forms.
The PLFS 2019–2020 survey adopts the priority-cum-major time criterion to capture an individual’s Current Weekly Status (CWS) during the pandemic months.13 The survey, however, suffers from a gross underreporting of unemployment figures which is down to the manner in which it captures self-employment activities. As per the CWS approach, individuals who had work in household enterprises but did not work during the reference week due to sickness (activity status code 61) or other reasons (activity status code 62) are counted as part of the self-employed workforce. The rationale behind this is to include those people whose absence from work during the reference period may have been authorised as per the terms of their employment or may have been voluntary with no long-term impact on the continuation of their work. In normal circumstances, this appears justified and such individuals constitute a minute segment of the workforce. This share, however, shot up during the pandemic months.14There is a strong argument to be made that such individuals should not be counted in the workforce for the pandemic months as doing so understates the actual livelihood loss during the crisis. In our study, we made an attempt to avoid this underreporting scenario by removing the option of self-employed not working from our list of possible statuses and instructed our enumerators during the training process to mark all such individuals who are unable to run their enterprises as out of the workforce.15
Findings from our Survey
Employment Loss and Recovery
This section draws upon our panel data to understand the extent of employment loss during the 68 day hard lockdown and subsequent recovery. As already highlighted in an earlier section, we consider as employed all those who worked for at least one day during the reference period of the last 30 days preceding the survey. Those who were available for work yet could not find even a single day of work were considered as being unemployed. The rest were considered as being out of the labour force.
Table 2 presents the change in employment status for men and women located in rural and urban areas from pre-lockdown to lockdown, and from lockdown to post lockdown. It is to be noted that during the pre-lockdown period, 93.8 per cent of the respondents were employed, 3.6 per cent unemployed, and 2.6 per cent reported to be out of the labour force. As the survey specifically targets workers, the employment figures did not vary much for men and women living in rural and urban areas in the pre-lockdown period.
Table 2.
Change in Employment Status by Sex and Rural–Urban (in %)
| Change in employment status (%) | ||||||
|---|---|---|---|---|---|---|
| From pre-lockdown to lockdown | From lockdown to post lockdown | |||||
| Employed | Unemployed | OLF | Employed | Unemployed | OLF | |
| Rural male | −54 | 45 | 10 | 48 | −42 | −6 |
| Rural female | −54 | 50 | 4 | 45 | −48 | 4 |
| Rural person | −54 | 48 | 7 | 46 | −46 | −1 |
| Urban male | −81 | 70 | 10 | 67 | −61 | −6 |
| Urban female | −81 | 73 | 8 | 54 | −65 | 11 |
| Urban person | −81 | 72 | 9 | 59 | −63 | 5 |
| All male | −64 | 54 | 10 | 55 | −49 | −6 |
| All female | −65 | 59 | 6 | 49 | −55 | 7 |
| All person | −65 | 57 | 7 | 51 | −53 | 1 |
Source: Azim Premji University CLIPS (Round 2)
Overall, we find that employment fell by 65 percentage points during the lockdown with a proportionate increase in the share of unemployed (57 percentage points) and out of the labour force (7 percentage points). During the post lockdown period the employment situation improved but still did not reach pre-lockdown levels. The share of employed increased by 51 percentage points and the share of unemployed declined by 53 percentage points, while the share of respondents who were out of the labour force rose further by 1 percentage point.
We also note that the lockdown had a varied effect on employment across gender and location. Urban areas suffered more during the pandemic compared to rural areas. Urban employment fell by 81 percentage points during the lockdown and increased only by 59 percentage points in the post lockdown period. In comparison, rural employment witnessed a fall of 54 percentage points and a recovery of 46 percentage points. The inadequate recovery in urban employment compared to its steep fall is explained by the modest employment recovery of urban women. The share of urban women who were out of the labour force increased by 8 percentage points in the lockdown period, and it further increased by 11 percentage points in the post lockdown period. Fuelled mainly by the withdrawal of urban women from the labour force, the proportion of urban respondents who were out of the labour force increased in both periods.
Figure 2 shows the employment recovery of only those respondents who were working in the pre-lockdown period. Despite adopting a lenient definition of employment (see above), it was seen that two-thirds of the February workers lost employment during the lockdown. Six months later, one-fifth still remained out of work. Correspondingly, 14 per cent of rural workers and 27 per cent of urban workers remained out of work. If we raise the minimum day criterion to 15 days so as to capture more long-term forms of employment, then we find that one-third of the February workers were out of work post the reopening of the economy. This is a cause for serious concern given that most of our sample population survive on a daily hand-to-mouth existence.
Fig. 2.

Employment Status of the Pre-lockdown Workforce (in %). Source: Azim Premji University CLIPS (Round 2) N = 2569
The panel nature of the data allows us to track our respondents’ employment trajectories during this entire period. Based on one's employment status during and after the lockdown, an individual employed prior to the lockdown can exhibit one of four possible employment trajectories: (i) status quo—remained employed during all three periods, (ii) recovery—lost work during the lockdown, but was employed post the lockdown (iii) no recovery—lost work during lockdown, not employed post lockdown, and (iv) lagged job loss—employed during lockdown but lost employment post lockdown.
From Fig. 3, we note that only one-fourth of the February workforce did not suffer employment loss either during or post lockdown (status quo). A little more than half of the February workforce recovered from the employment loss suffered during the lockdown (recovery). 15 per cent of the February workers did not recover from the job loss suffered during the lockdown (no recovery), and 5 per cent lost employment in the post lockdown period (lagged job loss).
Fig. 3.

Employment trajectories of the pre lockdown workforce by sector and sex (%). Source: Azim Premji University CLIPS (Round 2). N = 2569
Women workers fared worse than men in terms of job loss and recovery. 25 per cent of the women workers and 28 per cent of the men workers followed the status quo trajectory. Only 53 per cent of the women recovered their lost jobs, the same figure for men was 57 per cent. A higher proportion of women workers (17 per cent) did not recover from the job loss. In comparison, 11 per cent of men followed the no recovery trajectory. Women and men suffered 5 per cent, and 4 per cent lagged job loss respectively. Men were able to cope with employment loss by changing industry of work or employment arrangements, i.e. shifting to self-employed or casual wage work. The lower recovery of women from loss in employment than men could be explained by the limited availability of such ‘fallback’ options for employment (Abraham et al. 2021). There is evidence that suggests that the returning male migrants compete for agricultural wage work in rural areas thereby limiting the options for women (Niyati 2021).
Figure 3 also presents us with the differential impact of the lockdown on rural and urban employment. While 37 per cent of the rural workers followed the status quo trajectory, only 10 per cent of the urban workers followed the same trajectory. Employment recovery was found to be higher (63 per cent) in urban areas than in rural areas (49 per cent). However, a relatively higher share of urban respondents had not yet recovered from employment loss—a clear indication that urban labour markets have been much worse hit despite a quicker bounce back. A similar proportion of rural and urban workers followed the lagged job loss trajectory. Furthermore, when we look at employment trajectories by employment type of the workers prior to the pandemic, we note that regular salaried workers fared the worst when it came to employment recovery (Fig. 4).
Fig. 4.
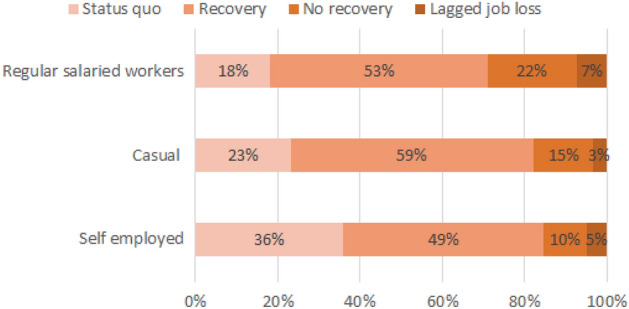
Employment Trajectories of the Pre-lockdown Workforce by Employment Type (%). Source: Azim Premji University CLIPS (Round 2)
The information provided above suggests that women workers, regular salaried workers and those situated in urban areas found it much more difficult to find lost work post the pandemic. With respect to the latter, one of the possible explanations provided is the presence of MGNREGA.16 We asked the rural based respondents about the availability of work under this programme and found that there was a substantial unmet demand for MGNREGA work which continued even after the lockdown was lifted.
Since April 2020, only 55 per cent of rural-based respondents who demanded work under the MGNREGA could get it. Figure 5 shows us the distribution of days worked by those who did manage to find MGNREGA work. It is to be noted that the reference period for this question was from the month of April onwards to the date of the interview which covered a minimum of 140 days. The median number of days worked was 25 days. 98 per cent of those who got work said they would have liked to work for more days if work had been available. Those who had not received any work but were willing to work under MGNREGA were also asked about the total number of days they were willing to work under the programme if work became available. We show a distribution of the responses of both sets of individuals in Fig. 6. This enables us to make a rough estimate of the level of unmet demand that persisted during this period. Interestingly for both sets of people, the median response was 100 days, clearly showing that the number of days on offer was not enough.
Fig. 5.
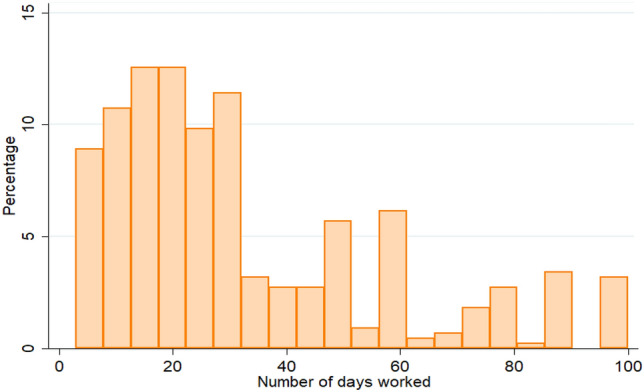
Distribution of Days Worked under MGNREGA. Source: Azim Premji University CLIPS (Round 2) N = 438
Fig. 6.

Unmet Demand under MGNREGA. Source: Azim Premji University CLIPS (Round 2)
Earnings Recovery and Rise in Precarity
In order to get a proper sense of what this employment recovery means, we examined the level of earnings that these workers were receiving compared to pre-lockdown levels along with the type of work they were doing post this ‘recovery’. The overall recovery in earnings was sought to be captured by the earnings index.17 We created these indices for two different samples. The first covers all those who had a positive income in the pre-lockdown phase irrespective of their employment status in the post lockdown period. Individuals who dropped out of the workforce or became unpaid helpers had zero earnings. The second was conditioned on February earners having positive incomes in the post lockdown period as well. Farmers were excluded from both sets.
Given that a significant share of the sample was still out of work six months after the lockdown, it was noted that earnings, on the whole, were half of what they used to be before the lockdown (Fig. 7). The situation in urban areas was worse with overall earnings being only 40 per cent of pre-lockdown levels. However, if we look at only those workers who have managed to find work in the post lockdown period (i.e. we leave out those unemployed in the post lockdown period), we find that their earnings have managed to recover to pre-lockdown levels. Moreover, as we note from Table 3, of those who found work again, the poorest earnings recovery was noted for those employed as self-employed workers in the pre-pandemic period.
Fig. 7.
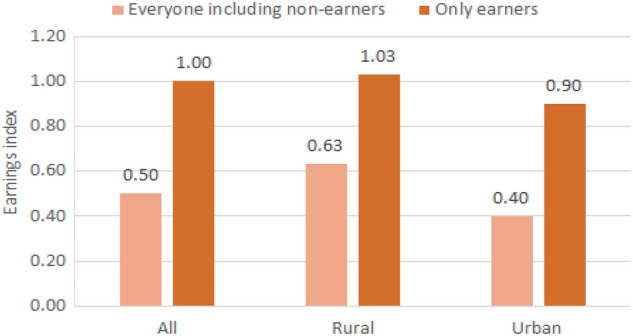
Earnings Index Post the Lockdown. Source: Azim Premji University CLIPS (Round 2) N1:1098, N2:714
Table 3.
Earnings Index by EmploymentTtype
| Earnings Index | |||
|---|---|---|---|
| Self-employed | Regular salaried | Casual workers | |
| Everyone including non-earners | 0.40 | 0.40 | 0.60 |
| Only earners | 0.60 | 0.90 | 1.10 |
Source: Azim Premji University COVID Livelihoods Survey (Round 2)
We also found that some better off workers (with regular salaries in the pre-pandemic period) had to resort to more precarious and poorly paid types of employment. 60 per cent of those employed as regular salaried workers before the lockdown shifted to self-employment and casual forms of work in the post lockdown period (Table 4). For such workers, post lockdown earnings were only 75 per cent of pre-lockdown earnings.
Table 4.
Shift in Employment Category Post the Lockdown (in %)a
| Category | Self-employed | Regular wage workers | Casual wage workers |
|---|---|---|---|
| Self-employed | 60% | 9% | 31% |
| Regular wage workers | 27% | 40% | 33% |
| Casual wage workers | 38% | 12% | 50% |
Source" Azim Premji University COVID Livelihoods Survey (Round 2)
aThe rows denote the pre=lockdown employment category of the respondents and the columns represent their employment category post the lockdown. Conditioned on being employed during both time periods. The numbers in bold provide us with the share of workers who in the post lockdown period managed to retain their pre-lockdown employment category
Increase in Debt Burden and Uncertainty of the Recovery
This overall loss in earnings (either down to job loss or shift towards more precarious forms of employment) coupled with inadequate social protection programmes and low savings meant that many of our respondents were forced to take up a loan or sell an asset to make ends meet during this crisis. 22 per cent of our respondents admitted to having sold or pawned an asset so as to cover for the financial difficulties faced by them during the lockdown (Fig. 11 in Appendix). A much larger share of our respondents (43 per cent) borrowed to cover costs during the lockdown.18 Most of these loans were acquired via informal networks with friends and relatives and local money lenders providing more than half of all loans lent out to the respondents. Worryingly, the amount of loan borrowed by these informal worker households was a higher multiple of their pre-pandemic household income with the poorest households taking the largest loans relative to their earnings (Table 5).
Fig. 11.

More than 1/5th Sold/Pawned an Asset to Cover Expenses during the Lockdown. Source: Azim Premji University CLIPS (Round 2) N rural = 1669, N urban = 1106
Table 5.
Loan Amount Taken across Income Quartiles based on February Household Income
| Overall | Bottom 25% | Second 25% | Third 25% | Top 25% | |
|---|---|---|---|---|---|
| Median household income February 2020 (₹) | 8500 | 4000 | 7000 | 10,000 | 18,000 |
| Amount of loan taken (₹) | 18,000 | 12,000 | 15,000 | 20,000 | 30,000 |
| Ratio of loan amount to household income in Februarya | 2.1 | 3.8 | 2.1 | 2 | 1.4 |
Source: Azim Premji University COVID Livelihoods Survey (Round 2)
aWe take the median of the ratios and not ratios of the medians so as to provide equal weightage to each observation. This is also the reason why the values arrived at by dividing the median value of loan taken to the median value of household income in February will not be necessarily equal to the values provided in the row titled Ratio of loan amount and household income in February
Table 5 shows the burden of debt across the income quartiles based on February household income. From the same, we note that the median February household income of the bottom quartile was ₹4000 and that of the top quartile was ₹18,000.19 The loan amount borrowed by a typical household located in the bottom quartile was ₹12,000 and that in the top quartile was ₹30,000. The poorest households (bottom quartile) had taken loans that were 3.8 times their monthly household income in February. The top quartile on the other hand had debt burdens 1.4 times their pre-pandemic incomes.
The above is of significant concern as it signals towards an increase in indebtedness of the poorest among the poor and suggests an increase in vulnerability that is likely to persist even after the employment recovery is achieved.
Employment Recovery-Regression Analysis
In this section of the paper, we carry out a multivariate logistic regression model using maximum likelihood estimation in order to understand how employment recovery varied with specific attributes of the respondents. Only those respondents who were employed in the pre-lockdown period and lost work during the lockdown period were considered for the analysis. The dv in our model takes the value of 1 if a respondent is employed in the post lockdown period and 0 if the respondent is out of work. We regressed this variable on specific attributes of the respondents, such as their per capita household income in February, age group, social group (caste), religion, gender, marital status, education, the type of employment they had in February (regular, self-employed, or casual), the sector of employment and their location (rural or urban). We used the state fixed effect to account for state level variations. The standard errors are clustered at the state level.
The estimates are presented as odds ratio in Table 6. For an independent categorical variable, if the odds ratio is above 1, then the non-base category is more likely to recover from employment loss in comparison to the base category. If the odds ratio is lesser than 1, then the non-base category is less likely to recover from the loss of employment. We find that urban workers are significantly less likely to recover from the employment loss than rural workers. During the first wave of the Covid-19 infections, the urban areas had a higher disease burden and stricter lockdowns. This along with the fact that the agriculture sector registered relatively higher growth rates than other sectors, could partly explain this result. We also find that women workers and workers above the age of 60 are significantly less likely to recover from employment loss, while workers who are not literate are significantly more likely to recover from employment loss than the workers with the education level of higher secondary and above.
Table 6.
Logistic Regression Estimates of Employment Recovery (Odds Ratio)
| Overall | Women | |
|---|---|---|
| Age (Base: 18–29) | ||
| 30–44 | 1.201 | 1.508* |
| (0.285) | (0.345) | |
| 45–59 | 0.752 | 0.790 |
| (0.162) | (0.209) | |
| 60 & above | 0.284*** | 0.312*** |
| (0.128) | (0.136) | |
| Religion (Base: Hindu) | ||
| Muslim | 0.759 | 0.448** |
| (0.301) | (0.151) | |
| Others | 1.487 | 0.821 |
| (0.826) | (0.564) | |
| Sex (Base: Male) | NA | |
| Female | 0.393*** | |
| (0.127) | ||
| Sector (Base: Rural) | ||
| Urban | 0.259** | 0.2499* |
| (0.151) | (0.187) | |
| Educational Status (Base: Higher Secondary & Above) | ||
| Secondary | 1.112 | 1.770 |
| (0.446) | (0.873) | |
| Middle | 1.143 | 2.29479** |
| (0.379) | (0.852) | |
| Primary | 1.414 | 2.13832* |
| (0.387) | (0.897) | |
| Not literate | 1.879** | 2.62166*** |
| (0.474) | (0.862) | |
| Marital Status (Base: Currently married) | ||
| Never married | 1.159 | 3.507527* |
| (0.272) | (2.678) | |
| Widowed | 1.540 | 1.748 |
| (0.619) | (0.601) | |
| Other | 5.059 | 4.361 |
| (5.060) | (4.258) | |
| State fixed effects | Yes | Yes |
| Number of observations | 1,082 | 650 |
| Log pseudolikelihood | −440.5446 | −296.73 |
We carried out a similar employment recovery regression exercise for only women workers. The results are also provided in Table 6. It was observed that women aged between 30 to 44 were significantly more likely to recover from job loss while women aged 60 & above were less likely to recover their lost employment as compared to those in the age group of 18–29. Never-married women were significantly more likely to regain lost work compared to currently married women. Furthermore, women located in urban areas and Muslim women were significantly less likely to recover from the job loss. Also, not-literate women and women educated up until primary and middle school were significantly more likely to find employment once again than women with the educational qualification of higher secondary and above.
Summary and Conclusion
The sudden announcement of lockdown exposed the informal workers to many vulnerabilities. Even before the pandemic hit, the Indian economy was in a phase of deceleration. The pandemic lockdown has brought the already slowing down economy to a screeching halt. The worst affected were those engaged in the informal economy.
Our study of 2778 informal sector workers shows that the extent of employment recovery six months after the lockdown period has been modest at best. One-fifth of the pre-lockdown workforce was not working when we interviewed them the second time. Women workers, those located in urban areas and regular salaried workers were particularly affected. There was also a huge unmet demand in rural areas for MGNREGA work signalling the livelihood crisis as a result of this shock.
Given the staggered recovery, overall earnings in the post lockdown period were half of what they used to be before the lockdown with urban earnings less than half of pre-lockdown levels. Those who managed to recover employment, however, saw their earnings reach to pre-Covid levels. Furthermore, there was a movement away from better forms of work with close to two-thirds of pre-lockdown regular salaried workers shifting to self-employment and casual work in the post lockdown period. These workers were now earning only three-fourth of their pre-lockdown incomes. Consequently, the households resorted to informal loans and distress sale of assets to tide over the crisis. Worryingly, the amount of loan borrowed by these informal worker households was a higher multiple of their pre-pandemic household income with the poorest households taking the largest loans relative to their earnings, raising concerns of a persistence of vulnerability and precarity experienced by these workers even after the employment recovery is achieved.
Our regression analysis of employment recovery conditional on job loss suggests that respondents hailing from urban centres, women respondents, and workers above the age of 60 were significantly less likely to recover from a loss in employment. The workers who are not literate were significantly more likely to achieve employment recovery than those with educational qualification of higher secondary and above. A similar exercise carried out for women workers informs us that middle aged women, never married women and women who were not-literate women or educated up until primary and middle school were significantly more likely to recover from job loss. Older women, those located in urban areas and Muslim women were on the other hand significantly less likely to recover from the job loss.20
The results of our analysis thus inform us that while it is true that the pandemic-induced lockdown has undermined the material conditions for subsistence of the vast majority of informal workers, this segment cannot be seen as a monolith. Special attention needs to be given to certain specific demographic groups and occupations which are most vulnerable to falling behind in the case of any large-scale economic shock. Such considerations need to inform both our short-term relief measures as a response to this pandemic as well as our long-term re-imagination of what a social protection programme for the informal economy should look like.
Acknowledgements
The authors would like to thank Amit Basole, Rahul Lahoti, Rosa Abraham, Shraddha Jaipal and the anonymous reviewer for their comments. Responsibility for errors lies with the authors.
Appendix
See Tables 7, 8, 9, 10, and Figs. 8, 9, 10, and 11.
Table 7.
Size of India’s Informal Workforce (in millions), 2018–2019a
| Strongly formal | Weakly formal | Informal | Total | |
|---|---|---|---|---|
| Organised | 25.6 | 25.8 | 37.7 | 89.1 |
| Unorganised | 1.0 | 3.9 | 373.6 | 378.5 |
| Overall | 26.6 | 29.7 | 411.3 | 467.6 |
Source: Author's calculation from the unit level PLFS 2018–2019 data
aWage workers who have a written contract as well as access to social security are employed in ‘Strongly Formal’ jobs. Those who have either a written contract or access to social security are employed in ‘Weakly Formal’ jobs. Lack of both is characterised as Informal employment
Table 9.
Employment Recovery
| Logistic regression | Number of obs =1082 | |||||
|---|---|---|---|---|---|---|
| Log pseudolikelihood = −440.5446 | Pseudo R2= 0.1343 (SE adjusted for 12 clusters in state ) |
|||||
| emp_binary_Octlday | Odds ratio | Robust SE | z | P >|z| | [95% Conf Interval] | |
|
logpercapita_feb agecat |
1.276385 | 0.2331763 | 1.34 | 0.182 | 0.892237 | 1.825927 |
| 30 to 44 | 1.200802 | 0.284828 | 0.77 | 0.440 | 0.7543412 | 1.911502 |
| 45 to 59 | 0.7517761 | 0.1618557 | -1.33 | 0.185 | 0.4929771 | 1.146437 |
|
60 & above social_group |
0.2838944 | 0.1276303 | -2.80 | 0.005 | 0.1176203 | 0.6852219 |
| OBC | 0.910768 | 0.406949 | -0.21 | 0.834 | 0.3793799 | 2.186459 |
| SC | 0.8777357 | 0.2810756 | -0.41 | 0.684 | 0.4685815 | 1.644154 |
|
ST religion |
1.360088 | 0.8653914 | 0.48 | 0.629 | 0.390812 | 4.733323 |
| Muslim | 0.7590161 | 0.3008869 | -0.70 | 0.487 | 0.3489958 | 1.650752 |
| Others female | 1.486671 | 0.8256106 | 0.71 | 0.475 | 0.5006187 | 4.414918 |
| Female | 0.393302 | 0.1272632 | -2.88 | 0.004 | 0.208592 | 0.7415746 |
| 2.rural_urban edu_resp | 0.258634 | 0.1508735 | -2.32 | 0.020 | 0.0824403 | 0.8113942 |
| Secondary | 1.112322 | 0.445535 | 0.27 | 0.790 | 0.5073248 | 2.438794 |
| Middle | 1.14272 | 0.3794116 | 0.40 | 0.688 | 0.5961004 | 2.190584 |
| Primary | 1.413829 | 0.3867368 | 1.27 | 0.206 | 0.8271048 | 2.416759 |
|
Not literate febemptype_broad |
1.878669 | 0.4743269 | 2.50 | 0.013 | 1.145351 | 3.081498 |
| Self-employed | 1.201644 | 0.3247532 | 0.68 | 0.497 | 0.7075097 | 2.040889 |
| Casual febv203broad | 1.064423 | 0.3436047 | 0.19 | 0.847 | 0.5653785 | 2.003961 |
| Manufacturing | 0.6739697 | 0.2976051 | -0.89 | 0.372 | 0.2836448 | 1.601422 |
| Construction | 1.037368 | 0.17605 | 0.22 | 0.829 | 0.7438354 | 1.446735 |
| Services | 0.9731962 | 0.2766206 | -0.10 | 0.924 | 0.5575136 | 1.698812 |
| Marital_status | ||||||
| Never married | 1.158747 | 0.2722144 | 0.63 | 0.531 | 0.7311778 | 1.836344 |
| Widowed | 1.540467 | 0.6191182 | 1.08 | 0.282 | 0.7007325 | 3.386513 |
| Other | 5.058603 | 5.060165 | 1.62 | 0.105 | 0.7121413 | 35.93312 |
| Month | ||||||
| 11 | 0.440375 | 0.2382799 | -1.52 | 0.130 | 0.1524934 | 1.271728 |
| 12 | 1.052274 | 0.4542958 | 0.12 | 0.906 | 0.451483 | 2.45254 |
| State | ||||||
| 2 | 7.357314 | 3.384837 | 4.34 | 0.000 | 2.986152 | 18.12703 |
| 3 | 2.088777 | 0.6725738 | 2.29 | 0.022 | 1.111246 | 3.926213 |
| 4 | 1.489815 | 0.3266233 | 1.82 | 0.069 | 0.9694315 | 2.289537 |
| 5 | 4.692299 | 2.466476 | 2.94 | 0.003 | 1.674778 | 13.14662 |
| 6 | 1.03858 | 0.3003066 | 0.13 | 0.896 | 0.5892697 | 1.830484 |
| 7 | 1.362626 | 0.630143 | 0.67 | 0.503 | 0.5504787 | 3.372972 |
| 8 | 5.109935 | 1.921949 | 4.34 | 0.000 | 2.444902 | 10.67995 |
| 9 | 3.088342 | 1.533968 | 2.27 | 0.023 | 1.16664 | 8.175492 |
| 10 | 9.029239 | 2.94638 | 6.74 | 0.000 | 4.763114 | 17.11636 |
| 11 | 2.054159 | 0.7988575 | 1.85 | 0.064 | 0.9585258 | 4.402144 |
| 12 | 6.392759 | 2.65168 | 4.47 | 0.000 | 2.835403 | 14.41325 |
| _cons | 0.9711025 | 1.416249 | -0.02 | 0.984 | 0.055703 | 16.92978 |
Table 10.
Women Employment Recovery
| Logistic regression | Number of obs = = 650 | |||||
|---|---|---|---|---|---|---|
| Log pseudolikelihood = −296.73055 | Pseudo R2 (SE adjusted for 11 clusters in state) |
|||||
| emp_binary_Octlday | Odds ratio | Robust SE | z | P >| z | | [95% Conf Interval] | |
| log_percapita_feb agecat | 1.133693 | 0.2419925 | 0.59 | 0.557 | 0.7461086 | 1.722617 |
| 30–44 | 1.507974 | 0.3454019 | 1.79 | 0.073 | 0.9625561 | 2.362446 |
| 4S–59 | 0.7904926 | 0.208847 | −0.89 | 0.374 | 0.4709899 | 1.326735 |
| 60 & above social_group | 0.3116439 | 0.1364242 | −2.66 | 0.008 | 0.1321416 | 0.7349839 |
| OBC | 1.434263 | 0.6225667 | 0.83 | 0.406 | 0.6125621 | 3.358208 |
| SC | 0.9371465 | 0.251395 | −0.24 | 0.809 | 0.5539464 | 1.585431 |
| ST | 2.113607 | 1.195974 | 1.32 | 0.186 | 0.69723 | 6.407262 |
| Religion | ||||||
| Muslim | 0.4471883 | 0.1509497 | −2.38 | 0.017 | 0.2307623 | 0.8665946 |
| Others | 0.8214306 | 0.5643715 | −0.29 | 0.775 | 0.2136707 | 3.157888 |
| 2. rural_urban | 0.249902 | 0.1869941 | −1.85 | 0.064 | 0.0576556 | 1.083173 |
| edu_resp | ||||||
| Secondary | 1.769956 | 0.8726338 | 1.16 | 0.247 | 0.6734391 | 4.651861 |
| Middle | 2.29479 | 0.8517737 | 2.24 | 0.025 | 1.108655 | 4.749956 |
| Primary | 2.138321 | 0.8967784 | 1.81 | 0.070 | 0.9399228 | 4.864672 |
| Not literate | 2.621662 | 0.8618812 | 2.93 | 0.003 | 1.376389 | 4.993584 |
| febemptype_broad | ||||||
| Self-employed | 1.192847 | 0.3301811 | 0.64 | 0.524 | 0.6933804 | 2.052098 |
| Casual febv203broad | 1.049269 | 0.3612795 | 0.14 | 0.889 | 0.5343244 | 2.060481 |
| Manufacturing | 0.8999593 | 0.5812584 | −0.16 | 0.870 | 0.253779 | 3.191464 |
| Construction | 0.7866544 | 0.197817 | −0.95 | 0.340 | 0.4805466 | 1.287753 |
| Services | 0.8018502 | 0.3367674 | −0.53 | 0.599 | 0.3520455 | 1.826365 |
| Marital_status | ||||||
| Never married | 3.507527 | 2.678416 | 1.64 | 0.100 | 0.7852484 | 15.66733 |
| Widowed | 1.747668 | 0.6006829 | 1.62 | 0.104 | 0.8910384 | 3.427847 |
| Other | 4.361454 | 4.257891 | 1.51 | 0.131 | 0.643638 | 29.55432 |
| Month | ||||||
| 11 | 0.5166563 | 0.3532957 | −0.97 | 0.334 | 0.1352508 | 1.97362 |
| 12 | 0.9878662 | 0.5015029 | −0.02 | 0.981 | 0.365237 | 2.671908 |
| State | ||||||
| 2 | 1 | (empty) | ||||
| 3 | 2.66959 | 0.995411 | 2.63 | 0.008 | 1.285454 | 5.544117 |
| 4 | 1.939714 | 0.485054 | 2.65 | 0.008 | 1.18818 | 3.1666 |
| 5 | 4.531708 | 2.110263 | 3.25 | 0.001 | 1.819224 | 11.28854 |
| 6 | 0.8370595 | 0.2882168 | −0.52 | 0.605 | 0.4262556 | 1.643776 |
| 7 | 3.14081 | 1.373262 | 2.62 | 0.009 | 1.33312 | 7.399698 |
| 8 | 6.745637 | 2.570037 | 5.01 | 0.000 | 3.196846 | 14.23391 |
| 9 | 3.681107 | 1.946376 | 2.46 | 0.014 | 1.305894 | 10.37646 |
| 10 | 6.420061 | 2.644763 | 4.51 | 0.000 | 2.863415 | 14.39442 |
| 11 | 3.734339 | 2.767069 | 1.78 | 0.075 | 0.8739581 | 15.95647 |
| 12 | 7.101886 | 3.542944 | 3.93 | 0.000 | 2.671355 | 18.8806 |
| cons | 0.4411673 | 0.7370094 | −0.49 | 0.624 | 0.0166953 | 11.65766 |
Funding
No funding was received for conducting this study.
Declaration
Conflict of interest
The authors have no conflicts of interest to declare that are relevant to the content of this article.
Footnotes
https://www.ilo.org/wcmsp5/groups/public/-dgreports/---dcomm/documents/briefingnote/wcms_767028.pdf.
Data captured till August 2021.
“Impact of COVID-19 on Livelihoods of Informal Sector Workers and Vulnerable Groups in Bengaluru: A View from the Ground.”, 2021, Azim Premji University) http://strandedworkers.in/mdocs-posts/impact-of-covid-19-on-livelihoods-of-informal-sector-workers-and-vulnerable-groups-in-bengaluru-a-view-from-the-ground/.
The collaborating civil society organisation for the first round of the survey were Aga Khan Rural Support Programme, Centre for Advocacy and Research (CFAR), Gauri Media Trust, Paschim Banga Khet Majoor Samiti, Pradan, Samalochana, Self Employed Women’s Association, Srijan and Vaagdhara. Six out of these nine organisations, namely, Centre for Advocacy and Research (CFAR), Gauri Media Trust, Paschim Banga Khet Majoor Samiti, Pradan, Samalochana and Self Employed Women’s Association helped us in carrying out the second round of the survey.
Round 2 of the survey.
Taking into account only those households reporting a monthly income of at least ₹1000 in February.
For the definition of ‘unorganised’ employed see Srivastava and Naik (2017).
As Mohanan (2021) notes, “the globally accepted criteria is that of a person having worked at least for an hour during the reference period of a week or day to be counted as a worker”. Extending on the same we decided to go for a minimum of one day in the past thirty days as our criterion.
In the second round of the survey, we also recorded information of their secondary economic activity but have not used the same in this paper.
Please note, the reference period adopted by the NSSO for CWS estimates is the last week. In our study the reference period is the last thirty days. We are not presenting numbers that reflect the current weekly status of the respondent.
As noted in the State of Working India, 2020, the share of those identifying as ‘self-employed not working’—in the urban workforce shot up by 13 percentage points between the January–March quarter of 2020 and the April–June quarter of the same year.
However, as Abraham (2020) notes, this does not mean that the problem is entirely solved. The reliance on identity based measures of employment means that there would still be a fair share of farmers and enterprise owners who still perceive themselves as being gainfully employed despite having not worked at all due to lockdown reasons during the reference period.
As per the MGNREGA MIS data, 11.19 crore individuals worked under the programme in the financial year 2020–2021. At the all India level, 52 days of employment were provided on average per household in the same period. Women person days out of total was about 53 per cent and employment provided against demand was nearly 84 per cent. Data Source: Ministry of Rural Development. http://mnregaweb4.nic.in/netnrega/all_lvl_details_dashboard_new.aspx?Fin_Year=2021-2022&Digest=B5DSyTB/eSUSkZd2BpGzbA accessed on 01 February 2022.
The earnings index was created for each individual by taking the ratio of their earnings in the post-lockdown period to their earnings in the pre-lockdown period. We then took the median value of these ratios to arrive at an earning index for a typical individual. We take the average (median) of the ratios and not ratios of the medians to provide equal weightage to each observation. We use median values instead of mean values to account for the outliers in the earnings data.
In rural areas 41 per cent of our respondents took a loan, while in urban areas 45 per cent was the share of respondents who reported having taken a loan.
We are using median and not mean figures in our income and loan analysis on account of outliers that distort the average.
The representation index in Figure 9 provides us with the share of unorganised sector workers in each earning decile divided by the overall share of unorganised sector workers. We calculate this as an index of disproportionality. An index score greater than one suggests that the decile bin in question has a disproportionately higher fraction of unorganised workers.
Publisher's Note
Springer Nature remains neutral with regard to jurisdictional claims in published maps and institutional affiliations.
Contributor Information
Paaritosh Nath, Email: paaritosh.nath@apu.edu.in.
S. Nelson Mandela, Email: s.nelsson@gmail.com.
Aishwarya Gawali, Email: aishwarya.gawali@nipfp.org.in.
References
- Abraham, R. 2020. “What the numbers don’t tell us: Looking beyond standard measures of employment during an economic lockdown.” Centre for Sustainable Employment Blogpost October 2020, Azim Premji University, Bangalore.
- Abraham, R., Basole, A., & Kesar, S. 2021. Down and Out? The Gendered Impact of the Covid-19 Pandemic on India’s Labour Market. Working Paper #40, Centre for Sustainable Employment, Azim Premji University,Bangalore. https://cse.azimpremjiuniversity.edu.in/wp-content/uploads/2021/02/Abraham_Basole_Kesar_Gender_Covid_Feb_2021.pdf
- Abraham Rosa, Shrivastava Anand. How Comparable are India’s Labour Market Surveys? The Indian Journal of Labour Economics. 2022;65(2):321–346. doi: 10.1007/s41027-022-00381-x. [DOI] [PMC free article] [PubMed] [Google Scholar]
- Azim Premji University. 2021. Impact of COVID-19 on Livelihoods of Informal Sector Workers and Vulnerable Groups in Bengaluru: A View from the Ground. Azim Premji University. http://strandedworkers.in/mdocs-posts/impact-of-covid-19-on-livelihoods-of-informal-sector-workers-and-vulnerable-groups-in-bengaluru-a-view-from-the-ground/.
- Deshpande, A. 2020. The Covid-19 Pandemic and Lockdown: First Effects on Gender Gaps in Employment and Domestic Work in India. Discussion Paper Series in Economics 30. Ashoka University. https://ashoka.edu.in/static/doc_uploads/file_1592462930.pdf.
- Deshpande, A., and Ramachandran, R. 2020. Is COVID-19 ‘The Great Leveler’? The Critical Role of Social Identity in Lockdown- Induced Job Losses. Discussion Paper Series in Economics 34. Ashoka University. https://www.ashoka.edu.in/static/doc_uploads/file_1596449273.pdf
- Egger, D., Edward, M., Warren, S.S., Shenoy, A,. Collins, E,. Karlan, D,. Parkerson, D., et al. 2021. Falling Living Standards during the COVID-19 Crisis: Quantitative Evidence from Nine Developing Countries. Science Advances 7 (6): eabe0997. https://advances.sciencemag.org/content/7/6/eabe0997/tab-pdf [DOI] [PMC free article] [PubMed]
- Harriss-White, B. 2020. The Modi Sarkar’s Project for India’s Informal Economy. The Wire. https://thewire.in/political-economy/the-modi-sarkars-project-for-indias-informal-economy
- International Labour Organization. 2021. World Employment and Social Outlook: Trends 2021b. https://www.ilo.org/wcmsp5/groups/public/---dgreports/---dcomm/---publ/documents/publication/wcms_795453.pdf.
- International Labour Organization. 2022. World Employment and Social Outlook: Trends 2022. https://www.ilo.org/wcmsp5/groups/public/---dgreports/---dcomm/---publ/documents/publication/wcms_834081.pdf
- Kesar S, Abraham R, Lahoti R, Nath P, Basole A. Pandemic, informality, and vulnerability: Impact of COVID-19 on livelihoods in India. Canadian Journal of Development Studies/revue Canadienne D'études Du Développement. 2021;42(1–2):145–164. doi: 10.1080/02255189.2021.1890003. [DOI] [Google Scholar]
- Menon, R. 2019. Never done, poorly paid, and vanishing: Female Employment and labour force participation in India. Retrieved May 5, 2021, from https://www.epw.in/engage/article/never-done-poorly-paid-and-vanishing-female
- Mohanan, P. C. 2021. Measuring work: Comparing employment-unemployment surveys with time use surveys. CEDA. Retrieved January 2, 2023, from https://ceda.ashoka.edu.in/measuring-work-comparing-employment-unemployment-surveys-with-time-use-surveys/
- Niyati, S. 2021. Rural women and the pandemic [Podcast]. Foundation for Agrarian Studies. https://fas.org.in/young-scholars-corner-2/
- Pattenden, J., Campling, L., Ballivián, E., Gras, C., Lerche, J., O'Laughlin, B., Oya, C., Perez Nino, H., & Sinha, S. 2021. Introduction: Covid‐19 and the conditions and struggles of agrarian classes of labour. Journal of Agrarian Change, 582–590. [DOI] [PMC free article] [PubMed]
- Shyam Sundar, K. R. 2020. Social Security Code Draft Rules, 2020: Is it inclusive and representative? [part 1]. TheLeaflet. Retrieved May 7, 2021, from https://theleaflet.in/social-security-code-draft-rules-2020-is-it-inclusive-and-representative/
- Srivastava, R., & Naik, A. K. 2017. Growth and Informality in the Indian Economy. In P. Rustagi, R. P. Mamgain, & K. P. Kannan (Eds.), Labour and development essays in honour of Professor T.S. Papola. New Delhi, Delhi: Academic Foundation.