

Abstract
Transparency in animals is a complex form of camouflage involving mechanisms that reduce light scattering and absorption throughout the organism. In vertebrates, attaining transparency is difficult because their circulatory system is full of red blood cells (RBCs) that strongly attenuate light. Here, we document how glassfrogs overcome this challenge by concealing these cells from view. Using photoacoustic imaging to track RBCs in vivo, we show that resting glassfrogs increase transparency two- to threefold by removing ~89% of their RBCs from circulation and packing them within their liver. Vertebrate transparency thus requires both see-through tissues and active mechanisms that “clear” respiratory pigments from these tissues. Furthermore, glassfrogs’ ability to regulate the location, density, and packing of RBCs without clotting offers insight in metabolic, hemodynamic, and blood-clot research.
Transparency is a form of whole-body camouflage that is common in aquatic ecosystems but rare on land (1). In contrast to other forms of camouflage, transparency requires complex specializations that minimize light scattering and absorption throughout the entire animal (2–4). These include a range of cell- and tissue-specific mechanisms, from those that facilitate light transmission through functional tissues, to active processes that conceal or minimize intrinsically pigmented tissues (1). Such mechanisms are poorly understood despite decades of biomedical interest in developing transparent model organisms (5–7).
In vertebrates, achieving transparency is challenging because their circulatory system is full of hemoglobin-containing red blood cells (RBCs) that strongly absorb blue and green light (8–10). Thus, even if tissues themselves are highly transparent, their metabolic requirements render them opaque through the hemoglobin oxygen-transport system. Transparent ice fish and larval eels have apparently overcome this blood problem by not producing hemoglobin and RBCs (11–13). Here, we document that glassfrogs use an alternative strategy to overcome this challenge, by essentially hiding RBCs from view.
Glassfrogs are well known for their highly transparent muscles and ventral skin, through which their bones and other organs are visible (14–16) (Fig. 1 and figs. S1 and S2). We found that these tissues transmit more than 90 to 95% of visible light while maintaining functionality (e.g., locomotion, vocalization) (fig. S2, E to F). This transparency is adaptive because it camouflages glassfrogs from predators while they sleep on vegetation during the day (17) (Fig. 1, A to F, and fig. S1). However, circulating RBCs could compromise leaf camouflage, as they strongly absorb light in regions that are transmitted and reflected by living vegetation (i.e., green light) (Fig. 1, A and B, and fig. S1). Outside of unpigmented tissues, almost nothing is known about the mechanisms of vertebrate transparency (1, 2).
Fig. 1. Glassfrog transparency and leaf-like coloration changes with activity.

The leaf-dwelling glassfrog Hyalinobatrachium (“Centrolenella”) fleischmanni forages and breeds on vegetation at night along forested streams (occurring from southern Mexico to northwestern South America) (33–36). During the day, Hyalinobatrachium frogs sleep upside down on broadleaf vegetation, where a combination of green leaflike dorsal coloration and transparency could provide camouflage on translucent leaves (17–38) (fig. S1). (A and B) Frogs photographed in transmitted light (backlit). (C) RBC perfusion in abdominal tissues (skin and muscle) (backlit). (D) Calibrated transmittance photography of the same 11 frogs measured across activity levels. Small dark gray circles show individual frog measurements; larger light gray circles and error bars show mean ± 95% confidence interval of transmittance (green channel; for all color channels, see fig. S2 and table S1). (E and F) Diffuse reflectance and transmittance of 13 frogs during sleep and immediately after exercise, and five leaves where they sleep. (G) Ratio of transmittance between states (sleeping/exercise). The reduction in transparency during exercise is largely due to increased absorption by oxygenated (oxy-Hb) and deoxygenated (Hb) hemoglobin (hemoglobin Q-band 500 to 600 nm) (fig. S3 and table S2). Absorption spectra for hemoglobin were obtained from (39).
We found that the glassfrog Hyalinobatrachium fleischmanni actively maintains high levels of transparency while it sleeps during the day (Fig. 1 and movie S1). We used calibrated color photography to measure transparency of 11 frogs repeatedly while they were asleep, awake, calling to mates, after exercise, and under anesthesia. While sleeping, glassfrogs transmitted on average 34 to 61% more light compared to all other conditions (post hoc comparisons P < 0.0001), whereas they transmitted similar levels of light while in all other nonsleeping states (P ≥ 0.22) (Fig. 1D; fig. S2, A to D; and table S1). Offering a potential explanation for the reduction in transparency, we observed that sleeping frogs circulate plasma with sparse RBCs, and that RBC concentration increased sharply as they awoke (Fig. 1C and movies S2 and S3).
Using optical spectroscopy, we confirmed that a reduction in circulating RBCs was responsible for the increase in transparency during sleep. We measured the diffuse reflectance and transmittance of 13 individuals repeatedly while they slept and after induced exercise. Within seconds after exercise, their leaf-like dorsal reflectance changed markedly and light transmittance dropped two- to threefold across the visible portion of the spectrum (Fig. 1, E to F, and fig. S1). When comparing spectral changes between states, we found a clear and strong hemoglobin signal that was primarily attributed to increased absorption by both oxy- and deoxyhemoglobin (Fig. 1G and fig. S3A). A clear and strong hemoglobin signal was evident in attenuation spectra for exercised frogs (hemoglobin Q-band 500 to 600 nm), whereas the hemoglobin signal was barely detectable while they were sleeping (fig. S3B). Using a simplified optical model, we confirmed that increased RBC density very closely predicts the empirical reduction in transparency (fig. S3, C to E, and table S2). These results show that glassfrog transparency involves active processes that reduce the concentration of circulating RBCs in otherwise transparent tissues.
Understanding the physiological mechanisms of vertebrate transparency requires a strict in vivo approach, as transparency is often lost in death and during stress (1). In glassfrogs, we found that RBC perfusion—and hence their transparency—is easily disrupted by activity, stress, anesthesia, and most forms of euthanasia (Fig. 1, figs. S1 and S3, and movies S1 and S2). Therefore, we required an imaging technique that could (i) capture spatial hemodynamics deep within sleeping frogs without inducing RBC perfusion; (ii) specifically target hemoglobin in RBCs without using any contrast agents; and (iii) image through opaque organs, which might store RBCs during rest. This last requirement is important because H. fleischmanni heart, liver, and digestive organs are within mirrored sacs that contain reflective guanine crystals and attenuate over 80% of the incident visible light (fig. S2E) (16).
To meet these imaging requirements, we used photoacoustic microscopy (PAM) (18,19) (fig. S4A and table S3). This hybrid imaging technique relies on the photoacoustic effect—essentially, when light is absorbed by molecules, some of the absorbed energy is converted into ultrasonic waves. By optically inducing and then acoustically measuring ultrasonic-wave production, PAM can image deeper than pure optical modalities, as biological tissue is far more transparent to ultrasonic waves than light. Furthermore, PAM can be optimized to detect light absorption by hemoglobin and quantify its oxygenation level, without the need for contrast agents (20).
First, we imaged the whole body of glassfrogs to determine where RBCs aggregate during sleep by using two PAM systems optimized for either resolution or depth (Fig. 2 and fig. S4, A to E). Whole-body imaging requires hours of scanning, which cannot capture exercise-level perfusion as frogs quickly conceal RBCs after exercise (see below). Therefore, we imaged three frogs while they were asleep and again under anesthesia—the latter condition resulted in extensive RBC perfusion and allowed us to determine where sleeping frogs store RBCs (Fig. 1D, Fig. 2A, table S1, and movie S1). While frogs were asleep, circulating RBCs decreased by 80 to 90% and RBC signal was largely restricted to the liver (Fig. 2 and fig. S4, F to H).
Fig. 2. Glassfrogs remove RBCs from circulation while sleeping.

(A) High-resolution PAM showing RBC perfusion within the vasculature of the same frog while asleep and under anesthesia. This PAM technique can capture the location of RBCs within single vessels, as well as the oxygen saturation of hemoglobin (sO2). (B) Flash photography showing the visible change in RBC perfusion between activity levels.
To test whether glassfrogs actively store RBCs in their liver while asleep and release them back into circulation when active, we performed an exercise assay and measured specific anatomical regions at the single-vessel level using high-resolution PAM (Fig. 3 and fig. S4, A to G). First, we repeatedly imaged the liver of 12 individuals and found that RBCs are aggregated in this organ while frogs rest, flow out of the liver and back into the vasculature during exercise, and then reaggregate in the liver after recovery (P < 2.2e−16; Fig. 3, A and B, and table S4). RBC signal in the liver declined on average by 83% alter exercise and then again increased by similar levels after recovery (post hoc comparisons with the exercised state P < 0.0001). RBC signal in the liver was similar during rest and after recovery from exercise (P = 0.67). Frogs can store RBCs in large, distensible sinusoids of the liver (21,22). Our histological examination showed that glassfrogs also pack RBCs in these sinusoids during rest (Fig. 3G and fig. S5), which confirms our results using three different PAM systems.
Fig. 3. Glassfrogs store RBCs in their liver while asleep.
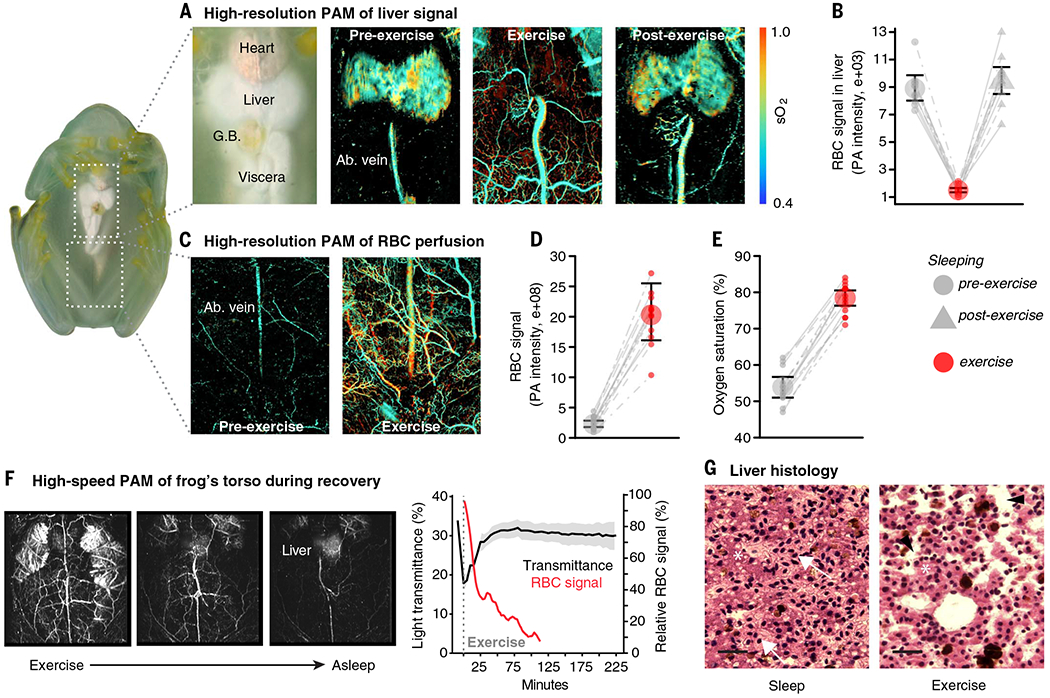
Hemodynamics of targeted anatomical regions using high-resolution PAM. (A and B) RBC signal in the liver declined after exercise and then increased by similar levels after recovery. (C to E) RBC signal (D) and the fraction of oxygenated hemoglobin (sO2) (E) in abdominal tissues declined during sleep. (F) Temporal dynamics of RBC perfusion (n = 1) and associated changes in light transmittance during recovery (n = 10), using calibrated photography and high-speed PAM (movie S4). (G) Hematoxylin and eosin–stained sections of livers from sleeping and exercised glassfrogs. Frog RBCs have oblong nuclei and appear light pink inside the hepatic sinusoids. Hepatocytes (asterisk) are darker round cells with round nuclei and they are arranged in plates that line the sinusoids. Sinusoids are expanded and packed with RBCs (arrows) during sleep, and largely empty and compressed during exercise (arrowheads) (fig. S5). Liver volume changes by 40% between exercise and sleep (see Fig. 4). Scale bars, 30 μm.
Next, we imaged skin and muscle tissue of the abdomen and proximal region of the thighs in 13 glassfrogs. We found that RBC signal within the vasculature of these tissues decreased on average by 89% while frogs rested [generalized linear mixed model (GLMM): χ2 = 634.7, P < 2.2e−16; Fig. 3, C and D]. Furthermore, the percentage of oxygenated hemoglobin (sO2) decreased on average by 31% during sleep (χ2 = 522.09, P < 2.2e−16; Fig. 3E). Accounting for the difference in overall RBC perfusion between states, frogs had on average 96.6% less oxygenated hemoglobin in circulation while at rest than after exercise. Finally, we continually tracked the temporal dynamics of RBC perfusion and light transmittance during recovery by combining calibrated photography with a high-speed PAM system (Fig. 3F; fig. S4, A to E and I; and movie S4). Increases in light transmittance closely corresponded with a decrease in relative RBC signal over time—frogs recovered baseline levels of transparency within ~60 min after exercise.
In glassfrogs, many visceral organs are enclosed within sacs that contain highly reflective guanine crystals (16) that attenuate over 80% of incident light (fig. S2E and fig. S5). We confirmed that this crystal layer attenuates photoacoustic signal to below a detection threshold during anesthesia and exercise by comparing transparent versus crystallized lobes of livers of individual froglets—conveniently, crystal development on the liver peritoneum occurs just after metamorphosis, during which the peritoneum is transparent in one lobe and covered in crystals in the other (fig. S6). Altogether, our results indicate that sleeping glassfrogs remove most RBCs from systemic circulation and conceal them within their mirrored liver during periods when transparency is important for camouflage (Figs. 1 to 3 and figs. S1 to S7).
Glassfrog transparency appears to build on a preexisting respiratory property of frog livers. In the European frog Pelophylax “Rana” esculentus, the liver regulates respiration by storing excess RBCs in sinusoids and releasing them back into circulation as metabolic demand increases (21, 22). These frogs can store up to 44% of their RBCs while under a chemically induced coma at low temperatures (6°C) in well-oxygenated conditions (presumably mimicking cold season torpor) (21,22). However, by 18°C their liver no longer stores RBCs; all are in circulation, owing to temperature effects on cell respiration. Notably, glassfrogs store 82 to 93% of their RBCs while sleeping at temperatures at least as high as 25° to 27°C, and then mobilize them nightly during activity.
These results raise the question of whether other tropical, nontransparent frogs can store high levels of RBCs while resting. We compared RBC perfusion between states for three species from three tropical families of opaque, arboreal frogs using high-resolution PAM (Fig. 4, A to C, and fig. S8). While resting, circulating RBCs decreased on average by or below 12% among the opaque species versus 89% in glassfrogs (GLM: χ2 = 730.76, P < 2.2e−16, n = 22), and their vasculature remained perfused with RBCs while resting at 25° to 27°C (Fig. 4, B and D).
Fig. 4. Opaque tropical frogs do not store high levels of RBCs during rest.

Light transmittance and RBC storage across three independent origins of arboreality–in Allophryne ruthveni from the enigmatic sister family of glassfrogs (Allophrynidae), the sympatric leaf-dwelling treefrog Agalychnis callidryas (Hylidae), and the Malagasy “treefrog” Boophis pyrrhus (Mantellidae) (fig. S8). (A) Flash photography of resting frogs. (B) RBC signal in abdominal tissues (skin and muscle) of sleeping frogs (using PAM). The wild type of A. callidryas cannot be imaged with PAM because their abdomen tissue is wrapped in reflective crystals. The “bubblegum” morph largely lacks pigmentary cells, which permits mapping RBCs by PAM. (C) During rest, these species transmit much lower levels of visible light compared to H. fleischmanni (P < 2.2e−16, n = 22; table S5). Inset: Frogs in transmitted light (backlit). (D) RBC storage (%) during exercise and rest. (E) Liver volume associated with RBC packing during sleep.
To quantify changes in liver size associated with RBC packing, we used high-frequency ultrasound tomography to repeatedly measure the liver volume of 10 glassfrogs and 8 Allophryne ruthveni—a species from the most closely related nontransparent taxa of glassfrogs. The liver volume of glassfrogs increased on average by 40% while their livers were packed with RBCs during sleep (post hoc comparisons P < 0.0001), whereas the liver volume of A. ruthveni did not change significantly between activity levels (post hoc comparisons P = 0.78, increase during rest; Fig. 4E and table S6).
Our results have three major implications. First, we discovered that a vertebrate can actively regulate the location and density of its RBCs in ways that improve transparency. Previous research found that transparency camouflages glassfrogs while they sleep on vegetation during the day (17) (Fig. 1). We found that blood storage increases transparency two- to threefold but results in an extreme daily reduction in circulating RBCs. Just 3.4% of their total hemoglobin is bound with oxygen during this transparent state, indicating that glassfrogs likely exhibit depressed metabolic activity or nonoxidative metabolic processes (21–25). Research on transparent shrimp has also shown that stress and/or activity can result in hemolymph perfusion that opacifies the animals, which could have consequences for predation (4, 26). Taken together, transparency camouflage in complex animals requires physiological specializations that can remove respiratory pigments from transparent tissue, as well as those that compensate for the resulting respiratory constraint.
Second, glassfrogs likely offer insight into the mechanisms involved in preventing vascular pathologies. In most vertebrates, local RBC aggregations cause thromboses (27). Notably, glassfrogs are capable of packing and unpacking 82 to 93% of their RBCs in their liver on a daily basis without triggering vaso-occlusive or clotting (thrombotic) events. Concentrating RBCs in this fashion would presumably require biochemical factors and/or physical modifications (e.g., structural changes of packed RBCs) that ultimately interact with clotting factors (28). Glassfrogs may be particularly useful for blood-clot research. Compared to fish models, frogs share the same genetic and physiological factors that regulate hemostasis as those in mammals [e.g., upstream coagulation factor XII (29)]. Finally, these naturally transparent vertebrates are an excellent animal for in vivo physiology research. Their entire body can be imaged with cellular resolution to capture natural hemodynamic processes without restraint or contrast agents (movie S5). Measuring the cardiovascular physiology of vertebrates in vivo is challenging and has been largely limited to anesthetized, restrained, and/or surgically altered animals. Furthermore, transparent tetrapod models are basically unpigmented mutants that are not transparent [e.g., (30–32)]. Glassfrogs may provide a solution to these challenges and offer insight into biological mechanisms of vertebrate transparency.
Supplementary Material
ACKNOWLEDGMENTS
We thank S. Solie, A. Davis, C. Raxworthy, E. Twomey, K. Warkentin, A. Wolberg, and M. Ryan for comments that improved this manuscript. We also thank H. Sheng, J. P. Gibert, G. Silva, and V. Simoes for lab space and reagents.
Funding:
This study was supported by National Geographic Society grant NGS-65348R-19 (J.D., C.T.); Human Frontier Science Program postdoctoral fellowship LT 000660/2018-L (C.T.); Gerstner Scholars Fellowship provided by the Gerstner Family Foundation and the Richard Gilder Graduate School at the American Museum of Natural History (J.D.); start-up funds from Stanford University (L.O.); start-up funds from Duke University (S.J.); National Institutes of Health grant R01 EB028143 (J.Y.); National Institutes of Health grant R01 NS111039 (J.Y.); National Institutes of Health grant RF1 NS115581 BRAIN Initiative (J.Y.); Duke Institute of Brain Science Incubator award (J.Y.); American Heart Association Collaborative Sciences award 18CSA34080277 (J.Y.); Chan Zuckerberg Initiative grant 2020–226178 (J.Y.); and National Science Foundation CAREER award 2144788 (J.Y.).
Footnotes
Competing interests: The authors declare that they have no competing interests.
Data and materials availability:
All data and code are available in the supplementary materials.
REFERENCES AND NOTES
- 1.Johnsen S, Biol. Bull 201, 301–318 (2001). [DOI] [PubMed] [Google Scholar]
- 2.Johnsen S, Widder EA, J. Theor. Biol 199, 181–198 (1999). [DOI] [PubMed] [Google Scholar]
- 3.Zueva L et al. , Microsc. Microanal 22, 379–386 (2016). [DOI] [PMC free article] [PubMed] [Google Scholar]
- 4.Bagge LE, Kinsey ST, Gladman J, Johnsen S, J. Exp. Biol 220, 4225–4233 (2017). [DOI] [PubMed] [Google Scholar]
- 5.Wakamatsu Y, Pristyazhnyuk S, Kinoshita M, Tanaka M, Ozato K, Proc. Natl. Acad. Sci. U.S.A 98,10046–10050 (2001). [DOI] [PMC free article] [PubMed] [Google Scholar]
- 6.White RM et al. , Cell Stem Cell 2, 183–189 (2008). [DOI] [PMC free article] [PubMed] [Google Scholar]
- 7.Inyushin M, Meshalkina D, Zueva L, Zayas-Santiago A, Molecules 24, 2388 (2019). [DOI] [PMC free article] [PubMed] [Google Scholar]
- 8.Dickerson RE, Geis I, Hemoglobin: Structure, Function, Evolution, and Pathology (Benjamin-Cummings Publishing Company, Menlo Park, CA, 1983). [Google Scholar]
- 9.Hardison RC, Proc. Natl. Acad. Sci. U.S.A 93, 5675–5679 (1996). [DOI] [PMC free article] [PubMed] [Google Scholar]
- 10.Hardison R, J. Exp. Biol 201, 1099–1117 (1998). [DOI] [PubMed] [Google Scholar]
- 11.Garofalo F, Pellegrino D, Amelio D, Tota B, Comp. Biochem. Physiol. A Mol. Integr. Physiol 154, 10–28 (2009). [DOI] [PubMed] [Google Scholar]
- 12.Miller MJ, Aqua-Biosci. Monogr 2, 1–94 (2009). [Google Scholar]
- 13.Ruud JT, Nature 173, 848–850 (1954). [DOI] [PubMed] [Google Scholar]
- 14.Schwalm PA, McNulty JA, J. Morphol 163, 37–44 (1980). [DOI] [PubMed] [Google Scholar]
- 15.Streicher JW et al. , Mol. Phylogenet. Evol 119, 128–143 (2018). [DOI] [PubMed] [Google Scholar]
- 16.Cisneros-Heredia DF, Mcdiarmid RW, Zootaxa 1572, 1–82 (2007). [Google Scholar]
- 17.Barnett JB et al. , Proc. Natl. Acad. Sci. U.S.A 117, 12885–12890 (2020). [DOI] [PMC free article] [PubMed] [Google Scholar]
- 18.Liu W, Yao J, Biomed. Eng. Lett 8, 203–213 (2018). [DOI] [PMC free article] [PubMed] [Google Scholar]
- 19.Wang LV, Yao J, Nat. Methods 13, 627–638 (2016). [DOI] [PMC free article] [PubMed] [Google Scholar]
- 20.Yao J, Maslov KI, Zhang Y, Xia Y, Wang LV, J. Biomed. Opt 16, 076003 (2011). [DOI] [PMC free article] [PubMed] [Google Scholar]
- 21.Frangioni G, Borgioli G, J. Zool 230, 483–493 (1993). [Google Scholar]
- 22.Frangioni G, Borgioli G, J. Zool 234, 601–611 (1994). [Google Scholar]
- 23.Storey KB, Storey JM, Q. Rev. Biol 65, 145–174 (1990). [DOI] [PubMed] [Google Scholar]
- 24.Park TJ et al. , Science 356, 307–311 (2017). [DOI] [PubMed] [Google Scholar]
- 25.Bickler PE, Buck LT, Annu. Rev. Physiol 69, 145–170 (2007). [DOI] [PubMed] [Google Scholar]
- 26.Bhandiwad A, Johnsen S, J. Exp. Biol 214, 709–716 (2011). [DOI] [PubMed] [Google Scholar]
- 27.Yu FT, Armstrong JK, Tripette J, Meiselman HJ, Cloutier G, J. Thromb. Haemost 9, 481–488 (2011). [DOI] [PMC free article] [PubMed] [Google Scholar]
- 28.Cines DB et al. , Blood 123, 1596–1603 (2014). [DOI] [PMC free article] [PubMed] [Google Scholar]
- 29.Ponczek MB, Gailani D, Doolittle RF, J. Thromb. Haemost 6, 1876–1883 (2008). [DOI] [PMC free article] [PubMed] [Google Scholar]
- 30.Nakajima K, Shimamura M, Furuno N, Dev. Dyn 250, 1420–1431 (2021). [DOI] [PubMed] [Google Scholar]
- 31.Sumida M et al. , Sci. Rep 6, 24431 (2016). [DOI] [PMC free article] [PubMed] [Google Scholar]
- 32.Castroviejo-Fisher S, De la Riva I, Vila C, Nature 449, 972 (2007). [DOI] [PubMed] [Google Scholar]
- 33.AmphibiaWeb, https://amphibiaweb.org (accessed July 2021).
- 34.Jacobson SK, Herpetologica 41, 396–404 (1985). [Google Scholar]
- 35.Delia JR, Ramírez-Bautista A, Summers K, Behav. Ecol. Sociobiol 67, 557–569 (2013). [Google Scholar]
- 36.Delia J, Bravo-Valencia L, McDiarmid RW, Phyllomedusa 16, 101–107 (2017). [Google Scholar]
- 37.Schwalm PA, Starrett PH, McDiarmid RW, Science 196, 1225–1227 (1977). [DOI] [PubMed] [Google Scholar]
- 38.Taboada C et al. , Proc. Natl. Acad. Sci. U.S.A 117, 18574–18581 (2020). [DOI] [PMC free article] [PubMed] [Google Scholar]
- 39.Prahl S, Optical absorption of hemoglobin. http://omlc.ogi.edu/spectra/hemoglobin(1999).
Associated Data
This section collects any data citations, data availability statements, or supplementary materials included in this article.
Supplementary Materials
Data Availability Statement
All data and code are available in the supplementary materials.