Abstract
Archival formalin-fixed, paraffin-embedded and ethanol-fixed tissues represent a potentially invaluable resource for gene expression analysis, as they are the most widely available material for studies of human disease. Little data are available evaluating whether RNA obtained from fixed (archival) tissues could produce reliable and reproducible microarray expression data. Here we compare the use of RNA isolated from human archival tissues fixed in ethanol and formalin to frozen tissue in cDNA microarray experiments. Since an additional factor that can limit the utility of archival tissue is the often small quantities available, we also evaluate the use of the tyramide signal amplification method (TSA), which allows the use of small amounts of RNA. Detailed analysis indicates that TSA provides a consistent and reproducible signal amplification method for cDNA microarray analysis, across both arrays and the genes tested. Analysis of this method also highlights the importance of performing non-linear channel normalization and dye switching. Furthermore, archived, fixed specimens can perform well, but not surprisingly, produce more variable results than frozen tissues. Consistent results are more easily obtainable using ethanol-fixed tissues, whereas formalin-fixed tissue does not typically provide a useful substrate for cDNA synthesis and labeling.
INTRODUCTION
The determination of relative expression levels for a large number of genes using cDNA or oligonucleotide microarray technology is becoming a standard approach for the comparative analysis of gene expression between different cell populations or tissues (1–4). Since RNA is very often extracted from rare specimens, such as primary cell cultures or microdissected tissue samples, one of the frequently encountered limitations of the technique can be the amount of RNA required for hybridization. In addition, while fresh frozen tissues from human pathological specimens of interest may not be available for gene expression studies, archived tissues preserved in various fixatives often are obtainable.
Various signal amplification techniques have been developed within the last several years (5). The MICROMAX cDNA microarray system utilizes tyramide signal amplification (TSA), which requires 20–100 times less RNA than direct cDNA labeling. The TSA method was originally introduced to improve the sensitivity of immunohistochemistry and, when properly optimized to individual tissues and primary antibodies, has become an important tool for immunofluorescence microscopy (6,7). Although a cDNA microarray system using TSA is commercially available, the accuracy and reproducibility of the technique has not been extensively studied.
Since the availability of fresh disease specimens is often a limiting step in gene expression experiments, other RNA sources, such as formalin- and ethanol-fixed archival tissues, need to be considered. Fixed tissues are generally considered sub-optimal for RNA analytical techniques such as northern blotting, but in some cases efforts using RNA isolated from formalin-fixed tissues in northern hybridization (8) and real time RT–PCR (9) have been successful. This, together with an increasing need for large-scale gene expression profiling, raises the issue of whether RNA from different pathological specimens might be used in microarray-based experiments. The application of microarray-based hybridization techniques to human pathological specimens might open new avenues in the study of diseases and subsequently facilitate the identification of new therapeutic drug targets. This is especially the case where large numbers of replicates may need to be studied to control for human genetic diversity, compared with experiments using only cell lines or inbred mouse strains (3). Additionally, while laser capture microdissection coupled to cDNA microarray analysis uses fresh frozen or ethanol-fixed specimens (10), no comprehensive evaluation of its reproducibility using ethanol-fixed tissues has been published. In the present study we have conducted experiments to evaluate the use of TSA microarray systems and made an attempt to use ethanol- and formalin-fixed tissues as a source of RNA for gene expression experiments using custom-made cDNA microarrays.
MATERIALS AND METHODS
Tissue samples and cell cultures
To test the specificity of the TSA microarray system and variables of the ethanol and formalin fixation procedures, post-mortem brain tissues cut from frontal cortex were obtained from five unrelated human subjects. Post-mortem intervals ranged from 8 to 11 h. Adjacent tissue sections from each individual were immediately frozen in liquid nitrogen and stored at –80°C; others were immersed in formalin (10%, pH 7.0) or RNase-free 70% ethanol in 10 mM Tris–HCl pH 7.6, 1 mM EDTA and fixed for 12–18 h at 4°C. Neural progenitor colonies (neurospheres) were cultured from neonatal mouse neocortex as described previously (11,12).
Extraction of RNA from frozen and fixed tissues
The RNA from cultured cells and frozen tissue sections was extracted using acid phenol extraction (Trizol LS; Gibco BRL) as recommended by the manufacturer. One milliliter of Trizol per 50 mg tissue was used. RNA from paraffin-embedded tissue was extracted using a combination of proteinase K and Trizol reagent as described previously (13), followed by DNase treatment (37°C, 30 min). RNA was dissolved in TE buffer and stored at –80°C. The purity of RNA was checked by measuring the optical density at 260 and 280 nm. The quality was confirmed by gel electrophoresis and RT–PCR of housekeeping genes. The extraction methods used provided optimal RNA for RT–PCR (13).
Microarrays
We performed 36 microarray experiments matching frozen and ethanol- and formalin-fixed samples in various combinations (Table 1). Two types of arrays were used. For experiments comparing human tissues, an array containing 95 relatively abundant human genes gridded in duplicate was used. This size was chosen because it was relatively inexpensive to produce and had the advantage of containing replicate spots on the same array, facilitating statistical analysis of various human tissues. A larger array containing 8700 mouse genes (http://www.medsch.ucla.edu/som/humgen/nelsonlab) was used only to elucidate reproducibility of the TSA method. The mouse array was based on Unigene clusters and contained 2700 known genes for which the full-length cDNA sequences are known and an additional 6000 ESTs. This array has the advantage that it contains genes of varying abundances and many of these genes are low abundance genes based on either previous expression studies or EST sequencing data. This allowed evaluation of the TSA method over a large number of genes of different abundance levels. These microarrays were constructed in the UCLA Genetics Microarray Core using a custom arrayer and previously described methods (12). Briefly, clone inserts were PCR amplified using vector primers, purified by isopropanol precipitation, resuspended in high pH buffer at ∼200–800 ng/µl concentration and gridded at high density onto poly-l-lysine-coated slides.
Table 1. Summary of 36 microarray experiments performed using the TSA method.
| Experimenta | Hybridizationsb | Correlationc | Sloped | Hitse |
|---|---|---|---|---|
| NS (T) versus NS (T) | 3 | 0.96 | 1.08 | 79% |
| Frozen (T) versus frozen (T) | 2 | 0.96 | 1.09 | 85% |
| Frozen (P) versus frozen (P) | 1 | 0.88 | 0.99 | 91% |
| Frozen (P) versus frozen (T) | 2 | 0.87 | 0.91 | 95% |
| Ethanol (T) versus ethanol (T) | 2 (4) | 0.87 | 0.65 | 99% |
| Ethanol (T) versus frozen (T) | 3 (4) | 0.61 | 0.19 | 99% |
| Formalin (T) versus formalin (T) | 3 (6) | 0.78 | 1.85 | 47% |
| Formalin (T) versus formalin (T) (1 h at 70°C) | 2 | 0.66 | 0.86 | 58% |
| Formalin (T) versus formalin (T)f | 1 | 0.48 | 1.05 | 30% |
| Formalin (T) versus frozen (T) | 8 (9) | 0.55 | 0.3 | 47% |
| Formalin (P) versus frozen (P) | 2 | 0.72 | 0.16 | 78% |
All NS experiments used the mouse 9k array; the others were performed on the human array.
aThe tissues or cell lines compared were two neurosphere cultures, NS7 and NS8, of neuronal progenitor cell lines (NS) grown in different flasks. T, total RNA; P, poly(A)+ RNA; 1 h at 70°C, tyramide signal amplification of RNA preheated at 70°C for 1 h prior to cDNA synthesis.
bNumber of successful hybridizations in the experiment. The numbers in parentheses indicate the total number of hybridizations (successful and unsuccessful) that were performed.
cMean correlation of signals from the two channels of successful hybridizations.
dMean slope of the best fit correlation line between successful hybridizations.
eNumber of signals above twice local background.
fThe direct labeling method was used in the experiment.
Probe preparation and hybridization
Direct RNA labeling was performed using Cy3-dCTP and Cy5-dCTP (catalog nos PA53021 and PA55021; Amersham), oligo(dT) (12–18mer) and Superscript II reverse transcriptase (catalog no. 18064-014; Life Technologies). (See http://www.tigr.org/tdb/microarray/conciseguide.html or geschwindlab.medsch.ucla.edu for complete protocol.) The labeling reaction contained 50 µg total RNA, 500 µM dUTP, 500 µM dATP, 500 µM dTTP, 100 µM dCTP, 1 mM Cy3–dCTP/Cy5–dCTP, 400 U Superscript II reverse transcriptase (Gibco BRL), 1 mM DTT and 1× reverse transcriptase buffer supplied by the manufacturer (NEN). The reaction mix was incubated for 3 h at 42°C and stopped with 20 mM EDTA. After degradation of the RNA by NaOH for 30 min (final concentration 25 mM) and neutralization with HCl, unincorporated fluorescent nucleotides were removed by isopropanol precipitation.
The TSA probe labeling and array hybridization were performed as described in the instruction manual (MICROMAX Human cDNA Microarray System, NEN Life Science Products, Boston, MA) with minor modifications (see http://Geschwindlab.medsch.ucla.edu for detailed protocol). Biotin- and fluorescein-labeled cDNAs were generated from 0.5 and 1.5 µg total RNA for the 92 and 8700 gene cDNA microarrays, respectively. We found that increasing the cDNA synthesis time from 1 h, as recommended by the manufacturer, to 3 h resulted in much more complete and reproducible labeling. Post-hybridization washes were performed according to the manufacturer’s recommendations (MICROMAX; NEN). The signals from specifically hybridized biotin- and fluorescein-labeled cDNAs were amplified either with streptavidin–horseradish peroxidase (HRP) and Cy5–tyramide or antifluorescein–HRP and Cy3–tyramide, respectively. After signal amplification, the cDNA microarrays were air dried and scanned in a Genetic Microsystems 418 microarray scanner. The images were analyzed using ImaGene 4.1 (Biodiscovery, Santa Monica, CA). Prior to quantitative analysis, normalization was performed using a non-linear function to control for dye and signal intensity effects (14). Background correction was first conducted using a smoothed background correction, which resulted in a lower variance than subtracting local background. All hybridizations were done at least in duplicate and repeated with the fluorophores reversed. Quantified intensity data was downloaded into GeneSpring 3.1 (Silicon Genetics) or Microsoft Excel and analyzed as described in the Results. For computation and graphical display we used R, a statistical language freely available at http://CRAN.R-Project.org.
RESULTS
Sensitivity and reproducibility of the TSA microarray system
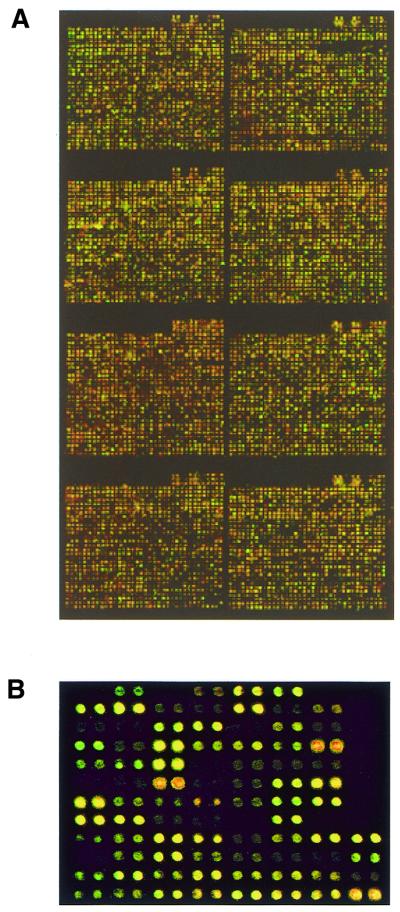
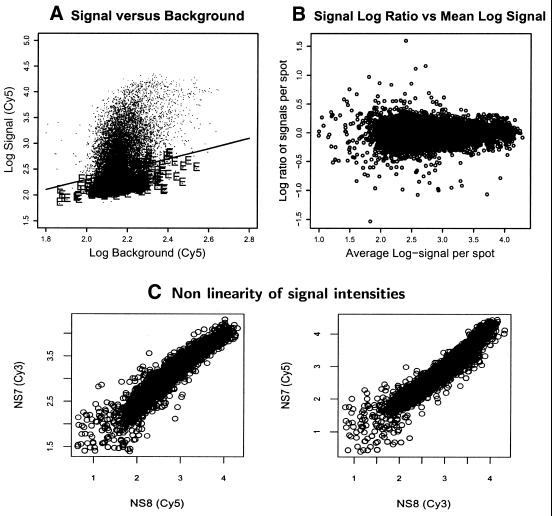
To assess the reproducibility and quality of the data generated in frozen and ethanol- and formalin-fixed tissue samples, multiple hybridizations using the same sample, labeled with different fluorophores and co-hybridized on the same array, were performed. Homotypic hybridizations (frozen versus frozen experiments) were used to estimate the reproducibility of the TSA method and were further used as a benchmark for the evaluation of fixed versus fixed data quality. Figure 1 shows representative hybridizations using TSA onto the 190 (95 genes) and 8700 element arrays. The overall images from direct labeling (data not shown) and TSA appear similar and the background signals appear low. Figure 2A depicts a plot of signal versus background using TSA amplification of RNA derived from frozen neurospheres (NS8). Eighty-three percent of the total points are 2-fold above background and are considered ‘hits’. Figure 2B shows a plot of the log ratio of expression versus the average log intensity per spot. Two very important technical observations follow from a careful analysis of the observed signals. From Figure 2A and B emerges the importance of using an appropriate threshold for considering what constitutes a real signal and the consideration of signal strength measures. This is most pronounced at signals <2-fold above background.
Figure 1.
Representative images of a typical TSA hybridization on the mouse 9k microarray (A) and the 95 gene, 190 element human microarray (B). In (B), duplicate spots are adjacent to each other and the consistency in hybridizations between duplicates can be observed. The image in (A) is a non-homotypic hybridization, whereas (B) is homotypic hybridization of RNA extracted from human frontal cortex.
Figure 2.
Scatter plots of experiments with total RNA isolated from mouse neural stem cell cultures (neurospheres, NS). The same RNA sample was used for cDNA synthesis and labeled with either fluorescein-12-dCTP or biotin-11-dCTP. Both cDNAs were co-hybridized on the mouse 9k microarray (homotypic hybridization) and developed according to the TSA protocol provided by the manufacturer (MICROMAX; NEN). (A) The plot (on a log10 scale) of Cy5 signal versus background from a representative homotypic hybridization of NS RNA on the mouse 9k array. The plots for Cy3 were similar. The points above the solid line have a signal higher than 2-fold background. The letter E indicates the signal produced by negative control spots. Notable is the clear separation between signal and background apparent in the two clusters of spots that are observed when the data are plotted in this manner. (B) A representative plot of the log10 ratio (Cy3/Cy5) versus the average log10 signal from both Cy3 and Cy5 channels for each spot in homotypic hybridization. It can be seen that the likelihood of false positive ratios decreases with signal strength. (C) Scatter plots of the signal generated from NS versus NS hybridizations from two experiments where the dyes were reversed. In this case, rather than labeling the same RNA, each NS culture, NS7 and NS8, was grown in separate flasks and processed separately. The clear non-linearity (curvature) produced by differences in dye incorporation and signal at different cDNA abundances can be observed.
A second technical issue relates to the method of normalization. Non-linear normalization has been championed in the literature, but has not been widely adopted by most experimentalists, who typically use global normalization methods (15). Non-linearity is reflected in the curvature present in scatter plots from globally normalized signals. This may be due to dye incorporation effects that may differ at different cDNA abundances (see for example Fig. 2C). Globally normalized signals will contain errors that can be removed by use of a non-linear normalization to remove the curvature induced by dye effects. Furthermore, the effect of the dyes can be minimized by performing duplicate hybridizations with reversed labels, as was done here. This is clearly an important consideration when using TSA.
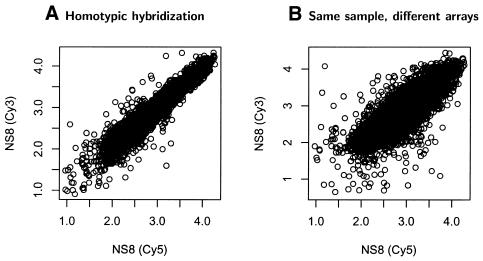
A high correlation between duplicate or like samples co-hybridized on the 8700 element mouse array was observed. Figure 3 depicts scatter plots derived from the co-hybridization of a duplicate sample labeled with different dyes. Correlations were around 0.96, even when the independent replicate samples from different culture dishes were co-hybridized (Fig. 3B). This demonstrates high data quality and reproducibility of the hybridizations using TSA. Typically, because of slide-to-slide variability due to factors such as inconsistent spot deposition and attachment to the slide surface, slide washing or local hybridization conditions, between-slide comparisons are not made with spotted cDNA arrays. In this case, using TSA, we were curious to determine whether between-slide variability would be prohibitive to performing between-slide comparisons. As expected, the observed correlations between the same spot on different slides were less than same spot comparisons (Fig. 3B). However, these correlations were relatively high: when signals obtained on different slides from the same spot were compared the correlation averaged 0.84 (range 0.77–0.87), suggesting that with a few more replicate experiments, such an approach of comparison across slides would be technically feasible. Thus, overall the signals produced using TSA to amplify the signal from small quantities of RNA were very consistent across a large number of genes assayed.
Figure 3.
Hybridization consistency on the 9K microarray using TSA amplification. In each graph, Cy5 signals are shown on the ordinate and Cy3 signals on the abscissa on a log10 scale after non-linear normalization. Each dot represents the hybridization intensity of each gene. While there was more variability in hybridizations obtained from the same sample hybridized to different arrays (B) relative to the same array (A), both showed high reproducibility.
Comparison of archived tissues
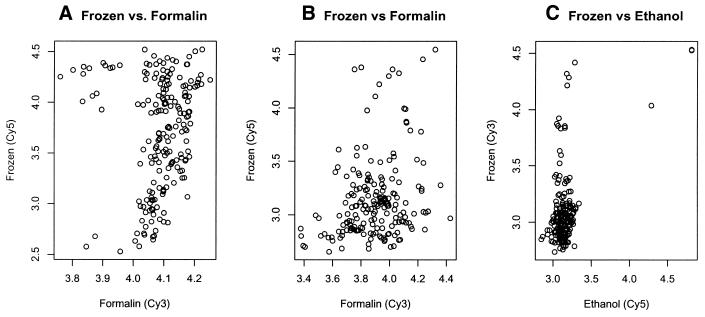
Quantitative gene expression analysis in matched frozen, formalin-fixed, paraffin-embedded and ethanol-fixed tissue samples were performed using the 190 human element array, which contains mostly high abundance genes expressed in many different tissue types. To test the specificity of the formalin and ethanol fixation procedures, post-mortem frozen, ethanol-fixed and formalin-fixed brain specimens obtained from the frontal cortex of five human subjects were used. As previously, only the spots generating signals above 2.0 times local background were considered true signals. This corresponded to 94% of spots for frozen tissues, 99% for ethanol-fixed and only 56% for formalin-fixed tissues in homotypic hybridizations (Table 1 and Fig. 4).
Figure 4.
Comparison of RNA from frozen frontal cortex versus fixed frontal cortex. Fixed and frozen sample pairs are from an adjacent brain section from the same subject hybridized on the human array. Each dot represents the hybridization intensity of each gene. The signals for RNA from frozen tissue are shown on the ordinate in each graph on a log10 scale. (A) Total RNA from frozen frontal cortex versus total RNA from formalin-fixed frontal cortex. (B) Another independent sample hybridization showing the signal obtained using total RNA from frozen frontal cortex versus total RNA from formalin-fixed frontal cortex. (C) Total RNA from frozen versus ethanol fixed frontal cortex.
Not surprisingly, the range of signals for fixed tissues was significantly lower than for frozen tissues, with only 12% and 3% of the signals above 4 times background for ethanol- and formalin-fixed tissues, respectively (Table 1). This demonstrates that formalin-fixed tissues resulted in quite weak signals overall, which is borne out by the observed background-corrected, average log10 signal intensities, which were 3.34, 3.16 and 3.03 for frozen, ethanol-fixed and formalin-fixed, respectively. Because of this effect, it is virtually impossible to compare samples preserved in different fashions, as is shown by the low correlations observed when plotting signals obtained for frozen versus tissues fixed in different manners from the same individual brain (Fig. 4). The different behaviors of frozen and fixed samples also makes it impossible to use global normalization. For this reason, we only normalized slides with homotypic hybridizations and used these comparisons as the basis for the rest of the analysis.
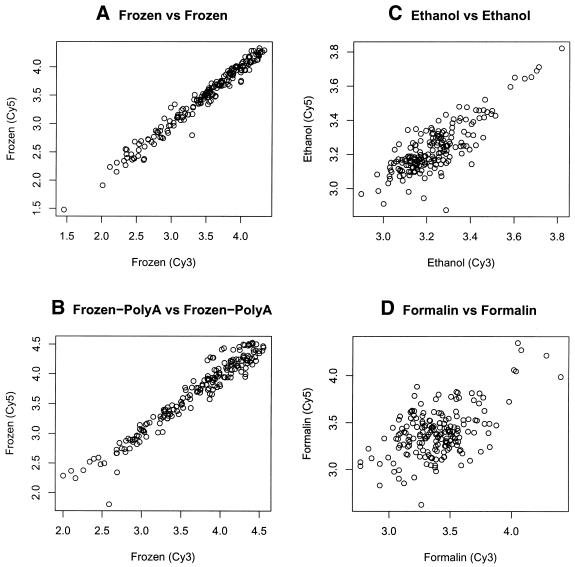
Again, as observed on the larger array, signals obtained from the same frozen tissue labeled with different fluorophores and co-hybridized on the array were highly reproducible (Fig. 5A). Correlations of normalized signals ranged from 0.95 to 0.99, similar to what was observed using fresh cultured neuronal precursor cells on the 8700 array (Fig. 3A). Correlations for ethanol versus ethanol hybridizations within the same array were lower (0.85 and 0.89), but within an acceptable range (Fig. 5B). Sample hybridizations were also conducted with poly(A)+ RNA as template and the correlations were no better than those observed using total RNA (Fig. 5C).
Figure 5.
Scatter plots of homotypic hybridization experiments using RNA isolated from the same tissue with different fixation methods. (A) Total RNA versus total RNA from frozen frontal cortex of a single subject. (B) Poly(A)+ RNA versus poly(A)+ RNA from frozen frontal cortex of a single subject. (C) Total RNA versus total RNA isolated from ethanol-fixed frontal cortex of the same subject shown in (A). (D) Total RNA versus total RNA from formalin-fixed frontal cortex of a different subject.
Formalin-fixed tissue posed many problems. In about half of the cases the experiments simply did not work; one or both dyes did not incorporate properly. Poor cDNA synthesis or lack of dye incorporation was much less frequent and did not happen even once in the current frozen versus frozen experiments. Thus, the failure rate using formalin-fixed tissues was high, an important consideration given the cost of microarray experiments. Using formalin, an acceptable level of dye incorporation was attained in three experiments out of nine attempted, yielding correlations of 0.87, 0.32 and 0.53, less consistent than either frozen or ethanol-fixed tissues (Fig. 5D and Table 1). This, coupled with the far lower dynamic range of signal obtained using formalin, unfortunately suggests that its utility is very limited for current microarray analysis.
Previously, it was reported that better cDNA yield could be obtained by simple preheating of RNA prior to reverse transcription (16). Preheating formalin-fixed RNA for 1 h at 70°C in our experiments did not result in a significant improvement in cDNA synthesis or the expected increase in signal intensity (Table 1). In order to ensure that the results obtained for formalin-fixed tissues were not due to artifacts introduced by TSA, direct labeling of the same RNA was performed. Direct labeling of total RNA isolated from formalin-fixed tissues also did not result in any significant improvement; only 30% of genes produced signals above twice the local background, less than observed with TSA, showing a correlation of signals between duplicate samples of 0.62 and a slope of 1.3 (Table 1).
Across-array comparisons were also performed, although the use of different human tissues would necessarily reduce the correlations across arrays due to many factors, such as differences in post-mortem interval and human genetic diversity. Surprisingly high correlations, similar to those observed in the tissue culture control experiments (see for example Fig. 3A), were observed between the signal intensities of the same spot on different arrays. These inter-array correlations averaged 0.92, with a range of 0.86–0.95. Less correlation was observed between ethanol versus ethanol experiments. One of the experiments was a clear outlier, with a correlation of ∼0.2 with the other experiments. The other experiments showed a tighter range of correlations, ranging from 0.62 to 0.75. This is similar to what was observed in two of the formalin experiments that showed an intra-array correlation (0.62 and 0.72). Neither of these fixation methods produced signals that were as consistent as frozen tissue across arrays.
The nature of microarray noise using TSA amplification
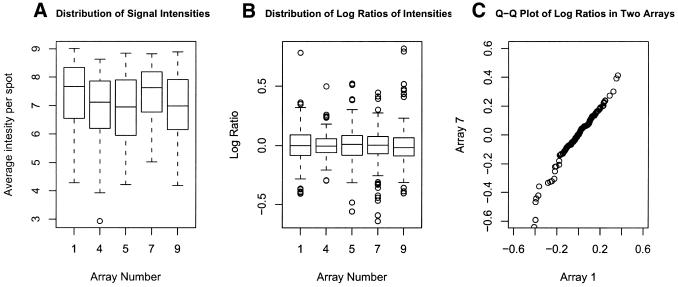
Because we performed several replicate hybridizations on the array using the same high quality frozen tissue specimen, we had the ability to look at the amount of observed variability across arrays and across genes, important issues when considering which analytical methods and assumptions to apply. Figure 6A shows box plots of the average intensity per spot in five homotypic hybridizations using frozen tissues and TSA amplification. These distributions look very similar. Box plots of the log ratios of intensities for the same arrays are also quite similar, highlighting the global reproducibility of the labeling and hybridization (Fig. 6B). To visualize the similarity between the distributions of log ratios across arrays we considered quantile–quantile plots of log ratios across arrays (Fig. 6C provides one example). These distributions are close to the 45° line expected if the distributions were identical across arrays, again demonstrating global array-to-array consistency.
Figure 6.
Variability across arrays and across genes. (A) Box plot of the average signal per spot across five arrays hybridized with RNA from frozen human tissue on the human array. (B) Box plot of the average log ratios across arrays. (C) Quantile–quantile plots of log ratios for two representative arrays. Although this depicts only two arrays, comparisons of the others showed a virtually identical pattern (not shown).
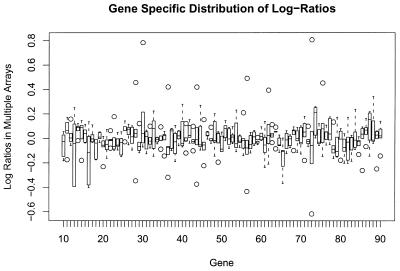
To study variability by gene, we took the average of the log ratios for duplicate spots on each array and considered these values across the five arrays. The distribution of the log ratios per gene is depicted in Figure 7. A conservative approach using a standard t-test was first applied to test the null hypothesis that the mean is zero. This assumes that the distribution of errors is normal, which is probably not correct. However, this faulty assumption biases towards more frequent rejection of the null hypothesis, which is not observed. None of the 88 genes compared gave a P value <0.01. The Flinger test for homogeneity of variance was also used, since it is robust under non-normality, and yielded a P value of 0.6, demonstrating no difference in the variances between spots. However, for individual spots significant outliers are observed. Such outliers are observed in most array experiments and can be easily dealt with analytically and removed, so as to reduce experimental noise.
Figure 7.
The distribution of the log ratios by gene. Ratios were generated from homotypic hybridizations of frozen tissue on five arrays. Eighty-eight genes gave signals 2-fold above background and are represented on this plot. The line depicts the average, the box encompasses the 95% confidence interval for each gene and circles lie outside the 95% confidence interval.
DISCUSSION
Here we report the results from a controlled study performed in parallel on frozen and ethanol- and formalin-fixed tissues using a TSA procedure developed to allow use of a small amount of RNA in microarray experiments. As with many other RNA-based assays, the purity and quality of the starting RNA has a significant effect on the results of microarray experiments. In experiments involving co-hybridizations of the same cDNA labeled with biotin-dCTP (red pseudo-color) and fluorescein-dCTP (green pseudo-color) the TSA method demonstrated high sensitivity and reproducibility. We observed a similar high correlation (0.96) in experiments in which fresh frozen samples from tissue cultures labeled by TSA were hybridized on a custom 8700 murine array or human frozen tissue samples labeled by TSA were hybridized on a smaller array with 190 elements. In both cases the reproducibility of the hybridizations was comparable with that observed using direct labeling without any RNA or signal amplification. The level of potential false positive signals was also low, demonstrating that the TSA method is of great utility to those trying to use limiting amounts of RNA for microarray experiments. In addition, the analysis of signal and ratio variability over five separate arrays demonstrates that frozen post-mortem human tissues, when handled properly, provide reproducible microarray results under the conditions used here. The archived tissue used in this study was handled optimally; RNA was extracted under RNase-free conditions after a short shelf storage time. This may not reflect the condition of all archived tissues in pathology laboratories, but perhaps demonstrates the best that is possible with this type of tissue. Clearly, the optimal specimen is rapidly frozen tissue, but ethanol-fixed tissue is an alternative. Since ethanol is not as strong a preservative as formalin, it is not as widely used as a fixative in pathology laboratories. However, given its utility for microarray studies and gene expression analysis in general, the use of ethanol as a fixative for limited focused storage should be increasingly considered. Since RNA quality is measured before expression analysis, concerns regarding potential RNA degradation in tissues fixed in ethanol can be addressed.
Previously, it was shown that RNA and DNA isolated from ethanol-fixed tissues are better templates for both reverse transcriptase and Taq polymerase compared with formalin-fixed tissues (17). Our experiments show that the RNA obtained from ethanol-fixed specimens clearly results in better dye incorporation into cDNA, therefore producing more consistent and reproducible data. However, the dynamic range of signal intensities from hybridizations with ethanol and formalin were within a significantly narrower range compared with the data generated using frozen specimens. Therefore, RNA isolated from ethanol-fixed tissues can be used for microarray-based analysis only if compared with a control treated in a similar manner (Fig. 3). However, due to the increased variability in signal between duplicate hybridizations relative to frozen tissue, more replicates need to be performed to reach the same level of confidence in the results. Alternatively, follow up using another method, such as in situ hybridization or quantitative RT–PCR, would firmly support the key data derived from ethanol-fixed tissues (12).
In spite of previously reported data on the successful use of RNA from formalin-fixed tissues in real time quantitative RT–PCR (9), formalin-derived RNA was not a good substrate for cDNA synthesis and clearly did not produce reliable hybridizations in our microarray experiments. Generally, poor cDNA synthesis results might be explained by prior degradation of RNA in the tissue before or during fixation, poor yields of RNA associated with various proteins or chemical modification of RNA by formalin. It was shown that a high frequency of non-reproducible sequence alterations occurs in DNA or RNA isolated from formalin-fixed, paraffin-embedded tissues (18). Although the exact mechanism of RNA and DNA modification in formalin-fixed specimens is not clear, it is known that the rate of errors for Taq DNA polymerase is significantly higher (18). The high rate of misincorporations during cDNA synthesis might influence the specificity of hybridization, therefore increasing the number of false positive signals on the array. Another source of non-specific hybridization could be the overall short length of cDNA molecules due to impeded cDNA synthesis. The latter can explain the more successful use of formalin-fixed tissues in real-time PCR, as it relies on much shorter cDNA amplicons and reverse transcription is often performed using random hexamers, avoiding the necessity of intact poly(A) tails. The impeded cDNA synthesis might be due to addition of monomethylol upon formalin attack on RNA bases and it was suggested that incubation of RNA at 70°C might significantly increase the quality of cDNA synthesis (16). This increased variability and poor labeling using formalin-fixed tissue led to more experimental failures, resulting in many more attempts with this method than the frozen and ethanol-fixed tissues, so as to be sure that this was not simply a sample effect. Four different human tissues were used on five arrays and only once did we obtain a reasonable (>0.75) correlation between the same samples co-hybridized on the array.
We also used several simple data visualization and statistical methods to investigate and display the inherent noise in our array data. These methods are straightforward, standard statistical tools that give considerable insight into the general quality of data generated from microarrays (see for example Figs 6 and 7). Presenting such displays of data quality along with microarray results and gene lists would improve the interpretability of most array studies and should be encouraged to facilitate data sharing and interpretation (19).
Acknowledgments
ACKNOWLEDGEMENTS
We thank Zugen Chen and Stan Nelson of the UCLA microarray core for providing us with arrays for these studies. This work was supported by grants from the NIMH, no. MH-60233 (D.H.G.), NIA, no. AG-16570 (D.H.G.) and NINDS, no. NS-41408 (V.V.).
REFERENCES
- 1.Lockhart D.J., Dong,H., Byrne,M.C., Follettie,M.T., Gallo,M.V., Chee,M.S., Mittmann,M., Wang,C., Kobayashi,M., Horton,H. et al. (1996) Expression monitoring by hybridization to high-density oligonucleotide arrays. Nat. Biotechnol., 14, 1675–1680. [DOI] [PubMed] [Google Scholar]
- 2.DeRisi J.L., Iyer,V.R. and Brown,P.O. (1997) Exploring the metabolic and genetic control of gene expression on a genomic scale. Science, 278, 680–686. [DOI] [PubMed] [Google Scholar]
- 3.Geschwind D.H. (2000) Mice, microarrays and the genetic diversity of the brain. Proc. Natl Acad. Sci. USA, 97, 10676–10678. [DOI] [PMC free article] [PubMed] [Google Scholar]
- 4.Sandberg R., Yasuda,R., Pankratz,D.G., Carter,T.A., Del Rio,J.A., Wodicka,L., Mayford,M., Lockhart,D.J. and Barlow,C. (2000) Regional and strain-specific gene expression mapping in the adult mouse brain. Proc. Natl Acad. Sci. USA, 97, 11038–11043. [DOI] [PMC free article] [PubMed] [Google Scholar]
- 5.Speel E.J., Hopman,A.H. and Komminoth,P. (1999) Amplification methods to increase the sensitivity of in situ hybridization: play card(s). J. Histochem. Cytochem., 47, 281–288. [DOI] [PubMed] [Google Scholar]
- 6.Wiedorn K.H., Kuhl,H., Galle,J., Caselitz,J. and Vollmer,E. (1999) Comparison of in-situ hybridization, direct and indirect in-situ PCR as well as tyramide signal amplification for the detection of HPV. Histochem. Cell Biol., 111, 89–95. [DOI] [PubMed] [Google Scholar]
- 7.Qian X., Bauer,R.A., Xu,H.S. and Lloyd,R.V. (2001) In situ hybridization detection of calcitonin mRNA in routinely fixed, paraffin-embedded tissue sections: a comparison of different types of probes combined with tyramide signal amplification. Appl. Immunohistochem. Mol. Morphol., 9, 61–69. [PubMed] [Google Scholar]
- 8.Rupp G.M. and Locker,J. (1988) Purification and analysis of RNA from paraffin-embedded tissues. Biotechniques, 6, 56–60. [PubMed] [Google Scholar]
- 9.Specht K., Richter,T., Muller,U., Walch,A., Werner,M. and Hofler,H. (2001) Quantitative gene expression analysis in microdissected archival formalin-fixed and paraffin-embedded tumor tissue. Am. J. Pathol., 158, 419–429. [DOI] [PMC free article] [PubMed] [Google Scholar]
- 10.Luo L., Salunga,R.C., Guo,H., Bittner,A., Joy,K.C., Galindo,J.E., Xiao,H., Rogers,K.E., Wan,J.S., Jackson,M.R. et al. (1999) Gene expression profiles of laser-captured adjacent neuronal subtypes. Nature Med., 5, 117–122. [DOI] [PubMed] [Google Scholar]
- 11.Kornblum H.I., Zurcher,S.D., Werb,Z., Derynck,R. and Seroogy,K.B. (1999) Multiple trophic actions of heparin-binding epidermal growth factor (HB-EGF) in the central nervous system. Eur. J. Neurosci., 11, 3236–3246. [DOI] [PubMed] [Google Scholar]
- 12.Geschwind D.H., Ou,J., Easterday,M.C., Dougherty,J.D., Jackson,R.L., Chen,Z., Antoine,H., Terskikh,A., Weissman,I.L., Nelson,S.F. et al. (2001) A genetic analysis of neural progenitor differentiation. Neuron, 29, 325–339. [DOI] [PubMed] [Google Scholar]
- 13.Krafft A.E., Duncan,B.W., Bijwaard,K.E., Taubenberger,J.K. and Lichy,J.H. (1997) Optimization of the isolation and amplification of RNA from formalin-fixed, paraffin-embedded tissue: The Armed Forces Institute of Pathology Experience and Literature Review. Mol. Diagn., 2, 217–230. [DOI] [PubMed] [Google Scholar]
- 14.Sabatti C., Karsten,S.L. and Geschwind,D.H. (2002) Thresholding rules for recovering a sparse signal from microarray experiments. Math. Biosci., in press. [DOI] [PubMed] [Google Scholar]
- 15.Tseng G., Oh,M.-K., Rohlin,L., Liao,J. and Wong,W.H. (2001) Issues in cDNA microarray analysis: quality filtering, channel normalization, models of variation and assessment of gene effects. Nucleic Acids Res., 29, 2549–2557. [DOI] [PMC free article] [PubMed] [Google Scholar]
- 16.Masuda N., Ohnishi,T., Kawamoto,S., Monden,M. and Okubo,K. (1999) Analysis of chemical modification of RNA from formalin-fixed samples and optimization of molecular biology applications for such samples. Nucleic Acids Res., 27, 4436–4443. [DOI] [PMC free article] [PubMed] [Google Scholar]
- 17.Giannella C., Zito,F.A., Colonna,F., Paradiso,A., Marzullo,F., Alaibac,M. and Schittulli,F. (1997) Comparison of formalin, ethanol and Histochoice fixation on the PCR amplification from paraffin-embedded breast cancer tissue. Eur. J. Clin. Chem. Clin. Biochem., 35, 633–635. [PubMed] [Google Scholar]
- 18.Williams C., Ponten,F., Moberg,C., Soderkvist,P., Uhlen,M., Ponten,J., Sitbon,G. and Lundeberg,J. (1999) A high frequency of sequence alterations is due to formalin fixation of archival specimens. Am. J. Pathol., 155, 1467–1471. [DOI] [PMC free article] [PubMed] [Google Scholar]
- 19.Geschwind D.H. (2001) Sharing gene expression data: an array of options. Nature Rev. Neurosci., 2, 436–438. [DOI] [PubMed] [Google Scholar]


