Correction to: Scientific Reports 10.1038/srep17499, published online 07 December 2015
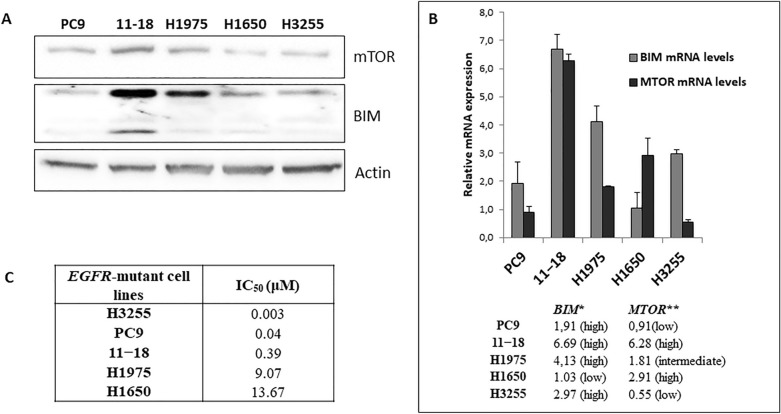
This Article contains an error in Figure 3A, where the mTOR panel is an inadvertent duplication of the BIM panel.
The corrected Figure 3 and accompanying legend appear below.
Figure 3.
The IC50 values for gefitinib in EGFR-mutant lung adenocarcinoma cell lines are associated with basal BIM and mTOR expression (protein or mRNA). (a) mTOR and BIM expression in EGFR-mutant lung adenocarcinoma cell lines. Lysates were prepared and run on gels for western blot with specific antibodies. Actin was used as the loading control. Among the three sensitive EGFR-mutant lung adenocarcinoma cell lines, H3255, PC-9 and 11–18, 11–18 is the one with the highest mTOR and BIM protein expression. (b) MTOR and BIM mRNA expression in EGFR-mutant lung adenocarcinoma cell lines by qRT-PCR normalized to β-actin. Among the three sensitive EGFR-mutant lung adenocarcinoma cell lines, H3255, PC-9 and 11–18, 11–18 has the highest MTOR and BIM mRNA expression. PC-9, 11–18 and H1975 cells have high BIM mRNA expression. H1650 cells have low BIM mRNA expression. The two gefitinib resistant EGFR-mutant lung adenocarcinoma cell lines, H1975 and H1650, have intermediate and high MTOR mRNA expression levels, respectively. Values are the mean ± standard deviation of triplicate experiments. *BIM low, < 1.83; BIM intermediate, 1.83–2.96; BIM high, > 2.96; MTOR low, < 0.91; **MTOR intermediate, 0.91–1.97; and MTOR high, > 1.97. Error bars indicate the standard deviation. (c) The IC50 values for gefitinib increase in the three sensitive EGFR-mutant lung adenocarcinoma cell lines, H3255, PC-9 and 11–18, as mTOR expression increases (protein or mRNA). 11–18 are sensitive cells with the highest mTOR expression and IC50 value for gefitinib 0.39 μM, a concentration more than 100-fold higher compared to H3255 cells that have the lowest mTOR expression and are hypersensitive to gefitinib (IC50 0.003 μM).
In addition, the Supplementary Information file published with this Article contains an error in Supplementary Figure 3A, where the mTOR panel is inadvertently duplicated from the BIM panel. The corrected Supplementary Information file is provided below.
Supplementary Information
Supplementary Information
The online version contains supplementary material available at 10.1038/s41598-023-30374-9.
Associated Data
This section collects any data citations, data availability statements, or supplementary materials included in this article.


