Abstract
Oxidative DNA damage, linked pathogenically to a variety of diseases such as cancer and ageing, can be investigated by measuring specific DNA repair products in urine. Within the last decade, since it was established that such products were excreted into urine, progress in their analysis in urine has been limited. Guanine is the DNA base most prone to oxidation. We present a method for determination of the urinary 8-hydroxylated species of guanine, based on direct injection of urine onto a high-performance liquid chromatography (HPLC)–tandem mass spectrometry system. The analysis covers the 8-hydroxylated base, ribonucleoside and deoxynucleoside, and the corresponding non-oxidised species. Without pre-treatment of urine the detection limits for the nucleobases are ∼2 nM (50 fmol injected) and for the nucleosides ∼0.5 nM (12.5 fmol injected). Previously, liquid chromatography of the nucleobases has been problematic but is made possible by low-temperature reverse-phase C18 chromatography, a method that increases retention on the column. In the case of the nucleosides, retention was almost total and provides a means for on-column concentration of larger urine samples and controlled high peak gradient elution. The total excretion of 8-hydroylated guanine species was 212 nmol/24 h. The oxidised base accounted for 64%, the ribonucleoside for 23% and the deoxynucleoside for 13%, indicating substantial oxidation of RNA in humans. In rat urine, excretion of the oxidised base was more dominant, the percentages of the oxidised base, ribonucleoside and deoxynucleosides being 89, 8 and 3%. This finding is at odds with previous reports using immunoaffinity pre-purification and HPLC–electrochemical detection analysis. The developed method now makes it possible to measure oxidative nucleic acid stress to both RNA and DNA in epidemiological and intervention settings, and our findings indicate a substantial RNA oxidation in addition to DNA oxidation. The small volume needed also makes the method applicable to small experimental animals.
INTRODUCTION
Oxidative damage to DNA is a major endogenous (1) type of damage proposed pathogenic for a variety of diseases, including cancer (2,3), ageing (2–4) and neuro-degeneration (5). Also, a variety of processes, e.g. UV radiation (6,7), ionising radiation (8), environmental influences like tobacco smoking (9) and diesel exhaust (10) induce such DNA modifications. The oxidation of RNA seems to play as important a role as oxidation of DNA (5,11) but has not been investigated to the same extent since only indirect or very complicated methods have been readily available.
From a chemical analytical point of view the analysis of oxidative DNA products excreted into urine is a difficult task that requires elaborate separation techniques combined with a specific and sensitive detection system because the matrix is very complex and the concentrations are in the low nanomolar range.
Analysis of oxidative DNA repair products in urine has been almost exclusively restricted to measurement of 8-hydroxylated deoxyguanosine due to its electrochemical property (12–14). A combination of gas chromatography–mass spectrometry (GC–MS) and high-performance liquid chromatography (HPLC) (15) have been needed to measure five different products in urine, and recently we have described a HPLC–tandem mass spectrometry (MS/MS) method that can measure two different deoxynucleoside repair products (16), one of which turned out not to be present in biological samples and therefore not of biological relevance.
In the last 10 years these methods seem to be the only analytical progress in urinary measurements of oxidative DNA modification, still the oxidative DNA modification in vitro numbers 100 or more different species (17,18).
GC–MS analysis has mainly been used to describe changes in nuclear DNA. The method is based on hydrolysis to the base level followed by derivatisation and can thus only distinguish between RNA and DNA nucleosides if prior separation is performed by HPLC (15). Liquid chromatography of the oxidised base has not been solved satisfactorily because of early elution and multiple interfering substances in urine, and has only been possible after extensive immunoaffinity clean-up/concentration with a radiolabelled standard to estimate losses (19,20). As indicated in later work (21) analysis of the oxidised base 8-oxo-guanine (8-oxoGua) in urine presents particular difficulties and the previous methods require modification. In this work, we report that by the use of HPLC, low-temperature chromatography and MS/MS it is possible to analyse all types of 8-hydroxylated guanine modifications in urine, i.e. the oxidised base, the oxidised deoxyribonucleoside and the oxidised ribonucleoside together with the corresponding non-oxidised species in a single run and without any sample pre-treatment. This provides considerable progress in the analysis of urinary DNA repair products, and since it only requires small volumes of urine and no pre-treatment or pre-purification steps it can be used to study both humans and small experimental animals.
MATERIALS AND METHODS
Chemicals
Guanine (Gua), 2′-deoxyguanosine (dG), guanosine (Guo) and 8-oxoGua were purchased from Sigma (St Louis, MO). 8-oxo-2′-deoxyGuanosine (8-oxodG) was purchased from Berry and Associates (Dexter, MI). 8-oxo-Guanosine (8-oxoGuo) was purchased from Calbiochem (La Jolla, CA). The 8-oxoGuo turned out to contain a high percentage of Guo. Thus, the 8-oxoGuo was purified by HPLC from which the 8-oxoGuo fraction was collected. The concentration of analyte in this fraction was measured by UV absorbance for use as standards. [15N5]8-oxodG and [M+4]8-oxoGuo were synthesised by Dr Ravanat (CEA, Grenoble). [15N5]dG, [15N5]Guo, [13C, 15N2]Gua and [13C, 15N2]8-oxoGua were purchased from Cambridge Iso-tope Laboratories (Andover, MA).
A stock solution of 8-oxoGua was prepared and handled according to the procedure described by Hamberg and Zhang (22). The 8-oxoGua solution must be prepared at weekly intervals. The concentration was checked by UV absorbance each day since we found occasional precipitation resulting in a lower concentration than expected. A Gua stock solution was prepared by dissolving Gua in 0.05 M HCl. The dissolution requires prolonged gentle heating.
Apparatus
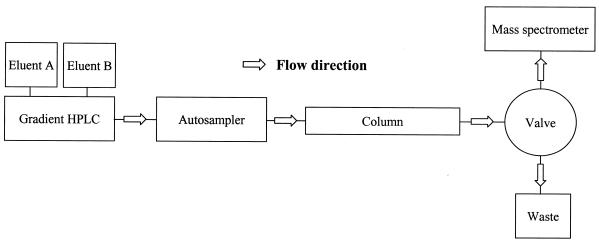
A Perkin Elmer Series 200 HPLC equipped with two pumps, autosampler, solvent cabinet and vacuum degasser (Perkin Elmer, Norwalk, CT) was used. The HPLC was fully controlled by the mass spectrometer: a Sciex API 3000 triple quadrupole mass spectrometer with a turboionspray source and controlled by Analyst software version 1.1 (Sciex, Thornill, Canada). A fully automated software controlled Valco two position valve controlled by an EHMA microelectric actuator (Valco International, Schenkon, Switzerland) was used to divert the eluent fractions that contained the analytes into the mass spectrometer. The early eluting components were diverted to waste, thereby reducing contamination of the ion source (Fig. 1).
Figure 1.
HPLC–MS/MS set-up. The valve diverts only the fraction that contains the analytes into the mass spectrometer.
The column used was a Phenomenex Prodigy ODS HPLC column (100 × 2 mm, 3 µ) protected with a C18 (ODS) guard column (4 × 2 mm) both obtained from Phenomenex (Torrance, CA). The mobile phase was: eluent A, 10 mM ammonium formate, adjusted to pH 3.75 with formic acid; eluent B, 10 mM ammonium formate, adjusted to pH 3.75 with formic acid + 10% acetonitrile.
The flow rate was 200 µl/min and the injection volume was 25 µl. The separation started with isocratic elution (100% eluent A) for 10 min followed by a 5 min gradient to 20% eluent B. Then, a 28 min gradient to 31.2% eluent B. Finally the column was subjected to isocratic elution with 100% eluent B for 8 min. The separation was performed at 1°C because it was discovered that at this temperature the nucleosides and deoxynucleosides were fully retained on the column and that the retention of the nucleobases was considerably increased. This made it possible to separate the nucleobases from the urine salts that depress their ionisation. The eluents were diverted to waste for the first 10 min of the run.
Between each run the column was equilibrated with 100% A for 25 min. Electrospray ionisation was performed in the positive ion mode. For all analytes the [M+H]+ was selected by the first mass filter. After collision activation the ions corresponding to the protonated nucleobase [BH2]+ were selected by the last mass filter for the nucleosides and the deoxynucleosides. For the nucleobases the transition m/z 152–110 was used for Gua and m/z 168–112 was used for 8-oxoGua. Nitrogen was used as nebulizer, curtain, heater (7.5 l/min) and collision gas. The electrospray probe temperature was 450°C. Individual tuning files were used for all the analytes to achieve maximum sensitivity. According to this, the potentials, collision gas pressure and the flow of the gasses to the ion source were changed during each run. In order to remove contributions from other compounds ‘high resolution mode’ was used in both the first quadrupole (Q1) and the third quadrupole (Q3) for all the analytes.
Sample preparation
A solution containing Gua, 8-oxoGua, dG, 8-oxodG, Guo and 8-oxoGuo labelled with stable isotopes was added to a 100 mM lithium acetate buffer pH 6.4.
The frozen urine collected in a previous study (23) was thawed and diluted 1:1 with the buffer containing the internal standards. A possible precipitate containing the analytes was re-dissolved by heating to 37°C for 10 min and Whirly mixed before the samples were centrifuged at 5000 g for 10 min. This procedure is known to release 8-oxodG (24) and 8-oxoGua (21) from precipitate.
Addition of the buffer to the samples resulted in a final concentration of 50 nM of each of the labelled standards in the sample except for the Gua standard where a concentration of 500 nM was used.
RESULTS
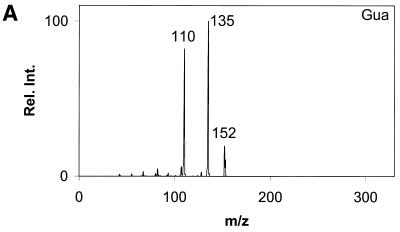
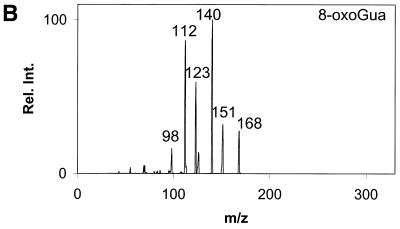
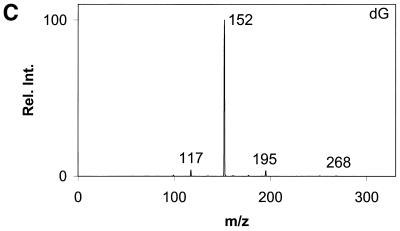
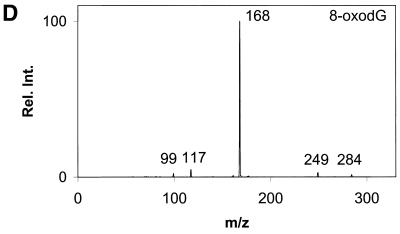
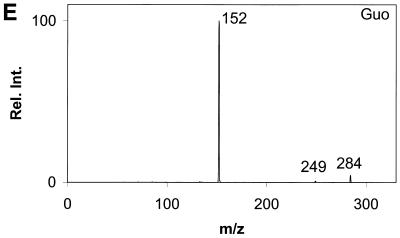
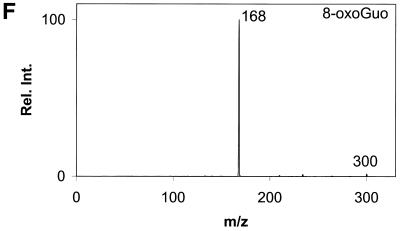
Daughter ion spectra of the six analytes are shown in Figure 2A–F.
Figure 2.
Daughter ion spectra of [M+H]+ of (A) Gua, (B) 8-oxoGua, (C) dG, (D) 8-oxodG, (E) Guo and (F) 8-oxoGuo. The spectra are recorded by selecting the pseudo molecular ion ([M+H]+) in the first quadrupole (Q1). After collision activation of the selected ions in the collision cell, the daughter ion spectra are recorded by scanning the last quadrupole (Q3).
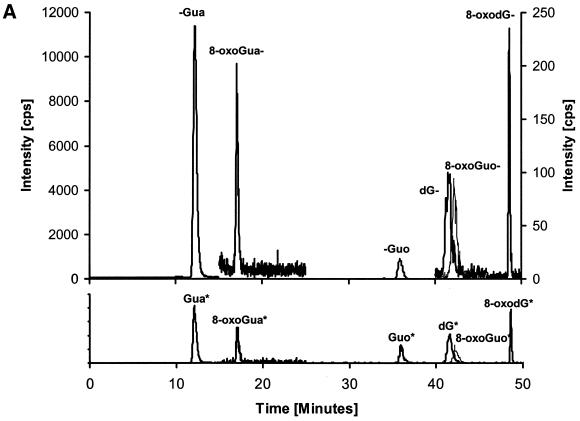
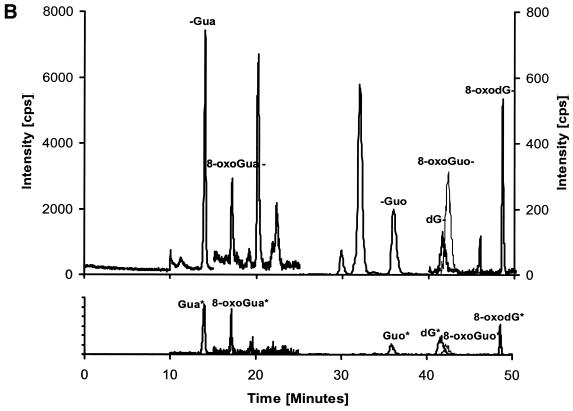
An HPLC–MS/MS chromatogram of the six analytes is shown in Figure 3A together with chromatograms of a urine sample (Fig. 3B). Each chromatogram is divided into four time windows in order to reduce the number of ions measured at any given time. Increased measuring time for each multiple reaction monitoring (MRM) pair results in increased signal to noise ratio. From the chromatograms it appears that the run time could be divided into five time windows. However, by using five time windows a change in retention time could cause some of the peaks to miss their time window. By using only four time windows this risk is eliminated. The settings for each time window are shown in Table 1.
Figure 3.
HPLC–MS/MS chromatograms. Each chromatogram is divided into four time windows. Time window 1 shows the 152/110 transitions corresponding to Gua, window 2 shows the 168/112 transitions corresponding to 8-oxoGua. Time window 3 shows the 284/152, 300/168 and 268/152 transitions corresponding to Guo, 8-oxoGuo and dG, respectively. Time window 4 shows the 284/168 transitions corresponding to 8-oxodG. (A) 10 µM standard of Gua, 8-oxoGua, dG, 8-oxodG, Guo and 8-oxoGuo. (B) Human urine sample. The peaks for 8-oxoGuo and dG are not resolved in time, but they are separated by mass.
Table 1. Time window setting for HPLC–MS/MS analysis of oxidised and non-oxidised guanine forms.
| Time window | Time frame (min) | MRM pairs | Qualifier MRM pairs | Internal standard MRM pairs | Compound |
|---|---|---|---|---|---|
| 1 | 0–15 | 152/110 | 152/82 | 155/113 | Gua |
| 2 | 15–25 | 168/112 | 168/140 | 171/114 | 8-oxoGua |
| 3 | 25–46 | 284/152 | 289/157 | Guo | |
| 300/168 | 304/172 | 8-oxoGuo | |||
| 268/152 | 273/157 | dG | |||
| 4 | 46–50 | 284/168 | 289/173 | 8-oxodG |
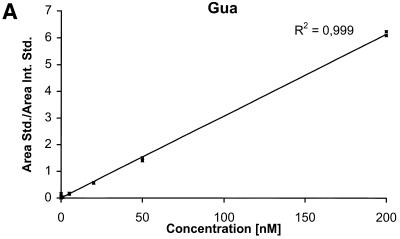
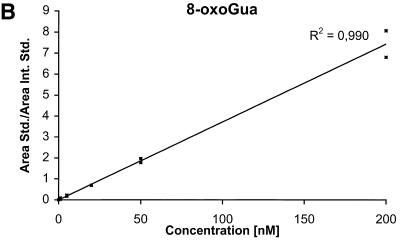
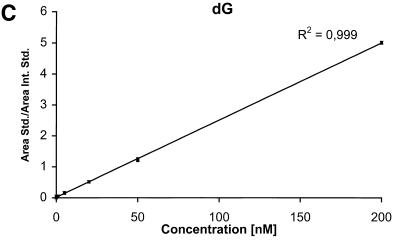
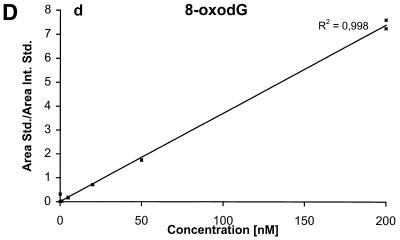
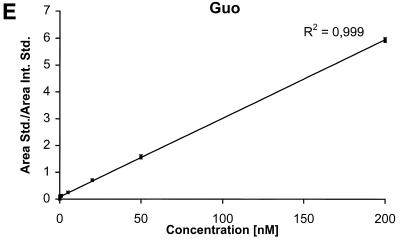
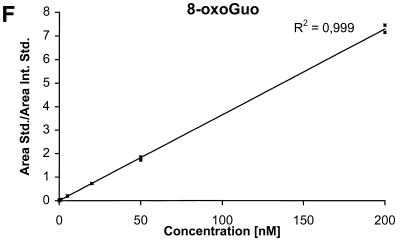
The detection limits (S/N = 3) for the nucleobases are ∼2 nM corresponding to 50 fmol injected and the detection limits for the nucleosides and the deoxynucleosides are ∼0.5 nM corresponding to 12.5 fmol injected. The calibration curves for the six components are shown in Figure 4A–F.
Figure 4.
Calibration curves obtained by plotting the ratio between the area of the analyte peak divided by the area of the internal standard peak as a function of the analyte concentration. Calibration curve for (A) Gua, (B) 8-oxoGua, (C) dG, (D) 8-oxodG, (E) Guo and (F) 8-oxoGuo.
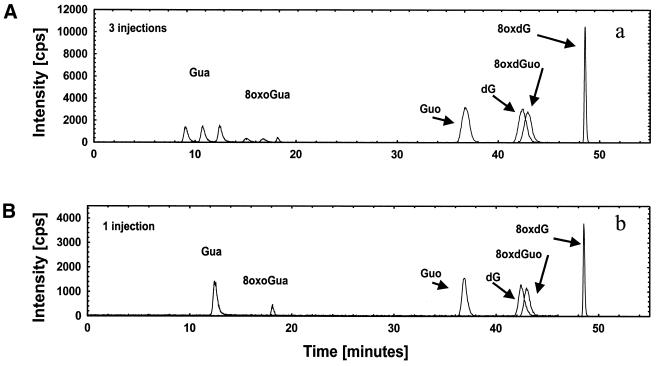
The high-affinity binding of the nucleosides and deoxynucleosides to the column at 1°C is shown in Figure 5. After three injections of the same sample separated by 1 min at 100% eluent A the nucleosides and deoxynucleosides can be eluted by the gradient as single peaks with unchanged shape and approximately two to three times the area and peak-height as for one injection. The oxidised and non-oxidised guanines do not adhere to the column to the same extent and are eluted as separate peaks for each injection.
Figure 5.
On-column concentration. (A) Three injections (1 min in between). (B) One injection. Three injections results in three peaks for each of the nucleobases, which shows that they cannot be concentrated on-column. The peak heights for Guo, 8-oxoGuo and dG are increased 2–2.5 times after triple injection [compare (A) and (B)]. This shows that the sensitivities for Guo, 8-oxoGuo and dG can be increased upon multiple injections, but Gua and 8-oxoGua are not fully retained on the column during injection. For 8-oxodG the peak height is approximately three times the single injection peak height, which shows that it is fully retained on the column during injection, and that it can be fully concentrated on-column.
Total excretion into 24 h urine in 20 human volunteers of the 8-hydroxylated guanine species was 212 nmol/24 h (95% CI: 178–248 nmol/24 h). The excretion rates are given in Table 2.
Table 2. Urinary excretion of guanine species, non-oxidised and 8-oxo form in 20 normal humans.
| Guaninea | Guanosinea | Deoxyguanosinea | |
|---|---|---|---|
| Non-oxidised | 1931 ± 182 | 380 ± 39 | 12 ± 2 |
| 8-oxo form | 136 ± 12 | 48 ± 6 | 28 ± 2 |
aValues in nmol/24 h (mean ± SD).
Each sample was analysed once. The coefficient of variation of single repeated analysis of a human urine (intra batch CV%) was 1.7, 4.0, 2.1, 4.6, 3.7 and 4.8% for Gua, 8-oxoGua, Guo, 8-oxoGua, dG and 8-oxodG, respectively. The day-to-day variation was, respectively, 3.3, 6.4, 2.7, 3.9, 5.4 and 7.4%.
The concentrations of the oxidised guanine species in rat urine were: 8-oxoGua, 427 ± 157; 8-oxoGuo, 39 ± 7; 8-oxodG, 15 ± 5 nmol/l (N = 6, samples from female Wistar rats in an unpublished inter-laboratory comparison).
DISCUSSION
Quantification of all 8-hydroxylated forms of guanine in urine has not progressed since Ames and co-workers (19,20) described an immunoaffinity pre-purification, HPLC–electrochemical (EC) method with radiolabelled internal standard. In this paper, we have described a method based on HPLC–MS/MS where the oxidised base (8-oxoGua), ribonucleoside (8-oxoGuo) and deoxynucleoside (8-oxodG) can be measured on small urine volumes without pre-treatment and in a single run. In addition, the non-oxidised guanine species can be measured. This progress is based on tandem mass spectrometry and the discovery that low-temperature reversed-phase liquid chromatography dramatically increases the chromatographic affinity of the oxidised bases and nucleosides. This makes it possible to overcome the complicated and tedious immunoaffinity clean-up procedure. The high affinity of the nucleoside forms provides efficient retention on C18 reversed-phase columns and thereby provides a means to concentrate these analytes on-column to increase sensitivity, however, at the cost of increased sample volume. In case of the oxidised base full retention was not achieved.
In healthy humans the total excretion of 8-hydroxylated guanine modifications was 212 nmol/24 h, the oxidised base accounted for 64%, the ribonucleoside for 23% and the deoxynucleoside for 13%. In the paper by Ames and co-workers (20) they found a concentration ratio of 1:2 of 8-oxodG:8-oxoGuo in human urine whereas they did not report on 8-oxoGua. Also, they reported an excretion of 8-oxodG of 172 pmol/kg/day in contrast to our finding of ∼400 pmol/kg/day (28 nmol/24 h). Moreover, in the case of excretion of the modified guanine species into rat urine they found a ratio of 8:136:1 (8-oxoGuo:8-oxoGua:8-oxodG), which is quite different from that found by our technique (28:2.5:1). The reason for these differences cannot be decided for certain but may be explained by lack of specificity of the antibody or to the difference in the correction for loss of analyte on the antibody column by radiolabelled standards. We used internal heavy-labelled standards added directly to the urine sample and no other pre-analysis steps. Furthermore, data from Professor Ryzard Olinski’s laboratory (personal communication; 25) from a HPLC pre-purification-GC–MS method show urinary excretion of 8-oxoGua exactly corresponding to our data (130 nmol/24 h, our data 136 nmol/24 h) but slightly higher excretion of the 8-oxodG than our finding (mean 58 nmol/24 h, our data 28 nmol/24 h). The discrepancies in these findings are minor and may be attributable to experimental variation and differences in population and exposures and in no way resemble the controversies about the levels of oxidative modifications in DNA or mtDNA that runs into 1000-fold differences as reviewed recently by Beckman and Ames (4) or to the difference to the immunoaffinity-based analysis. Collectively, the urinary excretion data indicate oxidative stress in humans to both DNA and RNA at considerable rates. Since the 8-oxoGua can originate from RNA or DNA it is presently not clear whether RNA or DNA is oxidised the most, but clearly a substantial RNA oxidation takes place.
We have previously argued that the urinary excretion of 8-oxodG, and possibly other DNA oxidation products, can be used as biomarkers of oxidative stress. The previous methods for analysing 8-oxodG in urine by HPLC–EC (9,24) require a complicated multi-column set-up and multiple runs per sample and are limited to 8-oxodG analysis. Alternative methods require extensive clean up of urine or elaborate procedures, e.g. HPLC pre-purification and derivatisation before GC–MS. The levels of 8-oxodG in urine have mainly been measured by HPLC–EC (9,21,24,26–30). The sensitivity obtained by using the current HPLC–MS/MS method is at the same level as that for the best of the HPLC–EC methods, and may be assumed to have better specificity. Furthermore, the possibility of using stable isotope-labelled internal standards in mass spectrometry (isotope dilution) adds increased reliability to the method. In the method described in this paper, 15N- and 13C-labelled internal standards were used. Their behaviour is almost identical to the non-labelled compounds in contrast to the behaviour of deuterated ones, providing an optimum internal standard without the risk of hydrogen exchange resulting in loss of deuterium. Since the analyte and the internal standard should behave chemically identically, the internal standard can be used to compensate for losses during sample preparation and to compensate for variation and suppression of ionisation. The internal standards also show the same retention times as the analytes, and thus can be used to validate retention time. The performance of the assay is satisfactory and long automated runs can be analysed.
Measurement of DNA oxidation products by HPLC–MS has usually been at the deoxynucleoside level (these usually give better sensitivity than the nucleobases in HPLC–MS/MS). However, as the nucleobases are normally found in higher concentrations than deoxynucleosides in urine, it is possible to measure these as well, even though the MS/MS sensitivity of the nucleobase is only one-fourth of that of the deoxynucleoside and the nucleoside.
Oxidation of the analytes may take place during the ionisation. Because of this, separation of the analytes before mass analysis is necessary to avoid artefacts. From the chromatogram in Figure 3A it can be seen that the peaks corresponding to 8-oxoGuo and dG are not resolved in time. However, from the MRM pairs (Table 1, window 3), it can be seen, that both masses in Q1 and Q3 are different. Indeed, for such a false positive to occur, dG would have to be oxidised in both the base and the deoxyribose during ionisation to give a response corresponding to 8-oxoGuo. As a control 100 µM standards of the two analytes were injected, but no trace of the other analyte was observed, showing that such a problem did not occur.
During electrospray ionisation [M+H]+ ions for all the analytes are formed in the ion source. In the mass spectra no other intense ions were observed. Negative ion mode detection was also attempted, but resulted in lower sensitivity (data not shown).
The [M+H]+ ions are selected in the first mass filter. Upon collision activation of the [M+H]+ ions the nucleosides and the deoxynucleosides show the same type of fragmentation, where the N-glycosidic bond is broken. Intense peaks corresponding to [BH2]+ which stems from loss of the neutral 2′-deoxyribose moiety (116u) or ribose moiety (132u) are observed. A small peak at m/z 117 from the protonated 2′-deoxyribose is also observed for the deoxynucleosides (Fig. 2C and D) and, in addition, 8-oxodG shows small peaks from loss of water and ammonia. This fragmentation pathway has previously been observed for 2′-deoxynucleosides (31–34). The nucleobases show a more complicated fragmentation pattern upon collision activation. The observed losses are mainly due to loss of combinations of 17u (NH3), 28u (CO) and 42u (CNO) (Fig. 2A and B).
In order to obtain maximum sensitivity and selectivity it was decided to use MRM for the measurement of the six analytes. For all analytes the most intense peak in the MS/MS spectrum was selected in Q3, with the exception of Gua and 8-oxoGua. In the Gua MS/MS spectrum the most intense fragment stems from loss of 17u corresponding to loss of NH3. As this was assumed to be a non-specific fragmentation, the transition to the second most intense fragment (loss of 42u) was used instead. In the 8-oxoGua MS/MS spectrum the most intense fragment stems from loss of 28u. By using this fragment overlapping peaks appeared in the urine chromatograms. Because of this the second most intense MRM pair had to be used (m/z 168/112). By using more than one product ion for each analyte more specificity can be gained; however, this comes at the expense of sensitivity. The mass loss 116u for the deoxynucleosides and the mass loss 132u for the nucleosides were considered to be quite specific and as the second most intense ion was considerably less intense no qualifier ion was used. The losses for Gua, mass loss 42u, and 8-oxoGua, mass loss 56u, were not considered to be sufficiently specific. Because of this a qualifier ion was introduced for each compound. The appearance of this with identical retention time together with the correct ratio between the MRM pairs results in increased specificity. The MRM ion pairs used are shown in Table 1 together with the corresponding ions for the stable isotope-labelled internal standards.
The dwell time on the analytes was set to four times the dwell time on the internal standards, to obtain maximum measuring time on the analytes, and to increase their signal to noise ratio. Individual tune files for each analyte were used in each of the time windows. This also increased the sensitivity. The ‘high resolution mode’ of the Sciex API 3000 had to be used since ‘standard resolution’ resulted in interfering signals from ‘neighbour’ masses.
CONCLUSION
The presented HPLC–MS/MS method shows sensitivity comparable with the best HPLC–EC methods. Very little progress has been made during the last 10 years since it was established that DNA repair products from oxidation are excreted into urine. The methodology presented represents progress by providing analysis of several species, with potential for including even other base oxidation products (increased sensitivity from concentration of modified nucleoside by low-temperature reversed-phase chromatography), lack of pre-purification or derivatisation procedures, and quantification by the use of stable isotope-labelled internal standards (isotope dilution). By switching two columns between gradient run and re-equilibration it is possible to reduce the effective analysis time by a factor of about two.
In humans the method has provided evidence that both DNA and RNA is subjected to oxidative stress, and provides a means of more in-depth studies of oxidative stress in humans and small experimental animals in vivo.
Acknowledgments
ACKNOWLEDGEMENTS
This work was supported by The Danish Medical Research Council, European Framework V Project DNAge (contract no. QLK6-CT-1999-02002) and European Framework V Project GENERALE (contract no. QLRT-1999-02111).
REFERENCES
- 1.Chance B., Sies,H. and Boveris,A. (1979) Hydroperoxide metabolism in mammalian organs. Physiol. Rev., 59, 527–605. [DOI] [PubMed] [Google Scholar]
- 2.Halliwell B. and Gutteridge,J.M.C. (1989) Free Radicals in Biology and Medicine. Clarendon Press, Oxford, Vol. 2, pp. 1–543.
- 3.Halliwell B. (1999) Oxygen and nitrogen are pro-carcinogens. Damage to DNA by reactive oxygen, chlorine and nitrogen species: measurement, mechanism and the effects of nutrition. Mutat. Res., 443, 37–52. [DOI] [PubMed] [Google Scholar]
- 4.Beckman K.B. and Ames,B.N. (1999) Endogenous oxidative damage of mtDNA Mutat. Res., 424, 51–58. [DOI] [PubMed] [Google Scholar]
- 5.Zhang J., Perry,G., Smith,M.A., Robertson,D., Olson,S.J., Graham,D.G. and Montine,T.J. (1999) Parkinson’s disease is associated with oxidative damage to cytoplasmic DNA and RNA in substantia nigra neurons. Am. J. Pathol., 154, 1423–1429. [DOI] [PMC free article] [PubMed] [Google Scholar]
- 6.Delatour T., Douki,T., Gasparutto,D., Brochier,M.-C. and Cadet,J. (1998) A novel vicinal lesion obtained from the oxidative photosensitization of TpdG: characterization and mechanistic aspects. Chem. Res. Toxicol., 11, 1005–1013. [DOI] [PubMed] [Google Scholar]
- 7.Douki T., Court,M. and Cadet,J. (2000) Electrospray-mass spectrometry characterization and measurement of far-UV-induced thymine photoproducts. J. Photochem. Photobiol. B, 54, 145–154. [DOI] [PubMed] [Google Scholar]
- 8.Frelon S., Douki,T., Ravanat,J.-L., Pouget,J.-P., Tornabene,C. and Cadet,J. (2000) High performance liquid chromatography–tandem mass spectrometry measurement of radiation-induced base damage to isolated and cellular DNA. Chem. Res. Toxicol., 13, 1002–1010. [DOI] [PubMed] [Google Scholar]
- 9.Loft S., Vistisen,K., Ewertz,M., Tjonneland,A., Overvad,K. and Poulsen,H.E. (1992) Oxidative DNA damage estimated by 8-hydroxydeoxyguanosine excretion in humans: influence of smoking, gender and body mass index. Carcinogenesis, 13, 2241–2247. [DOI] [PubMed] [Google Scholar]
- 10.Loft S., Poulsen,H.E., Vistisen,K. and Knudsen,L.E. (1999) Increased urinary excretion of 8-oxo-2′-deoxyguanosine, a biomaker of oxidative DNA damage, in urban bus drivers. Mutat. Res., 441, 11–19. [DOI] [PubMed] [Google Scholar]
- 11.Nunomura A., Perry,G., Pappolla,M.A., Wade,R., Hirai,K., Chiba,S. and Smith,M.A. (1999) RNA oxidation is a prominent feature of vulnerable neurons in Alzheimer’s disease. J. Neurosci., 19, 1959–1964. [DOI] [PMC free article] [PubMed] [Google Scholar]
- 12.Floyd R.A., Watson,J.J. and Wong,P.K. (1984) Sensitive assay of hydroxyl free radical formation utilizing high pressure liquid chromatography with electrochemical detection of phenol and salicylate hydroxylation products. J. Biochem. Biophys. Methods, 10, 221–235. [DOI] [PubMed] [Google Scholar]
- 13.Kasai H., Tanooka,H. and Nishimura,S. (1984) Formation of 8-hydroxyguanine residues in DNA by x-radiation. Gann, 75, 1037–1039. [PubMed] [Google Scholar]
- 14.Kasai H. (1997) Analysis of a form of oxidative DNA damage, 8-hydroxy-2′-deoxyguanosine, as a marker of cellular oxidative stress during carcinogenesis. Mutat. Res., 387, 147–163. [DOI] [PubMed] [Google Scholar]
- 15.Ravanat J.L., Guicherd,P., Tuce,Z. and Cadet,J. (1999) Simultaneous determination of five oxidative DNA lesions in human urine. Chem. Res. Toxicol., 12, 802–808. [DOI] [PubMed] [Google Scholar]
- 16.Weimann A., Belling,D. and Poulsen,H.E. (2001) Measurement of 8-oxo-2-deoxyguanosine and 8-oxo-2-deoxyadenosine in DNA and human urine by high performance liquid chromatography–electrospray tandem mass spectrometry. Free Radic. Biol. Med., 30, 757–764. [DOI] [PubMed] [Google Scholar]
- 17.Dizdaroglu M. (1991) Chemical determination of free radical-induced damage to DNA. Free Radic. Biol. Med., 10, 225–242. [DOI] [PubMed] [Google Scholar]
- 18.Dizdaroglu M. (1994) Chemical determination of oxidative DNA damage by gas chromatography-mass spectrometry. Methods Enzymol., 234, 3–16. [DOI] [PubMed] [Google Scholar]
- 19.Park E.M., Shigenaga,M.K., Degan,P., Korn,T.S., Kitzler,J.W., Wehr,C.M., Kolachana,P. and Ames,B.N. (1992) Assay of excised oxidative DNA lesions: isolation of 8-oxoguanine and its nucleoside derivatives from biological fluids with a monoclonal antibody column. Proc. Natl Acad. Sci. USA, 89, 3375–3379. [DOI] [PMC free article] [PubMed] [Google Scholar]
- 20.Shigenaga M.K., Gimeno,C.J. and Ames,B.N. (1989) Urinary 8-hydroxy-2′-deoxyguanosine as a biological marker of in vivo oxidative DNA damage. Proc. Natl Acad. Sci. USA, 86, 9697–9701. [DOI] [PMC free article] [PubMed] [Google Scholar]
- 21.Helbock H.J., Beckman,K.B., Shigenaga,M.K., Walter,P.B., Woodall,A.A., Yeo,H.C. and Ames,B.N. (1998) DNA oxidation matters: the HPLC–electrochemical detection assay of 8-oxo-deoxyguanosine and 8-oxo-guanine. Proc. Natl Acad. Sci. USA, 95, 288–293. [DOI] [PMC free article] [PubMed] [Google Scholar]
- 22.Hamberg M. and Zhang,L.Y. (1995) Quantitative determination of 8-hydroxyguanine and guanine by isotope dilution masss spectrometry. Anal. Biochem., 229, 336–344. [DOI] [PubMed] [Google Scholar]
- 23.Salonen J., Nyyssonen,K., Salonen,R., Lakka,H.M., Kaikkonen,J., Porkkala-Sarataho,E., Voutilainen,S., Lakka,T.A., Rissanen,L., Leskinen,L. et al. (2000) Antioxidant Supplementation in Atherosclerosis Prevention (ASAP) study: a randomized trial of the effect of vitamins E and C on 3-year progression of carotid atherosclerosis. J. Intern. Med., 248, 377–386. [DOI] [PubMed] [Google Scholar]
- 24.Bogdanov M.B., Beal,M.F., McCabe,D.R., Griffin,R.M. and Matson,W.R. (1999) A carbon column-based liquid chromatography electrochemical approach to routine 8-hydroxy-2′-deoxyguanosine measurements in urine and other biologic matrices: a one-year evaluation of methods. Free Radic. Biol. Med., 27, 647–666. [DOI] [PubMed] [Google Scholar]
- 25.Gackowski D. et al.Free Radic. Res., in press. [DOI] [PubMed] [Google Scholar]
- 26.Dykens J.A. and Baginski,T.J. (1995) Urinary 8-hydroxydeoxyguanosine excretion as a non-invasive marker of neutrophil activation in animal models of inflammatory bowel disease. Scand. J. Gastroenterol., 33, 628–636. [DOI] [PubMed] [Google Scholar]
- 27.Germadnik D., Pilger,A. and Rudiger,H.W. (1997) Assay for the determination of urinary 8-hydroxy-2′-deoxyguanosine by high-performance liquid chromatography with electrochemical detection. J. Chromatogr. B Biomed. Sci. Appl., 689, 399–403. [DOI] [PubMed] [Google Scholar]
- 28.Long L., McCabe,D.R. and Dolan,M.E. (1999) Determination of 8-oxoguanine in human plasma and urine by high-performance liquid chromatography with electrochemical detection. J. Chromatogr. B Biomed. Sci. Appl., 731, 241–249. [DOI] [PubMed] [Google Scholar]
- 29.Sumida S., Okamura,K., Doi,T., Sakurai,M., Yoshioka,Y. and Sugawa-Katayama,Y. (1997) No influence of a single bout of exercise on urinary excretion of 8-hydroxy-deoxyguanosine in humans. Biochem. Mol. Biol. Int., 42, 601–609. [DOI] [PubMed] [Google Scholar]
- 30.Tagesson C., Kallberg,M. and Leanderson,P. (1992) Determination of urinary 8-hydroxydeoxyguanosine by coupled-column high-perfomance liquid chromatography with electrochemical detection: a noninvasive assay for in vivo oxidative DNA damage in humans. Toxicol. Methods, 1, 242–251. [Google Scholar]
- 31.Annan R.S., Giese,R.W. and Vouros,P. (1990) Detection and structural characterization of amino polyaromatic hydrocarbon-deoxynucleoside adducts using fast atom bombardment and tandem mass spectrometry. Anal. Biochem., 191, 86–95. [DOI] [PubMed] [Google Scholar]
- 32.Chaudhary A.K., Nokubo,M., Oglesby,T.D., Marnett,L.J. and Blair,I.A. (1995) Characterization of endogenous DNA adducts by liquid chromatography/electrospray ionization tandem mass spectrometry. J. Mass Spect., 30, 1157–1166. [Google Scholar]
- 33.Ravanat J.-L., Duretz,B., Guilller,A., Douki,T. and Cadet,J. (1998) Isotope dilution high performance liquid chromatography–electrospray tandem mass spectrometry assay for the measurement of 8-oxo-7, 8-dihydro-2′-deoxyguanosine in biological samples. J. Chromatogr. B, 715, 349–356. [DOI] [PubMed] [Google Scholar]
- 34.Wolf S.M. and Vouros,P. (1994) Application of capillary liquid chromatography coupled with tandem mass spectrometric methods to the rapid screening of adducts formed by the reaction of N-acetoxy-N-acetyl-2-aminofluorene with calf thymus DNA. Chem. Res. Toxicol., 7, 82–88. [DOI] [PubMed] [Google Scholar]


