

Abstract
Diabetic retinopathy is the predominant cause of visual impairment in diabetes patients. The early detection process can prevent diabetes patients from severe situations. The progression of diabetic retinopathy is determined by analyzing the fundus images, thus determining whether they are affected by exudates or not. The manual detection process is laborious and requires more time and there is a possibility of wrong predictions. Therefore, this research focuses on developing an automated decision-making system. To predict the existence of exudates in fundus images, we developed a novel technique named a hybrid convolutional neural network-recurrent neural network along with the artificial humming bird optimization (HCNNRNN-AHB) approach. The proposed HCNNRNN-AHB technique effectively detects and classifies the fundus image into two categories namely exudates and non-exudates. Before the classification process, the optic discs are removed to prevent false alarms using Hough transform. Then, to differentiate the exudates and non-exudates, color and texture features are extracted from the fundus images. The classification process is then performed using the HCNNRNN-AHB approach which is the combination of CNN and RNN frameworks along with the AHB optimization algorithm. The AHB algorithm is introduced with this framework to optimize the parameters of CNN and RNN thereby enhancing the prediction accuracy of the model. Finally, the simulation results are performed to analyze the effectiveness of the proposed method using different performance metrics such as accuracy, sensitivity, specificity, F-score, and area under curve score. The analytic result reveals that the proposed HCNNRNN-AHB approach achieves a greater prediction and classification accuracy of about 97.4%.
Keywords: Fundus image, Convolutional neural network, Recurrent neural network, Artificial hummingbird algorithm and exudates
Introduction
Diabetes mellitus is a type of disease that affects when the human body cannot take up glucose or sugar which results in serious damage to the body, particularly blood vessels. The organs kidney and eyes are affected easily by diabetic nephropathy and diabetic retinopathy (DR) diseases. The DR is the difficulty that is caused by the diabetic mellitus that is positioned at the retina. The retinas are the tissue that is located in the eye’s inner part and it is also responsible for light transformation and reception; the images are entered into the eyes sends to the nerve signals of the brain [1]. One of the ocular manifestations of diabetes is diabetic retinopathy and it results in blindness. Based on the world health organization (WHO), diabetic retinopathy patients are increasing rapidly and it is expected to reach approximately 439 million in 2030. Generally, 40–45% of the patients have DR. The DR is commonly classified into two types and they are (a) non-proliferative DR (NPDR) and proliferative DR (PDR). The PDR is defined as abnormal vessels that will grow on the eye surface and hinders to resupply of blood with the retina. NPDR is defined as the blood vessel walls being weakened and blood vessels not growing and it is split into moderate, severe, and mild. Diabetic mellitus damaged the smaller blood vessels which is producing micro-aneurysms [2]. The abnormal classifications of the retinal images are done through feature extraction. Mostly, the feature extraction is redundant and completely insignificant for the target classification. The adequate data with features are initially not known for discriminating through the classes. One of the significant features of the DR is the optic nerve head (ONH). The OD has appeared on the right or left side of the images of the fundus. The abnormal features of the fundus images included a microaneurysm [3].
The microaneurysm is the initial sign of retinopathy and it seems like smaller red spots; later, the capillary vessel will start to leak [4]. The micro-aneurysms are caused by the leakage of the blood vessels in the retina. The retinal images are required to assess by a trained ophthalmologist for identifying the DR [5]. Several abnormalities are caused in retinas that include different types of exudates namely the hard exudates (HE). The other proteins and lipoproteins that are leaked by the vessels of the abnormal retina are known as hard exudates. It seems yellowish-white or small white which is deposited by sharp margins and arranged in the circinate or clumps rings. The earlier identification of the DR is important for preventing blindness in DR patients [6]. The primary indicators of the DR are the appearance of the hard exudates in which the distribution and its connection through the central point of the macula are essential [7].
The detection of HE in the retinal images is a difficult task therefore the patches have appeared like HE will be normal. The hard exudates are the major performances of the macular edema that appeared in the bright structure through variable shapes and well-defined edges. The HE identification is significant for clinical analysis [8]. The identification of the hard exudates in the retinal images acts a significant role in the diagnosis of DR and also monitors the treatment progress. The HE is usually susceptible and time-consuming for observer errors [9]. The hard exudates are generated through damaged rupture and fragile vessels and retinal ischemia. The computer-assisted diagnostic system (CAD) is modeled for minimizing medical costs and accelerating the diagnosis [10–14]. The main objective of this paper is to develop a novel automatic decision-making system that detects the existence of exudates in the fundus images accurately using the proposed hybrid convolutional neural network-recurrent neural network along with artificial humming bird optimization (hybrid CNN-RNN with AHB) approach.
The primary contribution of this paper is described as follows:
To propose a hybrid CNN-RNN with AHB approach for precise classification and detection of exudates from the fundus images
Eliminating the optic disc by localizing and segmenting the optic disc using the Hough transform
Optimizing the parameters of CNN and RNN models to neglect the possibilities of misclassification using the AHB optimization algorithm.
Estimating the effectiveness of the proposed method using different performance indicators such as accuracy, sensitivity, specificity, F-score and area under curve score
The remaining section of this article is explained as follows: Various surveys are discussed in the “Review of Related Works” section and the proposed methodology is explained in the “Proposed Methodology” section. In the “Result and Discussion” section, the results and discussion part are explained and various techniques are compared with the proposed approach. Finally, the “Conclusion” section concludes the paper with future directions.
Review of Related Works
In the early detection of diabetic retinopathy (DR), Zong, Y. et al. [15] developed an automated hard exudates segmentation technique to assist ophthalmologists. The simple linear iterative clustering (SLIC) superpixel algorithm is used to make sample patches, by overcoming the constraint and imbalance of the dataset. Also, end-to-end hard exudate segmentation is developed utilizing U-net-based network architecture utilizing residual connections and inception modules. Here, extensive tests on the Indian Diabetic Retinopathy Image Dataset (IDRiD) were carried out to assess the developed technique’s performance. In this technique, uneven illumination and noise in the machine were high while attaining the accurate value.
To identify the hard exudates in fundus images, Jaya T. et al. [16] proposed a fuzzy support vector machine (FSVM) classifier-based expert decision-making method. Also, to eliminate the false alarms by utilizing morphological operations and the circular Hough transforms, the color fundus image’s optic discs are divided. Here, the findings imply utilizing FSVM to detect hard exudates with computer-assisted disease diagnosis. This system detected only the delicate signs but this technique was not applicable to determine this disease in the early stage.
Zhang W. et al. [17] presented a Deep DR model for grading and automatic DR identification. DeepDR is presented by first creating clinical ophthalmologists that categorized a high-quality DR medical image dataset. Experimentation was utilized to determine the optimal ensemble model combination. The clinicians could not identify the exact problem when this algorithm was applied to the image.
Thomas G. et al. [18] utilized CNN for intelligent retinopathy prediction, including automated DR screening and diagnosis done accurately. Also, the trained CNN model utilizes images of affected and non-affected retinopathy eyes. Here, from the dataset, the entire linked layers execute image categorization with the pooling layers decreasing coherence across the neighboring layers. To find patterns by kernel-based matching, the label value was increased by the feature loss factor. But there was a challenge in detecting the ailment in the CNN method by using public datasets.
For automated illness identification in medical images, Saxena G. et al. [19] developed CNN model. On the datasets of Messidor — 1 and Messidor — 2, the presented preliminary automated DR detection model obtained AUCs of 0.92 and 0.958. By directing DR patients to an ophthalmologist, the developed preliminary automated screening method will help the process of manual diagnostic for additional testing to limit vision loss. In [20], Pao S.I. et al. developed Bichannel CNN for DR detection. Their method comprised into three stages such as data augmentation, preprocessing, and DR detection.
As a diagnostic tool for automatic DR detection Mahmoud M. H. et al. [21] presented a hybrid inductive machine learning algorithm (HIMLA). By finding the right medical DR cases, HIMLA analyses and classifies colored fundus images as unhealthy/healthy. For detecting DR, the developed technique was tested utilizing the dataset of CHASE. Here, the developed method’s sensitivity, specificity, and accuracy are 95.31%, 96.88%, and 96.62% respectively. Meanwhile, the computational time required was very high. Samanta A. et al. [22] developed a CNN architecture based on transfer learning for color fundus photography. It works well in distinguishing classes of DR from blood vessels, texture, and hard exudates on a considerable 419 validation image, and 3050 training images comprise a smaller dataset with skewed classifications. Also, this model is exceptionally resilient and lightweight, with the ability to perform admirably in tiny real-time applications with limited computational capacity to accelerate the screening process. The limitation of this technique is that the lack of validation in multicentre would have profitable practice in the clinic.
Mohammed et al. [23] illustrated the computer-aided diagnosis (CAD) for the identification of leukemia cancer (ALL). The initial phase was pre-processing, which helped in improving image quality, separating the blood cells called segmentation extracting the features. At last, Naïve Bayes and K-nearest techniques were implemented for the detection of normal and abnormal cells. Accuracy and sensitivity were employed for detecting the early stage of cancer called leukemia. Through this experiment, this method got a superior accuracy rate of 98.7%. The limitation of this technique showed more errors in detecting leukemia.
Abdulla et al. [24] developed the concept that computer-aided diagnosis helped in detecting several types of cancer through microscopic images. There are two levels of processing: The first process was White Blood Corpuscles (WBC) segmentation and the second process was the segmented cells, which extracted the features like texture and shape. In this method, the experiments were conducted and evaluated by the acute lymphoblastic leukemia (ALL-IDB) dataset. Precision, accuracy, FDR, sensitivity, F-score, and specificity helped in rating the performance. The approach achieved an acceptable accuracy of 97.45% in detecting cells.
Gheisari et al. [25] illustrated CNN (convolutional neural network) and recurrent neural networks (CNN) for detecting glaucoma. An AI-based approach was used in detecting glaucoma, on the basis of spatial unification. Accuracy, loss, and TPR helped in rating the performance metrics. The metrics such as sensitivity and specificity helped in rating performance. As compared with another technique, this approach size of the sample was small and the accuracy was not satisfactory. As compared with other techniques, the cost of the detection of disease was high.
Proposed Methodology
In this section, the proposed automated decision-making system named a hybrid CNN-RNN with AHB (HCNNRNN-AHB) approach is discussed. Initially, the input fundus images acquired from e-Ophtha (dataset-1) and DIARETDB1 (dataset-2) are segmented employing Hough transform for the optic disc elimination process. Subsequently, the input data is feature-extracted and then classified using the HCNNRNN-AHB approach. Here, the CNN and RNN frameworks are introduced to efficiently classify the datasets that are affected by exudates. But, the un-optimized parameters of CNN and RNN models create certain misclassification results. To avoid this shortcoming, the AHB algorithm is introduced with CNN-RNN to effectively classify the images into exudates or non-exudates. Figure 1 depicts the overall proposed architecture and a brief description of the proposed workflow is discussed in the following sections.
Fig. 1.
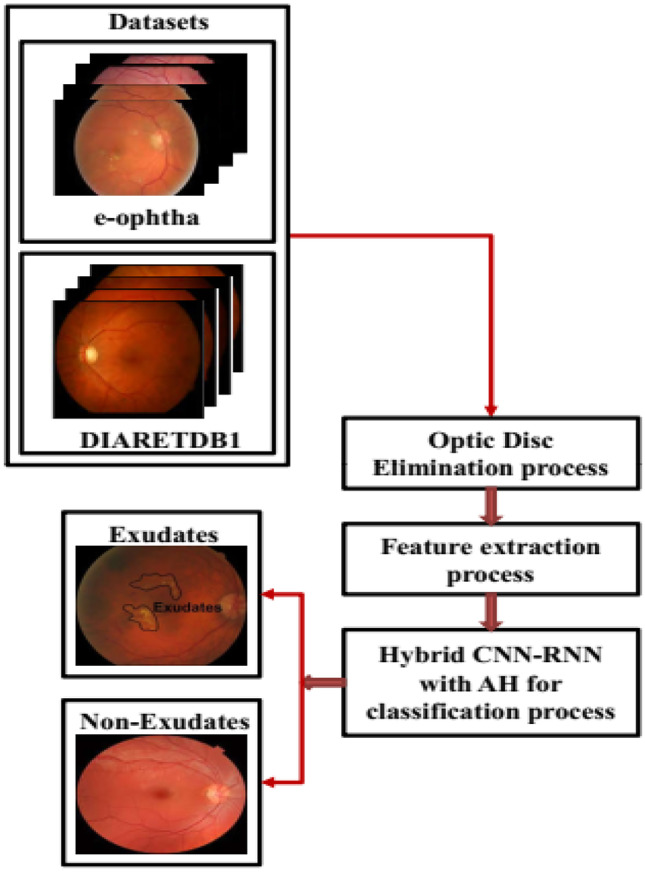
Structure of proposed model
Optic Disc Elimination
To develop the decision-making system, the optic disc (OD) elimination is considered the most significant phase for the automatic detection of retinal pathology. The elimination mechanism required localization of the optic disc and therefore optic disc segmentation. In this article, the OD segmentation is executed utilizing Hough transform [26].
Feature Extraction
The input is provided in the form of texture and color features for the classifications stage. The complete portrayal of the true exudates is detected by using 29 features, only 4 features are acquired through color components of retinal images, and the rest 25 features are acquired by utilizing the Law’s texture energies measure. The retinal image is captured in various imaging conditions, and to acquire the color histograms, images are calculated. To recognize the objects, color pieces of information are utilized as the visual feature. In RGB color spaces, a color histogram is constructed through retinal images. RGB value is normalized and measured then it is expressed as:
| 1 |
| 2 |
The color space of the opponent is utilized for the feature set to acquire better color perception. The two elements are collected from the red-green channel, luminance channel , and color space. The color spaces of the opponent are expressed as:
| 3 |
| 4 |
The retinal images are not evaluated by utilizing color features alone; therefore, the representation of color histogram dependent on the object color is studied; it is not dependent on the features of texture. In this article, both texture and color features are combined for the classification of exudates by retinal images. The texture features are acquired by utilizing the image surface’s distinctive physical compositions and Law’s texture [27]. The Law’s texture used filter masks for extracting various textures descriptive in the retinal images. Texture properties are assessed for spot, ripple, edges, waves, and average gray levels which are utilized for the classification. Here, each pixel of the convolute images is interchanged by comparing the local neighborhoods which are based on the neighboring pixels. The images are acquired after the windowing operation; it is normalized by utilizing the min–max normalization. Here, twenty-five textual features acquired from the retinal images for detecting the exudates are evaluated and the ability to discriminate the features is computed using CNN-RNN with AHB algorithm.
Hybrid CNN-RNN with AHB Algorithm for Classification
In this section, the proposed hybrid CNN-RNN with AHB approach adopted for the detection of exudates from the fundus images is discussed. For accurate detection and classification of exudates, deep learning methods such as CNN and RNN are introduced. To improve the prediction performance of the model and eliminate misclassification results, the parameters of CNN-RNN models are optimized using the AHB algorithm. The abovementioned approaches are elaborately deliberated on in the following sub-sections.
Convolutional Neural Network (CNN)
CNN is a kind of deep neural network broadly used to analyze and classify the data features of images [28]. Its way of processing and data extraction makes CNN a unique approach, unlike other traditional neural networks. The structure of CNN is composed of an input layer, convolution layer, pooling layer, fully connected layer, and output layer. The operations of these layers are illustrated one by one in the following steps.
Convolution Layer
One of the most significant layers of convolutional neural networks is the convolution layer. It has small dimensioned filters; however, the full image inputted into the framework is covered via shifting. By the evaluation of dot products between the filter and the image, the convolution process is carried out. The dot products between the kernels and image pixels are obtained from the filter regions. The mathematical formulation of convolution operation performed between image and filter is described as,
| 5 |
Here, the term indicates the sigmoid activation function, denotes the bias factor of the initial layer, and represents the weight between node and node of the initial layer.
Pooling Layer
In the pooling layer, the downsampling operation is performed. Here, different kinds of pooling functions namely maximum pooling, minimum pooling, adaptive pooling, and average pooling exist. Among these functions, a max-pooling operation is broadly utilized because of its advantageous results like reduced over-fitting and minimized spatial dimension of convoluted data features. In this, the kernel dimension with stride 2 is employed. From the sub-regions of an image, the max-pooling layer filters the maximum value. For instance, if a maximum pooling kernel with dimension is employed to the feature dimension , it downsamples the features to the dimension .
Fully Connected Layer
Similar to an artificial neural network (ANN), in CNN, the neurons of the first layer are interconnected to the neurons of a consequent layer. The fully connected layer is positioned at the end of CNN which helps to figure out non-linear data representation of high-degree data features. It is numerically modeled as,
| 6 |
The term depicts the input that is obtained from the output of the first layer. This fully connected layer includes more training (weight) factors. The small activation points for the hidden layer make the learning process very deep. It can be restricted by applying sparsity of connection. Thus, the over-fitting issues raised in CNN are appropriately eliminated by sparsity.
Softmax Layer
The probability distribution of events over diverse events is computed at this layer. In general, it measures the probability of a targeted class with respect to each possible target class. This function of the softmax layer is numerically described as,
| 7 |
Output Layer
During the training process, this layer computes loss functions. The key objective of CNN is to reduce cost functions and to precisely classify the data features. The mathematical expression of the existing cost function is delineated as,
| 8 |
The cross-entropy loss function is defined as [29],
| 9 |
Here, the terms, , , and represent target value, predicted value, regularizing parameter, and training data respectively.
Recurrent Neural Networks (RNN)
The recurrent neural network (RNN) is a form of artificial neural network that is built for data that contains sequences [30]. Deep learning (DL) techniques are frequently used for ordinal issues/temporal issues such as image captioning, audio identification, natural language processing, and language translation. Long short-term memory (LSTM) refers to a type of RNN that learns order dependency in sequence prediction issues. The LSTM has two types of functions such as activation and sigmoid. The following are descriptions of mathematical expressions and terms:
| 10 |
| 11 |
| 12 |
The input gate, output gate, and forget gate are all represented by, , and in the above equation. The, , and represent the three gates’ bias functions. Also, the and denote the input state and hidden state of LSTM. The sigmoid activation function is represented as. The equations for examining the hidden and candidate states of LSTM cells are as follows:
| 13 |
| 14 |
| 15 |
, , and represent the bias functions and sigmoid activation.
Artificial Hummingbird (AHB) Algorithm
AHB algorithm is a nature-inspired optimization algorithm, stimulated by the memory capacity, distinct flight skills, intelligence, and foraging characteristics of hummingbirds [31]. In the AHB algorithm, the solution vector represents a food source and the fitness function signifies the nectar-refilling rate. The hummingbirds can remind the position and nectar-refilling rate of a specific flower by which it communicates the information to other hummingbirds. Moreover, the hummingbirds determine the targeted food sources using the visit table. The visiting time of hummingbirds is recorded iteratively in the visit table. The foraging behavior of hummingbirds is split into three ways; they are guided foraging, territorial foraging, and migration foraging. The AHB algorithm resolves optimization problems by finding optimal solutions with a good convergence rate.
The AHB algorithm commences by randomly initializing the hummingbird population. In guided foraging, hummingbirds prefer to visit the food source with high nectar volume. The hummingbirds select the food source based on nectar refilling rate and long unvisited time thereby choosing the food source with a high volume of nectar. In this strategy, the hummingbirds utilize three different flight skills namely omnidirectional flight, diagonal flight, and axial flight along with the implementation of a direction switch vector. It helps to regulate the flight directions in the search dimension. Omnidirectional flight is used by all bird species but exceptionally, hummingbirds are experts in all three flying skills.
In territorial foraging, the hummingbirds move to new locations in search of food sources after the full consumption of the initial target food source. This strategy will enable hummingbirds to search for food around the search space using their unique flight skills. After each search process, the visit table is updated. In migration foraging, the frequent visits of hummingbirds to the region where the food source exists will bring food shortages. This makes the hummingbirds to move remote places in search of food sources. So, the AHB algorithm adopts a migration coefficient to define this migration strategy. When the total iteration number of the AH algorithm exceeds the predefined value of migrating coefficient, the hummingbirds migrate toward a new location.
Hybrid CNN-RNN with AHB Algorithm
Figure 2 describes the flow diagram of the proposed hybrid CNN-RNN with AHB algorithm (HCNNRNN-AHB). In this, the CNN model can extract local data features from the image dataset and the RNN model is implemented for learning long-term dependencies of data features [32]. Initially, the layers of the CNN framework preprocess the input vectors and extract the local features that exist in the fundus image datasets. The result obtained from the CNN model is injected into the RNN model as an input. From the extracted local features of CNN, the RNN model trains the long-term dependencies of data features, thus predicting whether the data features are affected by exudates or not. The integrated formation of the CNN and RNN model has advantageous capabilities such as effective learning of deep and sequential features from fundus images. Despite its benefits, they also have several disadvantages such as unoptimal model parameters like learning rate, batch size, and loss functions, which influence the predicting ability of the model thus resulting in misclassifications. Therefore, to increase the prediction ability and reduce misclassifications, the parameters of both CNN and RNN models are optimized using the nature-inspired optimization approach named AHB algorithm. This algorithm effectively discovers high-quality solutions with fewer control parameters. Thus, the proposed hybrid CNN-RNN with the AHB algorithm accurately predicts whether the image dataset is affected by exudates or not by classifying them into two categories as exudates and non-exudates.
Fig. 2.

Flow diagram of proposed hybrid CNN-RNN with AHB algorithm
The hyper-parameters used to fine-tune the proposed hybrid CNN-RNN with the AHB model are presented in Table 1.
Table 1.
Configuration of hyper parameter setting
| Techniques | Parameters | Ranges |
|---|---|---|
| CNN | Convol 1 | 8 filters of size (3 × 3 × 1) |
| Convol 2 | 16 filters of size (3 × 3 × 8) | |
| Convol 3 | 32 filters of size (3 × 3 × 16) | |
| Input | 74 × 1200 × 1 | |
| Maximum pooling 1 | 2 × 2 with stride 1 | |
| Maximum pooling 2 | 2 × 2 with stride 1 | |
| Fully connected layer | 4 | |
| RNN | Dropout | [0.0, 1.0] |
| Batch size | {27,81} | |
| Step rate | {1e–2, 1e–3, 1e–4} | |
| Hidden layer used nodes | 5–8 | |
| time delay unit used nodes | 1 | |
| AHB | Population size | 30 |
| Maximum number of iteration | 50 | |
| Number of runs per function | 30 |
Result and Discussion
In this section, the effectiveness of the proposed HCNNRNN-AHB method is examined by evaluating various performance metrics. The HCNNRNN-AHB method is analyzed with FSVM, CNN, SLIC, and deep DR methods in detecting the DR. The analysis of this study is listed below.
Experimental Setup
This work is implemented in E5-2609 CPU with 16 GB RAM and K60 Quadro GPU. Here, nearly 80% of the sample is used for training and 20% is used for testing for 100 epochs.
Dataset Description
In this study, two sets of databases namely e-Ophtha (dataset-1) and DIARETDB1 (dataset-2) are collected for the analysis [33]. The detailed description of each dataset is depicted in the following sub-section.
E-Ophtha Dataset
The E-Ophtha database consists of 47 retinal fundus images which are investigated through 4 ophthalmologist experts based on the exudate’s manual annotation. The retinal image sizes are varied with resolutions of 1400 × 960 pixels to 2544 × 1696 pixels. This type of dataset was gathered from a telemedical network and this dataset is used for DR monitoring.
DIARETDBI Dataset
The DIARETDBI database includes 89 retinal fundus photographs from 1500 × 1152 resolutions. The retinal images are taken from the digital designated fundus image camera possesses a 50-degree view field. The investigation of the exudates was evaluated and performed manually by 5 authorized ophthalmologists in diabetic retinopathy. The hard and soft exudates are labeled as exudates with a single class. The total number of images is resized for the average size of the DIARETDBI images as well as the estimation of the image size scale is decided with the retinal optic disc standard size.
Evaluation Measures
The overall performance of the proposed HCNNRNN-AHB method is determined by evaluating various performance metrics such as accuracy (), sensitivity (), specificity (), and F-score. The mathematical expression of all the metrics is as follows,
| 16 |
| 17 |
| 18 |
| 19 |
Performance Analysis
Figure 3 indicates the detection of affluence by employing an FSVM classifier and initially, the figure shows the original color image. Then the color image is converted into a greyscale image that looks like a black-and-white image feature. The image is segmented using the optic disc segmentation process and finally, the effluences are detected. The original image is separated into 15 × 15 sub-regions in the texture feature separation stage. The sub-regions are involved with the mask and the entire sub-regions are formed as an input which is given to the FSVM classifier. The texture feature gives the best solution for pathology detection.
Fig. 3.

Hard exudate detection by using FSVM classifier a original color image, b greyscale image, c segmentation, d hard exudate detection
Figure 4 represents the confusion matrix of two different types of datasets such as e-Ophtha and DIARETDB1. The confusion matrix is generated for the classification of different levels to diagnose diabetic retinopathy. The diagonal elements indicate the exactly classified labels and they will be perfectly categorized into the normal, low, moderate, and severe classes.
Fig. 4.

Confusion matrix of two dataset a e-Ophtha b DIARETDB1
Figure 5a and b illustrate the performance rate of various evaluation metrics like accuracy, sensitivity, specificity, and F-score for e-Ophtha and DIARETDB1 for the proposed approach. In Fig. 5a, the performances are evaluated for each respective performance measure for the e-Ophtha dataset. From the graphical analysis, it is revealed that the accuracy rate obtained is 97.6%. Similarly in Fig. 5b, the performance analysis is carried out for various performance measures for the DIARETDB1 dataset. From the graphical analysis, the results demonstrated that the accuracy rate achieved is 93.2%. By comparing the two datasets, the e-Ophtha dataset achieved high accuracy percentage when compared with the DIARETDB1 dataset.
Fig. 5.

Performance evaluation of a e-Ophtha and b DIARETDB1
The graphical representation of the accuracy evaluation of the proposed HCNNRNN-AHB with different learning rates is depicted in Fig. 6. A learning rate is needed for network convergence and in this analysis, the accuracy of the learning rate ranges from 0.02 to 0.14 is determined. The figure shows that for a 0.08 learning rate, better accuracy is achieved. For the learning rate higher than 0.11 and less than 0.04, the network will not converge and is not computed. Figure 7 shows the loss and accuracy analysis for e-Ophtha and DIARETDB1. The rate of accuracy has a gradual increase after the 6th epoch and there is a drop in loss after the 6th epoch. The proposed HCNNRNN-AHB method has attained higher accuracy and has obtained a lower loss value which improves the system efficiency. The accuracy of dataset-1 is higher compared to dataset-2 where dataset-1 and dataset-2 have achieved higher accuracy of 97.6% and 93.2% respectively.
Fig. 6.

Evaluation of accuracy with different learning rates
Fig. 7.

Loss and accuracy analysis for a e-Ophtha b DIARETDB1
Comparative Analysis
Figure 8 depicts the accuracy analysis of various methods. The proposed HCNNRNN-AHB method is compared with fuzzy support vector machine (FSVM), convolutional neural network (CNN), and hybrid inductive machine learning algorithm (HIMLA). The result analysis shows that the proposed HCNNRNN-AHB method has achieved higher accuracy compared to existing methods. The obtained accuracy of the proposed HCNNRNN-AHB method is about 97.4%.
Fig. 8.

Comparative analysis of accuracy
The comparative analysis of the sensitivity value of various methods is graphically represented in Fig. 9. The sensitivity value of the proposed HCNNRNN-AHB method, FSVM, CNN, HIMLA, and deep DR is evaluated and compared to determine the better method. The analysis shows that the maximum sensitivity rate of 97% is obtained by the HCNNRNN-AHB method. In Fig. 10, the analysis of specificity is depicted. The figure shows that the HCNNRNN-AHB method has achieved 97.2% specificity which is higher compared to existing methods.
Fig. 9.

Comparative analysis of sensitivity
Fig. 10.

Comparative analysis of specificity
Figure 11 represents the F-score analysis of various methods. The F-score value of the HCNNRNN-AHB method, FSVM, CNN, HIMLA, and deep DR is determined and the analysis shows that the HCNNRNN-AHB method has attained a higher F-score than other methods. The obtained F-score value of the HCNNRNN-AHB method is 96.85%. Figure 12 represents the receiver operating characteristic (ROC) curve analysis of the proposed HCNNRNN-AHB method with FSVM, CNN, HIMLA, and deep DR respectively. The performance of various methods is compared with the true positive rate (TPR) and false positive rate (FPS). The proposed HCNNRNN-AHB method achieves a tradeoff between true positive and false positive rates.
Fig. 11.
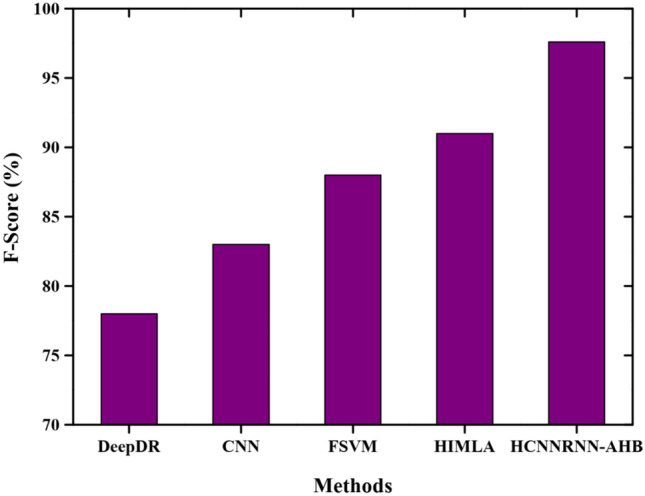
Comparative analysis of F-score
Fig. 12.
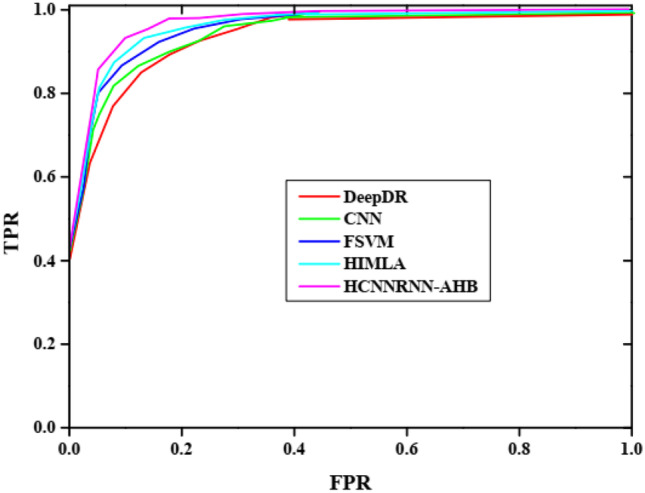
ROC analysis
Conclusion
In this paper, the hybrid CNN-RNN with AHB (HCNNRNN-AHB) approach is proposed for precise classification and detection of exudates from the fundus images. The analysis process of the proposed approach is carried out using two fundus image datasets as e-Ophtha (dataset-1) and DIARETDB1 (dataset-2). At first, the optic discs are removed to prevent false alarms using Hough transform and then to differentiate the exudates and non-exudates, color and texture features are extracted from the fundus images. The proposed HCNNRNN-AHB approach detects the presence of exudates in the fundus images and classifies them into two classes namely exudates (presence of disease) and non-exudates (normal image). In this, deep learning methods such as CNN and RNN are introduced for accurate detection and classification of exudates. However, there is a possibility of the occurrence of misclassification results due to un-optimal parameters of CNN and RNN framework. To improve the prediction performance of the model and to eliminate misclassification results, the parameters of CNN-RNN models are optimized using the AHB algorithm. Moreover, the performance of the proposed method is evaluated using different performance metrics such as accuracy, sensitivity, specificity, F-score, and area under curve score. The result analysis shows that the proposed HCNNRNN-AHB method has achieved higher accuracy compared to FSVM, CNN, HIMLA, and deep DR. The HCNNRNN-AHB method has achieved minimal loss and higher metrics. The accuracy of dataset-1 is higher compared to dataset-2 where dataset-1 and dataset-2 have achieved higher accuracy of 97.6% and 93.2% respectively. In future work, the proposed method will be extended to detect more diseases using hybrid metaheuristic algorithms.
Availability of Data and Material
Data sharing is not applicable to this article as no new data were created or analyzed in this study.
Code Availability
Not applicable.
Declarations
Ethics Approval
This article does not contain any studies with human or animal subjects performed by any of the authors.
Consent to Participate
Informed consent was obtained from all individual participants included in the study.
Consent for Publication
Not applicable.
Conflict of Interest
The authors declare no competing interests.
Footnotes
Publisher's Note
Springer Nature remains neutral with regard to jurisdictional claims in published maps and institutional affiliations.
References
- 1.Auccahuasi W, Flores E, Sernaque F, Cueva J, Diaz M, Oré E. Recognition of hard exudates using Deep Learning. Procedia Computer Science. 2020;167:2343–2353. doi: 10.1016/j.procs.2020.03.287. [DOI] [Google Scholar]
- 2.Bilal A, Sun G, Mazhar S, Imran A, Latif J: A Transfer Learning and U-Net-based automatic detection of diabetic retinopathy from fundus images. Computer Methods in Biomechanics and Biomedical Engineering: Imaging & Visualization. pp.1–12, 2022
- 3.Kadan AB, Subbian PS. Detection of hard exudates using evolutionary feature selection in retinal fundus images. Journal of Medical Systems. 2019;43(7):1–12. doi: 10.1007/s10916-019-1349-7. [DOI] [PubMed] [Google Scholar]
- 4.Anitha GJ, Maria KG: Detecting hard exudates in retinal fundus images using convolutional neural networks. In 2018 International Conference on Current Trends towards Converging Technologies (ICCTCT) (pp. 1–5). IEEE, 2018
- 5.Benzamin A, Chakraborty C: Detection of hard exudates in retinal fundus images using deep learning. In 2018 Joint 7th International Conference on Informatics, Electronics & Vision (ICIEV) and 2018 2nd International Conference on Imaging, Vision & Pattern Recognition (icIVPR) (pp. 465–469). IEEE.2018
- 6.Theera-Umpon N, Poonkasem I, Auephanwiriyakul S, Patikulsila D. Hard exudate detection in retinal fundus images using supervised learning. Neural Computing and Applications. 2020;32(17):13079–13096. doi: 10.1007/s00521-019-04402-7. [DOI] [Google Scholar]
- 7.Kurilová V, Goga J, Oravec M, Pavlovičová J, Kajan S. Support vector machine and deep-learning object detection for localisation of hard exudates. Scientific Reports. 2021;11(1):1–9. doi: 10.1038/s41598-021-95519-0. [DOI] [PMC free article] [PubMed] [Google Scholar]
- 8.Al Sariera TM, Rangarajan L, Amarnath R. Detection and classification of hard exudates in retinal images. Journal of Intelligent & Fuzzy Systems. 2020;38(2):1943–1949. doi: 10.3233/JIFS-190492. [DOI] [Google Scholar]
- 9.Long S, Huang X, Chen Z, Pardhan S, Zheng, D: Automatic detection of hard exudates in color retinal images using dynamic threshold and SVM classification: algorithm development and evaluation. BioMed research international, 2019. [DOI] [PMC free article] [PubMed]
- 10.Romero-Oraá R, García M, Oraá-Pérez J, López-Gálvez MI, Hornero R: Effective fundus image decomposition for the detection of red lesions and hard exudates to aid in the diagnosis of diabetic retinopathy. Sensors, 20(22):p.6549, 2020 [DOI] [PMC free article] [PubMed]
- 11.Senthilselvi.A&Sukumar. R, “Removal of salt and pepper noise from images using Hybrid Filter (HF) and Fuzzy Logic Noise Detector (FLND)”, Concurrency and Computation: Practice and Experience, Volume 31 No 12 June 2019
- 12.Thaha M. Mohammed, Kumar K. Pradeep Mohan, Murugan B. S., Dhanasekeran S., Vijayakarthick P., Selvi A. Senthil. Brain Tumor Segmentation Using Convolutional Neural Networks in MRI Images. Journal of Medical Systems. 2019;43(9):294. doi: 10.1007/s10916-019-1416-0. [DOI] [PubMed] [Google Scholar]
- 13.Senthil Pandi, Sankareswaran Mahadevan, Krishnan (2022) Unsupervised End-to-End Brain Tumor Magnetic Resonance Image Registration Using RBCNN: Rigid Transformation B-Spline Transformation and Convolutional Neural Network. Current Medical Imaging Formerly Current Medical Imaging Reviews 18(4) 387-397 10.2174/1573405617666210806125526 [DOI] [PubMed]
- 14.V., Surya A., Senthilselvi (2022) Identification of oil authenticity and adulteration using deep long short-term memory-based neural network with seagull optimization algorithm. Neural Computing and Applications 34(10) 7611-7625 10.1007/s00521-021-06829-3
- 15.Zong Y, Chen J, Yang L, Tao S, Aoma C, Zhao J. Wang S :U-net based method for automatic hard exudates segmentation in fundus images using inception module and residual connection. IEEE Access. 2020;8:167225–167235. doi: 10.1109/ACCESS.2020.3023273. [DOI] [Google Scholar]
- 16.Jaya T, Dheeba J, Singh N.A: Detection of hard exudates in colour fundus images using fuzzy support vector machine-based expert system. Journal of Digital Imaging, 28(6) (2015)761–768. [DOI] [PMC free article] [PubMed]
- 17.Zhang W, Zhong J, Yang S, Gao Z, Hu J, Chen Y, Yi Z. Automated identification and grading system of diabetic retinopathy using deep neural networks. Knowledge-Based Systems. 2019;175:12–25. doi: 10.1016/j.knosys.2019.03.016. [DOI] [Google Scholar]
- 18.Thomas, G. Robinson, Y.H. Julie, E.G. Shanmuganathan, V. Rho, S. Nam, Intelligent Y. prediction approach for diabetic retinopathy using deep learning based convolutional neural networks algorithm by means of retina photographs.( 2021)
- 19.Saxena G, Verma DK, Paraye A, Rajan A, Rawat A. Improved and robust deep learning agent for preliminary detection of diabetic retinopathy using public datasets. Intelligence-Based Medicine. 2020;3:100022. doi: 10.1016/j.ibmed.2020.100022. [DOI] [Google Scholar]
- 20.Pao SI, Lin HZ, Chien KH, Tai MC, Chen JT, Lin GM: Detection of diabetic retinopathy using bichannel convolutional neural network. Journal of Ophthalmology 2020. [DOI] [PMC free article] [PubMed]
- 21.Mahmoud MH, Alamery S, Fouad H, Altinawi A, Youssef AE: An automatic detection system of diabetic retinopathy using a hybrid inductive machine learning algorithm. Personal and Ubiquitous Computing, pp.1–15, 2021
- 22.Samanta A, Saha A, Satapathy SC, Fernandes SL, Zhang YD. Automated detection of diabetic retinopathy using convolutional neural networks on a small dataset. Pattern Recognition Letters. 2020;135:293–298. doi: 10.1016/j.patrec.2020.04.026. [DOI] [Google Scholar]
- 23.Mohammed ZF, bdulla AA, An efficient CAD system for ALL cell identification from microscopic blood images. Multimedia Tools and Applications, 80(4):pp.6355–6368, 2021
- 24.Abdulla AA. Efficient computer-aided diagnosis technique for leukemia cancer detection. IET Image Processing. 2020;14(17):4435–4440. doi: 10.1049/iet-ipr.2020.0978. [DOI] [Google Scholar]
- 25.Gheisari S, Shariflou S, Phu J, Kennedy PJ, Agar A, Kalloniatis M, Golzan SM: A combined convolutional and recurrent neural network for enhanced glaucoma detection. Scientific reports, 11(1):pp.1–11, 2021 [DOI] [PMC free article] [PubMed]
- 26.Jaya T, Dheeba J, Singh NA. Detection of hard exudates in colour fundus images using fuzzy support vector machine-based expert system. Journal of Digital Imaging. 2015;28(6):761–768. doi: 10.1007/s10278-015-9793-5. [DOI] [PMC free article] [PubMed] [Google Scholar]
- 27.Mahesh VG, Chen C, Rajangam V, Raj ANJ, Krishnan PT. Shape and texture aware facial expression recognition using spatial pyramid Zernike moments and law’s textures feature set. IEEE Access. 2021;9:52509–52522. doi: 10.1109/ACCESS.2021.3069881. [DOI] [Google Scholar]
- 28.Kumar A, Gandhi CP, Zhou Y, Kumar R. Xiang J,: Improved deep convolution neural network (CNN) for the identification of defects in the centrifugal pump using acoustic images. Applied Acoustics. 2020;167:107399. doi: 10.1016/j.apacoust.2020.107399. [DOI] [Google Scholar]
- 29.Dong Y, Shen X, Jiang Z, Wang H. Recognition of imbalanced underwater acoustic datasets with exponentially weighted cross-entropy loss. Applied Acoustics. 2021;174:107740. doi: 10.1016/j.apacoust.2020.107740. [DOI] [Google Scholar]
- 30.Amalia R, Bustamam A, Sarwinda D: Detection and description generation of diabetic retinopathy using convolutional neural network and long short-term memory. In journal of physics: conference series (Vol. 1722, No. 1, p. 012010). IOP Publishing.2021
- 31.Zhao W, Wang L, Mirjalili S: Artificial hummingbird algorithm: A new bio-inspired optimizer with its engineering applications. Computer Methods in Applied Mechanics and Engineering, 388:p.114194, 2022
- 32.Nasir JA, Khan OS, Varlamis I: Fake news detection: A hybrid CNN-RNN based deep learning approach. International Journal of Information Management Data Insights, 1(1) :p.100007, 2021
- 33.Khojasteh P, Júnior LAP, Carvalho T, Rezende E, Aliahmad B, Papa JP, Kumar DK. Exudate detection in fundus images using deeply-learnable features. Computers in biology and medicine. 2019;104:62–69. doi: 10.1016/j.compbiomed.2018.10.031. [DOI] [PubMed] [Google Scholar]
Associated Data
This section collects any data citations, data availability statements, or supplementary materials included in this article.
Data Availability Statement
Data sharing is not applicable to this article as no new data were created or analyzed in this study.
Not applicable.