Abstract
Background
Traditional herbal medicine has been used for centuries to cure many pathological disorders, including cancer. Thymoquinone (TQ) and piperine (PIP) are major bioactive constituents of the black seed (Nigella sativa) and black pepper (Piper nigrum), respectively. The current study aimed to explore the potential chemo-modulatory effects, mechanisms of action, molecular targets, and binding interactions after TQ and PIP treatments and their combination with sorafenib (SOR) against human triple-negative breast cancer (MDA-MB-231) and liver cancer (HepG2) cells.
Methods
We determined drug cytotoxicity by MTT assay, cell cycle, and death mechanism by flow cytometry. Besides, the potential effect of TQ, PIP, and SOR treatment on genome methylation and acetylation by determination of DNA methyltransferase (DNMT3B), histone deacetylase (HDAC3) and miRNA-29c expression levels. Finally, a molecular docking study was performed to propose potential mechanisms of action and binding affinity of TQ, PIP, and SOR with DNMT3B and HDAC3.
Results
Collectively, our data show that combinations of TQ and/or PIP with SOR have significantly enhanced the SOR anti-proliferative and cytotoxic effects depending on the dose and cell line by enhancing G2/M phase arrest, inducing apoptosis, downregulation of DNMT3B and HDAC3 expression and upregulation of the tumor suppressor, miRNA-29c. Finally, the molecular docking study has identified strong interactions between SOR, PIP, and TQ with DNMT3B and HDAC3, inhibiting their normal oncogenic activities and leading to growth arrest and cell death.
Conclusion
This study reported TQ and PIP as enhancers of the antiproliferative and cytotoxic effects of SOR and addressed the mechanisms, and identified molecular targets involved in their action.
Supplementary Information
The online version contains supplementary material available at 10.1186/s12906-023-03872-6.
Keywords: Thymoquinone, Piperine, Sorafenib, Epigenetic, Molecular docking
Background
Cancer is a global burden and is ranked as one of the major causes of death especially in low-income nations [1]. Globally, liver cancer is the 6th most common and the third leading cause of cancer mortality (8.3%) after lung (18.0%) and colorectal (9.4%) cancer, with the highest incidence rates found in Asia and Africa [2]. On the other hand, worldwide, breast cancer has now exceeded lung cancer in incidence, with approximately 2.3 million new cases in 2020 and 685,000 deaths [3].
Chemotherapy is one of the major treatment patterns for cancer, used alone or in combination with other treatment modalities. Chemo-drugs kill cancer cells by interfering with the cell cycle regulating genes, therefore, inhibiting cell growth and proliferation, leading to cell death mainly by apoptosis [4–6]. Cancer patients receiving chemotherapy suffer from mild side effects, such as alopecia, constipation, and fatigue, to serious ones, such as sterility, cardiotoxicity, and pulmonary fibrosis. Therefore, reducing these side effects would contribute to a better lifestyle for these patients [7].
Sorafenib (SOR), doxorubicin, and cisplatin are the most used chemotherapeutic agents suitable for patients with liver and breast cancer. Sorafenib is a protein kinase inhibitor that is active against various protein kinases. In 2008, the US FDA approved SOR (NEXAVAR®) for treating patients with liver and advanced kidney cancers [8]. SOR has well-known anticancer potential (Supplementary File 1), as stated in the CTD database (http://ctdbase.org/). Also, it is used as a therapy for about 890 cancer clinical trials (Supplementary File 2), as recognized in the clinical trials database (https://clinicaltrials.gov/).
Natural products derived from plants have always been used to treat various diseases and most of the present anticancer drugs use active ingredients extracted from plant sources [9–13]. These compounds usually exert their effect through several mechanisms such as activation of apoptotic cell death, cell cycle arrest, and inhibition of angiogenesis [14].
Thymoquinone (TQ) is a major bioactive constituent of the black seed (Nigella sativa) [15], it has shown different anticancer activities through cell proliferation inhibition, and apoptosis induction in cancer cells, the possible mechanisms of TQ anticancer activity against various proliferative cancer cells were summarized in the review article by El-Far [16]. Interestingly, TQ was reported to have a significant selectivity against various malignant cells [17–21]. The anticancer potential and clinical trials of TQ were stated in Supplementary File 3 and Supplementary File 4, respectively. The taxonomic hierarchy of Nigella sativa L. is shown in Table 1 [22].
Table 1.
Taxonomic hierarchy of Nigella sativa, Piper nigrum, and Piper longum
| Nigella sativa L | Piper nigrum L | Piper longum L | |
|---|---|---|---|
| Kingdom | Plantae – Plants | Plantae—Plants | Plantae—Plants |
| Subkingdom | Tracheobionta—Vascular plants | Tracheobionta—Vascular plants | Tracheobionta—Vascular plants |
| Superdivision | Spermatophyta—Seed plants | Spermatophyta—Seed plants | Spermatophyta—Seed plants |
| Division | Magnoliophyta—Flowering plants | Magnoliophyta—Flowering plants | Magnoliophyta—Flowering plants |
| Class | Magnoliopsida – Dicotyledons | Magnoliopsida—Dicotyledons | Magnoliopsida—Dicotyledons |
| Subclass | Magnoliidae | Magnoliidae | Magnoliidae |
| Order | Ranunculales | Piperales | Piperales |
| Family | Ranunculaceae—Buttercup family | Piperaceae—Pepper family | Piperaceae—Pepper family |
| Genus | Nigella L. – nigella | Piper L.—pepper | Piper L.—pepper |
| Species | Nigella sativa L. – black cumin | Piper nigrum L.—black pepper | Piper longum L.—Indian long pepper |
Piperine (PIP) is the major bioactive alkaloid found in black (Piper nigrum), white and long pepper (Piper longum), it has several actions, including anti-inflammatory and anticancer properties [23]. The anticancer potential and clinical trials of TQ were stated in Supplementary File 5 and Supplementary File 6, respectively. Also, the taxonomic hierarchy of Piper nigrum [24] and Piper longum [25] is shown in Table 1.
This study examined the potential inhibitory effect of TQ, PIP, and SOR against human triple-negative breast cancer and hepatocellular carcinoma cells. Moreover, molecular targets and mechanisms involved in such activities were also investigated.
Materials and methodsChemicals and reagents
TQ and PIP were obtained from Sigma-Aldrich Chemical Co. (St. Louis, Missouri, USA), and SOR was purchased from Cipla Ltd, India. All cell culture materials were obtained from Gibco (New York, New York, USA).
Cell lines
Human hepatocellular carcinoma HepG2 and breast cancer MDA-MB-231 cells were supplied from American Type Culture Collection (ATCC). Cells were cultured in a complete DMEM medium and incubated at 37 °C in an atmosphere containing 5% CO2.
Cytotoxicity assay
HepG-2 and MDA-MB-321 Cells were cultured at 15 × 103 per well in a 96-well plate with 100 µl of complete fresh medium for 24 h before treatment with different concentrations of PIP (12.5–200 µM), TQ (25–400 µM) and SOR (6.25–100 µM) for 48 hs. Cell viability was measured by MTT as previously described [26], and the IC50 was calculated by nonlinear regression analysis of the dose–response curve in each cell line.
For the determination of IC50 values in the combination treatments of TQ and/or PIP with SOR, HepG2, and MDA-MB-231were treated with (IC10-IC50) doses of TQ and PIP, together with SOR (1.0 – 40.0), then incubated for 48 hs before performing the MTT assay as mentioned above.
Cell line treatment
Cells were treated with half of the predetermined calculated IC50 values for all cellular and molecular analyses for each compound. Both cell lines were treated as follows: culture media or 0.1% dimethyl sulfoxide (DMSO), controls; single treatment with either TQ or PIP or SOR; double treatment with TQ + PIP or TQ + SOR or PIP + SOR and finally triple treatment with TQ + PIP + SOR. Treatment was performed 48 hs before the respective analysis, and experiments were repeated at least three times.
Cell cycle analysis
Cell cycle distribution analysis was carried out by cell cycle assay kit, Elabscience Biotechnology Co., Ltd (Houston, Texas, USA). Following trypsinization, cells were centrifuged at 300 × g for 5 min, resuspended using PBS, and 1.2 ml ethanol was added, and the tube was stored at -20 °C for 1 h then, cells were pelleted by centrifugation, the cell pellet was washed with PBS. 100 μl RNase A reagent was added to resuspend the cells and incubated at 37 °C water bath for 30 min then 400 μl propidium iodide (PI) staining solution was added, mixed, and incubated at 4 °C for 30 min. Finally, cells were analyzed using proper machine settings.
Assessment of apoptosis and necrosis by Annexin V-FITC/PI staining
The influence of TQ, PIP, and SOR on apoptosis in HepG2 and MDA-MB-321 cells were quantified by flow cytometry. In brief, cells were collected, washed with PBS, resuspended in 500 μl of annexin V binding buffer, and added 5 μl of annexin V-FITC/PI solution. Cells were resuspended and darkly incubated at 22º C for 20 min before FACS analysis.
RNA extraction, cDNA synthesis, and quantitative real-time PCR
The mRNA levels of DNA methyltransferase (DNMT3B), histone deacetylase (HDAC3) genes, and miRNA-29c were assessed by qRT-PCR. Total RNA was first isolated using the miRNeasy Mini Kit (Qiagen, Germany) and reverse‑transcribed to cDNA using the QuantiTect Reverse Transcription kit (Qiagen, Germany). Second, qRT-PCR was performed using the qPCR Master Mix kit (Enzynomics, Korea). The qRT-PCR cycles consisted of 10 min at 95 °C, 40 cycles of denaturation at 95 °C for 10 s, annealing at 60 °C for 15 s, and extension at 72 °C for 15 s. The primers for DNMT3B, HDAC3, miRNA-29c, β-actin, and U6 genes are listed in Table 2. The relative expression of DNMT3B and HDAC3 were calculated by the comparative 2−ΔΔCt method [27] using the endogenous β-actin as a housekeeping gene, while miRNA-29c was calculated using the U6 gene as an endogenous control.
Table 2.
Primers used in real-time PCR amplification
| Genes | Primers' sequences |
|---|---|
| DNMT3B forward | 5′-TACACAGACGTGTCCAACATGGGC-3′ |
| DNMT3B reverse | 5′- GGATGCCTTCAGGAATCACACCTC-3′ |
| HDAC3 forward | 5′-ACGTGGGCAACTTCCACTAC-3′ |
| HDAC3 reverse | 5′- GACTCTTGGTGAAGCCTTGC -3′ |
| β-actin forward | 5′- CGAGCACAGAGCCTCGCCTTTGCC-3′ |
| β-actin reverse | 5′- TGTCGACGACGAGCGCGGCGATAT -3′ |
| miRNA-29c forward | 5′- TTT GTC TAG CAC CAT TTG-3′ |
| miRNA-29c reverse | 5′- CCA GTG CAG GGT CCG AGG TA-3′ |
| U6 forward | 5′- ATTGGAACGATACAGAGAAGATT -3′ |
| U6 reverse | 5′-GGAACGCTTCACGAATTTG-3′ |
DNMT3B DNA methyltransferase, HDAC3 Histone deacetylase
Molecular docking
To perform molecular docking of TQ, PIP, and SOR against DNMT3B (target site PDB ID: 6KDL), HDAC3 (target site PDB ID: 4A69), and vascular endothelial growth factor receptor-2 (VEGFR-2) (target site PDB ID:3V2A), we first downloaded from RCSB PDB database (https://www.rcsb.org/) and prepared by BIOVIA Discovery Studio (Vélizy-Villacoublay, France) [28–30]. The 6KDL retrieved from PDB is the human DNMT3B-DNMT3L complex, where the A and D chains represent DNMT3B. Also, HDAC3 was represented as A and B chains. Therefore, we selected the A chain of 6KDL, 4A69, and 3V2A for protein preparation by removal of water molecules and all ligands in addition to energy minimization and refinement processes.
In addition, the 3D structures of TQ, PIP, and SOR were obtained from the PubChem database (https://pubchem.ncbi.nlm.nih.gov/). The binding free energy, binding affinity (pKi), and the ligand efficiency of TQ, PIP, and SOR against prepared DNMT3B (6KDL-A) and HDAC3 (4A69-A) were determined using InstaDock software [31]. Finally, BIOVIA Discovery Studio Visualizer software did the visualization of target-ligand interaction.
Statistical analysis
Statistical analysis was performed using GraphPad prism 8.4.2 (https://www.graphpad.com/). Data were represented as mean ± SEM of three independent experiments. One-way ANOVA followed by Tukey’s multiple comparison tests were used to compare group differences. p < 0.05 was deemed to show statistical significance.
Results
TQ and PIP enhanced the cytotoxicity of SOR in liver and breast cancer cells
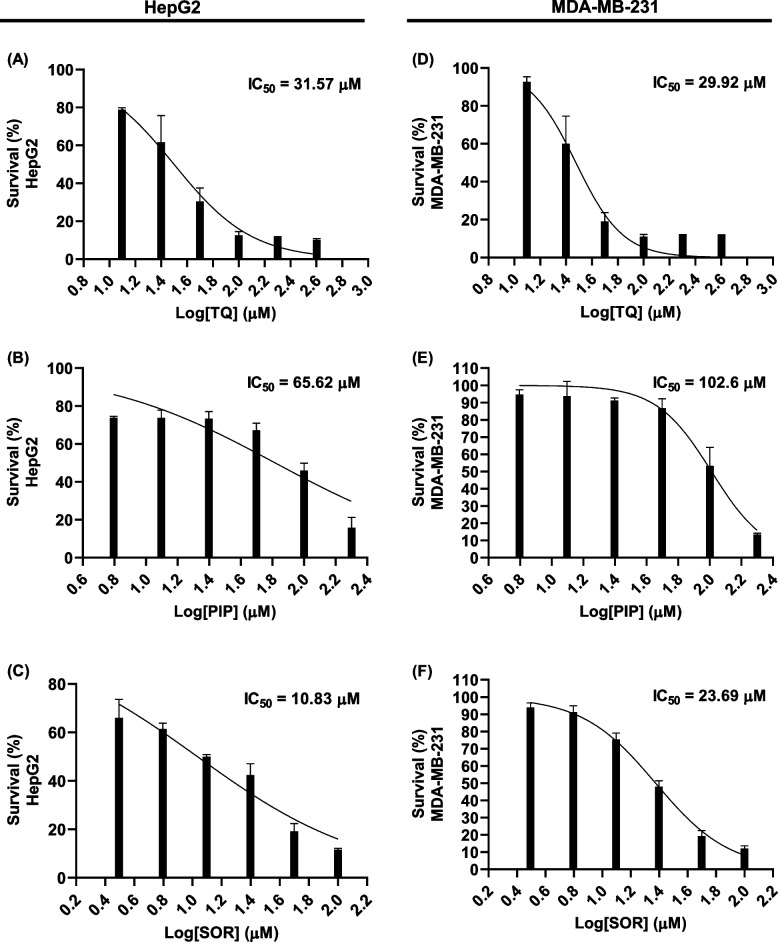
The antiproliferative effect of TQ, PIP, and SOR was investigated in HepG2 and MDA-MB-231 cells after 48 hs treatments using the MTT assay. Dose–response curves were used to determine the IC50 values for TQ, PIP, and SOR. A dose-dependent growth inhibition was observed in TQ, PIP, and SOR-treated cells compared to control cells. In HepG2 cells, the IC50 values for TQ, PIP, and SOR were 31.57, 65.62, and 10.83 µM, respectively. On the other hand, the IC50 for the same compounds in MDA-MB-231 cells were 29.92, 102.6, and 23.69 µM, respectively (Figs. 1A-F).
Fig. 1.
Inhibitory effect of thymoquinone (TQ), piperine (PIP), and sorafenib (SOR) on the proliferation of HepG2 and MDA-MB-231 cells: Cells were exposed to different concentrations of each compound for 48 hs and cell viability was determined by MTT assay
The IC50 values for the combination treatments were investigated and presented in Table 3. In HepG2 cells, treatment with different concentrations (IC10—IC50) of TQ and PIP alone and in combination resulted in a significant decrease in the IC50 value for SOR, with the maximum reduction in IC50 (85.78%) detected in the combined treatment with the predetermined IC50 for TQ and PIP. Similarly, the same combined treatment made the SOR IC50 in MDA-MB-231 cells drop by 75.13%.
Table 3.
IC50 values in (µM) and (%) change for Sorafenib in combination with different doses of Thymoquinone (TQ) and/or Piperine (PIP) against HepG2 and MDA-MB-231
| IC50 of SOR (% change) | ||
|---|---|---|
| HepG2 | MDA-MB-231 | |
| Sorafenib alone | 10.83 ± 0.54 (0) | 23.69 ± 0.85 (0) |
| SOR + TQ IC10 | 10.21 ± 0.41 (5.7) | 22.24 ± 0.98 (6.1) |
| SOR + TQ IC20 | 8.55*** ± 0.24 (21.05) | 19.48* ± 0.57 (17.77) |
| SOR + TQ IC30 | 5.05*** ± 0.81 (53.3) | 15.75*** ± 0.75 (33.51) |
| SOR + TQ IC40 | 4.54*** ± 0.32 (58.7) | 12.63*** ± 0.35 (46.68) |
| SOR + TQ IC50 | 3.91*** ± 0.45 (63.89) | 11.75*** ± 0.47 (50.4) |
| SOR + PIP IC10 | 10.52 ± 0.72 (2.86) | 21.35 ± 0.79 (9.87) |
| SOR + PIP IC20 | 10.24 ± 0.47 (5.44) | 19.20* ± 0.53 (18.95) |
| SOR + PIP IC30 | 7.57** ± 0.82 (30.1) | 14.75*** ± 0.437 (37.73) |
| SOR + PIP IC40 | 5.12*** ± 0.22 (52.72) | 10.85*** ± 0.48 (54.2) |
| SOR + PIP IC50 | 3.14*** ± 0.18 (71.0) | 10.5*** ± 0.37 (55.67) |
| SOR + TQ IC10 + PIP IC10 | 9.34* ± 0.42 (13.7) | 19.54* ± 0.82 (17.51) |
| SOR + TQ IC20 + PIP IC20 | 7.88*** ± 0.29 (27.23) | 16.33*** ± 0.57 (31.06) |
| SOR + TQ IC30 + PIP IC30 | 4.24*** ± 0.32 (60.84) | 12.47*** ± 0.90 (47.36) |
| SOR + TQ IC40 + PIP IC40 | 3.17*** ± 0.40 (70.72) | 10.48*** ± 0.37 (55.76) |
| SOR + TQ IC50 + PIP IC50 | 1.54*** ± 0.12 (85.78) | 5.89*** ± 0.65 (75.13) |
Data are represented as mean ± standard derivation of three independent experiments. Student paired t-test was used to determine significantly-different IC50 values (µM) compared to Sorafenib IC50; * p ˂ 0.05, ** p ˂ 0.01, and *** p ˂ 0.001
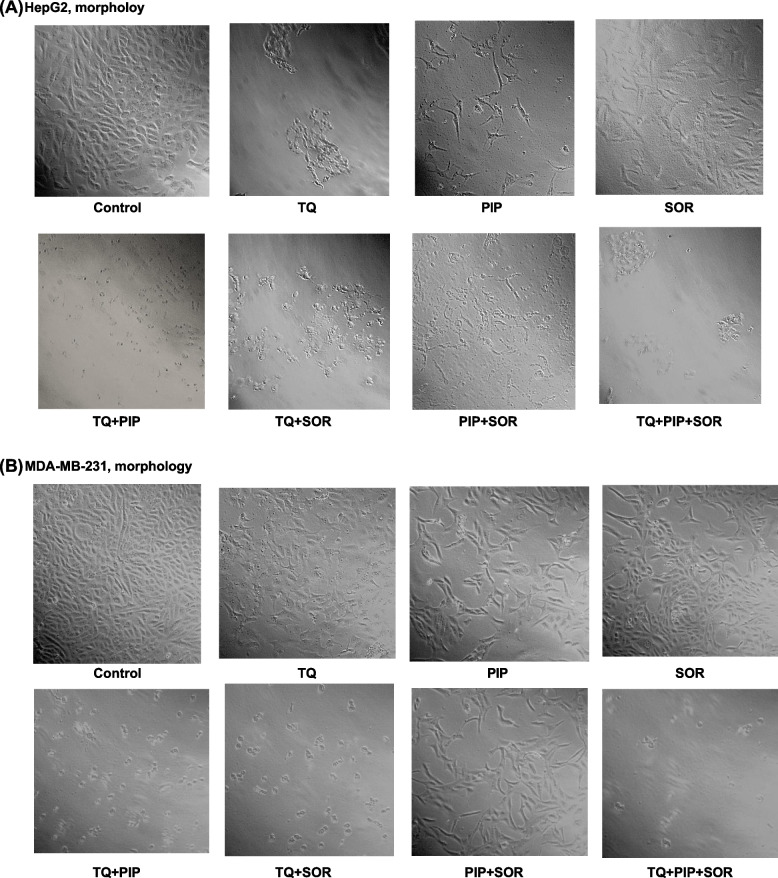
Microscopic examination of cells after exposure to TQ, PIP, and SOR for 48 hs showed various degrees of cytotoxicity depending on the treatment and cell line (Figs. 2A-B). HepG2 and MDA-MB-231 showed noticeable lower cell numbers, reduced viability, and morphological alterations such as losing normal architecture, cell shrinkage appearing as round, wrinkled in shape, condensation of cytoplasm, and increase in membrane roughness and losing the capacity to attach to the culture-plate surface. The highest cytotoxicity was observed after treatment of HepG2 with TQ + PIP + SOR and MDA-MB-231 with TQ + SOR. In contrast, control cells displayed no observable morphological change or death signs and grew efficiently, reaching 100% confluency while adhering to the cell culture plate.
Fig. 2.
Representative photographs showing morphological changes in HepG2 and MDA-MB-231 cells after treatment with ½ IC50s of single or combined thymoquinone (TQ), piperine (PIP), and sorafenib (SOR). Cells were examined and photographed under light microscope 200x
Determination of cell death mechanism
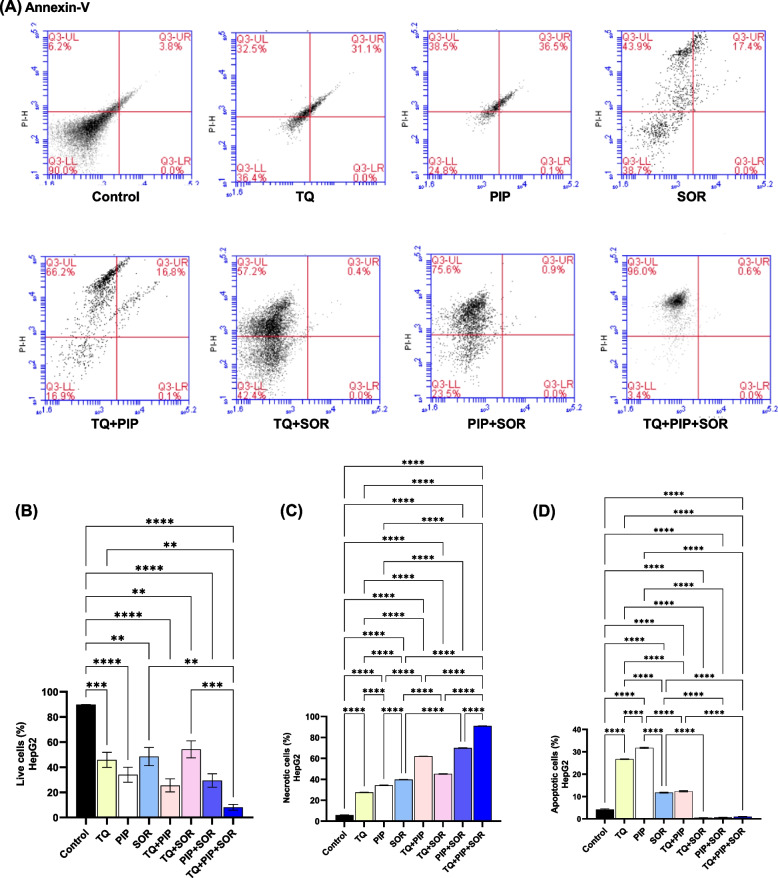
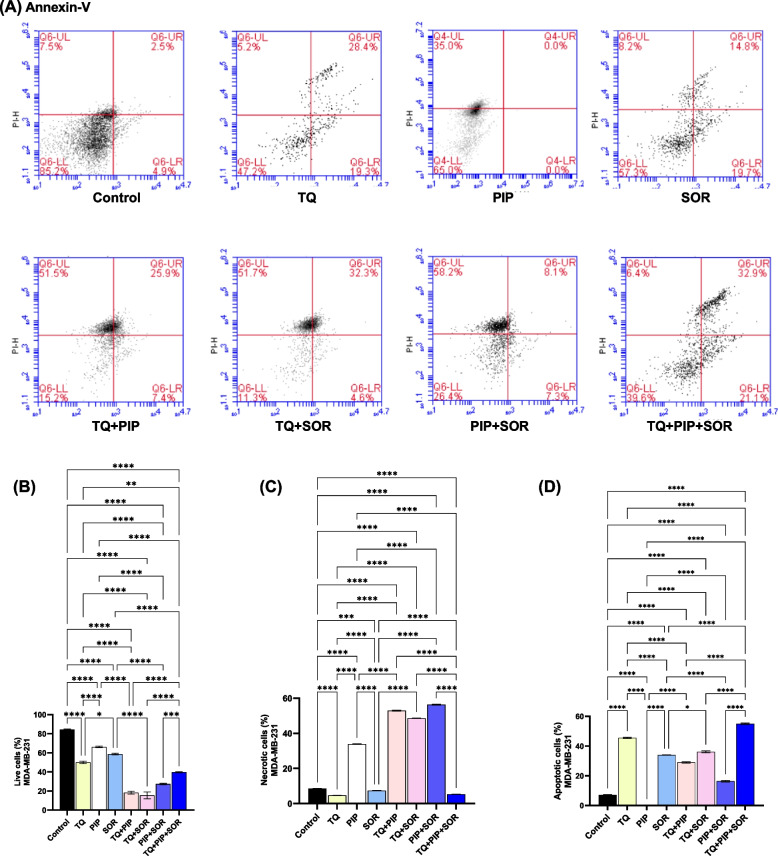
The percentages of viable and dead cells were determined after 48 hs of treatment by double annexin V-FITC/PI staining (Figs. 3A and 4A). Flow cytometry analysis indicated that the highest cytotoxic effect showing the lowest number of viable cells was observed after treatment of HepG2 with TQ + PIP + SOR (8.10% ± 2.37) and MDA-MB-231 with TQ + SOR (15.33% ± 3.59) (Figs. 3B and 4B).
Fig. 3.
Assessment of cell death mechanism in HepG2 after thymoquinone (TQ), piperine (PIP), and sorafenib (SOR) alone and combination treatments for 48 hs. Cells were double stained with annexin V-FITC and PI, analyzed by flow cytometry. Representative dot plots are shown (A). Percentage of live cells, necrotic cells and apoptotic (early + late) (B, C and D). Cell populations were plotted and represented collectively as percentage of total events. Data are expressed as the mean ± SEM; n = 3. Means within columns carrying * are significantly different at (p ˂0.05), ** (p ˂ 0.01), *** (p ˂ 0.001) and **** (p ˂ 0.0001)
Fig. 4.
Assessment of cell death mechanism in MDA-MB-231 after thymoquinone (TQ), piperine (PIP), and sorafenib (SOR) alone and combination treatments for 48 hs. Cells were double stained with annexin V-FITC and PI, analyzed by flow cytometry. Representative dot plots are shown (A), percentage of live cells, necrotic cells and apoptotic (early + late) (B, C and D). Cell populations were plotted and represented collectively as percentage of total events. Data are expressed as the mean ± SEM; n = 3. Means within columns carrying * are significantly different at (p ˂0.05), ** (p ˂ 0.01), *** (p ˂ 0.001) and **** (p ˂ 0.0001)
The cell death mechanism (apoptosis vs. necrosis) was investigated using flow cytometry by analyzing the cells in (early + late) apoptosis vs. necrotic cells. The highest percentage of apoptotic cells were detected after treatment of HepG2 with PIP (31.77% ± 0.29) and MDA-MB-231 cells with TQ + PIP + SOR (55.0% ± 0.46) (Figs. 3D and 4D).
On the other hand, the highest percentage of necrosis was observed after treatment of HepG2 with TQ + PIP + SOR (90.97% ± 0.03) and MDA-MB-231 with PIP + SOR (56.33% ± 0.24) (Figs. 3C and 4C).
Effect of TQ, PIP, and SOR on cell cycle phases
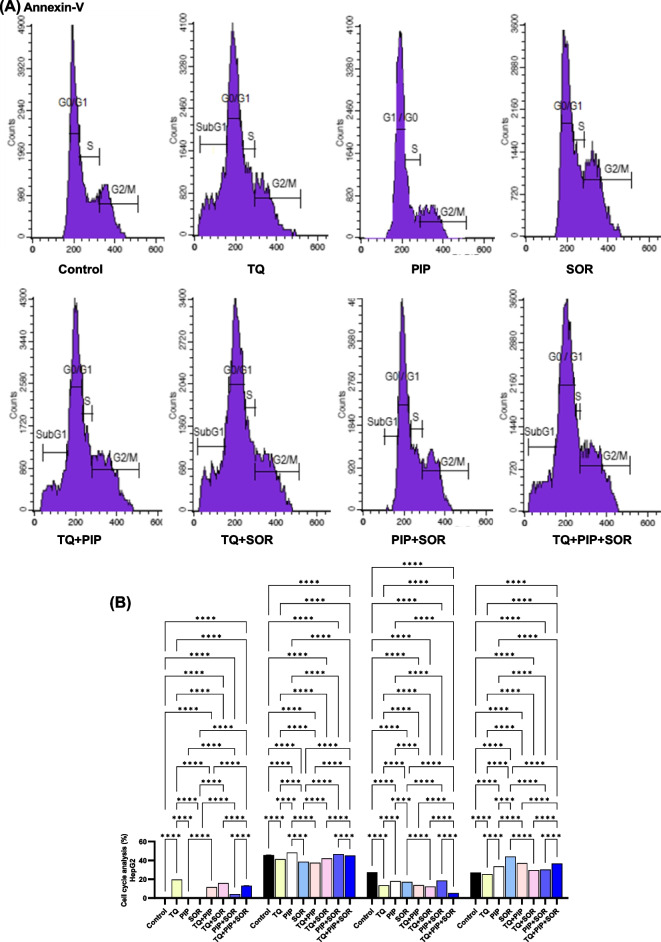
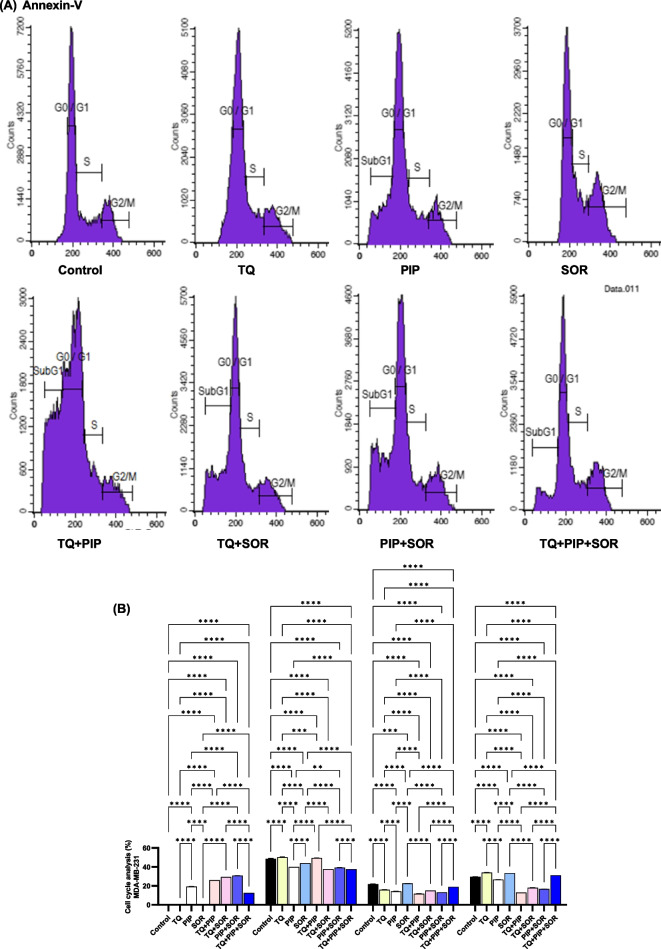
The effects of TQ, PIP, and SOR and their combination on the HepG2 and MDA-MB-231 cell cycle progression were evaluated by assessment of DNA content using flow cytometry. Representative histogram data files and cell cycle phases plotted as the percentage of total gated events are shown in Figs. 5A and 6A. In HepG2, all TQ, PIP, SOR, and their combinations treatments caused a significant G2/M cell cycle arrest, with SOR showing the highest (44.16% ± 0.1, p < 0.0001) significant arrest compared to control cells (27.01% ± 0.5) (Fig. 5B). Simultaneously, all treatments significantly reduced the cell percentage undergoing DNA synthesis compared to control cells. The highest significant subG1 peak representing cells with low fragmented DNA was detected in TQ-treated cells (19.61% ± 0.7, p < 0.0001) (Fig. 5B). On the other hand, in MDA-MB-231, TQ followed by SOR single treatments caused the highest significant arrest and cell accumulation in the G2/M (33.93% ± 0.10) and (33.45% ± 0.03), respectively (Fig. 6B). Finally, the highest significant subG1 cell population was detected in PIP + SOR treated cells (30.81% ± 0.5, p < 0.0001), (Fig. 6B).
Fig. 5.
Effect of thymoquinone (TQ), piperine (PIP), and sorafenib (SOR) and their combinations on cell cycle distribution of HepG2 cells. Cell cycle analysis was performed using flow cytometry. Representative histograms are shown (A), Percentage of cells in each cell cycle phases (B). Data are expressed as the mean ± SEM; n = 3. Means within columns carrying * are significantly different at (p ˂0.05), ** (p ˂ 0.01), *** (p ˂ 0.001) and **** (p ˂ 0.0001)
Fig. 6.
Effect of thymoquinone (TQ), piperine (PIP), and sorafenib (SOR) and their combinations on cell cycle distribution of MDA-MB-231 cells. Cell cycle analysis was performed using flow cytometry. Representative histograms are shown (A), Percentage of cells in each cell cycle phases (B). Data are expressed as the mean ± SEM; n = 3. Means within columns carrying * are significantly different at (p ˂0.05), ** (p ˂ 0.01), *** (p ˂ 0.001) and **** (p ˂ 0.0001)
TQ, PIP, and SOR reduced DNMT3B/HDAC3 and increased miRNA-29c expression
The effect of TQ, PIP, and SOR treatment on the expression of DNMT3B/HDAC3 genes and the tumor suppressor miRNA-29c was examined by RT- PCR.
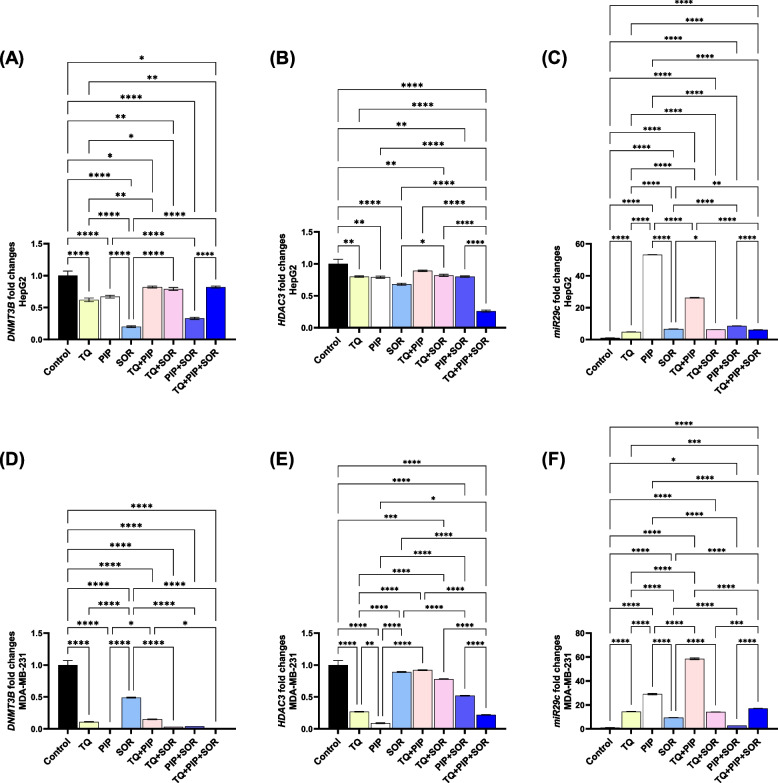
DNMT3B expression analysis represented in Fig. 7A showed that in HepG2 cells, SOR treatment caused the highest reduction in expression (approximately 5 folds) compared to control. On the other hand, PIP and TQ + PIP + SOR treatments suppressed DNMT3B expression almost entirely in MDA-MB-231 cells (Fig. 7D).
Fig. 7.
Real time-PCR analysis for epigenetic-related genes [DNA methyltransferase (DNMT3B), histone deacetylase (HDAC3) and miRNA-29c] after thymoquinone (TQ), piperine (PIP), and sorafenib (SOR) treatments for 48 hs in HepG2 (A-C) and MDA-MB-231 (D-F) cells. The data provided are mean ± SEM (n = 3). Means within columns carrying * are significantly different at (p ˂0.05), ** (p ˂ 0.01), *** (p ˂ 0.001) and **** (p ˂ 0.0001)
The highest decrease in HDAC3 expression was detected after combined TQ + PIP + SOR (3.8-fold) in HepG2 cells and PIP single treatment (11-fold) in MDA-MB-231, (Figs. 7B and 7E).
Finally, PIP alone and combined with TQ caused the most significant increase in miRNA-29c expression in HepG2 (53-fold) and MDA-MB-231 (58 folds), respectively, compared to control cells (Figs. 7C and 7F).
Molecular Docking Study
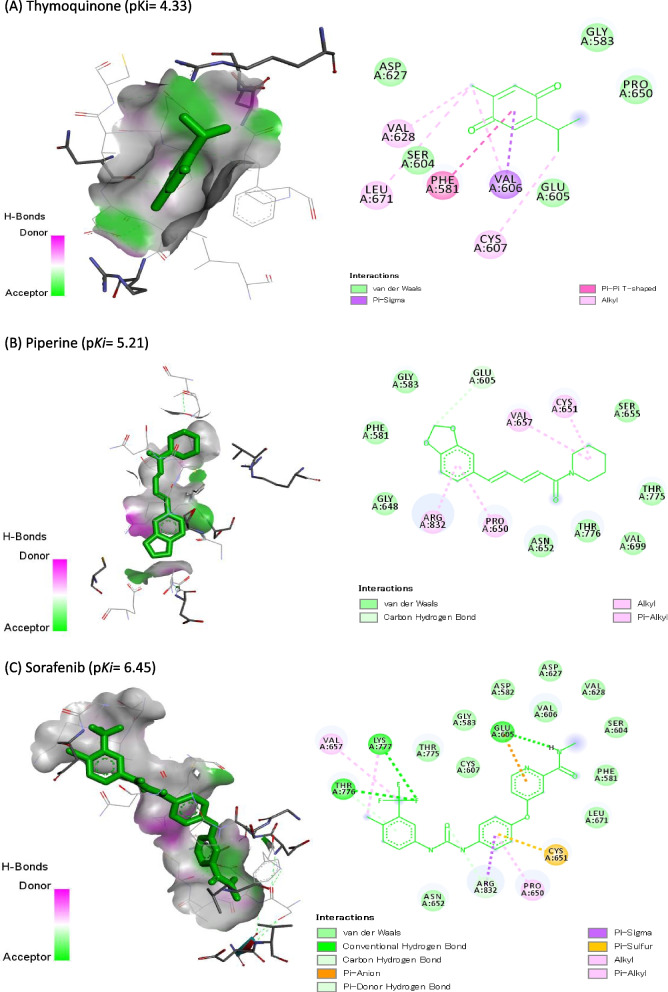
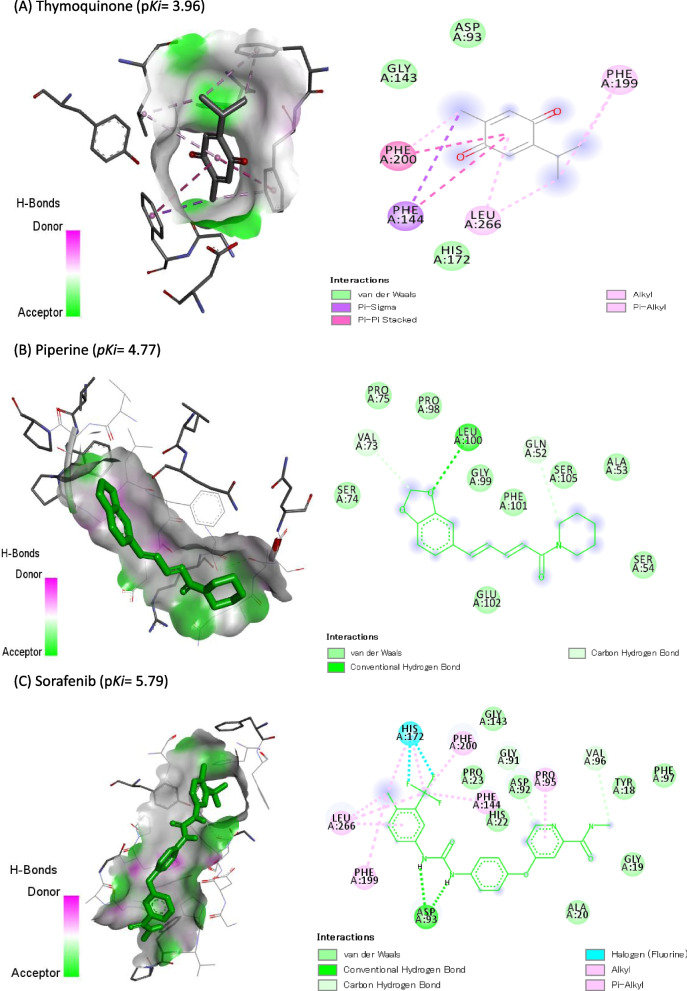
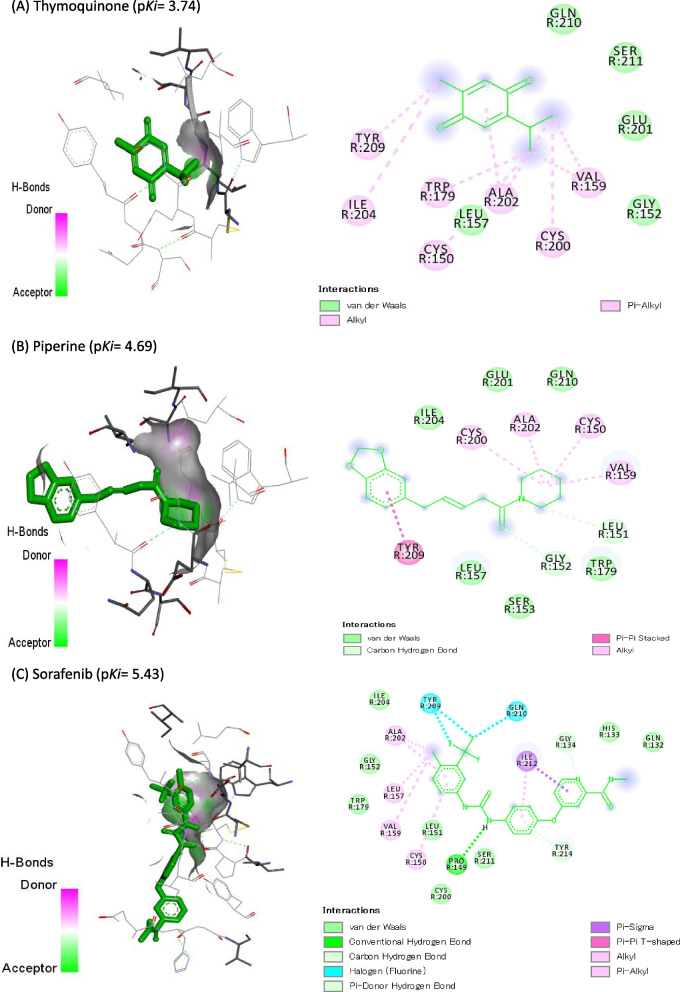
Molecular docking of TQ, PIP, and SOR against DNMT3B (6KDL-A), HDAC3 (4A69-A), and VEGFR-2 (3V2A-A) are represented in Table 4. SOR showed the highest binding affinity (pKi: 6.45), (pKi: 5.79), and (pKi: 5.43) toward DNMT3B, HDAC3, and VEGFR-2, respectively. Also, PIP exhibited pKi of 5.21, 4.77, and 4.69 toward DNMT3B, HDAC3, and VEGFR-2, respectively, while TQ exhibited the lowest affinities (4.33, 3.96, and 3.74, respectively). Co-crystallized ligands redocked in DNMT3B, HDAC3, and VEGFR-2 are shown in Figs. 8, 9, and 10, respectively.
Table 4.
Docking score of thymoquinone (TQ), piperine (PIP), and sorafenib (SOR) against DNA methyltransferase (DNMT3B) (target site PDB ID: 6KDL-A), histone deacetylase (HDAC3) (target site PDB ID: 4A69-A), and vascular endothelial growth factor receptor-2 (VEGFR-2) (target site PDB ID:3V2A-A)
| Name of the ligand | DNMT3B (target site PDB ID: 6KDL-A) | HDAC3(target site PDB ID: 4A69-A) | VEGFR-2 (target site PDB ID:3V2A-A) | ||||||
|---|---|---|---|---|---|---|---|---|---|
| Binding Free Energy (kcal/mol) | pKi | Ligand Efficiency (kcal/mol/non-H atom) | Binding Free Energy (kcal/mol) | pKi | Ligand Efficiency (kcal/mol/non-H atom) | Binding Free Energy (kcal/mol) | pKi | Ligand Efficiency (kcal/mol/non-H atom) | |
| Thymoquinone (TQ) | -5.9 | 4.33 | 0.4917 | -5.4 | 3.96 | 0.45 | -5.1 | 3.74 | 0.425 |
| Piperine (PIP) | -7.1 | 5.21 | 0.3381 | -6.5 | 4.77 | 0.3095 | -6.4 | 4.69 | 0.3048 |
| Sorafenib (SOR) | -8.8 | 6.45 | 0.275 | -7.9 | 5.79 | 0.2469 | -7.4 | 5.43 | 0.2313 |
Fig. 8.
Co-crystallized ligands redocked in DNA methyltransferase (DNMT3B), hydrogen bonds (green) and the pi interactions are represented in purple lines with mapping surface showing thymoquinone (TQ), piperine (PIP), and sorafenib (SOR) occupying the active pocket of DNMT3B
Fig. 9.
Co-crystallized ligands redocked in histone deacetylase (HDAC3), hydrogen bonds (green) and the pi interactions are represented in purple lines with mapping surface showing thymoquinone (TQ), piperine (PIP), and sorafenib (SOR) occupying the active pocket of HDAC
Fig. 10.
Co-crystallized ligands redocked in vascular endothelial growth factor receptor-2 (VEGFR-2), hydrogen bonds (green) and the pi interactions are represented in purple lines with mapping surface showing thymoquinone (TQ), piperine (PIP), and sorafenib (SOR) occupying the active pocket of VEGFR-2
TQ, PIP, and SOR interacted with the amino acid residues in the binding site of DNMT3B by 6, 3, and 11 bonds, respectively (Table 5). Hydrophobic interactions were recognized between TQ (1 with PHE:581, 1 with VAL606, 1 with PRO650, and 2 with ARG832), PIP (1 with PRO650, 1 with THY776, and 1 with ARG832), and SOR (1 with VAL606, 2 with PRO650, 2 with VAL657, and 1 with ARG832) and DNMT3B binding site. Also, hydrogen bonds were reported between TQ and SER610 and three bonds between SOR and THY776. Furthermore, SOR interacted with three halogen bonds with THY776 and one charge bond with ARG832.
Table 5.
Molecular interaction of thymoquinone (TQ), piperine (PIP), and sorafenib (SOR) against DNA methyltransferase (DNMT3B) (target site PDB ID: 6KDL-A)
| Thymoquinone (TQ) | Piperine (PIP) | Sorafenib (SOR) | ||
|---|---|---|---|---|
| Total | Favorable | 6 | 3 | 11 |
| Charge | 0 | 0 | 1 | |
| Halogen | 0 | 0 | 3 | |
| Hydrophobic | 5 | 3 | 6 | |
| Hydrogen | 1 | 0 | 3 | |
| Other | 0 | 0 | 1 | |
| Favorable | A: PHE591 | 1 | 0 | 0 |
| A: VAL606 | 1 | 0 | 1 | |
| A: SER610 | 1 | 0 | 0 | |
| A: PRO650 | 1 | 1 | 2 | |
| A: CYS651 | 0 | 0 | 1 | |
| A: VAL657 | 0 | 0 | 2 | |
| A: THR776 | 0 | 1 | 3 | |
| A: ARG832 | 2 | 1 | 2 | |
| Charge | A: ARG832 | 0 | 0 | 1 |
| Halogen | A: THR776 | 0 | 0 | 3 |
| Hydrophobic | A: PHE581 | 1 | 0 | 0 |
| A: VAL606 | 1 | 0 | 1 | |
| A: PRO650 | 1 | 1 | 2 | |
| A: VAL657 | 0 | 0 | 2 | |
| A: THR776 | 0 | 1 | 0 | |
| A: ARG832 | 2 | 1 | 1 | |
| Hydrogen | A: SER610 | 1 | 0 | 0 |
| A: THR776 | 0 | 0 | 3 | |
| Other | A: CYS651 | 0 | 0 | 1 |
Eight hydrophobic interactions were recognized between TQ and PHE144 (2), PHE199 (2), PHE200 (2), and LEU266 (2) in HDAC3’s binding site (Table 6). Also, SOR made nine hydrophobic interactions with PRO095 (1), PHE144 (1), HIS172 (2), PHE199 (1), PHE200 (1), and LEU266 (3). In addition, SOR is bound with LEU233 by three halogen bonding, while bound with GLY91 (1), ASP93 (2), and VAL96 (1) with hydrogen bonds. PIP exhibited only three hydrogen bonds with GLU52, VAL73, and LEU100.
Table 6.
Molecular interaction of thymoquinone (TQ), piperine (PIP), and sorafenib (SOR) against histone deacetylase (HDAC3) (target site PDB ID: 4A69-A)
| Thymoquinone (TQ) | Piperine (PIP) | Sorafenib (SOR) | ||
|---|---|---|---|---|
| Total | Favorable | 8 | 3 | 15 |
| Halogen | 0 | 0 | 2 | |
| Hydrophobic | 8 | 0 | 9 | |
| Hydrogen | 0 | 3 | 4 | |
| Favorable | A: GLN52 | 0 | 1 | 0 |
| A: VAL73 | 0 | 1 | 0 | |
| A: GLY91 | 0 | 0 | 1 | |
| A: ASP93 | 0 | 0 | 2 | |
| A: PRO95 | 0 | 0 | 1 | |
| A: VAL96 | 0 | 0 | 1 | |
| A: LEU100 | 0 | 1 | 0 | |
| A: PHE144 | 2 | 0 | 1 | |
| A: HIS172 | 0 | 0 | 4 | |
| A: PHE199 | 2 | 0 | 1 | |
| A: PHE200 | 2 | 0 | 1 | |
| A: LEU233 | 2 | 0 | 3 | |
| Halogen | A: HIS172 | 0 | 0 | 2 |
| Hydrophobic | A: PRO95 | 0 | 0 | 1 |
| A: PHE144 | 2 | 0 | 1 | |
| A: HIS172 | 0 | 0 | 2 | |
| A: PHE199 | 2 | 0 | 1 | |
| A: PHE200 | 2 | 0 | 1 | |
| A: LEU266 | 2 | 0 | 3 | |
| Hydrogen | A: GLN52 | 0 | 1 | 0 |
| A: VAL73 | 0 | 1 | 0 | |
| A: GLY91 | 0 | 0 | 1 | |
| A:ASP93 | 0 | 0 | 2 | |
| A: VAL96 | 0 | 0 | 1 | |
| A: LEU100 | 0 | 1 | 0 |
The molecular interaction between TQ, PIP, and SOR with VEGFR-2 is represented in Table 7, where they are bound by 4, 3, and 10 bonds, respectively with VEGFR-2’s binding site. TQ bound with PHE258 (2) and PHE288 (1) with three hydrophobic interactions, while PIP bound with VAL171 by one hydrophobic bond. SOR made five hydrophobic interactions with CYC150 (1), VAL159 (1), GLN210 (1), ILE212 (1), and TYR214 (1), while bound with two halogen bindings with GLY134 and TYR214.
Table 7.
Molecular interaction of thymoquinone (TQ), piperine (PIP), and sorafenib (SOR) against vascular endothelial growth factor receptor-2 (VEGFR-2) (target site PDB ID:3V2A-A)
| Thymoquinone (TQ) | Piperine (PIP) | Sorafenib (SOR) | ||
|---|---|---|---|---|
| Total | Favorable | 4 | 3 | 10 |
| Halogen | 0 | 0 | 2 | |
| Hydrophobic | 3 | 2 | 5 | |
| Hydrogen | 1 | 1 | 5 | |
| Favorable | A: GLY134 | 0 | 0 | 1 |
| A: CYS150 | 0 | 0 | 1 | |
| A: GLY152 | 0 | 0 | 2 | |
| A: ASN158 | 0 | 2 | 0 | |
| A: VAL159 | 0 | 0 | 1 | |
| A: VAL171 | 0 | 1 | 0 | |
| A: GLN210 | 0 | 0 | 1 | |
| A: SER211 | 0 | 0 | 1 | |
| A: ILE212 | 0 | 0 | 1 | |
| A: TYR214 | 0 | 0 | 2 | |
| A: PHE258 | 2 | 0 | 0 | |
| A: ARG275 | 1 | 0 | 0 | |
| A: PHE288 | 1 | 0 | 0 | |
| Halogen | A: GLY134 | 0 | 0 | 1 |
| A: TYR214 | 0 | 0 | 1 | |
| Hydrophobic | A: CYC150 | 0 | 0 | 1 |
| A: ASN158 | 0 | 1 | 0 | |
| A: VAL159 | 0 | 0 | 1 | |
| A: VAL171 | 0 | 1 | 0 | |
| A: GLN210 | 0 | 0 | 1 | |
| A: ILE212 | 0 | 0 | 1 | |
| A: TYR214 | 0 | 0 | 1 | |
| A: PHE258 | 2 | 0 | 0 | |
| A: PHE288 | 1 | 0 | 0 | |
| Hydrogen | A: GLY134 | 0 | 0 | 1 |
| A: GLY152 | 0 | 0 | 2 | |
| A: ASN158 | 0 | 1 | 0 | |
| A: SER211 | 0 | 0 | 1 | |
| A: TYR214 | 0 | 0 | 1 | |
| A: ARG275 | 1 | 0 | 0 |
Discussion
SOR was the first systemic compound prescribed by US FDA that significantly increased the survival rate for liver cancer patients [32]. However, the one major disadvantage of SOR is its high toxicity, especially at high doses [33]. Therefore, testing new natural agents that might enhance its effects and allow lower doses, would potentially minimize this toxicity [34]. TQ and PIP are two natural compounds commonly used for medicinal purposes [35, 36]. To the best of our knowledge, combining TQ or PIP with SOR has not been investigated. One study on breast carcinoma xenograft reported a combination between TQ and PIP [37].
In the current study, we showed that combinations of TQ and/or PIP with SOR have significantly enhanced the latter anti-proliferative and cytotoxic effects in both HepG2 and MDA-MB231 cells with variable potency. Overall, HepG2 cells were more responsive to PIP or SOR since both compounds showed lower IC50 values compared with MDA-MB231 cells. This finding agrees with the fact that SOR is prescribed mainly in the treatment of hepatocellular carcinomas [38]. Interestingly, the IC50 values for SOR were significantly diminished in both HepG2 and MDA-MB-231 cells (up to 85% and 75%, respectively) after combined treatment with TQ and/or PIP at different doses. As a consequence, to reduce clinical doses and reduce the common side effects associated with high doses of chemotherapeutic drugs, it is crucial to decrease the 50% inhibitory cytotoxic dose of the chemotherapeutic drug SOR while maintaining its overall cytotoxicity. This could be done through the actions of the natural compounds TQ and PIP.
TQ and PIP alone treatments showed anti-proliferative effects, which agrees with previous studies that reported a decrease in viability of lymphocyte leukaemia cells when treated with TQ [39]. Another study showed that TQ reduced the cell viability of the Huh-7 hepatocellular carcinoma cell line in a dose-dependent manner [40]. On the other hand, Greenshields et al. observed that PIP reduced the proliferation and invasion of MDA-MB-231 cells [41].
Many recent reports, including the current study, indicated promising chemo-modulatory actions of TQ when combined with other chemotherapeutic agents used against various cancers [42, 43]. In 2020, it was reported that TQ enhanced docetaxel efficiency in MDA-MB-231 and MCF-7 cells by reducing its effective dose [44]. Moreover, TQ synergistically improved the anticancer activity of doxorubicin and cisplatin in hepatocellular carcinoma HepG2 cells [45]. Similarly, PIP was also reported to exert chemo-modulatory effects on chemotherapeutic drugs in different cancers [46, 47].
We have investigated the potential mechanisms causing this anti-proliferative effect, such as modulation of cell cycle interphase, cell death (apoptosis vs. necrosis), and epigenetic genome modifications. The cell cycle is vital in maintaining cell growth and tissue homeostasis, abnormalities in cell cycle progression results in serious diseases, including cancer [48]. We showed that SOR single treatment has resulted in significant G2/M cell cycle arrest in HepG2 and MDA-MB231 cells, which agrees with a previous study that was performed on Hep3B, HepG2, PLC-PRF-5, and SK-Hep1, human hepatocellular carcinoma cell lines [49]. However, other studies reported SOR to arrest cells at G0/G1 phase [50, 51]. Similar to SOR and TQ caused a significant G2/M arrest, TQ was previously reported to cause a G2/M phase arrest in HepG2 cells [52]. However, others have reported that exposure of HepG2 cells to TQ arrested cells at the G0/G1 phase [53]. Depending on the cell line under investigation and tumor behaviour, PIP and TQ were previously suggested to cause cell cycle arrest at G0/G1 and G2/M phases by binding to different cell cycle regulatory proteins [54, 55]. This observation explains the different cell cycle arrest phases that might be observed using the same compound.
Impaired apoptosis is reported as one of the mechanisms leading to SOR resistance in cancer cells and the antiapoptotic protein, B-cell lymphoma 2, is suggested to modulate this phenomenon [50]. Many reports have attributed the anticancer effects of TQ and PIP to its selective proapoptotic actions through the regulation of p53, Bcl-2-associated X protein, and B-cell lymphoma 2 equilibrium and activation of the caspase enzymes [46, 56]. We have examined the apoptotic and necrotic cell death after individual and combined TQ, PIP, and SOR treatment. Notably, necrosis-related cell death was the most observed cause of cell death in HepG2 cells regardless of the treatment. In contrast, in MDA-MB231 cells, apoptotic cell death was prevalent in TQ and SOR single treatments and triple TQ + PIP + SOR treatments.
Interestingly, a combination of TQ or PIP with SOR increased the population of necrotic cells by 6.5 and 8 folds, respectively, compared to SOR alone treatment. Such data might be important in future combination therapy studies aiming to bypass apoptosis as a major cell death mechanism in SOR-resistant cancer cells. Bypassing cancer drug resistance by induction of necroptosis is under clinical investigation as a promising therapeutic mechanism against apoptosis-resistant cancer cells [57].
The current study showed that both TQ and PIP potentiated the anti-HDAC3 and anti-DNMT3B effect of SOR, causing a significant drop in HDAC3 and DNMT3B expression levels. HDACs and DNMT3B act as transcriptional repressors for tumor suppressor genes, high mRNA levels of HDAC3 and DNMT3B are associated with poor prognosis in patients with different types of cancer [58, 59]. Combination therapy with histone deacetylases (HDACi) or (DNMT3B) inhibitors are currently under investigation for achieving a full cancer therapeutic potential [60, 61]. Several studies have already reported the synergistic effects of treatment with HDACi and various chemotherapeutic drugs [62, 63]. SOR, TQ, and PIP were reported to act as HDACi and DNMT3B inhibitors [64–66]. Furthermore, molecular docking revealed that TQ, PIP, and SOR formed hydrophobic and hydrogen bonds with DNMT3B and HDACi, indicating their affinity for inhibiting DNMT3B and HDACi.
In the same way, TQ, PIP, and SOR can bind effectively to VEGFR-2 and inhibit angiogenesis. More research is needed to figure out how TQ, PIP, SOR, and their combinations affect cancer angiogenesis.
The miR-29C has been identified as a crucial miRNA in several cancers; it regulates several oncogenic processes, including epigenetics. The miR-29 family was reported to function as tumor suppressor microRNA through sponging DNMT3A and DNMT3B. However, the biological activity of miR-29C in cancer development and progression is still disputed, most studies reported miR-29C as a tumor suppressor, and others suggested it acts as an oncogene [67]. miR-29b levels were oppositely related to HDAC levels in vitro and human tissue [68]. To the best of our knowledge, the effect of SOR, TQ, and PIP on miR-29C expression levels was not investigated before; the current study confirmed the tumor suppressor role of miR-29C since all our treatments have caused a significant increase in miR-29C expression levels with the highest increase detected in PIP alone (53-fold in HepG2) and PIP + TQ (58-fold in MDA-MB-231).
The molecular docking study was based on assessing the binding energy and binding affinity of ligand-receptor interactions as reflected by the docking score in kcal/mol. A lower docking score indicates a higher binding affinity. The molecular docking results showed a strong affinity of SOR to DNMT3B, and HDAC3, followed by PIP and then TQ.
DNA methylation occurs almost exclusively in CpG islands in mammals catalyzed by DNA methyltransferases (DNMTs). DNMT1 has been shown to maintain methylation in somatic cells, and DNMT3a and DNMT3B are thought to be involved in de novo DNA methylation in embryonic stem cells and early embryos. It was recently found that DNMT1, DNMT3a, and DNMT3B are overexpressed in several human tumors, compared to levels in corresponding normal tissues [69–71]. Preclinical and clinical studies demonstrated that the anticancer properties of bioactive components (i.e., parthenolide, folate, retinoids, etc.) may be attributed to its influence on epigenetic processes through binding to DNMT1 enzymatic centre or/and disrupting DNMT transcription [72]. Inhibiting DNMT3B with RNA interference or a selective DNMT3B inhibitor effectively suppressed the DNMT3B activity in vitro and in vivo. Our docking study showed strong binding between SOR, PIP, and TQ to DNMT3B, which inhibited DNMT3B activity. This finding agrees with another study that showed that DNMT3B inhibitor showed a synergistic effect with SOR in the SOR-resistant Hep3B cells [73].
Genome acetylation is one of the most important epigenetic modifications in promoters of genes that regulate the cell cycle, differentiation, cell growth, and survival in cancer [74]. The acetylation of active genes is controlled by the expression and activity of HDAC [75]. Recently, several reports have shown some dietary phytochemicals as HDAC inhibitors [76–78]. HDAC inhibitors lead to increased histone acetylation and transcriptional upregulation of gene expression, inducing cancer cell cycle arrest, apoptosis, and necrosis in a variety of transformed cell lines by several mechanisms depending on the cancer type; HDAC inhibitors, and doses [79]. We showed strong binding between SOR, PIP, and TQ to HDAC, which would probably inhibit HDAC biological activity through disrupting protein–protein interactions important for HDAC activity, as recently suggested [80]. Induction of apoptosis seems to be the predominant route of HDACi-induced cell death [81]; this agrees with our data showing apoptosis as the main cell death mechanism in PIP-treated HepG2 cells.
Conclusion
The present study showed that TQ and PIP enhance SOR's anti-tumor and cytotoxic effects against hepatocellular carcinoma and triple-negative breast cancer cells. In our study, we studied cell cycle arrest, cell toxicity, apoptosis, and necrosis induction, as well as molecular epigenetic mechanisms that reduce DNMT3B and HDAC3 expression and increase miR-29C expression. Additionally, the results of the molecular docking study validated and supported our in vitro findings.
Supplementary Information
Additional file 1. Sorafenib anticancer potentials.
Additional file 2. Cancer clinical trials of sorafenib.
Additional file 3. The anticancer potential of Thymoquinone.
Additional file 4. Thymoquinone anticancer clinical trials.
Additional file 5. Piperine anticancer potentials.
Additional file 6. Piperine anticancer clinical trials.
Acknowledgements
NA.
Abbreviations
- DNMT3B
DNA methyltransferase
- HDAC3
Histone deacetylase
- PIP
Piperine
- SOR
Sorafenib
- TQ
Thymoquinone
Authors’ contributions
Author contributions: Conceptualization, A.A.E., A.E., A.F.S., S.A.E., T.E.S and H.M.; Formal analysis, A.A.E., A.E., A.F.S., A.H.E.F; Investigation, A.F.S., H.M., T.E.S. S.A.E; Project administration, A.A.E., A.E., A.O.B., A.F.S., A.H.E.F; Software, A.H.E.F; Validation A.A.E., A.E., A.F.S; Visualization, M.A.M., A.E., S.A.E., M.G; Writing—original draft, A.F.S., A.H.E.F; Writing—review and editing, A.E., A.F.S., A.H.E.F. All authors have read and agreed to the published version of the manuscript.
Funding
Open access funding provided by The Science, Technology & Innovation Funding Authority (STDF) in cooperation with The Egyptian Knowledge Bank (EKB). NA.
Availability of data and materials
All data generated or analyzed during this study are included in this published article (and its supplementary information files).
Declarations
Ethics approval and consent to participate
NA.
Consent for publication
NA.
Competing interests
The authors declare no competing interests.
Footnotes
Publisher’s Note
Springer Nature remains neutral with regard to jurisdictional claims in published maps and institutional affiliations.
Alaa Elmetwalli, Ali H. El-Far, and Afrah Fatthi Salama contributed equally to this work.
Contributor Information
Alaa Elmetwalli, Email: dr.prof2011@gmail.com.
Afrah Fatthi Salama, Email: afrahsalama@yahoo.com.
References
- 1.Organization, W.H., World health statistics 2018: monitoring health for the SDGs, sustainable development goals. 2018: World Health Organization.
- 2.Petrick JL, et al. International trends in hepatocellular carcinoma incidence, 1978–2012. Int J Cancer. 2020;147(2):317–330. doi: 10.1002/ijc.32723. [DOI] [PMC free article] [PubMed] [Google Scholar]
- 3.Sung H, et al. Global cancer statistics 2020: GLOBOCAN estimates of incidence and mortality worldwide for 36 cancers in 185 countries . CA Cancer J Clin. 2021;71(3):209–249. doi: 10.3322/caac.21660. [DOI] [PubMed] [Google Scholar]
- 4.Brighton, D. and M. Wood, The Royal Marsden Hospital handbook of cancer chemotherapy: a guide for the multidisciplinary team. 2005: Churchill Livingstone.
- 5.Kelland, L.R., Cancer cell biology, drug action and resistance. The royal marsden hospital handbook of cancer chemotherapy, 2005: p. 1–15.
- 6.Scurr, M., I. Judson, and T. Root, Combination chemotherapy and chemotherapy principles. Cancer chemotherapy’, Eds Brighton D, Wood M, London: Churchill Livingstone, 2005: p. 17–30.
- 7.Thackery, E., The Gale Encyclopedia of Cancer: LZ. Vol. 2. 2002: Gale Cengage.
- 8.Siegel AB, et al. Sorafenib: where do we go from here? Hepatology. 2010;52(1):360–369. doi: 10.1002/hep.23633. [DOI] [PMC free article] [PubMed] [Google Scholar]
- 9.Cragg GM, Newman DJ. Plants as a source of anti-cancer agents. J Ethnopharmacol. 2005;100(1–2):72–79. doi: 10.1016/j.jep.2005.05.011. [DOI] [PubMed] [Google Scholar]
- 10.Khan H. Medicinal plants in light of history: recognized therapeutic modality. J Evid Based Complementary Altern Med. 2014;19(3):216–219. doi: 10.1177/2156587214533346. [DOI] [PubMed] [Google Scholar]
- 11.Cortez-Trejo M. C. Potential Anticancer Activity of Pomegranate (Punica granatum L.) Fruits of Different Color: In Vitro and In Silico Evidence. Biomolecules. 2022;12:1649. doi: 10.3390/biom12111649. [DOI] [PMC free article] [PubMed] [Google Scholar]
- 12.Malaluan I. N, et al. Antituberculosis and Antiproliferative Activities of the Extracts and Tetrahydrobisbenzylisoquinoline Alkaloids from Phaeanthus ophthalmicus: In Vitro and In Silico Investigations. Philipp. J. Sci. 2022;151:371–381. [Google Scholar]
- 13.Ma L, et al. Plant natural products: promising resources for cancer chemoprevention. Molecules. 2021;26:933. doi: 10.3390/molecules26040933. [DOI] [PMC free article] [PubMed] [Google Scholar]
- 14.Rayan A, Raiyn J, Falah M. Nature is the best source of anticancer drugs: Indexing natural products for their anticancer bioactivity. PLoS ONE. 2017;12(11):e0187925. doi: 10.1371/journal.pone.0187925. [DOI] [PMC free article] [PubMed] [Google Scholar]
- 15.Imran M, et al. Thymoquinone: A novel strategy to combat cancer: A review. Biomed Pharmacother. 2018;106:390–402. doi: 10.1016/j.biopha.2018.06.159. [DOI] [PubMed] [Google Scholar]
- 16.H El-Far, A., Thymoquinone anticancer discovery: possible mechanisms. Current drug discovery technologies, 2015. 12(2): p. 80–89. [DOI] [PubMed]
- 17.El-Far AH, Darwish NH, Mousa SA. Senescent colon and breast cancer cells induced by doxorubicin exhibit enhanced sensitivity to curcumin, caffeine, and thymoquinone. Integr Cancer Ther. 2020;19:1534735419901160. doi: 10.1177/1534735419901160. [DOI] [PMC free article] [PubMed] [Google Scholar]
- 18.El-Far AH, et al. Thymoquinone and costunolide induce apoptosis of both proliferative and doxorubicin-induced-senescent colon and breast cancer cells. Integr Cancer Ther. 2021;20:15347354211035450. doi: 10.1177/15347354211035450. [DOI] [PMC free article] [PubMed] [Google Scholar]
- 19.El-Far AH, et al. Curcumin and Thymoquinone Combination Attenuates Breast Cancer Cell Lines’ Progression. Integr Cancer Ther. 2022;21:15347354221099537. doi: 10.1177/15347354221099537. [DOI] [PMC free article] [PubMed] [Google Scholar]
- 20.El-Far AH, et al. Thymoquinone and its nanoformulation attenuate colorectal and breast cancers and alleviate doxorubicin-induced cardiotoxicity. Nanomedicine. 2021;16(17):1457–1469. doi: 10.2217/nnm-2021-0103. [DOI] [PubMed] [Google Scholar]
- 21.Saddiq, A.A., et al., Curcumin, thymoquinone, and 3, 3′-diindolylmethane combinations attenuate lung and liver cancers progression. Frontiers in Pharmacology, 2022: p. 2563. [DOI] [PMC free article] [PubMed]
- 22.(USDA Plants Database (2022). Nigella sativa L. black cumin. Available at: https://plants.sc.egov.usda.gov/home/plantProfile?symbol=NISA2. Accessed July 28.
- 23.Selvendiran K, Sakthisekaran D. Chemopreventive effect of piperine on modulating lipid peroxidation and membrane bound enzymes in benzo (a) pyrene induced lung carcinogenesis. Biomed Pharmacother. 2004;58(4):264–267. doi: 10.1016/j.biopha.2003.08.027. [DOI] [PubMed] [Google Scholar]
- 24.(USDA Plants Database (2022). Piper nigrum. Available at: https://plants.sc.egov.usda.gov/home/plantProfile?symbol=PINI3. Accessed July 28.
- 25.(USDA Plants Database (2022). Piper longum. Available at: https://plants.sc.egov.usda.gov/home/plantProfile?symbol=PILO4. Accessed July 28.
- 26.Ismail N, et al. Novel combination of thymoquinone and resveratrol enhances anticancer effect on hepatocellular carcinoma cell line. Future J Pharm Sci. 2018;4(1):41–46. doi: 10.1016/j.fjps.2017.08.001. [DOI] [Google Scholar]
- 27.Livak K.J, Schmittgen T.D. Analysis of relative gene expression data using real-time quantitative PCR and the 2− ΔΔCT method. methods. 2001;25(4):402–40. doi: 10.1006/meth.2001.1262. [DOI] [PubMed] [Google Scholar]
- 28.Magpantay HD, et al. Antibacterial and COX-2 inhibitory tetrahydrobisbenzylisoquinoline alkaloids from the Philippine medicinal plant Phaeanthus ophthalmicus. Plants. 2021;10:462. doi: 10.3390/plants10030462. [DOI] [PMC free article] [PubMed] [Google Scholar]
- 29.in silico study Jayanti, D. A. P. I. S., Abimanyu, I. G. A. M. & Azzamudin, H. Spirulina platensis’s phycocyanobilin as an antiangiogenesis by inhibiting VEGFR2-VEGFA pathway in breast cancer. JSMARTech J Smart Bioprospecting Technol. 2021;2:87–91. [Google Scholar]
- 30.Teixeira IS, et al. Computer Modeling Explains the Structural Reasons for the Difference in Reactivity of Amine Transaminases Regarding Prochiral Methylketones. Int J Mol Sci. 2022;23:777. doi: 10.3390/ijms23020777. [DOI] [PMC free article] [PubMed] [Google Scholar]
- 31.Hassan NM, et al. Protein-ligand blind docking using QuickVina-W with inter-process spatio-temporal integration. Sci Rep. 2017;7(1):1–13. doi: 10.1038/s41598-017-15571-7. [DOI] [PMC free article] [PubMed] [Google Scholar]
- 32.Llovet JM, et al. Sorafenib in advanced hepatocellular carcinoma. N Engl J Med. 2008;359(4):378–390. doi: 10.1056/NEJMoa0708857. [DOI] [PubMed] [Google Scholar]
- 33.Almhanna K, Philip PA. Safety and efficacy of sorafenib in the treatment of hepatocellular carcinoma. Onco Targets Ther. 2009;2:261. doi: 10.2147/ott.s5548. [DOI] [PMC free article] [PubMed] [Google Scholar]
- 34.Morisaki T, et al. Combining celecoxib with sorafenib synergistically inhibits hepatocellular carcinoma cells in vitro. Anticancer Res. 2013;33(4):1387–1395. [PubMed] [Google Scholar]
- 35.Khader M, Eckl PM. Thymoquinone: an emerging natural drug with a wide range of medical applications. Iran J Basic Med Sci. 2014;17(12):950. [PMC free article] [PubMed] [Google Scholar]
- 36.Shityakov S, et al. Phytochemical and pharmacological attributes of piperine: A bioactive ingredient of black pepper. Eur J Med Chem. 2019;176:149–161. doi: 10.1016/j.ejmech.2019.04.002. [DOI] [PubMed] [Google Scholar]
- 37.Talib WH. Regressions of breast carcinoma syngraft following treatment with piperine in combination with thymoquinone. Sci Pharm. 2017;85(3):27. doi: 10.3390/scipharm85030027. [DOI] [PMC free article] [PubMed] [Google Scholar]
- 38.Raoul J-L, et al. Sorafenib: experience and better management of side effects improve overall survival in hepatocellular carcinoma patients: a real-life retrospective analysis. Liver Cancer. 2019;8(6):457–467. doi: 10.1159/000497161. [DOI] [PMC free article] [PubMed] [Google Scholar]
- 39.Salim LZA, et al. Thymoquinone induces mitochondria-mediated apoptosis in acute lymphoblastic leukaemia in vitro. Molecules. 2013;18(9):11219–11240. doi: 10.3390/molecules180911219. [DOI] [PMC free article] [PubMed] [Google Scholar]
- 40.Ashour AE, et al. Thymoquinone suppression of the human hepatocellular carcinoma cell growth involves inhibition of IL-8 expression, elevated levels of TRAIL receptors, oxidative stress and apoptosis. Mol Cell Biochem. 2014;389(1):85–98. doi: 10.1007/s11010-013-1930-1. [DOI] [PubMed] [Google Scholar]
- 41.Greenshields AL, et al. Piperine inhibits the growth and motility of triple-negative breast cancer cells. Cancer Lett. 2015;357(1):129–140. doi: 10.1016/j.canlet.2014.11.017. [DOI] [PubMed] [Google Scholar]
- 42.Bashmail HA, et al. Thymoquinone enhances paclitaxel anti-breast cancer activity via inhibiting tumor-associated stem cells despite apparent mathematical antagonism. Molecules. 2020;25(2):426. doi: 10.3390/molecules25020426. [DOI] [PMC free article] [PubMed] [Google Scholar]
- 43.Fatfat Z, Fatfat M, Gali-Muhtasib H. Therapeutic potential of thymoquinone in combination therapy against cancer and cancer stem cells. World J Clin Oncol. 2021;12(7):522. doi: 10.5306/wjco.v12.i7.522. [DOI] [PMC free article] [PubMed] [Google Scholar]
- 44.Alkhatib MH, Bawadud RS, Gashlan HM. Incorporation of docetaxel and thymoquinone in borage nanoemulsion potentiates their antineoplastic activity in breast cancer cells. Sci Rep. 2020;10(1):1–12. doi: 10.1038/s41598-020-75017-5. [DOI] [PMC free article] [PubMed] [Google Scholar]
- 45.Jehan S, et al. Thymoquinone selectively induces hepatocellular carcinoma cell apoptosis in synergism with clinical therapeutics and dependence of p53 status. Front Pharmacol. 2020;11:1453. doi: 10.3389/fphar.2020.555283. [DOI] [PMC free article] [PubMed] [Google Scholar]
- 46.Fattah A, et al. The Synergistic Combination of Cisplatin and Piperine Induces Apoptosis in MCF-7 Cell Line. Iran J Public Health. 2021;50(5):1037–1047. doi: 10.18502/ijph.v50i5.6121. [DOI] [PMC free article] [PubMed] [Google Scholar]
- 47.Jeong S, et al. Piperine synergistically enhances the effect of temozolomide against temozolomide-resistant human glioma cell lines. Bioengineered. 2020;11(1):791–800. doi: 10.1080/21655979.2020.1794100. [DOI] [PMC free article] [PubMed] [Google Scholar]
- 48.Feitelson, M.A., et al. Sustained proliferation in cancer: Mechanisms and novel therapeutic targets. in Seminars in cancer biology. 2015. Elsevier. [DOI] [PMC free article] [PubMed]
- 49.Fernando J, et al. Sorafenib sensitizes hepatocellular carcinoma cells to physiological apoptotic stimuli. J Cell Physiol. 2012;227(4):1319–1325. doi: 10.1002/jcp.22843. [DOI] [PMC free article] [PubMed] [Google Scholar]
- 50.Dattachoudhury S, et al. Sorafenib inhibits proliferation, migration and invasion of breast cancer cells. Oncology. 2020;98(7):478–486. doi: 10.1159/000505521. [DOI] [PubMed] [Google Scholar]
- 51.Youssef MM, et al. Novel combination of sorafenib and biochanin-A synergistically enhances the anti-proliferative and pro-apoptotic effects on hepatocellular carcinoma cells. Sci Rep. 2016;6(1):1–12. doi: 10.1038/srep30717. [DOI] [PMC free article] [PubMed] [Google Scholar]
- 52.Sutton KM, Greenshields AL, Hoskin DW. Thymoquinone, a bioactive component of black caraway seeds, causes G1 phase cell cycle arrest and apoptosis in triple-negative breast cancer cells with mutant p53. Nutr Cancer. 2014;66(3):408–418. doi: 10.1080/01635581.2013.878739. [DOI] [PubMed] [Google Scholar]
- 53.Hassan S, et al. In vitro challenge using thymoquinone on hepatocellular carcinoma (HepG2) cell line. Iran J Pharm Res. 2010;4:283–290. [Google Scholar]
- 54.Gali-Muhtasib HU, et al. Molecular pathway for thymoquinone-induced cell-cycle arrest and apoptosis in neoplastic keratinocytes. Anticancer Drugs. 2004;15(4):389–399. doi: 10.1097/00001813-200404000-00012. [DOI] [PubMed] [Google Scholar]
- 55.Rather RA, Bhagat M. Cancer chemoprevention and piperine: molecular mechanisms and therapeutic opportunities. Front Cell Dev Biol. 2018;6:10. doi: 10.3389/fcell.2018.00010. [DOI] [PMC free article] [PubMed] [Google Scholar]
- 56.Tutusaus A, et al. Antiapoptotic BCL-2 proteins determine sorafenib/regorafenib resistance and BH3-mimetic efficacy in hepatocellular carcinoma. Oncotarget. 2018;9(24):16701. doi: 10.18632/oncotarget.24673. [DOI] [PMC free article] [PubMed] [Google Scholar]
- 57.Jafri A, et al. Induction of apoptosis by piperine in human cervical adenocarcinoma via ROS mediated mitochondrial pathway and caspase-3 activation. EXCLI J. 2019;18:154. doi: 10.17179/excli2018-1928. [DOI] [PMC free article] [PubMed] [Google Scholar]
- 58.Hu X, Xuan Y. Bypassing cancer drug resistance by activating multiple death pathways–a proposal from the study of circumventing cancer drug resistance by induction of necroptosis. Cancer Lett. 2008;259(2):127–137. doi: 10.1016/j.canlet.2007.11.007. [DOI] [PubMed] [Google Scholar]
- 59.Niederwieser C, et al. Prognostic and biologic significance of DNMT3B expression in older patients with cytogenetically normal primary acute myeloid leukemia. Leukemia. 2015;29(3):567–575. doi: 10.1038/leu.2014.267. [DOI] [PMC free article] [PubMed] [Google Scholar]
- 60.Zhou L, et al. Prognosis analysis of histone deacetylases mRNA expression in ovarian cancer patients. J Cancer. 2018;9(23):4547. doi: 10.7150/jca.26780. [DOI] [PMC free article] [PubMed] [Google Scholar]
- 61.Cheray M, et al. DNMT inhibitors in cancer, current treatments and future promising approach: inhibition of specific DNMT-including complexes. Epigenetic Diagn Ther. 2015;1(1):37–48. doi: 10.2174/2214083201666150221002056. [DOI] [Google Scholar]
- 62.Suraweera A, O’Byrne KJ, Richard DJ. Combination therapy with histone deacetylase inhibitors (HDACi) for the treatment of cancer: achieving the full therapeutic potential of HDACi. Front Oncol. 2018;8:92. doi: 10.3389/fonc.2018.00092. [DOI] [PMC free article] [PubMed] [Google Scholar]
- 63.Liang B-Y, et al. Synergistic suppressive effect of PARP-1 inhibitor PJ34 and HDAC inhibitor SAHA on proliferation of liver cancer cells. J Huazhong Univ Sci Technolog Med Sci. 2015;35(4):535–540. doi: 10.1007/s11596-015-1466-6. [DOI] [PubMed] [Google Scholar]
- 64.Venturelli S, et al. Epigenetic combination therapy as a tumor‐selective treatment approach for hepatocellular carcinoma. Cancer. 2007;109(10):2132–2141. doi: 10.1002/cncr.22652. [DOI] [PubMed] [Google Scholar]
- 65.Abdullah O, et al. Thymoquinone Is a Multitarget Single Epidrug That Inhibits the UHRF1 Protein Complex. Genes. 2021;12(5):622. doi: 10.3390/genes12050622. [DOI] [PMC free article] [PubMed] [Google Scholar]
- 66.Bayat S, et al. HDACis (class I), cancer stem cell, and phytochemicals: Cancer therapy and prevention implications. Biomed Pharmacother. 2018;97:1445–1453. doi: 10.1016/j.biopha.2017.11.065. [DOI] [PubMed] [Google Scholar]
- 67.Garmpis N, et al. Histone Deacetylase Inhibitors in the Treatment of Hepatocellular Carcinoma: Current Evidence and Future Opportunities. J Pers Med . 2021;11(3):223. doi: 10.3390/jpm11030223. [DOI] [PMC free article] [PubMed] [Google Scholar]
- 68.Kwon JJ, et al. A systematic review of miR-29 in cancer. Mol Ther Oncolytics. 2019;12:173–194. doi: 10.1016/j.omto.2018.12.011. [DOI] [PMC free article] [PubMed] [Google Scholar]
- 69.Amodio N, et al. Therapeutic targeting of miR-29b/HDAC4 epigenetic loop in multiple myeloma. Mol Cancer Ther. 2016;15(6):1364–1375. doi: 10.1158/1535-7163.MCT-15-0985. [DOI] [PubMed] [Google Scholar]
- 70.Nagai M, et al. Expression of DNA (5-cytosin)-methyltransferases (DNMTs) in hepatocellular carcinomas. Hepatol Res. 2003;26(3):186–191. doi: 10.1016/S1386-6346(03)00091-3. [DOI] [PubMed] [Google Scholar]
- 71.Oh B-K, et al. DNA methyltransferase expression and DNA methylation in human hepatocellular carcinoma and their clinicopathological correlation. Int J Mol Med. 2007;20(1):65–73. [PubMed] [Google Scholar]
- 72.Robertson KD, et al. The human DNA methyltransferases (DNMTs) 1, 3a and 3b: coordinate mRNA expression in normal tissues and overexpression in tumors. Nucleic Acids Res. 1999;27(11):2291–2298. doi: 10.1093/nar/27.11.2291. [DOI] [PMC free article] [PubMed] [Google Scholar]
- 73.Liu Z, et al. Modulation of DNA methylation by a sesquiterpene lactone parthenolide. J Pharmacol Exp Ther. 2009;329(2):505–514. doi: 10.1124/jpet.108.147934. [DOI] [PMC free article] [PubMed] [Google Scholar]
- 74.Lai S-C, et al. DNMT3b/OCT4 expression confers sorafenib resistance and poor prognosis of hepatocellular carcinoma through IL-6/STAT3 regulation. J Exp Clin Cancer Res. 2019;38(1):1–18. doi: 10.1186/s13046-019-1442-2. [DOI] [PMC free article] [PubMed] [Google Scholar]
- 75.Audia JE, Campbell RM. Histone modifications and cancer. Cold Spring Harb Perspect Biol. 2016;8(4):a019521. doi: 10.1101/cshperspect.a019521. [DOI] [PMC free article] [PubMed] [Google Scholar]
- 76.Parbin S, et al. Histone deacetylases: a saga of perturbed acetylation homeostasis in cancer. J Histochem Cytochem. 2014;62(1):11–33. doi: 10.1369/0022155413506582. [DOI] [PMC free article] [PubMed] [Google Scholar]
- 77.Evans LW, Ferguson BS. Food bioactive HDAC inhibitors in the epigenetic regulation of heart failure. Nutrients. 2018;10(8):1120. doi: 10.3390/nu10081120. [DOI] [PMC free article] [PubMed] [Google Scholar]
- 78.Rajendran P, et al. Dietary phytochemicals, HDAC inhibition, and DNA damage/repair defects in cancer cells. Clin Epigenetics. 2011;3(1):1–23. doi: 10.1186/1868-7083-3-4. [DOI] [PMC free article] [PubMed] [Google Scholar]
- 79.Eckschlager T, et al. Histone deacetylase inhibitors as anticancer drugs. Int J Mol Sci. 2017;18(7):1414. doi: 10.3390/ijms18071414. [DOI] [PMC free article] [PubMed] [Google Scholar]
- 80.Maolanon AR, Madsen AS, Olsen CA. Innovative strategies for selective inhibition of histone deacetylases. Cell Chem Biol. 2016;23(7):759–768. doi: 10.1016/j.chembiol.2016.06.011. [DOI] [PubMed] [Google Scholar]
- 81.Frew AJ, Johnstone RW, Bolden JE. Enhancing the apoptotic and therapeutic effects of HDAC inhibitors. Cancer Lett. 2009;280(2):125–133. doi: 10.1016/j.canlet.2009.02.042. [DOI] [PubMed] [Google Scholar]
Associated Data
This section collects any data citations, data availability statements, or supplementary materials included in this article.
Supplementary Materials
Additional file 1. Sorafenib anticancer potentials.
Additional file 2. Cancer clinical trials of sorafenib.
Additional file 3. The anticancer potential of Thymoquinone.
Additional file 4. Thymoquinone anticancer clinical trials.
Additional file 5. Piperine anticancer potentials.
Additional file 6. Piperine anticancer clinical trials.
Data Availability Statement
All data generated or analyzed during this study are included in this published article (and its supplementary information files).


