

Abstract
Common genetic variants explain less variation in complex phenotypes than inferred from family-based studies, and there is a debate on the source of this “missing heritability”. We investigated the contribution of rare genetic variants to tobacco use with whole-genome sequences from up to 26,257 unrelated individuals of European ancestries and 11,743 individuals of African ancestries. Across four smoking traits, SNP-based heritability (h2SNP) was estimated from .13 to .28 (SEs .10-.13) in European ancestries with 35–74% of it attributable to rare variants with minor allele frequencies between 0.01% and 1%. These heritability estimates are 1.5–4 times higher than past estimates based on common variants alone and accounted for 60% to 100% of our pedigree-based estimates of narrow-sense heritability (h2ped: .18~.34). In African ancestry samples, h2SNP was estimated from .03 to .33 (SEs .09-.14) across the four smoking traits. These results suggest that rare variants are important contributors to the heritability of smoking.
Keywords: Genetic architecture, tobacco, cigarettes, whole genome sequencing, addiction
Introduction
Characterizing genetic architecture of complex phenotypes is fundamental to understanding genetic influences on human individual differences and has implications in diverse fields including medicine and psychology. The joint distribution of genetic effect sizes and minor allele frequency (MAF) is shaped by natural selection and population history1,2 and informs our understanding of human evolution and gene-mapping strategies for complex traits. The past decade of genome-wide association studies (GWAS) of common genetic variants has expanded our knowledge of this genetic architecture by discovering tens of thousands of genomic loci associated with a wide range of complex phenotypes such as height3, lipids4, diabetes5, and schizophrenia6, to name a few. However, the aggregate effect of common genetic variation typically explains less phenotypic variation than that inferred from traditional family-based studies (e.g., twins, or siblings, or larger pedigrees)7, a difference often referred to as “missing heritability”.
Tobacco use is a complex behavioral trait of high public health concern8–10 and demonstrated genetic and environmental (e.g., policy) influences11,12. Not only is tobacco use a leading cause of global morbidity and mortality, but measures of tobacco use are strong indicators of addiction to nicotine. For example, the number of cigarettes smoked per day is genetically highly correlated (r=.95) with nicotine dependence13 and other commonly used substances14,15. Tobacco use is also considered a part of externalizing dimensions of personality and psychopathology along with other substance use and hyperactive behaviors16. Heritability of smoking behaviors has been estimated at approximately 50% (SE 5%)17 in twin studies, comparable to many other complex behavioral traits.
At the same time, estimates of tobacco use heritability from GWAS of single nucleotide polymorphisms (SNPs) have routinely found much lower SNP-based heritability (h2SNP) estimates18,19. Such analyses to date have been based on common variants with MAF > 1% from GWAS of imputed microarrays. In a recent GWAS of tobacco use in up to 1.1 million individuals, Liu et al. reported h2SNP estimates ranging between 5% and 11%18 with smoking initiation and age of smoking initiation showing the highest and the lowest estimates, respectively18. Even more recently, Evans et al.20 reported h2SNP estimates of 5%–18% for smoking traits in UK Biobank imputed genotypes of up to 323,068 individuals. In this latter study, the estimated contribution of rare variants to the heritability was minimal, likely due to poor imputation of rare variants <1% MAF. Similar to results for other complex traits17,21, some but far from all of the twin-based heritability of smoking behaviors can be attributed to common variants obtained through imputation of microarray genotypes.
There is an extensive literature regarding the possible contributors to missing heritability, including inflated family-based heritability estimates22, increased phenotypic heterogeneity in GWAS compared to family-based studies23, epistasis24, and genetic variants not in linkage disequilibrium (LD) with common variants, including structural21 and rare variants25. Rare genetic variants are one compelling explanation for the missing heritability of fitness-related traits, as one expects negative selection to force deleterious alleles to low frequencies26,27. Common variants, on the other hand, are expected to explain most trait variance under a neutral model where most mutations have little selective effects27,28. The contribution of rare variants can inform competing explanations for the missing heritability as well as competing population genetics models, but this requires large samples of extremely well-imputed microarrays or whole genome sequencing.
To date, SNP-based heritability estimates of complex behaviors have been based on a few million common variants. With imputed variants, the quality of imputation depends on the reference panel used29,30, and even the best imputation strategies perform poorly for variants with MAF < 1% in population-based samples31,32 of unrelated individuals. With the advent of relatively affordable deep whole-genome sequencing (WGS), it is now possible to directly genotype variants of lower frequency in larger samples. While genetic association studies may be underpowered to detect an association between a given single rare variant and a complex trait33, recent extensions of mixed-effects models allows one to estimate a random effect representing the aggregate contribution of rare variants to phenotypic variance over and above common variation31,32. To date, a small number of recent whole-genome sequencing studies have reported evidence that rare variants account for a substantial part of the heritability of anthropometric, transcriptomic, and medical phenotypes34–37 (but see also 38,39 for counterexamples). Notably, rare variants, especially those in regions of low LD, captured a large part of the missing heritability for height and BMI, albeit with large standard errors40.
Here, we used deep whole-genome sequencing (mean depth 30x) from the Trans-Omics for Precision Medicine (TOPMed) program to estimate the heritability explained by variants as rare as MAF of 1 in 10,000 for individuals of European ancestry (up to 26,257 individuals), and 1 in 1,000 for African admixed individuals (up to 11,743 individuals). We performed extensive sensitivity analyses to test the influence of rare-variant population structure along with various analytic parameters on our SNP-based heritability estimates for tobacco use. The study protocol was approved by the Institutional Review Board at the University of Minnesota and the Trans-Omics for Precision Medicine (TOPMed) consortium. Informed consent was obtained originally by participating studies.
Results
Heritability estimates
We estimated heritability of four smoking phenotypes in samples of European ancestries: 1) age of smoking initiation (AgeSmk, N=14,709) which measures the age at which an individual started regularly smoking; 2) cigarettes smoked per day (CigDay, N=15,384), an index of heaviness of smoking and the average number of cigarettes smoked per day as a current or former smoker, grouped into five bins, with higher numbers indicating greater use; 3) smoking cessation (SmkCes, N =17,827), a binary variable indicating whether a person is a current smoker; and 4) smoking initiation (SmkInit, N=26,257), a binary variable indicating people who ever smoked regularly (i.e., over 100 cigarettes) in their life. We stratified SNPs and short indels by their MAF and linkage disequilibrium (LD) so that we have a total of six bins (MAF 5–50%-high LD, MAF 5–50%-low LD, MAF 1–5%-high LD, MAF 1–5%-low LD, MAF 0.1–1%, MAF 0.01–0.1%)32. Variants were assigned to the high-LD group when their LD scores were higher than the median of the variants in the same MAF bin (Table 1). After adjusting for the fixed effects of 10 common variant principle components (PCs), 10 rare variant PCs, age, sex, and a random effect of study, total SNP-based heritability () from variants of all MAF was .226 (SE: .116) for AgeSmk, .134 (.095) for CigDay, .283 (.127) for SmkCes, and .225 (.096) for SmkInit (Fig. 1). Heritability estimates from the two common-variant bins (i.e., MAF 1–50%) – which includes one bin for variants with high LD scores and one bin for variants with low LD scores – were summed to compute total heritability attributable to common variants (). Rare-variant heritability ) was computed likewise from the two MAF 0.01–1% bins, which were not grouped by LD score because most rare variants have low LD (see Methods). Across four smoking phenotypes, rare variants accounted for 35~74% of the total heritability. The majority of the heritability attributable to rare variants was in the rarest frequency bin (MAF 0.01–0.1%), except for CigDay where most was attributed to variants with MAF 0.1–1% (Supplementary Table 1). When we further partitioned rare variants into their functional impact, most of the heritability was localized to lower functional impact (non-protein altering) variants (Supplementary Table 2).
Table 1.
Sample size and number of variants per MAF/LD bin in European ancestry sample
| Number of variants per bin (MAF and Linkage Disequilibrium) a | |||||||
|---|---|---|---|---|---|---|---|
|
| |||||||
| Sample sizeb | 5–50% - HIc | 5–50% - LO | 1–5% - HI | 1–5% - LO | 0.1–1% | 0.01–0.1% | |
|
|
|||||||
| AgeSmk | 14,709 | 3,092,517 | 3,092,534 | 1,342,734 | 1,342,736 | 5,392,813 | 28,280,118 |
| CigDay | 15,384 | 3,092,240 | 3,092,269 | 1,341,881 | 1,341,882 | 5,435,505 | 20,415,037 |
| SmkCes | 17,827 | 3,092,593 | 3,092,594 | 1,340,764 | 1,340,771 | 5,413,019 | 23,483,166 |
| SmkInit | 26,257 | 3,092,454 | 3,092,475 | 1,341,068 | 1,341,071 | 5,395,579 | 21,108,704 |
This shows the number of variants per bin in 1IQR unrelated samples (.025).
Sample size of unrelated individuals
HI=high LD, LO=low LD
Figure 1.
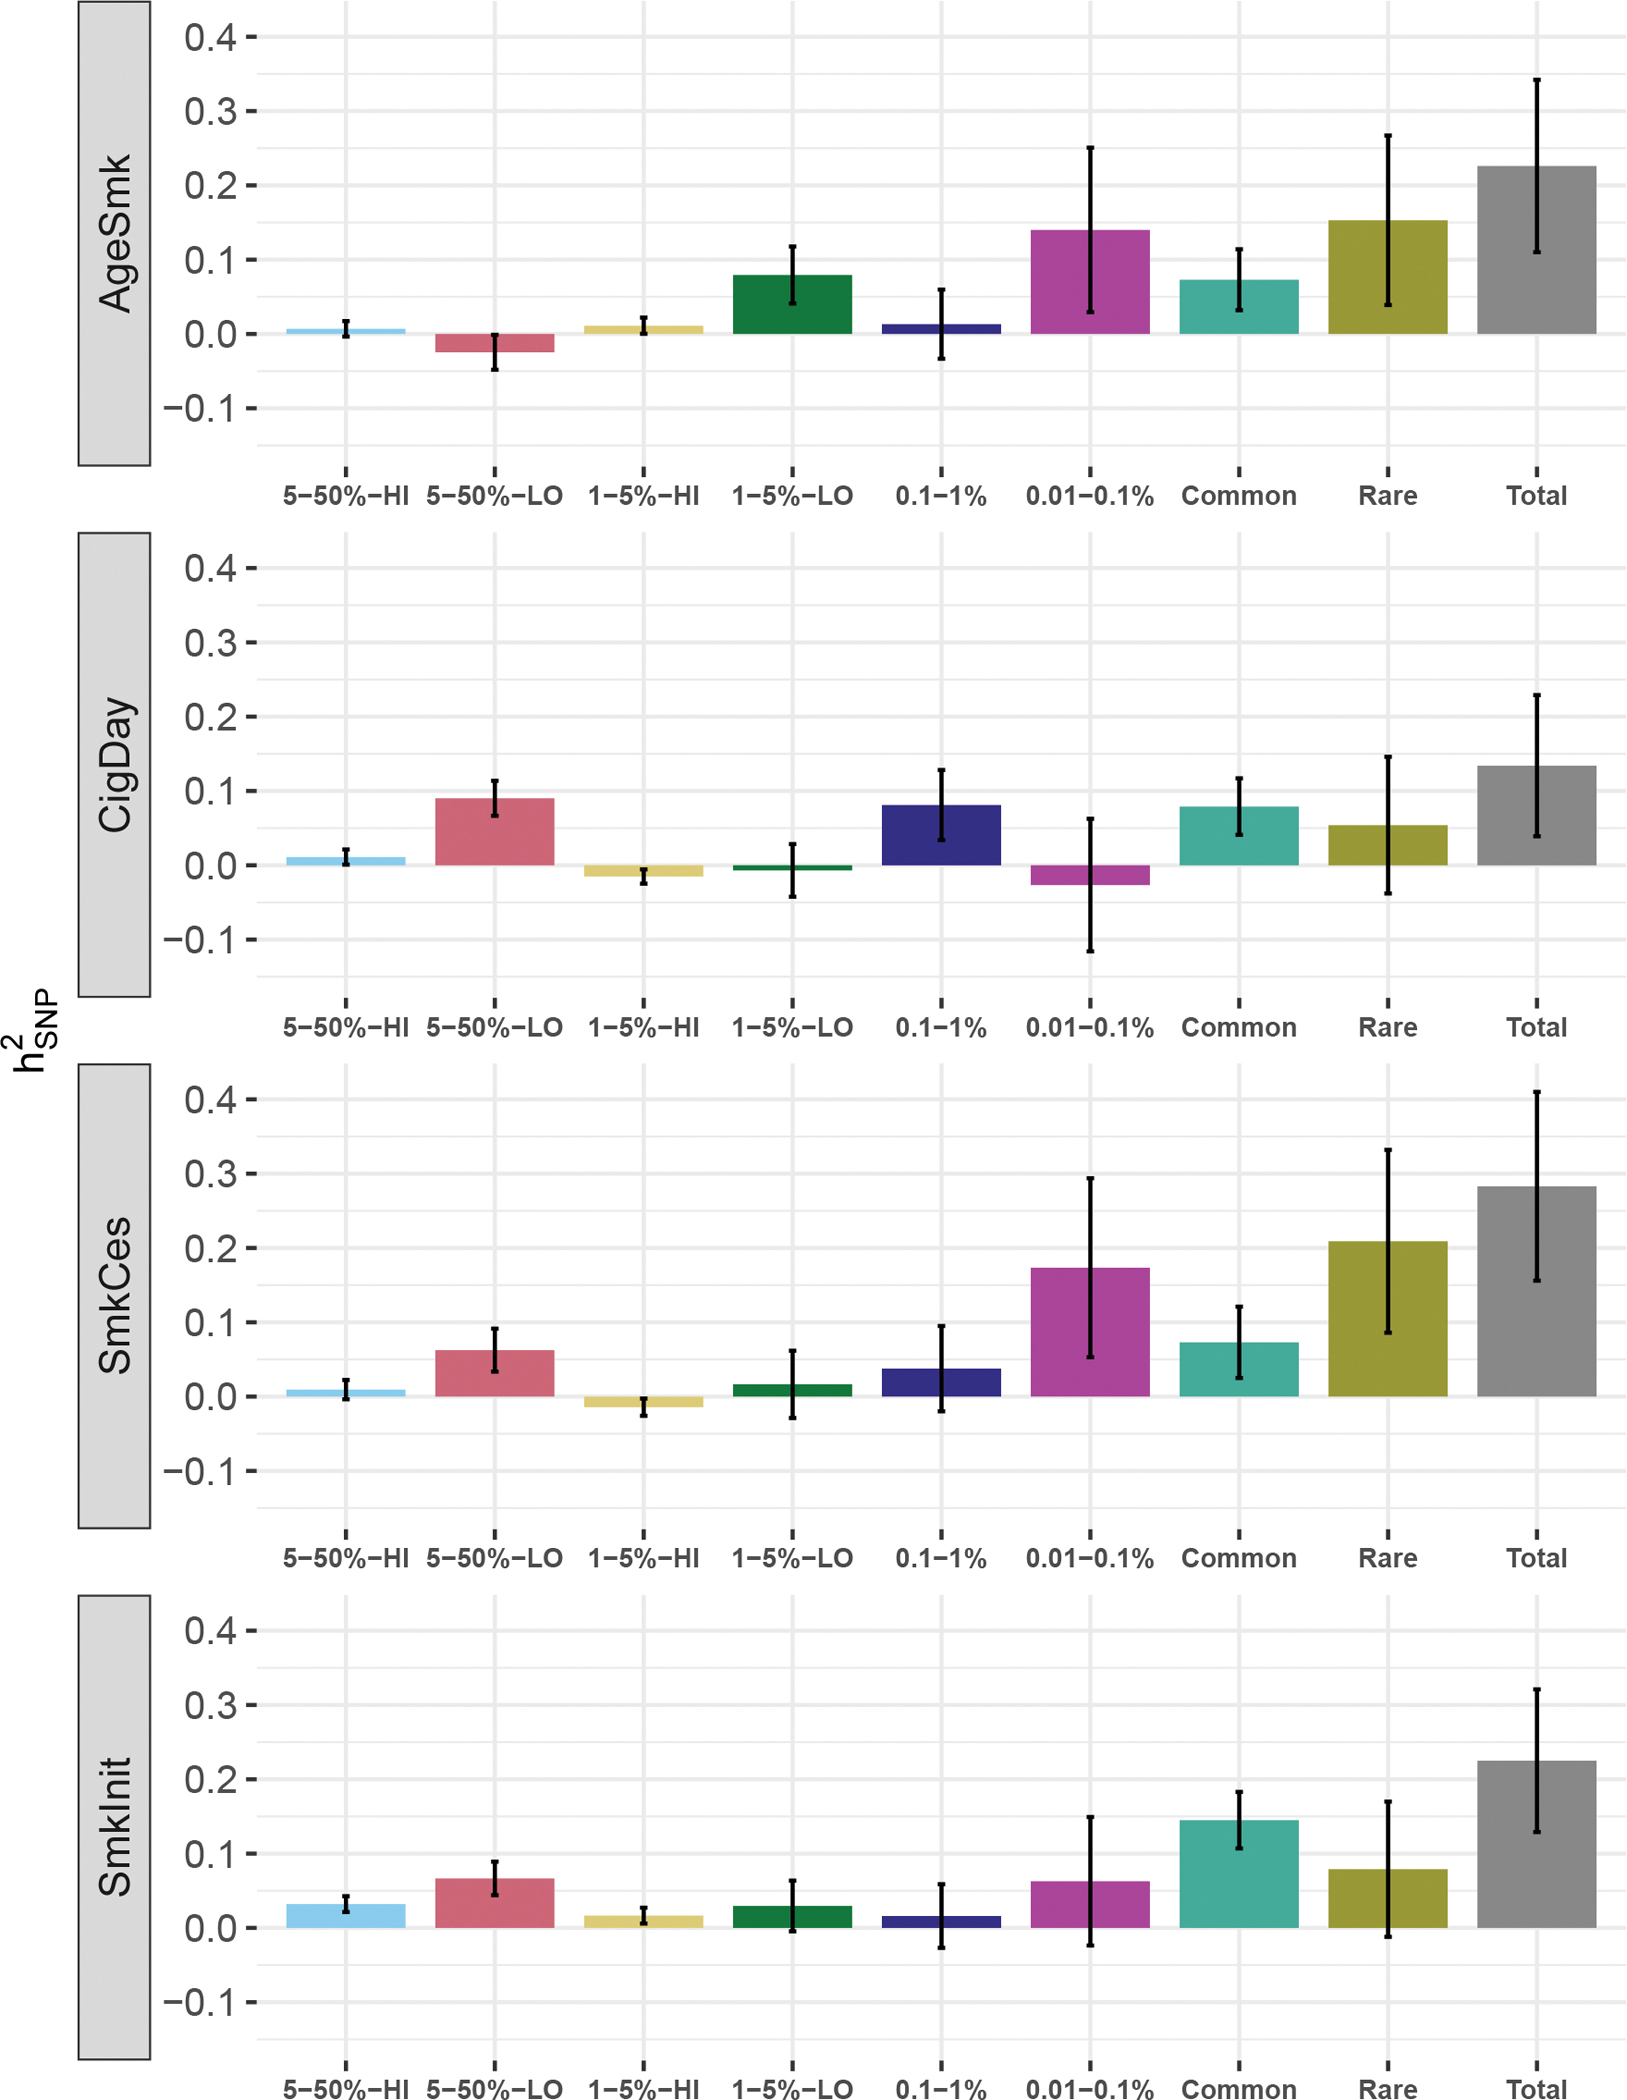
SNP-based heritability estimates in the European ancestry sample for each of the six MAF/LD bins, and sums across bins.
Error bars represent standard errors. The “Rare” bin is the sum of the MAF 0.1–1% and MAF 0.01–0.1%. “Common” is the sum of the other MAF bins. “Total” is the sum of “Rare” and “Common”. HI and LO each indicate high and low LD. All estimates were adjusted for by demographic variables and 20 PCs (half of them from rare variants) as fixed effects along with random effect of cohort except for CigDay which was adjusted for 5 common PCs to allow model convergence.
Sensitivity analyses
We used a variety of sensitivity analyses to evaluate the influence of residual population structure and cryptic relatedness.
First, we evaluated the influence of increasing the number of PCs from 20 to 40 and 100 (half of which derived from common and rare variants) on to test whether greater number of PCs account for potential residual population structure. Results for AgeSmk, SmkCes, and SmkInit were unaffected (Fig. 2 and Supplementary Table 3). We observed model convergence issues when correcting CigDay for large number of PCs, resulting in negative (e.g., −.12) attributable to the rarest MAF bin, which we deemed well outside the plausible range.
Figure 2.
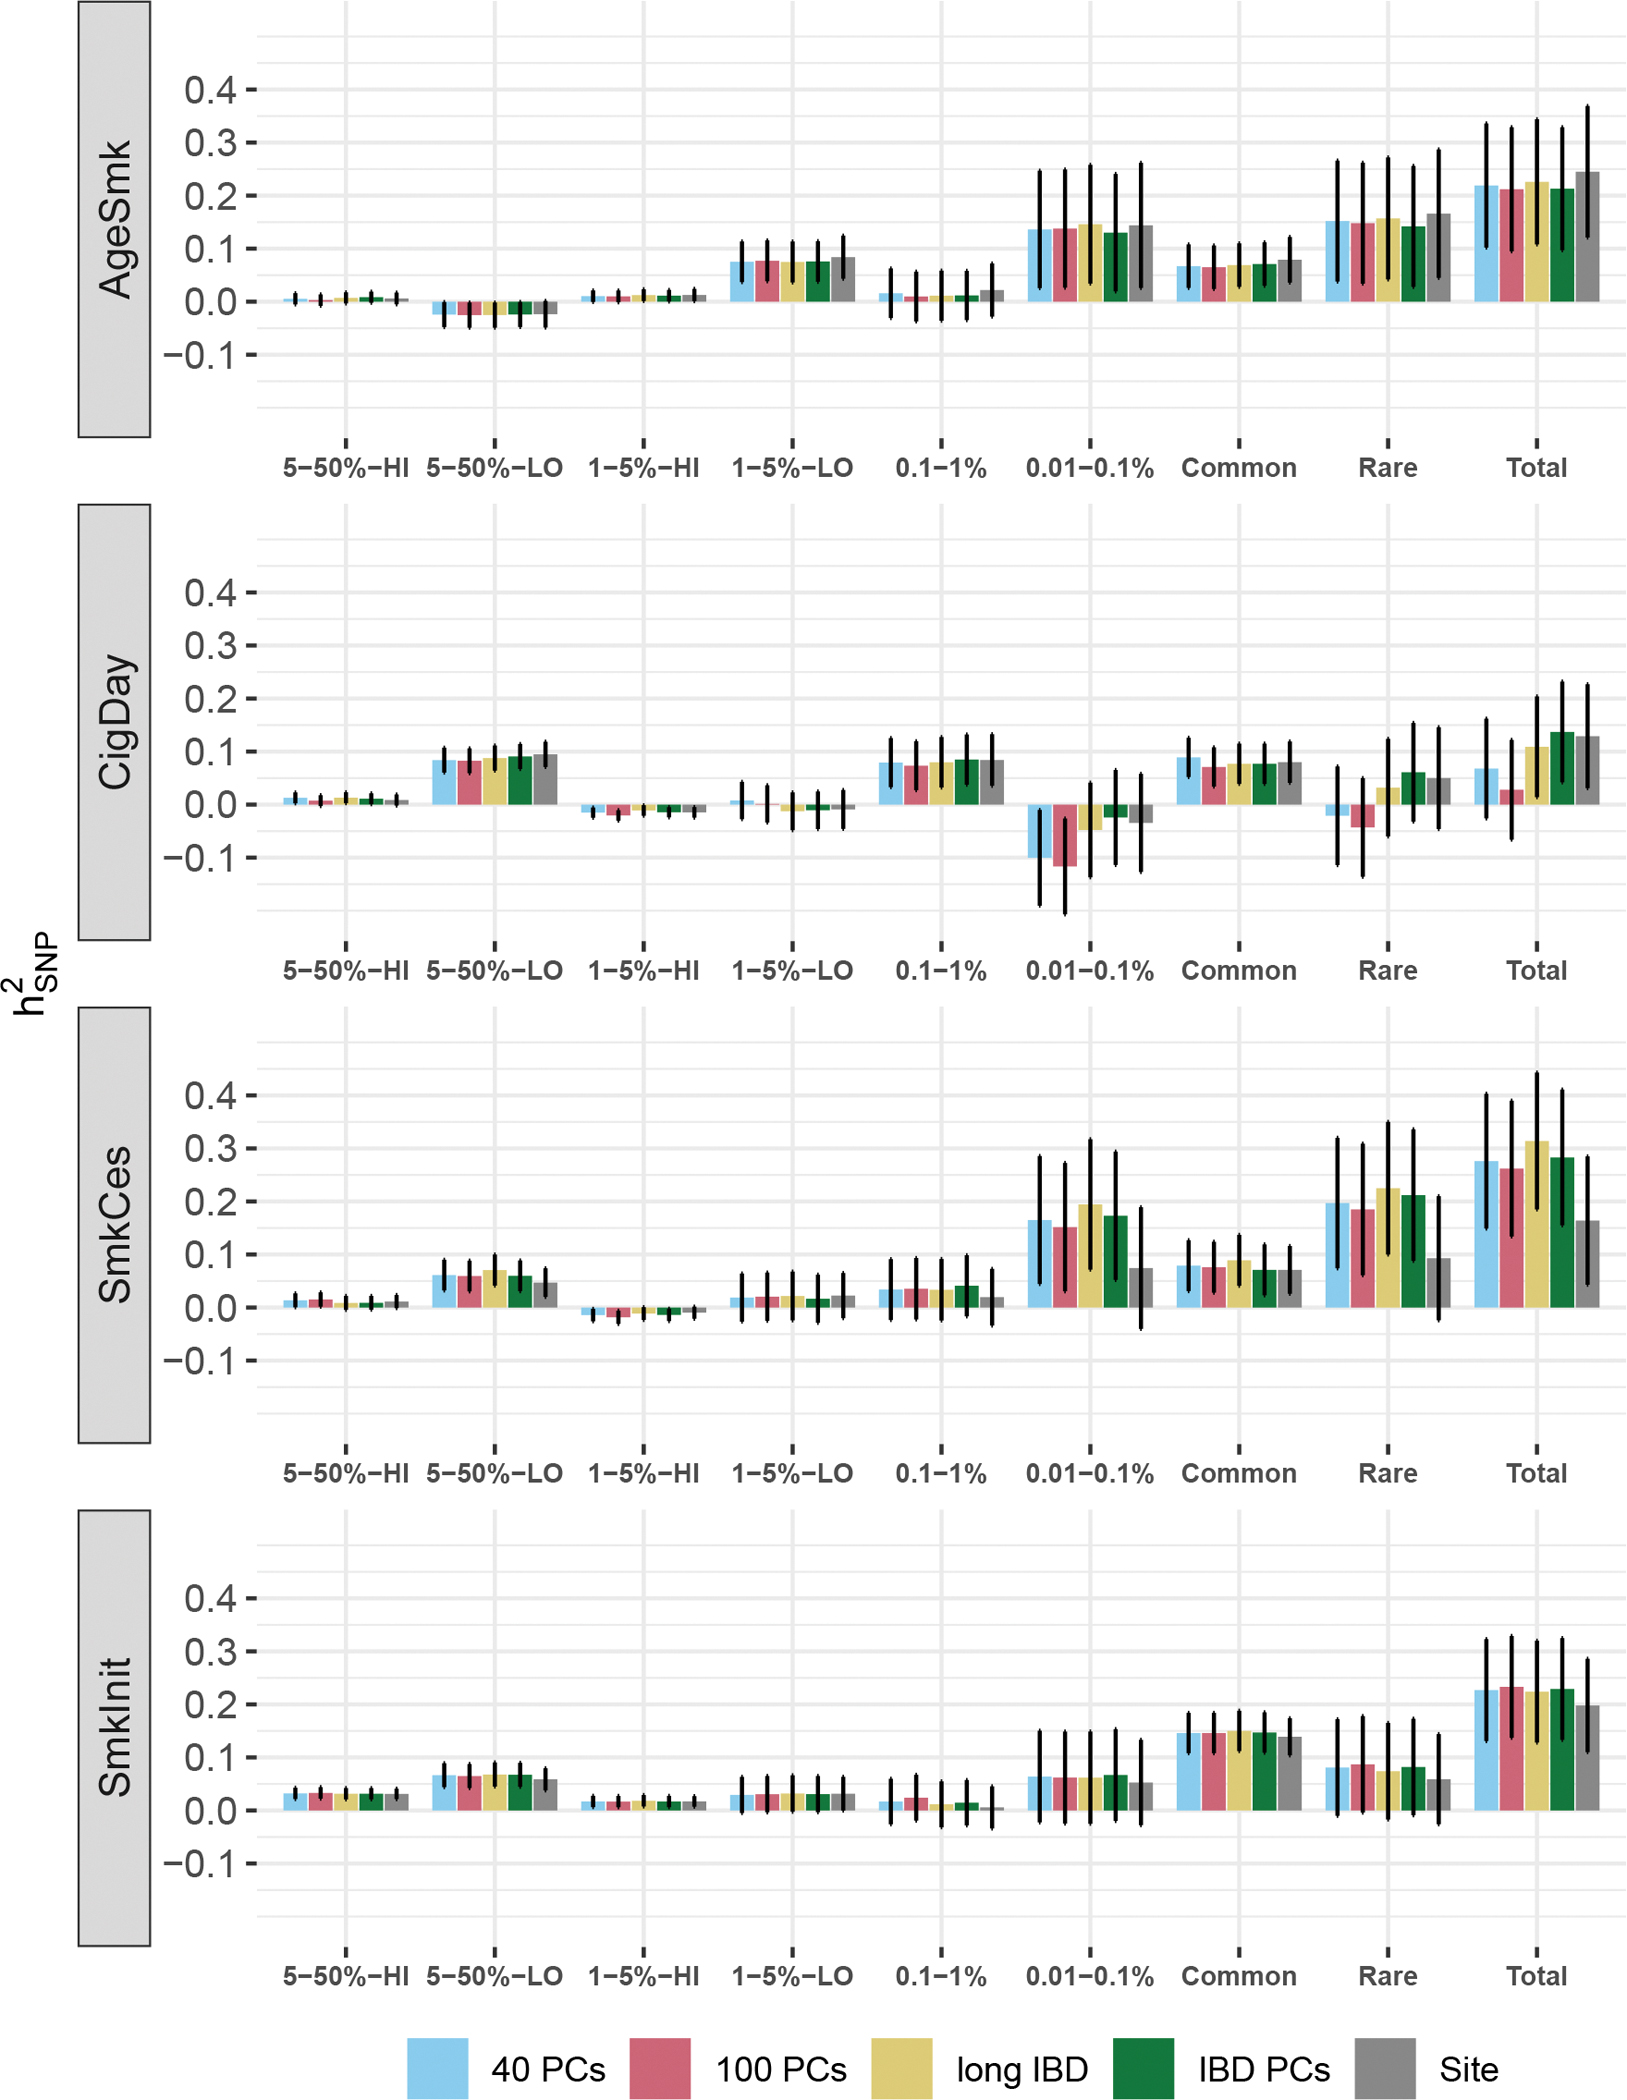
SNP-based heritability estimates in the European ancestry sample from sensitivity analyses
Error bars represent standard errors. The figure shows SNP-based heritability estimates from different sensitivity conditions. Heritability was estimated after adjusting for 20 common and 20 rare variant PCs (“40 PCs”), 50 common and 50 rare variant PCs (“100 PCs”), after removing individuals who share IBD segments more than 2.5% of the total genome length (“long IBD”), after adjusting for the top 20 PCs from the IBD-based GRM matrix (“IBD PCs”), and after adjusting for recruitment site as a random effect (“Site”).
Second, we tested whether , especially that of rare variants, were driven by individuals sharing long identity-by-descent (IBD) segments. Using FastSMC41, we detected about 7.5 million IBD segments longer than 2cM and shared among at least two individuals (mean length=2.50cM, SD=0.50cM). After removing up to 178 individuals whose shared IBD segments stretch longer than 2.5% of the total genome length, did not show meaningful differences with changes in ranging from – 0.025 to 0.031 (Fig. 3 and Supplementary Table 3). Third, to assess the influence of distant family structure on heritability estimates, we adjusted for the top 20 PCs from an IBD-based relatedness matrix in addition to the 20 PCs from rare and common variants and found was not affected with the largest change in being 0.013(Fig. 3 and Supplementary Table 3).
Figure 3.
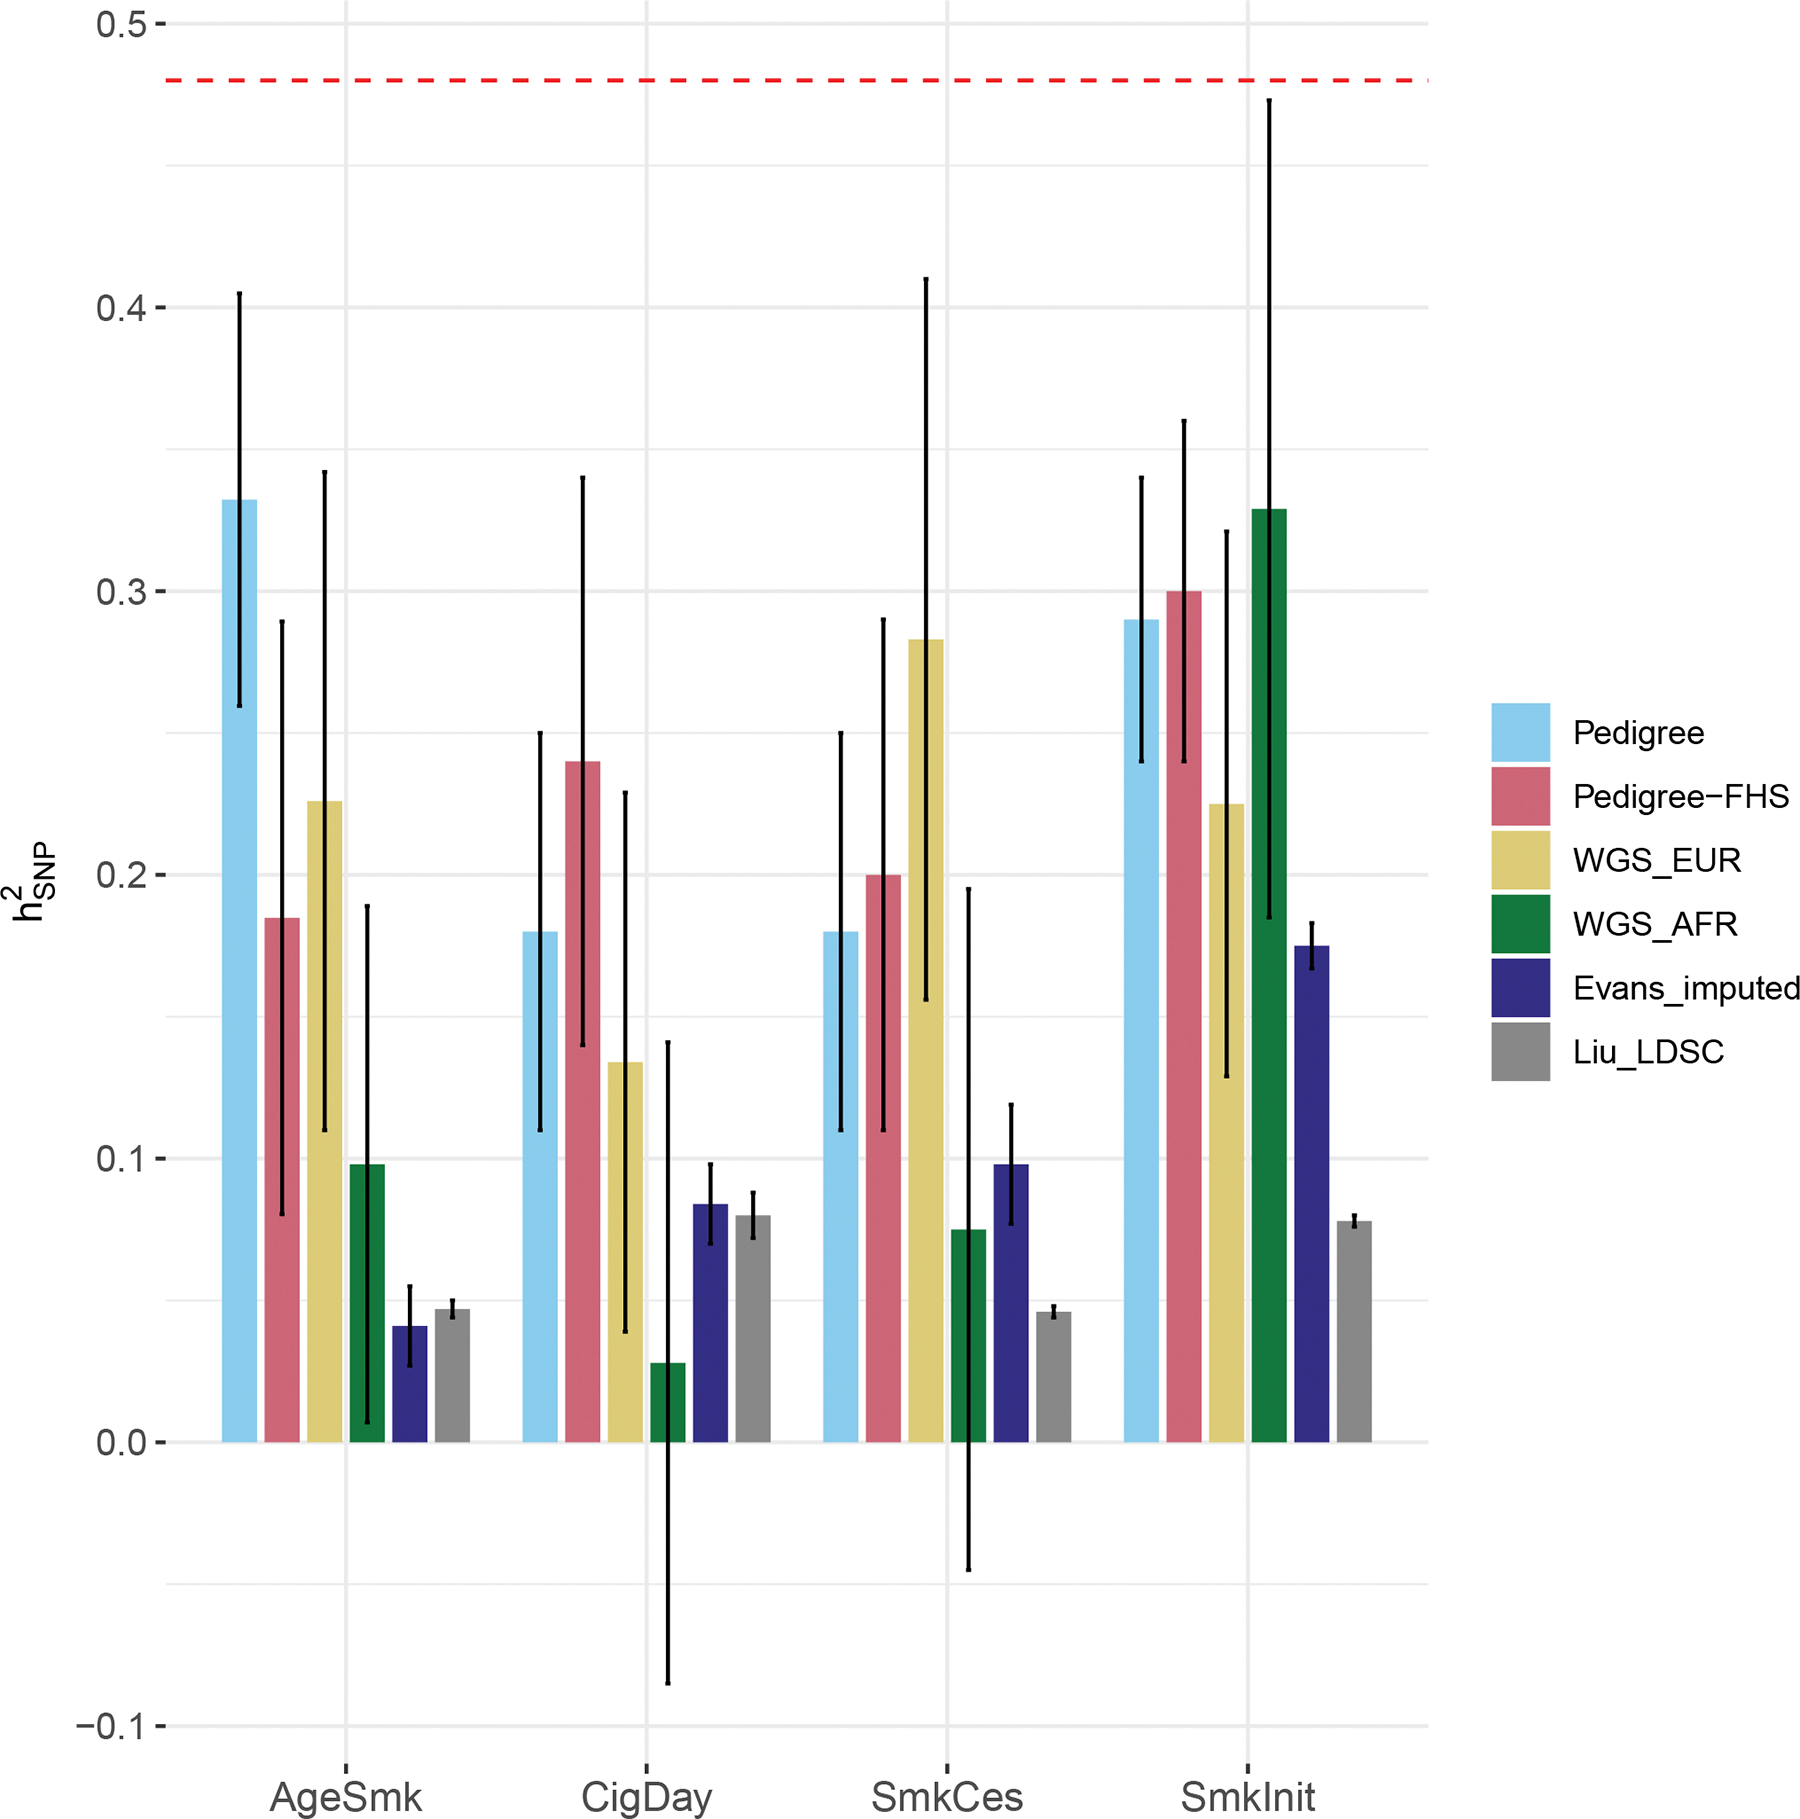
Comparison of heritability estimates between current and published studies.
The figure shows SNP heritability estimates across different studies. Error bars denote standard errors. “Pedigree” and “Pedigree-FHS” refer to from whole TOPMed pedigree samples and FHS only. “WGS_EUR” and “WGS_AFR” refer to WGS-based SNP heritability estimates in individuals of European and African ancestries. Note that WGS_AFR is based on common variants only for all phenotypes except for SmkInit which includes the contribution from MAF 0.1–1% variants additionally. “Evans_imputed” and “Liu_LDSC” each refer to SNP heritability estimates from Evans et al. (MAF:1–50%, relatedness threshold=.0279) and LDSC analysis from a recent meta-analysis of tobacco use18. The red dotted line indicates the heritability estimate of smoking from a recent large meta-analysis of twin studies17.
Fourth, previous studies indicated that rare variants are more likely to show geographical specificity42. While such geographic specificity was at least partially captured by our inclusion of study as a random effect, we went further by including a random effect of recruitment site (which is nested within a given study) in the model. After adjustment of site, of SmkCes was about 50% of the original estimate while of other smoking traits showed little change (Fig. 3 and Supplementary Table 3).
Fifth, we obtained approximate null distribution of under the assumption that population structure explains the observed SNP-based heritability (i.e., genotypes of ancestrally close individuals are exchangeable). This was done by estimating in samples randomly permuted within individuals close in ancestry as determined by a weighted sum of top 10 PCs with weights proportional to their corresponding eigenvalues43. We computed from 100 permuted trials and found limited evidence of inflation as mean heritability estimates from permuted trials were near zero across all bins of four smoking phenotypes (Supplementary Table 4).
Sixth and finally, we estimated in samples with decreasing control of population stratification by ascertaining samples with less stringent PC-based ancestry filtering thresholds (see Methods). The largest change in was observed for SmkCes where the estimates were up to .10 higher in samples with less stringent PC-based filtering than in primary analysis, possibly reflecting sampling variations and residual population structure (Supplementary Fig.1 and Supplementary Table 3).
In summary, out of 36 comparisons (4 phenotypes 9 conditions), showed relatively large changes ( only for SmkCes when we adjusted for geographical site, or relaxed ancestry filtering. Our primary results presented in Fig. 1 are from the most stringent PC-filtering condition.
Pedigree-based heritability estimates
We removed closely related individuals when estimating the heritabilities described above. However, we were able to leverage thousands of related family members in TOPMed to independently estimate total narrow-sense heritability of our four smoking phenotypes in pedigrees (). These heritability estimates were derived using a single genetic relatedness matrix that included all individuals with at least one other close relative in TOPMed. The relatedness of closely related individuals was estimated from common variants which, when estimated for close family members, serves as a proxy for rare and common variant sharing. The relatedness of classically unrelated individuals (relatedness estimate ()<.05) was set to be zero (same as KIBS>t in Zaitlen et al, 201322). This procedure provides an upper bound on the narrow-sense heritability estimate, to which we can compare the estimates of described in the previous section and quantify any of the remaining missing heritability.
Using related individuals in TOPMed across cohorts (N up to 21,546), narrow-sense heritabilities for AgeSmk, CigDay, SmkCes, and SmkInit were estimated .343 (.075), .175 (.066), .179 (.067) and .288 (.057), respectively. To check whether was downwardly estimated due to relatively large proportion of unrelated pairs, we also estimated pedigree-based heritability in Framingham Heart Study (N up to 3,024) which is composed of families as part of the study design. Similar estimates (AgeSmk .225, CigDay .244, SmkCes .195, SmkInit .299) were obtained in Framingham Heart Study as in the larger analysis of all available families, albeit with larger SEs. Estimates from pedigree analysis are presented in Fig. 3 and Supplementary Table 5.
Heritability estimates in African ancestries
We explored attributable to variants with MAF down to 0.1–1% for SmkInit (N=11,743) and common variants for other smoking phenotypes (N=6,796–7,549). After adjusting for 100 PCs, admixture proportions of five ancestries, local ancestry, and the same demographic covariates as in European ancestry, common-variant-based SNP heritability was estimated as following: .098 (.091) for AgeSmk, .028 (.113) for CigDay, .075 (.120) for SmkCes, and .085 (.10) for SmkInit. Variants from MAF 0.1–1% additionally accounted for about 24% of phenotypic variance of SmkInit, leading to total SNP-based heritability (combining both common and low frequency variants) of SmkInit: .329 (.144). Heritability estimates for individual bins are reported in Table 2 and Supplementary Table 6.
Table 2.
Number of variants and SNP-based heritability in African Ancestry sample
| Number of SNPs | ||||||
|
| ||||||
| 5–50% -HI | 5–50% -LO | 1–5% - HI | 1–5% - LO | 0.1–1% | Sample size | |
|
| ||||||
| AgeSmk | 4,298,268 | 4,298,322 | 3,415,787 | 3,415,847 | - | 6,909 |
| CigDay | 4,298,370 | 4,298,421 | 3,412,719 | 3,412,799 | - | 6,796 |
| SmkCes | 4,296,858 | 4,296,926 | 3,416,336 | 3,416,395 | - | 7,549 |
| SmkInit | 4,297,927 | 4,297,954 | 3,411,149 | 3,411,191 | 13,667,521 | 11,743 |
|
| ||||||
|
| ||||||
| 5–50% -HI | 5–50% -LO | 1–5% - HI | 1–5% - LO | 0.1–1% | Totala | |
|
| ||||||
| AgeSmk | .089 (.043) | −.028 (.082) | .016 (.051) | .022 (.099) | .098 (.091) | |
| CigDay | .076 (.041) | .001 (.084) | −.013 (.048) | −.036 (.109) | - | .028 (.113) |
| SmkCes | .008 (.040) | .060 (.090) | .031 (.054) | −.024 (.115) | - | .075 (.120) |
| SmkInit | .052 (.035) | .023 (.072) | −.022 (.041) | .031 (.095) | .243 (.133) | .329 (.144) |
Total=sum across five bins with MAF 0.1–50% for SmkInit and sum across four bins with MAF1–50% for the rest
Discussion
Using up to 26,257 whole-genome sequences, we found that about 13–28% of phenotypic variance of four smoking phenotypes in European ancestry individuals could be attributed to genetic variants with minimum minor-allele frequencies as rare as 1 in 10,000. This is about 1.5–4.5 times larger than the previous SNP-based heritability estimates based on common variants alone.
This increase was largely driven by inclusion of rare variants with MAF 0.1–0.01%, which accounted for 35–74% of the estimated SNP-based heritability of smoking phenotypes in samples of European ancestries. Smoking cessation showed the highest (.209; SE .123), followed by age of smoking initiation (.153; SE .114), smoking initiation (.079; SE .091) and cigarettes per day (.054; SE .092). Different smoking phenotypes would in principle vary in their genetic architectures if they differentially relate to fitness or fitness-related traits. However, standard errors associated with these estimates prevent us from drawing strong conclusions about their relative magnitudes.
The contribution of rare variants observed here seem consistent with the action of negative selection. Under negative selection, harmful mutations are maintained at low frequency in the population, whereas under neutral model, common variants are expected to explain the majority (>90%) of the heritability28. The same selective pressures may apply to the heritability patterns found for common variants in this study. We found that most of the heritability from common variants was attributed to low LD variants in European ancestry samples. Consistent with this, Gazal et al. 201744 reported that common variants with low LD in low-recombination rate regions had larger per-SNP heritability than those with high LD. One possible explanation for this finding is that low LD common variants are more likely to arise recently than high LD variants. Therefore, the low LD variants have had less time to be pushed to low frequency or fixation by selection pressure, comprising a major source of the heritability attributed to common variants44.
Our suggestion that smoking traits have been under negative selection might seem surprising. While nicotine itself has been pervasive in the environment for millions of years, tobacco in its cigarette form represents an evolutionarily novel environment for humans and the selection against such traits is likely to be weak due to its recency. Nevertheless, genetic variants influencing smoking can affect multiple different traits more directly related to evolutionary fitness. For example, smoking is highly genetically correlated with age at onset of reproductive behaviors (especially with age of smoking initiation45), and many social and health outcomes such as education and metabolic diseases. Therefore, selection pressure on these correlated traits can influence genetic architecture of smoking phenotypes45. More studies are needed to understand mechanisms that maintain the contribution of rare genetic variants to the heritability of smoking phenotypes in population.
We found that almost all the contribution from rare variants to was attributed to genetic variants classified as having relatively low expected protein altering consequences. This may suggest an importance of rare regulatory genetic variation in the etiology of smoking behaviors. Despite limited contributions to heritability from protein-altering variants, it is still possible that they explain higher heritability individually40 given the smaller number of such variants (about 0.2 million protein-altering v.s. 20 million non-protein-altering variants in MAF 0.01–0.1%) and presumably higher selective pressure against them. Unfortunately, high standard errors and overall small heritabilities from protein altering variants bin prevented us from drawing strong conclusions in the present data.
Current SNP-based heritability estimates were largely robust to our sensitivity checks. Heritability changed little after increasing the number of PCs and testing finer-scale population structure via permutation. The estimates also largely remained unaffected by removing individuals that share several long IBD segments or adjusting for top 20 PCs from the IBD relatedness matrix. Controlling for site of recruitment led to about a 50% reduction in rare-variant heritability of smoking cessation, while the three other smoking phenotypes were little unaffected. One explanation is that genetic risk of smoking cessation is stratified geographically46,47 and rare variants are sensitive to capturing such ecological clustering. However, it is not clear why the same pattern is not observed for other closely related measures of smoking. Alternatively, for practical reasons, studies recruited samples from sites with systematic differences in current smoking rates or disease status (e.g., clinical samples versus community controls), leading to a site and smoking status confounded. Therefore, we consider of smoking cessation, obtained after adjusting for geographical site as a conservative lower bound.
There is a long, ongoing debate on the source of missing heritability for virtually all complex traits. We found that current accounted for 60% to 100% of the pedigree-based, narrow-sense heritability estimates () across the four phenotypes, closing the missing heritability gap for smoking phenotypes. Note that our values are estimated from pedigrees from multiple cohorts, who also may span different generations (e.g., parents-offspring) and share markedly different smoking environments. We consider our as the most relevant benchmark by which to compare from our GREML results and past GWAS studies which also have varying sources of sample heterogeneity, including gene-environment interaction48 and varying heritability49. Twin studies, on the other hand, usually consist of large homogeneous cohort with well-defined pedigrees sharing most of the demography (i.e., monozygotic and dizygotic twins).
For individuals of African ancestries, we found that common SNPs and indels (MAF > 1%) accounted for 3~15% of phenotypic variance of smoking phenotypes, similar in magnitude to existing studies18,20. We observed an additional contribution of rare variants (MAF 0.1–1%) for smoking initiation, accounting for about 25% of smoking initiation liability. Note that estimating heritability in samples with complex population structure is in its infancy and how recent admixture influences causal allele frequency spectrum is not well understood. More research on this topic will be welcome.
Our findings should be interpreted in light of several limitations. First, although we used the largest WGS sample reported to date for heritability analysis, even larger datasets will be important. Larger sample sizes would allow greater precision in estimation and a more comprehensive assessment of the genetic architecture of these complex traits by finer partitioning by MAF and functional annotations. Second, even with the use of deep sequences, we did not fully reach the trait heritability, either as estimated using available pedigrees, or twin heritability reported in the literature. There remain many explanations, including ultra-rare variants (MAF <= .01%), other types of genetic variations (e.g., copy number variations) that are not in LD with the variants used here, and still other sources of heritable variation. Cigarettes per day showed the lowest SNP-based heritability and often encountered model convergence issues especially with a large number of covariates. Since it is a binned variable, its heritability may be more robustly estimated on liability scale50.
Third, although we carefully assessed the potential influence of population structure in extensive sensitivity analyses, existing methods may not be entirely capturing population stratification of rare variants 51,52. More studies are needed to understand the extent and best ways to handle it, although we are also sensitive to the possibility that such corrections may be counterproductive, removing meaningful heritable variance.
Fourth, our pedigree-based heritability estimates may be inflated by shared environment as we were unable to model genetic similarity and environmental similarity separately. Therefore, pedigree estimates may best be interpreted as an upper-bound on the SNP-based narrow-sense heritability. However, we expect the magnitude of inflation due to shared environment to be smaller than in typical twin studies given that our pedigree sample includes multiple classes of family relations who share much less of their environments than twins would.
Fifth, there is ample documentation of spousal similarity in smoking behaviors53–55 and one of the potential sources of this similarity, assortative mating, can artifactually inflate marker-based heritability estimates56. While recent studies have not found evidence for primary assortative mating on smoking traits in the genome57, more research is needed on this topic.
Sixth, genetic association signals of human behavioral traits can arise from multiple sources, not only from variants’ downstream biological influences on a phenotype of interest but also from its genetically correlated traits (e.g., education, income) along with indirect effect of parents and siblings’ genetics58–60. Current SNP-based heritability estimates include influences from multiple sources and could overlap with polygenic signals of socioeconomic factors given their substantial genetic correlations with smoking (|r|=.26~.55)18. With bigger sample sizes and studies of close families, future research can localize the origins of SNP-based heritability and examine the genetic architecture of shared and distinct genetic components of smoking and its correlated phenotypes (e.g., education, income)61.
Seventh, smoking phenotypes were measured by one or two questions and were limited to those commonly collected in biomedical studies like those in TOPMed. This allows accumulations of large sample sizes across multiple independently-collected samples, but each measure is noisy and may reflect idiosyncrasies of participating studies. We attempted to account for the latter through inclusion of a random effect of study.
In conclusion, the present study expanded our understanding of the genetic architecture of tobacco use by showing that much of the missing heritability of smoking phenotypes can be explained by rare genetic variants. The use of WGS allows less biased estimation of SNP-based heritability by including virtually all potential causal SNPs down to a MAF of 0.01% in individuals of European ancestries and 0.1% in African ancestry, rather than relying on the degree to which imputed variants tag causal variants. The current study informs the genetic etiology of nicotine addiction and provides a benchmark for the future study of other complex behavioral traits.
Methods
Sample
We considered individuals of European ancestries in TOPMed (freeze 8, mean depth >30)62 measured for at least one of four smoking phenotypes for inclusion. Our data access application was approved by relevant cohorts in TOPMed. We determined European ancestries in two steps. First, we identified an initial ancestry-inclusive set by projecting TOPMed genotypes (N=137,977) onto genetic principal component (PC) axes from the 1000 Genomes project8 (1000G) then used a k-nearest neighbor method to assign ancestry of TOPMed individuals with 1000G as a reference set. More specifically, we used online augmentation-decomposition-transformation to calculate PC scores of TOPMed individuals, which implements Procrustes transformation with an augmented data set (i.e., combining TOPMed and 1000G reference genomes together; https://github.com/daviddaiweizhang/fraposa)63. Then, for a given TOPMed sample, we chose the top 20 reference individuals in 1000G who were closest in terms of the Euclidean distance of 20 PC scores and assigned European ancestry when at least 87.5% of the reference individuals had European ancestry (Supplementary Note). This resulted in 38,915 individuals initially classified as European ancestry who also had at least one smoking phenotype. Second, after visually inspecting PCs 1–4 of the selected individuals, we suspected residual population heterogeneity, especially in PC 4 (Supplementary Fig. 2). We then further restricted samples to those whose summed Euclidean distance of PCs 1–4 fell within the 1 interquartile range (IQR) of the European sample (N=38,915) identified in the first step. We additionally created samples using 1.5, 2, 3 IQR and reserved them for sensitivity analysis (Supplementary Fig. 1–2). After IQR filtering, we only retained unrelated individuals. Relatedness was estimated with HapMap3 variants (HWE p-value > 10−6, MAF > 0.01) using GCTAv1.92 to obtain a list of nominally unrelated individuals with pairwise relatedness (.025). We additionally removed 76–190 individuals who showed very high rare-variant sharing ( > .25 in MAF 0.01–0.1% bin) who seemed to inherited small IBD segments inherited from distant non-European ancestors. This resulted in the following final sample size per phenotype in Table 1 (N ranging from 14,709 to 26,257).
Phenotypes
TOPMed is a consortium of independent studies, where DNA samples were sequenced and called in a unified way. Smoking phenotypes had previously been collected independently in each of the constituent TOPMed studies. Four smoking phenotypes, each representing self-report questions assessing different stages of tobacco use, were available across most TOPMed studies. We used the same definition and coding scheme as Liu et al., 201918. Age of smoking initiation (AgeSmk) measures the age at which an individual started regularly smoking. Cigarettes smoked per day (CigDay) was the average number of cigarettes smoked per day as a current or former smoker and grouped into five bins with higher numbers indicating greater use. For both AgeSmk and CigDay, lifelong non-smokers are excluded (set to missing). Smoking cessation (SmkCes) and initiation (SmkInit) are binary variables indicating former versus current smokers and never versus ever regular smoker, with case defined as current and ever smoker, respectively. These four variables were correlated but not redundant, each measuring distinct aspects of smoking (Supplementary Note, Supplementary Table 7). Descriptive statistics for each phenotype across cohorts can be found in Supplementary Table 8.
Genotypes, LD scores, GRM, and GREML-LDMS-I
Genome-based restricted maximum likelihood (GREML) estimates heritability by comparing phenotypic similarity to observed genetic similarity among distantly related individuals using a linear mixed model64. GREML yields biased estimates when causal variants are unevenly distributed as a function of LD and MAF31. To mitigate this bias, the GREML-LDMS-I method partitions SNPs into different LD × MAF bins32. We initially considered ~710 million genotypes that passed strict quality filters described elsewhere65. We additionally removed 95,750 variants with Hardy-Weinberg equilibrium p-values less than 10−6 in the European ancestry sample (N=38,915). Then, we calculated allele frequency separately for each phenotype using plink1.9 in a final sample that went through PC, IQR, and relatedness filtering. We stratified variants by MAF and then further stratified by linkage disequilibrium (LD) scores using the median LD scores within the two most common MAF bins. This resulted in six bins: MAF (0.05, 0.5] high LD, MAF (0.05, 0.5] low LD, MAF (0.01, 0.05] high LD, MAF (0.01, 0.05] low LD, MAF (0.001, 0.01], and finally MAF (0.0001, 0.001]. We stratified only the common variant bins by LD because most low-frequency and rare variants have low LD scores, and because more bins decrease estimate precision. LD scores, defined as the sum of squared correlations (r2) between a variant and all the variants in a region, were calculated using GCTA1.92 with default 10Mb window in the final sample combined across four smoking phenotypes (summary of LD scores presented in Supplementary Table 9). This process resulted in approximately 35 million SNPs and indels (Table 1).
For each phenotype, we performed GREML-LDMS-I with the GRMs for the above-mentioned six bins and cohort indicator matrix as random effects. The cohort matrix was an N × N matrix indicating whether a given pair of individuals belongs to the same study (1, otherwise 0). The variance explained by cohort was included in total phenotypic variance, which could yield somewhat smaller heritability estimates than when the heritability is conditioned on cohort. We regressed out age, age2, sex and their two-way interaction terms66–68 from quantitative phenotypes (i.e., AgeSmk and CigDay) and used residuals. Residuals of CigDay were further inverse-rank normalized to facilitate model convergence by smoothing its distribution. GREML-LDMS-I results from other types of transformations for AgeSmk and CigDay are presented in Supplementary Table 3. We calculated 10 PCs from common variants (MAF>=1%) and another 10 PCs from rare variants (0.01%<MAF<1%) after LD pruning (plink –indep-pairwise 100 5 0.2 for common and 2000 10 0.02 for rare variants). These 20 PCs and sequencing center were entered as fixed effects in linear mixed model. The same demographic variables and 20 PCs were entered as fixed effects for binary variables. We used GCTAv1.92 for both construction of GRM and GREML-LDMS-I analysis. We replaced original GRM diagonals with 1+ inbreeding coefficients (Fhat3 computed from the GCTA software) given the original formula tended to yield far higher variance of diagonals for rare variants than expected in theory (Supplementary Table 10)69. We allowed the estimates to be negative to obtain unbiased estimates. Heritabilities for binary phenotypes were analyzed under a liability threshold model70. Population prevalence was set at 0.15 and 0.42 for SmkCes and SmkInit, respectively, based on smoking prevalence in the UK Biobank dataset, to allow for ready comparison with this publicly available and widely-used dataset. For all traits, total heritability was calculated by adding heritability estimates of the six bins with SEs approximated by the delta method71.
Partitioning rare variant heritability
To further interrogate sources of rare-variant heritability, we divided rare variant bins into protein-altering versus non-protein-altering variant bins72. Functional impact of variants was assessed by snpEff 4.3 with “HIGH” and “MODERATE” impact categorized as protein-altering while “LOW” and “MODIFIER” categorized as non-protein-altering73. “HIGH” includes variants expected to have a disruptive impact in the protein, such as protein truncation and loss of function. “MODERATE” includes variants that are expected to influence effectiveness of the protein, such as missense and splice region variants. “MODIFIER” and “LOW” includes variants that influences non-coding genes or located in non-coding region and are usually considered harmless to protein behaviors. Details of this classification can be found in its website (https://pcingola.github.io/SnpEff/se_inputoutput/). Variance components were then estimated for a total of eight bins.
Sensitivity analyses
To evaluate the degree of sensitivity of our results to residual population structure, especially that of rare variants, and various analytic decisions, we conducted extensive sensitivity analyses. First, we performed GREML-LDMS-I with 40 PCs (20 common, 20 rare) and 100 PCs (50 common, 50 rare) as fixed effects. Second, we estimated heritability after removing individuals whose total length of shared IBD segments stretch more than 2.5% of the genome (N=121–177 depending on phenotypes) to test whether heritability attributed to rare variants is primarily driven by a subset of samples sharing recent ancestors and presumably higher environmental similarity. Third, we also adjusted for 20 PCs from the IBD-based relatedness matrix, in addition to the 10 PCs from common variants and 10 PCs from rare variants (40 total PCs). IBD-segments were estimated using 632,008 common variants (LD pruned by plink --indep-pairwise 1,000 50 0.6) with FastSMC70 with default settings, except we set the minimum IBD length >= 2cM. We used decoding files precomputed by the authors of FastSMC and only retained IBD segments with quality score > 0.1. The IBD-based GRM matrix was created by summing the length of the shared IBD segments in a given pair of individuals and dividing it by the length of the diploid human genome (3608 × 2 cM). Then, we derived principal components from the IBD-based relatedness matrix. Fourth, we added 53 recruitment sites nested within the cohorts as random effects. This additional control is meant to better account for rare variants that may geographically cluster. Fifth, we performed GREML-LDMS-I with permuted samples within genetically close neighbors35,43,74. For this, we created an N × N distance matrix populated by scaled Euclidian distance of PC 1–10 calculated from LD-pruned common variants for every pair of individuals. Then, we randomly exchanged genotypes of a given individual with one of their 100 nearest neighbors using sampling algorithms from LocPerm which is developed to control for populations structure in rare variant association test43. We estimated heritability in 100 replicates of permuted genotypes with the same demographic covariates and cohort used in the main analysis. Mean and SD of heritability estimates from 100 replicates were calculated for each bin and were tested against zero using a one-sided Z-test as heritability is bounded above zero (Supplementary Note). Last, we estimated heritability in samples with increasingly less strict PC-based ancestry filtering mentioned earlier (1.5, 2, 3 IQR). The greater the IQR threshold, the more ancestral variation can be present in the resulting sample, the larger the sample, and the greater the chance of observing effects of population stratification.
Pedigree-based heritability
We created a GRM with all available samples including related ones after excluding pairs related greater than .80 to exclude identical twins and duplicates. To aid in model identification, we included cohorts that had at least 10 first-degree relatives defined as relatedness greater than .375. A list of cohorts included in this analysis is presented in Supplementary Table 11. We created GRM using common variants (MAF > 5%) and set GRM entries of pairs related less than .05 as zero and retained the rest of the entries as they were. This GRM was fitted together with a cohort matrix and the same set of fixed effect covariates used in the primary analysis. To test whether resulting is underestimated due to relatively low level of relatedness structure in the sample, we repeated the analysis without a random effect of cohort, using only Framingham Heart Study (FHS) which has high proportions of related individuals.
SNP-based heritability in African ancestries
We initially had 19,788 individuals who had either one of smoking phenotypes and were classified as African ancestry by the ancestry assignment procedure described earlier. We selected unrelated individuals ( applying pcairPartition function in the GENESIS package on kinship coefficients from pcrelate75 where familial relatedness is estimated with MAF (<1%) and LD-pruned (|LD|<.32) variants after accounting for population structure. We additionally excluded 58 individuals who showed more than two-way admixture as determined by global ancestry proportions of either South-Central Asia, East Asia, Native America, or Middle East greater than 10%. This resulted in sample size in Table 2. The resulting samples were predominantly African ancestry with recent European ancestry admixture (mean African ancestry proportion=83% (SD: 8.9%) and mean European ancestry proportion=15% (SD: 8.4%)). Ancestry proportions of each individual were estimated from local ancestry inference by RFMix76 which estimates ancestry of admixed individuals at each genomic segment of two homologous chromosomes, using the Human Genome Diversity Panel (HGDP) as a reference panel77 (Supplementary Fig. 3). Given the smaller sample size of African ancestry samples, we restricted the variants to be analyzed to MAF 0.1–1% for SmkInit (N=11,744) and common variants for the other three phenotypes (N=6,796~7,549). We applied the same analytic procedure as in European ancestry samples: 1) selected genetic variants with MAF > 2 and HWE p-value > 10−6, 2) partitioned variants into MAF (0.05, 0.5] high LD, MAF (0.05, 0.5] low LD, MAF (0.01, 0.05] high LD, MAF (0.01, 0.05] low LD, and additionally MAF (0.001, 0.01] for SmkInit (Table 2), 3) calculated GRM for each bin and performed GREML-LDMS-I with the same set of demographic and cohort covariates as in European ancestry analyses. We additionally included 50 common- and 50 rare variant-based PCs, global ancestry proportions of five continents (Sub-Saharan Africa, South-Central Asia, East Asia, Native America, and Middle East) as fixed effects and local ancestry kinship (Supplementary Note) as a random effect to account for complex population structure in the admixed sample43,44. Pedigree heritability was not estimated for individuals of African ancestries as SNP-based relatedness is no longer proportional to IBD in admixed population78.
Supplementary Material
Acknowledgements
Molecular data for the Trans-Omics in Precision Medicine (TOPMed) program was supported by the National Heart, Lung and Blood Institute (NHLBI). See the TOPMed Omics Support Table (Supplementary Note) for study specific omics support information. Core support including centralized genomic read mapping and genotype calling, along with variant quality metrics and filtering were provided by the TOPMed Informatics Research Center (3R01HL-117626–02S1; contract HHSN268201800002I). Core support including phenotype harmonization, data management, sample-identity QC, and general program coordination were provided by the TOPMed Data Coordinating Center (R01HL-120393; U01HL-120393; contract HHSN268201800001I). We gratefully acknowledge the studies and participants who provided biological samples and data for TOPMed.
Funding:
R01DA044283, R01DA037904, R01HG008983 to SIV
R01MH100141 to MCK
Cohort-wise acknowledgement in Supplementary Note
Footnotes
Competing interests statement
Psaty serves on the Steering Committee of the Yale Open Data Access Project funded by Johnson & Johnson. EKS has received grant support from GSK and Bayer Research support to University of Pennsylvania from RenalytixAI and personal fees from Calico Labs, both outside the current work. The funders had no role in study design, data collection and analysis, decision to publish or preparation of the manuscript. Other authors declare no competing interests.
Code availability statement
All software used is publicly available and can be found at references cited.
Data availability statement
Phenotypes are available through authorized access portal in dbgap (https://dbgap.ncbi.nlm.nih.gov/) or direct request to TOPMed Principal Investigators. Accession numbers and email addresses of Principal Investigatore are presented in Supplementary Note. Genetic data are available through dbgap TOPMed exchange area.
References
- 1.Johnson T & Barton N Theoretical models of selection and mutation on quantitative traits. Philosophical Transactions of the Royal Society B: Biological Sciences 360, 1411–1425 (2005). [DOI] [PMC free article] [PubMed] [Google Scholar]
- 2.Keinan A & Clark AG Recent Explosive Human Population Growth Has Resulted in an Excess of Rare Genetic Variants. Science 336, 740–743 (2012). [DOI] [PMC free article] [PubMed] [Google Scholar]
- 3.Yengo L et al. Meta-analysis of genome-wide association studies for height and body mass index in ∼700000 individuals of European ancestry. Hum Mol Genet 27, 3641–3649 (2018). [DOI] [PMC free article] [PubMed] [Google Scholar]
- 4.Graham SE et al. The power of genetic diversity in genome-wide association studies of lipids. Nature 600, 675–679 (2021). [DOI] [PMC free article] [PubMed] [Google Scholar]
- 5.Vujkovic M et al. Discovery of 318 new risk loci for type 2 diabetes and related vascular outcomes among 1.4 million participants in a multi-ancestry meta-analysis. Nat Genet 52, 680–691 (2020). [DOI] [PMC free article] [PubMed] [Google Scholar]
- 6.Ripke S et al. Biological insights from 108 schizophrenia-associated genetic loci. Nature 511, 421–427 (2014). [DOI] [PMC free article] [PubMed] [Google Scholar]
- 7.Manolio TA et al. Finding the missing heritability of complex diseases. Nature 461, 747–753 (2009). [DOI] [PMC free article] [PubMed] [Google Scholar]
- 8.Ezzati M, Lopez AD, Rodgers A, Vander Hoorn S & Murray CJ Selected major risk factors and global and regional burden of disease. The Lancet 360, 1347–1360 (2002). [DOI] [PubMed] [Google Scholar]
- 9.Reitsma MB et al. Smoking prevalence and attributable disease burden in 195 countries and territories, 1990–2015: a systematic analysis from the Global Burden of Disease Study 2015. The Lancet 389, 1885–1906 (2017). [DOI] [PMC free article] [PubMed] [Google Scholar]
- 10.Carter BD et al. Smoking and Mortality — Beyond Established Causes. New England Journal of Medicine 372, 631–640 (2015). [DOI] [PubMed] [Google Scholar]
- 11.Maes HH et al. A Genetic Epidemiological Mega Analysis of Smoking Initiation in Adolescents. Nicotine & Tobacco Research 19, 401–409 (2017). [DOI] [PMC free article] [PubMed] [Google Scholar]
- 12.Vink JM & Boomsma DI Interplay between heritability of smoking and environmental conditions? A comparison of two birth cohorts. BMC Public Health 11, 316 (2011). [DOI] [PMC free article] [PubMed] [Google Scholar]
- 13.Quach BC et al. Expanding the Genetic Architecture of Nicotine Dependence and its Shared Genetics with Multiple Traits: Findings from the Nicotine Dependence GenOmics (iNDiGO) Consortium. bioRxiv 2020.01.15.898858 (2020) doi: 10.1101/2020.01.15.898858. [DOI] [PMC free article] [PubMed] [Google Scholar]
- 14.Degenhardt L & Hall, and W. The relationship between tobacco use, substance-use disorders and mental health: results from the National Survey of Mental Health and Well-being. Nicotine & Tobacco Research 3, 225–234 (2001). [DOI] [PubMed] [Google Scholar]
- 15.McCabe SE, West BT & McCabe VV Associations Between Early Onset of E-cigarette Use and Cigarette Smoking and Other Substance Use Among US Adolescents: A National Study. Nicotine & Tobacco Research 20, 923–930 (2018). [DOI] [PMC free article] [PubMed] [Google Scholar]
- 16.King SM, Iacono WG & McGue M Childhood externalizing and internalizing psychopathology in the prediction of early substance use. Addiction 99, 1548–1559 (2004). [DOI] [PubMed] [Google Scholar]
- 17.Polderman TJC et al. Meta-analysis of the heritability of human traits based on fifty years of twin studies. Nat Genet 47, 702–709 (2015). [DOI] [PubMed] [Google Scholar]
- 18.Liu M et al. Association studies of up to 1.2 million individuals yield new insights into the genetic etiology of tobacco and alcohol use. Nature Genetics 51, 237–244 (2019). [DOI] [PMC free article] [PubMed] [Google Scholar]
- 19.Erzurumluoglu AM et al. Meta-analysis of up to 622,409 individuals identifies 40 novel smoking behaviour associated genetic loci. Molecular Psychiatry 25, 2392–2409 (2020). [DOI] [PMC free article] [PubMed] [Google Scholar]
- 20.Evans LM et al. Genetic architecture of four smoking behaviors using partitioned SNP heritability. Addiction 116, 2498–2508 (2021). [DOI] [PMC free article] [PubMed] [Google Scholar]
- 21.Eichler EE et al. Missing heritability and strategies for finding the underlying causes of complex disease. Nature Reviews Genetics 11, 446–450 (2010). [DOI] [PMC free article] [PubMed] [Google Scholar]
- 22.Zaitlen N et al. Using Extended Genealogy to Estimate Components of Heritability for 23 Quantitative and Dichotomous Traits. PLOS Genetics 9, e1003520 (2013). [DOI] [PMC free article] [PubMed] [Google Scholar]
- 23.Wray NR & Maier R Genetic Basis of Complex Genetic Disease: The Contribution of Disease Heterogeneity to Missing Heritability. Curr Epidemiol Rep 1, 220–227 (2014). [Google Scholar]
- 24.Zuk O, Hechter E, Sunyaev SR & Lander ES The mystery of missing heritability: Genetic interactions create phantom heritability. PNAS 109, 1193–1198 (2012). [DOI] [PMC free article] [PubMed] [Google Scholar]
- 25.Young AI Solving the missing heritability problem. PLOS Genetics 15, e1008222 (2019). [DOI] [PMC free article] [PubMed] [Google Scholar]
- 26.Gibson G Rare and Common Variants: Twenty arguments. Nature Review Genetics 13, 135–145 (2012). [DOI] [PMC free article] [PubMed] [Google Scholar]
- 27.Eyre-Walker A Genetic architecture of a complex trait and its implications for fitness and genome-wide association studies. PNAS 107, 1752–1756 (2010). [DOI] [PMC free article] [PubMed] [Google Scholar]
- 28.Visscher PM, Goddard ME, Derks EM & Wray NR Evidence-based psychiatric genetics, AKA the false dichotomy between common and rare variant hypotheses. Mol Psychiatry 17, 474–485 (2012). [DOI] [PubMed] [Google Scholar]
- 29.McCarthy S et al. A reference panel of 64,976 haplotypes for genotype imputation. Nature genetics 48, 1279–1283 (2016). [DOI] [PMC free article] [PubMed] [Google Scholar]
- 30.Loh P-R et al. Reference-based phasing using the Haplotype Reference Consortium panel. Nature Genetics 48, 1443–1448 (2016). [DOI] [PMC free article] [PubMed] [Google Scholar]
- 31.Yang J et al. Genetic variance estimation with imputed variants finds negligible missing heritability for human height and body mass index. Nature Genetics 47, 1114–1120 (2015). [DOI] [PMC free article] [PubMed] [Google Scholar]
- 32.Evans LM et al. Comparison of methods that use whole genome data to estimate the heritability and genetic architecture of complex traits. Nat. Genet. 50, 737–745 (2018). [DOI] [PMC free article] [PubMed] [Google Scholar]
- 33.Derkach A, Zhang H & Chatterjee N Power Analysis for Genetic Association Test (PAGEANT) provides insights to challenges for rare variant association studies. Bioinformatics 34, 1506–1513 (2018). [DOI] [PMC free article] [PubMed] [Google Scholar]
- 34.Wainschtein P et al. Assessing the contribution of rare variants to complex trait heritability from whole-genome sequence data. Nat Genet 54, 263–273 (2022). [DOI] [PMC free article] [PubMed] [Google Scholar]
- 35.Hernandez RD et al. Ultrarare variants drive substantial cis heritability of human gene expression. Nature Genetics 51, 1349–1355 (2019). [DOI] [PMC free article] [PubMed] [Google Scholar]
- 36.Sul JH et al. Contribution of common and rare variants to bipolar disorder susceptibility in extended pedigrees from population isolates. Translational Psychiatry 10, 1–10 (2020). [DOI] [PMC free article] [PubMed] [Google Scholar]
- 37.Halvorsen M et al. Increased burden of ultra-rare structural variants localizing to boundaries of topologically associated domains in schizophrenia. Nature Communications 11, 1–13 (2020). [DOI] [PMC free article] [PubMed] [Google Scholar]
- 38.Luo Y et al. Exploring the genetic architecture of inflammatory bowel disease by whole-genome sequencing identifies association at ADCY7. Nature Genetics 49, 186–192 (2017). [DOI] [PMC free article] [PubMed] [Google Scholar]
- 39.Fuchsberger C et al. The genetic architecture of type 2 diabetes. Nature 536, 41–47 (2016). [DOI] [PMC free article] [PubMed] [Google Scholar]
- 40.Wainschtein P et al. Recovery of trait heritability from whole genome sequence data. 588020 10.1101/588020v2 (2021) doi:. [DOI] [Google Scholar]
- 41.Nait Saada J et al. Identity-by-descent detection across 487,409 British samples reveals fine scale population structure and ultra-rare variant associations. Nat Commun 11, 6130 (2020). [DOI] [PMC free article] [PubMed] [Google Scholar]
- 42.Nelson MR et al. An abundance of rare functional variants in 202 drug target genes sequenced in 14,002 people. Science 337, 100–104 (2012). [DOI] [PMC free article] [PubMed] [Google Scholar]
- 43.Mullaert J et al. Taking population stratification into account by local permutations in rare-variant association studies on small samples. Genet Epidemiol 45, 821–829 (2021). [DOI] [PMC free article] [PubMed] [Google Scholar]
- 44.Gazal S et al. Linkage disequilibrium dependent architecture of human complex traits shows action of negative selection. Nat Genet 49, 1421–1427 (2017). [DOI] [PMC free article] [PubMed] [Google Scholar]
- 45.Mills MC et al. Identification of 371 genetic variants for age at first sex and birth linked to externalising behaviour. Nat Hum Behav 5, 1717–1730 (2021). [DOI] [PMC free article] [PubMed] [Google Scholar]
- 46.Domingue BW, Rehkopf DH, Conley D & Boardman JD Geographic Clustering of Polygenic Scores at Different Stages of the Life Course. RSF 4, 137–149 (2018). [DOI] [PMC free article] [PubMed] [Google Scholar]
- 47.Abdellaoui A et al. Genetic correlates of social stratification in Great Britain. Nat Hum Behav 3, 1332–1342 (2019). [DOI] [PubMed] [Google Scholar]
- 48.Tropf FC et al. Hidden heritability due to heterogeneity across seven populations. Nat Hum Behav 1, 757–765 (2017). [DOI] [PMC free article] [PubMed] [Google Scholar]
- 49.Boardman JD, Blalock CL & Pampel FC Trends in the Genetic Influences on Smoking. J Health Soc Behav 51, 108–123 (2010). [DOI] [PMC free article] [PubMed] [Google Scholar]
- 50.Bi W et al. Efficient mixed model approach for large-scale genome-wide association studies of ordinal categorical phenotypes. The American Journal of Human Genetics 108, 825–839 (2021). [DOI] [PMC free article] [PubMed] [Google Scholar]
- 51.Mathieson I & McVean G Differential confounding of rare and common variants in spatially structured populations. Nat Genet 44, 243–246 (2012). [DOI] [PMC free article] [PubMed] [Google Scholar]
- 52.Zaidi AA & Mathieson I Demographic history mediates the effect of stratification on polygenic scores. eLife 9, e61548 (2020). [DOI] [PMC free article] [PubMed] [Google Scholar]
- 53.Treur JL, Vink JM, Boomsma DI & Middeldorp CM Spousal resemblance for smoking: Underlying mechanisms and effects of cohort and age. Drug and Alcohol Dependence 153, 221–228 (2015). [DOI] [PubMed] [Google Scholar]
- 54.Agrawal A et al. Assortative Mating for Cigarette Smoking and for Alcohol Consumption in Female Australian Twins and their Spouses. Behav Genet 36, 553–566 (2006). [DOI] [PubMed] [Google Scholar]
- 55.Vink JM, Willemsen G & Boomsma DI The association of current smoking behavior with the smoking behavior of parents, siblings, friends and spouses. Addiction 98, 923–931 (2003). [DOI] [PubMed] [Google Scholar]
- 56.Border R et al. Assortative mating biases marker-based heritability estimators. Nature Communications (In press; ). [DOI] [PMC free article] [PubMed] [Google Scholar]
- 57.Yengo L et al. Imprint of assortative mating on the human genome. Nat Hum Behav 2, 948–954 (2018). [DOI] [PMC free article] [PubMed] [Google Scholar]
- 58.Lj H et al. Within-sibship GWAS improve estimates of direct genetic effects. (2021) doi: 10.1101/2021.03.05.433935. [DOI] [Google Scholar]
- 59.Young AI, Benonisdottir S, Przeworski M & Kong A Deconstructing the sources of genotype-phenotype associations in humans. Science 365, 1396–1400 (2019). [DOI] [PMC free article] [PubMed] [Google Scholar]
- 60.Abdellaoui A & Verweij KJH Dissecting polygenic signals from genome-wide association studies on human behaviour. Nat Hum Behav 5, 686–694 (2021). [DOI] [PubMed] [Google Scholar]
- 61.Warrington NM, Hwang L-D, Nivard MG & Evans DM Estimating direct and indirect genetic effects on offspring phenotypes using genome-wide summary results data. Nat Commun 12, 5420 (2021). [DOI] [PMC free article] [PubMed] [Google Scholar]
- 62.Taliun D et al. Sequencing of 53,831 diverse genomes from the NHLBI TOPMed Program. Nature 590, 290–299 (2021). [DOI] [PMC free article] [PubMed] [Google Scholar]
- 63.Zhang D, Dey R & Lee S Fast and robust ancestry prediction using principal component analysis. Bioinformatics 36, 3439–3446 (2020). [DOI] [PMC free article] [PubMed] [Google Scholar]
- 64.Yang J et al. Common SNPs explain a large proportion of the heritability for human height. Nat Genet 42, 565–569 (2010). [DOI] [PMC free article] [PubMed] [Google Scholar]
- 65.Taliun D et al. Sequencing of 53,831 diverse genomes from the NHLBI TOPMed Program. 10.1101/563866 (2019) doi: 10.1101/563866. [DOI] [PMC free article] [PubMed] [Google Scholar]
- 66.Fidler J, Ferguson SG, Brown J, Stapleton J & West R How does rate of smoking cessation vary by age, gender and social grade? Findings from a population survey in England. Addiction 108, 1680–1685 (2013). [DOI] [PubMed] [Google Scholar]
- 67.Karp I, O’loughlin J, Paradis G, Hanley J & Difranza J Smoking Trajectories of Adolescent Novice Smokers in a Longitudinal Study of Tobacco Use. Annals of Epidemiology 15, 445–452 (2005). [DOI] [PubMed] [Google Scholar]
- 68.Mathew AR et al. Life-Course Smoking Trajectories and Risk for Emphysema in Middle Age: The CARDIA Lung Study. Am J Respir Crit Care Med 199, 237–240 (2018). [DOI] [PMC free article] [PubMed] [Google Scholar]
- 69.Yang J, Lee SH, Goddard ME & Visscher PM GCTA: A Tool for Genome-wide Complex Trait Analysis. Am J Hum Genet 88, 76–82 (2011). [DOI] [PMC free article] [PubMed] [Google Scholar]
- 70.Lee SH, Wray NR, Goddard ME & Visscher PM Estimating missing heritability for disease from genome-wide association studies. The American Journal of Human Genetics 88, 294–305 (2011). [DOI] [PMC free article] [PubMed] [Google Scholar]
- 71.Powell LA Approximating Variance of Demographic Parameters Using the Delta Method: A Reference for Avian BiologistsAproximación De La Varianza Para Parámetros Demográficos Utilizando El Método Delta: Una Referencia Para Biólogos De AvesShort Communications. Condor 109, 949–954 (2007). [Google Scholar]
- 73.Cingolani P et al. A program for annotating and predicting the effects of single nucleotide polymorphisms, SnpEff: SNPs in the genome of Drosophila melanogaster strain w1118; iso-2; iso-3. Fly (Austin) 6, 80–92 (2012). [DOI] [PMC free article] [PubMed] [Google Scholar]
- 74.Bouaziz M et al. Controlling for Human Population Stratification in Rare Variant Association Studies. bioRxiv 2020.02.28.969477 (2020) doi: 10.1101/2020.02.28.969477. [DOI] [PMC free article] [PubMed] [Google Scholar]
- 75.Conomos MP, Reiner AP, Weir BS & Thornton TA Model-free estimation of recent genetic relatedness. Am J Hum Genet 98, 127–148 (2016). [DOI] [PMC free article] [PubMed] [Google Scholar]
- 76.Maples BK, Gravel S, Kenny EE & Bustamante CD RFMix: a discriminative modeling approach for rapid and robust local-ancestry inference. Am J Hum Genet 93, 278–288 (2013). [DOI] [PMC free article] [PubMed] [Google Scholar]
- 77.Bergström A et al. Insights into human genetic variation and population history from 929 diverse genomes. Science 367, eaay5012 (2020). [DOI] [PMC free article] [PubMed] [Google Scholar]
- 78.Athanasiadis G et al. Estimating narrow-sense heritability using family data from admixed populations. Heredity (Edinb) 124, 751–762 (2020). [DOI] [PMC free article] [PubMed] [Google Scholar]
Associated Data
This section collects any data citations, data availability statements, or supplementary materials included in this article.
Supplementary Materials
Data Availability Statement
Phenotypes are available through authorized access portal in dbgap (https://dbgap.ncbi.nlm.nih.gov/) or direct request to TOPMed Principal Investigators. Accession numbers and email addresses of Principal Investigatore are presented in Supplementary Note. Genetic data are available through dbgap TOPMed exchange area.