

Abstract
The association between tumor microenvironment (TME) and cancer‐associated fibroblasts (CAFs) in intrahepatic cholangiocarcinoma (ICC) progression is poorly understood. This study aimed to reveal whether specific microRNAs (miRNAs) in extracellular vesicles (EVs) derived from CAFs were involved in ICC progression. Conditioned medium (CM) and EVs in the CM of CAFs and normal fibroblasts (NFs) derived from ICC specimens were used to investigate the effects on tumor cell lines. miRNA microarray assay was used to examine the miRNAs of EVs derived from CAFs and NFs in ICC, and the effects of miR‐493‐5p on tumor cell lines were examined. Additionally, databases were used to identify miR‐493‐5p targets, and the relationship between prognosis of ICC patients and cocaine‐ and amphetamine‐regulated transcript propeptide (CARTPT), one of the targets of miR‐493‐5p, expression in ICC tissues was retrospectively analyzed. Compared with NF‐derived CM and EVs, CAF‐derived CM and EVs promoted cell lines in proliferation, scratch, migration, and invasion assays. miRNA microarray analysis revealed that miR‐493‐5p was significantly increased in CAF‐derived EVs compared to NF‐derived EVs. Tumor cell lines transfected with miR‐493‐5p were promoted in proliferation and scratch assays. Immunohistochemical staining was performed on 76 ICC specimens; both overall and recurrence‐free survival rates were significantly worse in the CARTPT‐negative group. Univariate and multivariate analyses showed that low CARTPT expression was an independent poor prognostic factor for overall and recurrence‐free survival. Overall, our data suggest that CAFs in the ICC TME suppress CARTPT in tumor cells and promote tumor cells via miR‐493‐5p in EVs.
Keywords: cancer‐associated fibroblast, extracellular vesicle, intrahepatic cholangiocarcinoma, microRNA, tumor microenvironment
This study examined the role of extracellular vesicles derived from cancer‐associated fibroblasts in intrahepatic cholangiocarcinoma (ICC). We found that cancer‐associated fibroblasts secrete miR‐493‐5p‐rich extracellular vesicles, which promote tumor cells. We also found that the expression of cocaine‐ amphetamine‐regulated transcript propeptide, one of the targets of miR‐493‐5p, was significantly correlated with ICC prognosis.

Abbreviations
- CAF
cancer‐associated fibroblast
- CARTPT
cocaine‐ and amphetamine‐regulated transcript propeptide
- CM
conditioned medium
- EV
extracellular vesicle
- ICC
intrahepatic cholangiocarcinoma
- miRNA
microRNA
- NF
normal fibroblast
- OS
overall survival
- RFS
recurrence‐free survival
- RT‐PCR
real‐time polymerase chain reaction
- TCGA
The Cancer Genome Atlas
- TME
tumor microenvironment
1. INTRODUCTION
Intrahepatic cholangiocarcinoma (ICC) is a malignant entity separated from the epithelial cells of the intrahepatic bile ducts. ICC represents 10%–15% of all primary liver cancers and primary sclerosing cholangitis, 1 , 2 and infections with hepatitis B or hepatitis C virus are known risk factors. 3 , 4 Surgery is the only potentially curative treatment for ICC, but the prognosis is poor, with 5‐year survival after curative resection of approximately 30% and median disease‐free survival calculated to be approximately 20 months. 5 The gemcitabine/cisplatin chemotherapy regimen is still the standard of care for patients with unresectable metastatic ICC. 6 Data regarding the pathologic ICC response to palliative systemic treatment are limited.
To improve the prognosis of ICC patients, there is an urgent need to elucidate the principles related to progression of ICC. The tumor microenvironment (TME) is closely involved in the progression and proliferation of tumor cells. 7 Cancer‐associated fibroblasts (CAFs) are a component of TME and have been reported to contribute to malignant characteristics of tumor cells such as proliferation, drug resistance, and epithelial‐mesenchymal transition. 8 , 9 , 10 , 11
Cells use proteins, ions, lipids, bioactive molecules, or extracellular vesicles (EVs) for cell‐to‐cell interactions. EVs are biological nanoscale spherical lipid bilayer vesicles secreted by cells that contain various bioactive substances such as proteins, peptides, lipids, DNAs, messenger RNAs, and microRNAs (miRNAs), and transport them between cells. 12 CAFs have also been reported to communicate via EVs, and miRNAs in EVs have been implicated in cancer progression. Different distribution of miRNAs in EVs between normal fibroblasts (NFs) and CAFs was reported in several cancer types. 13 However, few reports have examined the differences in miRNAs in CAF‐ and NF‐derived EVs in ICC.
This study aimed to examine differential miRNA profiles in CAF‐ and NF‐derived EVs isolated from ICC sections using miRNA microarray analysis. We hypothesized that specific upregulated miRNAs in EVs derived from CAFs may progress to ICC tumor cells and degrade the prognoses of ICC patients.
2. MATERIALS AND METHODS
2.1. Ethical statement
Tissue samples were obtained from ICC patients who underwent hepatic resection at Kyushu University Hospital between October 2017 and March 2019 (approval number: 30‐224). The patients who enrolled in our retrospective study were treated between January 1993 and December 2019 (approval number: 2019‐234). All the participants provided written informed consent. This study was approved by the Clinical Research Ethics Committee of Kyushu University Hospital according to the Ethical Guidelines of the Japanese Government.
2.2. Stromal fibroblast isolation and cell culture
Three sets of matched ICC and adjacent (≤5 cm from the tumor edge) tissues from patients with ICC were examined. The clinicopathological factors of the three patients are listed in Table S1. Sections were treated with collagenase type 1 (Worthington, CLSS1) and fibroblasts were isolated by concentration gradient centrifugation. Derived fibroblasts were seeded and incubated with DMEM‐F12 (Thermo Fisher Scientific) containing 10% fetal bovine serum in a humidified atmosphere of 5% CO2 at 37 °C.
2.3. EV isolation and characteristics
To purify the EVs, conditioned medium (CM) from CAFs and NFs was cleared by filtration through a 0.22‐mm PVDF filter (Millipore) and mixed with Total Exosome Isolation Reagent (from cell culture media) (Thermo Fisher Scientific, 4478359). EVs were isolated according to the manufacturer's instructions. The size and concentration of EVs were quantified using a NanoSight LM10V‐HS instrument (Malvern Instruments Ltd.) and transmission electron microscopy (TEM; Hitachi Hi‐Tech TH7700). 11
2.4. RT‐PCR analysis
Total miRNA was extracted from cells using Maxwell® RSC miRNA Cells Kit (Promega Co.). Expression of miRNAs was evaluated by quantitative real‐time polymerase chain reaction (RT‐PCR). Complementary DNA was synthesized using TaqMan Reverse Transcription Kit (Thermo Fisher Scientific). PCR analysis was performed using TaqMan Fast Universal Master Mix (Thermo Fisher Scientific) and the ABI Prism 7000 Sequence Detection System (Applied Biosystems). Relative expression was calculated by the comparative 2‐ΔΔCt method; all measurements were performed three times.
2.5. Western blotting analysis
Cells and EV proteins were separated on 10%–15% SuperSep™ Ace gels (Fujifilm) and transferred onto polyvinylidene difluoride membranes using a Trans‐Blot® Turbo™ Transfer System (Bio‐Rad). Western blotting was performed on iBind™ Western Systems (Thermo Fisher Scientific) according to the manufacture's instructions 14 using the following primary antibodies: mouse anti‐αSMA (Sigma, A5228), rabbit anti‐FAPα (Abcam, ab137549), rabbit anti‐E‐cad (Cell Signaling Technologies, 24E10), mouse anti‐CD9 (Santa Cruz, sc‐59,140), mouse anti‐CD63 (Abcam, ab59479), and mouse anti‐CD81 (Santa Cruz, sc‐166,029). Protein bands were visualized using HRP‐conjugated secondary antibodies and Chemi‐Lumi One (Nacalai Tesque) on an Amersham Imager 600 (GE Healthcare).
2.6. Immunofluorescence analysis
Cells were fixed with 4% paraformaldehyde, permeabilized with 0.1% Triton X‐100, and blocked with 3% bovine serum albumin. Fixed cells were incubated with primary antibodies. The cells were then incubated with fluorescence‐conjugated secondary antibodies. The samples were viewed using a BZ‐X810 fluorescence microscope (Keyence).
2.7. RNA extraction from EVs and miRNA microarray analysis
To extract RNA from EVs, EVs were pretreated with the Total Exosome RNA & Protein Isolation Kit (Thermo Fisher Scientific, 4478545) and purified according to the manufacturer's instructions. Total RNA isolated from EVs derived from NFs and CAFs was used for miRNA microarray analyses, which were performed using the 3D‐Gene miRNA Microarray Platform (Toray Industries), which is designed to contain all miRNAs in miRBase Release 22. After the total RNA was checked using an Agilent 2100 Bioanalyzer (Agilent Technologies, Inc.), the miRNAs were labeled with a 3D‐Gene miRNA Labeling kit (Toray Industries) and hybridized on the 3D‐Gene chip. The microarray was scanned, and the images obtained were numerated using a 3D‐Gene Scanner 3000 (Toray Industries). Analyses and images were produced using R software version 3.6.1 (The R Foundation).
2.8. Cell transfection
miR‐493‐5p mimics (Assay ID: MC10627) and NC (Cat. No. 4464058) were purchased from Ambion (mirVana™ miRNA Mimics, Life Technologies); miR‐493‐5p and the negative control were transfected using Lipofectamine™ RNAiMAX (Thermo Fisher Scientific) in accordance with the manufacturer's instructions. 11
2.9. Proliferation assay
Cell proliferation was evaluated using the CellTiterGlo luminescent cell viability assay kit (Promega), which determines cell number using adenosine triphosphate levels. The luminescence was measured every 16–24 h. The baseline cell count was set at 100%.
2.10. Transwell migration and invasiveness assay
The cell migration and invasiveness assay used Falcon® Permeable Support for 24‐well plates with an 8.0‐mm transparent PET membrane (Corning Inc.). The cell invasion assay was performed using 15 ml of 5‐mg/ml Matrigel® Matrix (Corning Inc.) coating the bottom of each transwell insert. Stained cells using Diff‐Quik (JACLaS) on the transwell membrane surface were counted in five randomly selected fields at 200× magnification and quantified using Image J software (https://imagej.net/). The experiment was repeated three times according to the manufacturer's instructions.
2.11. Scratch assay
HuCCT1, HuH28, and SSP‐25 cells were seeded in six‐well plates and incubated until they reached 90% confluence. The confluent cell monolayers were scratched using 200‐μl plastic tips. Images of scratched areas were captured over the following 24–48 h, measured using Image J software (https://imagej.net/), and evaluated as the percentage of migration (1 − [length at 24 h]/[length at 0 h]). 15
2.12. miR‐493‐5p binding analysis
The predicted target genes for miR‐493‐5p were searched for using TargetScanHuman (https://www.targetscan.org/vert_80/). Simultaneously, data from The Cancer Genome Atlas (TCGA) were used to identify proteins with low expression associated with poor prognosis in patients with cholangiocarcinoma. Proteins common to both were searched and used in further experiments.
2.13. Immunohistochemical staining
Immunohistochemical staining for cocaine‐ and amphetamine‐regulated transcript propeptide (CARTPT) was performed on 4‐μm‐thick formalin‐fixed paraffin‐embedded sections. The sections were deparaffinized and then blocked with 10% normal goat serum. Tissue sections were incubated with CARTPT primary antibody (rabbit polyclonal, Phoenix Pharmaceuticals, H‐003‐61) at 4 °C overnight. The stained slides were scanned using NanoZoomer (Hamamatsu Photonics KK). Tumor cells with stained cytoplasm were defined as positive. The IHC data for CARTPT staining were evaluated by experienced researchers (A.M. and K.Y.) who were blinded to the clinical status of the patients. The final assessments were achieved by consensus. The proportion of CARTPT‐positive tumor cells was estimated as a percentage of the total number of tumor cells. We set the cut‐off value at 1% for tumor cells using the receiver operating curve. The plexus in human colon sections was used as a positive control. 16
2.14. Statistical analysis
Continuous variables were compared using Student's t‐test or the Mann–Whitney U test. Categorical variables were compared using the χ 2 test or Fisher's exact test. Univariate and multivariate survival analyses were performed using Cox proportional hazard models. Cumulative overall survival (OS) and recurrence‐free survival (RFS) rates were calculated using the Kaplan–Meier method, and differences between curves were evaluated using the log‐rank test. OS was calculated in years from the date of surgery to the date of last follow‐up or death. Statistical significance was set at P < 0.05 (two‐sided). All statistical analysis was performed using JMP15 software (SAS Institute).
3. RESULTS
3.1. Characteristics of CAFs and CM derived from CAFs promotes ICC cell progression
Three pairs of CAF and NF cell lines from ICC and adjacent normal tissues were established. Both CAFs and NFs expressed fibroblast‐specific markers (α‐SMA, FAP, and vimentin), as determined by immunofluorescence (Figure 1A) and western blotting (Figure 1B). To explore the effect of CM on tumor cells, three cell lines (HuCCT1, HuH28, and SSP25) were cultured with CM from CAFs or NFs. Scratch, proliferation, and transwell assays were used to evaluate tumor cell activity, which showed that CM derived from CAFs significantly increased the proliferative, migratory, and invasive potential of tumor cells compared with CM derived from NFs (Figure 1C–F). These findings suggest that CAFs secrete tumor‐promoting factors in the CM.
FIGURE 1.

Characteristics of cancer‐associated fibroblasts (CAFs) and conditioned medium (CM) derived from CAFs promote intrahepatic cholangiocarcinoma (ICC) cell progression. The expression of fibroblast markers, α‐smooth muscle actin (αSMA), fibroblast activation protein α (FAPα), Vimentin, by CAFs and normal fibroblasts (NFs) isolated from ICC specimens was confirmed by (A) fluorescent immunostaining and (B) Western blotting. Conditioned medium isolated from CAFs significantly promoted the (C) scratch assay, (D) proliferation assay, (E) transwell migration, and (F) invasion assay of HuCCT1, HuH28, and SSP25 cells compared with CM from NFs.
3.2. EVs in CM secreted from CAFs promote tumor cells
Next, EVs in CM derived from CAFs and NFs were isolated using polymer sedimentation. EVs in CM derived from CAFs and NFs isolated by this method expressed EV markers CD9, CD63, and CD81 (Figure 2A). The majority of EVs were 100 nm in diameter, suggesting that the main component was EVs (Figure 2B,C). To study the effect of EVs on cell lines, EVs derived from CAFs and NFs were added to cell lines and cultured. As in the case of CM, EVs derived from CAFs significantly increased the proliferative, migratory, and invasive potential of tumor cells compared with EVs derived from NFs (Figure 2D–G). These results suggest that CAFs may be involved in the progression of tumor cells by secreting EVs.
FIGURE 2.
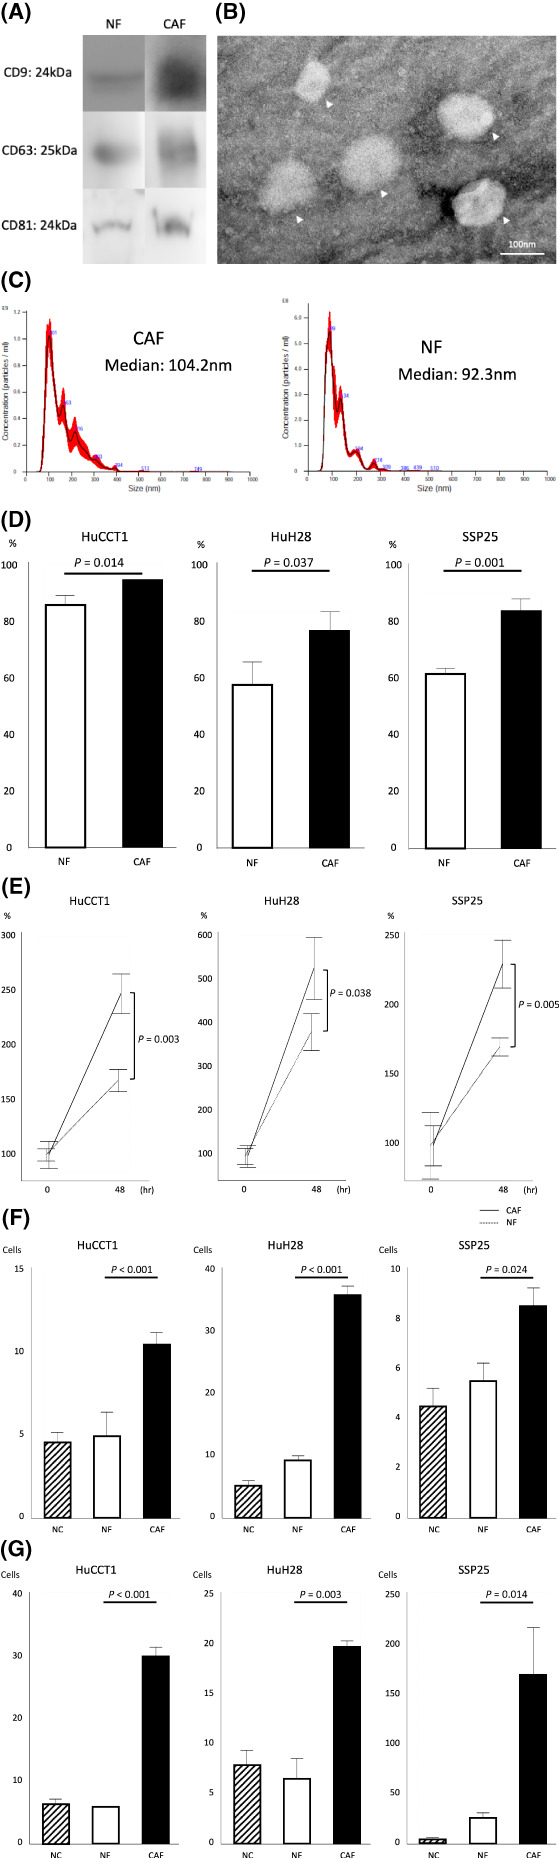
Extracellular vesicles (EVs) in conditioned medium (CM) secreted from cancer‐associated fibroblasts (CAFs) promote tumor cells. EVs were isolated from CM and confirmed by (A) Western blot, (B) transmission electron microscopy, and (C) Nanosight. EVs isolated from CAFs significantly promoted the (D) scratch assay, (E) proliferation assay, (F) transwell migration, and (G) invasion assay of HuCCT1, HuH28, and SSP25 cells compared with negative control (NC) and CM from normal fibroblasts (NFs).
3.3. miR‐493‐5p in EVs derived from CAFs promote tumor cells
For substances that promote tumor cells, we focused on miRNAs among the EV contents. CAFs and NFs were isolated from each of the three cases, and EVs were purified from each and comprehensively analyzed for miRNAs by microarray. Among the miRNAs whose secretion was elevated in CAFs, we focused on miR‐493‐5p (Figure 3A,B). RT‐PCR after transfection of miR‐493‐5p into cells showed that the detection of miR‐493‐5p was about 2 12 higher in HuCCT1 than in negative control, about 2 13 higher in HuH28, and about 2 13 higher in SSP25. We examined the effect of miR‐493‐5p overexpression in cell lines. In proliferation and scratch assays, miR‐493‐5p was found to significantly promote tumor cell proliferation (Figure 3D,E). These results suggest that CAFs promote tumor cell growth via miR‐493‐5p in EVs.
FIGURE 3.
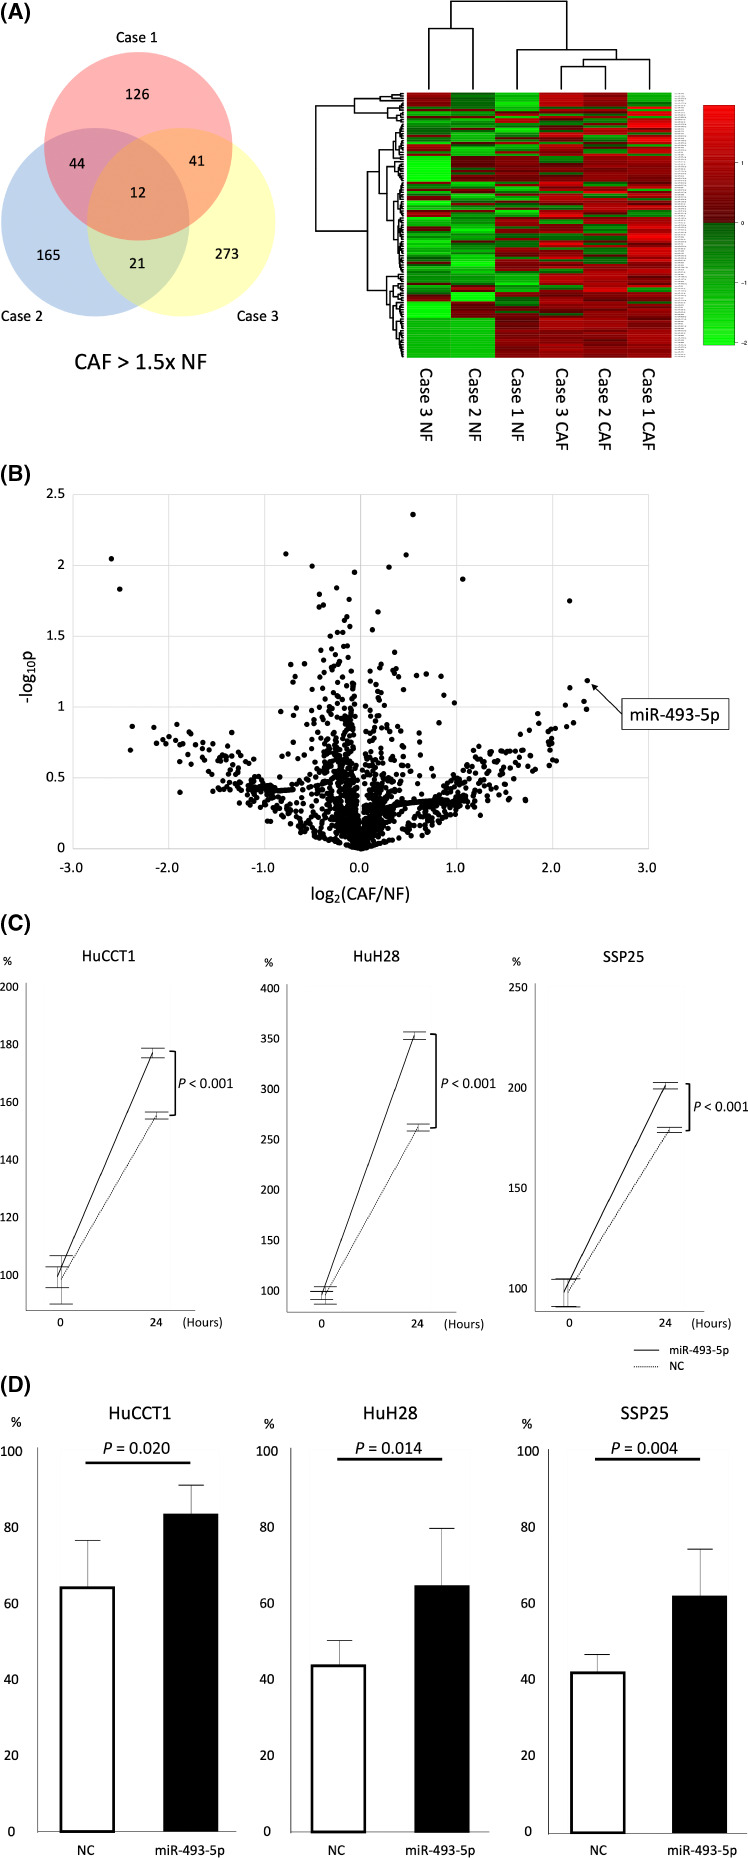
miR‐493‐5p in extracellular vesicles (EVs) derived from cancer‐associated fibroblasts (CAFs) promote tumor cells. (A) Microarray analysis of CAF‐derived EVs with normal fibroblast (NF)‐derived EVs showed that miR‐493‐5p was significantly increased in CAFs by (B) volcano plots. miR‐493‐5p significantly promoted (C) the proliferation assay and (D) scratch assay of HuCCT1, HuH28, and SSP25 cells compared with negative control (NC).
3.4. CARTPT is one of the targets of miR‐493‐5p
Next, we searched for miR‐493‐5p targets using public databases. Among the target genes that bind to and are repressed by the miR‐493‐5p sequence, 50 target genes were selected to increase the cumulative weighted context++ score. We also searched TCGA for proteins whose low expression in cholangiocarcinoma was associated with poor prognosis. Of the 21 proteins for which notably low expression had a poor prognosis, CARTPT overlapped with miR‐493‐5p targets. TCGA data showed that high expression of CARTPT was associated with higher survival rates than its low expression (Figure 4A).
FIGURE 4.

miR‐493‐5p promotes tumor cell growth by suppressing cocaine‐ and amphetamine‐regulated transcript propeptide (CARTPT) expression. (A) The Cancer Genome Atlas data showed that low CARTPT expression was associated with significantly poorer prognosis in cholangiocarcinoma. (B) Immunohistochemical staining of CARTPT was performed on intrahepatic cholangiocarcinoma specimens at our institution (n = 76) and divided into two groups: positive (n = 20) and negative (n = 56). (C) The CARTPT‐negative group had a significantly poorer prognosis in terms of both overall survival and recurrence‐free survival.
3.5. Low CARTPT expression correlates with poor prognosis in ICC patients
Immunohistochemical staining for CARTPT was performed on 76 resected specimens of cholangiocarcinoma and the patients were divided into two groups according to expression level to compare the prognosis (Figure 4B). In terms of clinicopathological factors, HBs antigen positivity and intrahepatic metastasis positivity were significantly higher in the low‐expression group (Table 1). Both OS and RFS were significantly worse in the low CARTPT expression group (Figure 4C). Cox proportional hazard analysis revealed that low CARTPT expression was an independent poor prognostic factor for OS and RFS (Table 2). These results suggest that miR‐493‐5p in EVs secreted from CAFs acts on tumor cells and causes tumor progression by suppressing CARTPT expression.
TABLE 1.
Association between CARTPT expression and clinicopathological factors in ICC patients
| Factors | CARTPT positive (n = 20) | CARTPT negative (n = 56) | p Value |
|---|---|---|---|
| Male (%) | 12 (60.0) | 42 (75.0) | 0.213 |
| Age | 66.8 ± 2.7 | 65.0 ± 1.6 | 0.585 |
| HBsAg positive (%) | 0 | 9 (16.1) | 0.015 |
| HCVAb positive (%) | 2 (10.0) | 4 (7.1) | 0.691 |
| Alb (g/dl) | 4.05 ± 0.09 | 4.08 ± 0.06 | 0.818 |
| T‐Bil (mg/dl) | 0.71 ± 0.07 | 0.81 ± 0.04 | 0.263 |
| ALP (IU/L) | 399.2 ± 50.7 | 372.4 ± 30.3 | 0.651 |
| γ‐GTP (IU/L) | 165.3 ± 35.1 | 128.8 ± 21.0 | 0.376 |
| Platelet (×104/μl) | 19.9 ± 1.8 | 18.9 ± 1.1 | 0.637 |
| Lymphocyte (/μl) | 1496.4 ± 124.4 | 1538.2 ± 79.1 | 0.778 |
| CEA (ng/ml) | 3.3 (1.1–30.7) | 2.4 (0.4–41.8) | 0.960 |
| CA19‐9 (IU/ml) | 45.7 (0.6–40,795) | 43.1 (0–35,218) | 0.323 |
| Tumor diameter (cm) | 4.22 ± 0.53 | 4.84 ± 0.32 | 0.315 |
| Peripheral type (%) | 14 (70.0) | 41 (73.2) | 0.784 |
| Poorly (%) | 8 (40.0) | 35 (62.5) | 0.082 |
| mvi (+) (%) | 7 (35.0) | 24 (42.9) | 0.537 |
| im (+) (%) | 3 (15.0) | 25 (44.6) | 0.013 |
Note: Data are presented as n (%), mean ± SD, or median (range).
Abbreviations: Alb, albumin; ALP, alkaline phosphatase; CA19‐9, carbohydrate antigen 19–9; CARTPT, cocaine‐ and amphetamine‐regulated transcript propeptide; CEA, carcinoembryonic antigen; HBsAg, hepatitis B virus surface antigen; HCVAb, hepatitis C virus antibody; im, intrahepatic metastasis; mvi, microvascular invasion; SD, standard deviation; T‐Bil, total bilirubin; γ‐GTP, γ‐glutamyl transpeptidase.
TABLE 2.
(A) Univariate and multivariate analysis of overall survival. (B) Univariate and multivariate analysis of recurrence‐free survival
| Factors | HR (univariate) | P value | HR (multivariate) | p Value |
|---|---|---|---|---|
| (A) | Overall survival | |||
| Male | 1.313 (0.618–2.786) | 0.479 | ||
| Age | 1.018 (0.988–1.049) | 0.243 | ||
| HBsAg positive | 1.202 (0.500–2.890) | 0.682 | ||
| HCVAb positive | 0.352 (0.048–2.569) | 0.220 | ||
| Alb | 0.373 (0.163–0.837) | 0.017 | 0.125 (0.043–0.343) | <0.001 |
| Platelet | 0.991 (0.951–1.009) | 0.665 | ||
| Lymphocyte | 1.000 (0.999–1.001) | 0.981 | ||
| CEA | 1.034 (0.990–1.066) | 0.120 | ||
| CA19‐9 | 1.000 (0.999–1.000) | 0.264 | ||
| Tumor diameter | 1.147 (1.019–1.283) | 0.024 | 1.202 (1.016–1.421) | 0.032 |
| Peripheral type | 0.318 (0.164–0.615) | 0.001 | 0.487 (0.205–1.158) | 0.111 |
| Poorly | 1.313 (0.680–2.534) | 0.414 | ||
| mvi (+) | 1.699 (0.890–3.242) | 0.111 | ||
| im (+) | 3.609 (1.856–7.018) | <0.001 | 4.585 (2.008–10.47) | <0.001 |
| CARTPT negative | 2.333 (1.022–5.326) | 0.029 | 2.962 (1.114–7.872) | 0.030 |
| (B) | Recurrence‐free survival | |||
|---|---|---|---|---|
| Male | 1.412 (0.737–2.706) | 0.299 | ||
| Age | 1.003 (0.979–1.028) | 0.824 | ||
| HBsAg positive | 1.821 (0.818–4.055) | 0.142 | ||
| HCVAb positive | 0.826 (0.255–2.670) | 0.749 | ||
| Alb | 0.705 (0.363–1.347) | 0.292 | ||
| Platelet | 0.993 (0.960–1.025) | 0.694 | ||
| Lymphocyte | 0.999 (0.999–1.001) | 0.966 | ||
| CEA | 1.053 (1.007–1.090) | 0.027 | 1.041 (0.991–1.081) | 0.100 |
| CA19‐9 | 1.000 (0.999–1.000) | 0.360 | ||
| Tumor diameter | 1.124 (1.017–1.234) | 0.024 | 1.180 (1.028–1.342) | 0.020 |
| Peripheral type | 0.643 (0.353–1.173) | 0.162 | ||
| Poorly | 1.413 (0.801–2.492) | 0.228 | ||
| mvi (+) | 1.752 (1.000–3.068) | 0.049 | 2.128 (1.166–3.885) | 0.014 |
| im (+) | 2.355 (1.345–4.122) | 0.003 | 1.884 (0.994–3.570) | 0.052 |
| CARTPT negative | 3.962 (1.901–8.261) | <0.001 | 4.060 (1.897–8.690) | <0.001 |
Note: Data are presented as HR (95% CI).
Abbreviations: Alb, albumin; CA19‐9, carbohydrate antigen 19–9; CARTPT, cocaine‐ and amphetamine‐regulated transcript propeptide; CEA, carcinoembryonic antigen; CI, confidence interval; HBsAg, hepatitis B virus surface antigen; HCVAb, hepatitis C virus antibody; HR, hazard ratio; im, intrahepatic metastasis; mvi, microvascular invasion.
4. DISCUSSION
In the current study, we demonstrated that EVs derived from CAFs significantly affected ICC progression and that miRNA in EV profiles differed between CAFs and NFs using miRNA microarray analysis. The specific miR‐493‐5p level was higher in EVs derived from CAFs than in those derived from NFs. ICC tumor cell proliferation was promoted by transfection with miR‐493‐5p. Furthermore, we identified CARTPT, a target of miR‐493‐5p, from a public database. Patients with low CARTPT expression had a worse prognosis than those with high CARTPT expression. Taken together, these results indicate that CAFs promote ICC progression by increasing miR‐493‐5p levels in EVs. The evaluation of miR‐493‐5p in EVs could help stratify the risk among patients with ICC.
It has been reported that cancer cells induce the transformation of local fibroblasts into CAFs, which in turn secrete various cytokines to promote cancer stemness and tumor‐associated lymphangiogenesis. 17 , 18 , 19 , 20 Although there are still few reports on ICC, Lin et al. 21 reported that CAFs induce MDSCs and promote the stemness of ICC tumor cells. Yamanaka et al. 22 also reported that cytokines from CAFs promote ICC tumor cells. Thus, the interaction between CAFs and ICC tumor cells is a key factor in ICC progression.
There have been several reports on the relationship between ICC tumor cells and miRNAs. Wei et al. 23 reported that miR‐142‐5p promotes ICC tumor cells by targeting PTEN. Wu et al. 24 also reported that miR‐424‐5p suppresses ICC tumor cells via ARK5. Other miRNAs, such as miR‐30a‐5p 25 and miR‐590‐3p, 26 have been reported to be involved in ICC tumor cells, but there have been no reports on miR‐493‐5p prior the present study. In addition, all these reports analyzed miRNAs secreted by ICC tumor cells, and this study is the first to report miRNAs derived from CAFs, a component of the TME.
Several studies have shown that miR‐493‐5p has antitumor functions in various cancer types. Although miR‐493‐5p has been reported to function in a suppressive manner in various cancer types, 27 , 28 , 29 it has not been reported in cholangiocarcinomas, including ICC. The expression patterns and biological mechanisms of miR‐493‐5p in ICC progression have not yet been fully elucidated. Our results show that the overexpression of miR‐493‐5p promotes ICC tumor cells in vitro. These results imply that miR‐493‐5p may act as a tumor progressive regulator of ICC.
miR‐493‐5p and CARTPT shared eight base pairs, suggesting that miR‐493‐5p is a robust repressor of CARTPT. CARTPT, which stands for cocaine‐ and amphetamine‐regulated transcript prepropeptide, has been reported to be involved in diabetes, 30 Alzheimer's disease, 31 etc. Although Lu et al. 32 reported that CARTPT is associated with mammary mucous carcinoma, the molecular mechanism has not been clarified. In our cohort, low expression of CARTPT was a significant poor prognostic factor for both OS and RFS in multivariate analysis. This is similar to the results from the public database, indicating that our results are supported by the results of this study. Thus, combined with these clinical factors, the evaluation of miR‐493‐5p levels could provide prognostic prediction in ICC patients, and it was suggested that CARTPT could be a biomarker for ICC. However, the molecular mechanism of action of CARTPT in ICC tumor cells is unclear and requires further study.
The limitations of our study were that we did not conduct an in vivo study, nor did we examine miR‐493‐5p concentration in clinical specimens. An in vivo study will be a subject of future study, but the concentration of miR‐493‐5p in specimens was not studied at this time because the study in stored specimens was performed in bulk and did not focus on CAFs. We believe that it will be possible to study this by performing single‐cell RNA sequencing, but this is a subject for future study.
In summary, these data suggest that CAFs in the TME suppress CARTPT in tumor cells and promote tumor cells via miR‐493‐5p in EVs.
AUTHOR CONTRIBUTIONS
K.T. and A.M participated in the study conception and design, analysis, and drafting of the article. S.I. and N.H. participated in the study conception and design, and in the critical revision of the manuscript. K.Y., T.T., Y.K.F., T.T., T.K., Y.N., and K.M. participated in the data acquisition, analysis, and interpretation. Y.O and T.Y. participated in the critical revision of the manuscript.
FUNDING INFORMATION
This study was supported by JSPS KAKENHI and Grants‐in‐Aid from the Ministry of Health, Labour and Welfare, Japan (Number JP‐19 K09198). The funding sources had no role in the collection, analysis, or interpretation of the data, or in the decision to submit the article for publication.
CONFLICT OF INTEREST
Y.O. is an Editorial Board Member of Cancer Science. The other authors have no conflict of interest.
ETHICS STATEMENTS
Approval of research protocol by an Institutional Reviewer Board: This study was approved by the Clinical Research Ethics Committee of Kyushu University Hospital (approval number: 30‐224, 2019‐234).
Informed consent: All the participants provided written informed consent.
Registry and Registration No. of the study/trial: N/A.
Animal Studies: N/A.
Supporting information
Table S1.
ACKNOWLEDGEMENTS
We thank Ms. Saori Tsurumaru, Ms. Asuka Nakamura, Ms. Yuko Kubota, and Ms. Miki Nakashima for technical support, and Dr. Takaaki Kanemaru (Department of Morphology Core Unit, Kyushu University Hospital) for taking images by using TEM. We would like to thank Editage (www.editage.com) for English language editing.
Toshida K, Itoh S, Harada N, et al. Cancer‐associated fibroblasts promote tumor cell growth via miR‐493‐5p in intrahepatic cholangiocarcinoma. Cancer Sci. 2023;114:937‐947. doi: 10.1111/cas.15644
REFERENCES
- 1. Florio AA, Ferlay J, Znaor A, et al. Global trends in intrahepatic and extrahepatic cholangiocarcinoma incidence from 1993 to 2012. Cancer. 2020;126:2666‐2678. [DOI] [PMC free article] [PubMed] [Google Scholar]
- 2. Yugawa K, Itoh S, Iseda N, et al. Obesity is a risk factor for intrahepatic cholangiocarcinoma progression associated with alterations of metabolic activity and immune status. Sci Rep. 2021;11:5845. [DOI] [PMC free article] [PubMed] [Google Scholar]
- 3. Burak K, Angulo P, Pasha TM, Egan K, Petz J, Lindor KD. Incidence and risk factors for cholangiocarcinoma in primary sclerosing cholangitis. Am J Gastroenterol. 2004;99:523‐526. [DOI] [PubMed] [Google Scholar]
- 4. Palmer WC, Patel T. Are common factors involved in the pathogenesis of primary liver cancers? A meta‐analysis of risk factors for intrahepatic cholangiocarcinoma. J Hepatol. 2012;57:69‐76. [DOI] [PMC free article] [PubMed] [Google Scholar]
- 5. Mavros MN, Economopoulos KP, Alexiou VG, Pawlik TM. Treatment and prognosis for patients with intrahepatic cholangiocarcinoma: systematic review and meta‐analysis. Jama Surg. 2014;149:565‐574. [DOI] [PubMed] [Google Scholar]
- 6. Valle J, Wasan H, Palmer DH, et al. Cisplatin plus gemcitabine versus gemcitabine for biliary tract cancer. New Engl J Medicine. 2010;362:1273‐1281. [DOI] [PubMed] [Google Scholar]
- 7. Yugawa K, Itoh S, Yoshizumi T, et al. Prognostic impact of tumor microvessels in intrahepatic cholangiocarcinoma: association with tumor‐infiltrating lymphocytes. Modern Pathol. 2021;34:798‐807. [DOI] [PubMed] [Google Scholar]
- 8. Li YY, Tao YW, Gao S, et al. Cancer‐associated fibroblasts contribute to oral cancer cells proliferation and metastasis via exosome‐mediated paracrine miR‐34a‐5p. Ebiomedicine. 2018;36:209‐220. [DOI] [PMC free article] [PubMed] [Google Scholar]
- 9. Richards KE, Zeleniak AE, Fishel ML, Wu J, Littlepage LE, Hill R. Cancer‐associated fibroblast exosomes regulate survival and proliferation of pancreatic cancer cells. Oncogene. 2017;36:1770‐1778. [DOI] [PMC free article] [PubMed] [Google Scholar]
- 10. Sukowati CH, Anfuso B, Croce LS, Tiribelli C. The role of multipotent cancer associated fibroblasts in hepatocarcinogenesis. Bmc Cancer. 2015;15:188. [DOI] [PMC free article] [PubMed] [Google Scholar]
- 11. Yugawa K, Yoshizumi T, Mano Y, et al. Cancer‐associated fibroblasts promote hepatocellular carcinoma progression through downregulation of exosomal miR‐150‐3p. Eur J Surg Oncol. 2021;47:384‐393. [DOI] [PubMed] [Google Scholar]
- 12. Kosaka N, Yoshioka Y, Fujita Y, Ochiya T. Versatile roles of extracellular vesicles in cancer. J Clin Invest. 2016;126:1163‐1172. [DOI] [PMC free article] [PubMed] [Google Scholar]
- 13. Yang F, Ning Z, Ma L, et al. Exosomal miRNAs and miRNA dysregulation in cancer‐associated fibroblasts. Mol Cancer. 2017;16:148. [DOI] [PMC free article] [PubMed] [Google Scholar]
- 14. Iseda N, Itoh S, Yoshizumi T, et al. Impact of nuclear factor erythroid 2‐related factor 2 in hepatocellular carcinoma: cancer metabolism and immune status. Hepatology Commun. 2022;6:665‐678. [DOI] [PMC free article] [PubMed] [Google Scholar]
- 15. Yugawa K, Itoh S, Yoshizumi T, et al. CMTM6 stabilizes PD‐L1 expression and is a new prognostic impact factor in hepatocellular carcinoma. Hepatology Commun. 2021;5:334‐348. [DOI] [PMC free article] [PubMed] [Google Scholar]
- 16. Janiuk I, Olkowski B, Szczotka‐Bochniarz A. Identification and differential distribution of CART in the small intestine depending on the diet. J Anim Physiol Anim Nutr (Berl). 2014;98:1117‐1123. [DOI] [PubMed] [Google Scholar]
- 17. Junttila MR, De Sauvage FJ. Influence of tumour micro‐environment heterogeneity on therapeutic response. Nature. 2013;501:346‐354. [DOI] [PubMed] [Google Scholar]
- 18. Shi Y, Gao W, Lytle NK, et al. Targeting LIF‐mediated paracrine interaction for pancreatic cancer therapy and monitoring. Nature. 2019;569:131‐135. [DOI] [PMC free article] [PubMed] [Google Scholar]
- 19. Su S, Chen J, Yao H, et al. CD10(+)GPR77(+) cancer‐associated fibroblasts promote cancer formation and chemoresistance by sustaining cancer stemness. Cell. 2018;172(841–856):e16. [DOI] [PubMed] [Google Scholar]
- 20. Cadamuro M, Brivio S, Mertens J, et al. Platelet‐derived growth factor‐D enables liver myofibroblasts to promote tumor lymphangiogenesis in cholangiocarcinoma. J Hepatol. 2019;70:700‐709. [DOI] [PMC free article] [PubMed] [Google Scholar]
- 21. Lin Y, Cai Q, Chen Y, et al. CAFs shape myeloid‐derived suppressor cells to promote stemness of intrahepatic cholangiocarcinoma through 5‐lipoxygenase. Hepatology. 2022;75:28‐42. [DOI] [PubMed] [Google Scholar]
- 22. Yamanaka T, Harimoto N, Yokobori T, et al. Nintedanib inhibits intrahepatic cholangiocarcinoma aggressiveness via suppression of cytokines extracted from activated cancer‐associated fibroblasts. Brit J Cancer. 2020;122:986‐994. [DOI] [PMC free article] [PubMed] [Google Scholar]
- 23. Wei G, Yuan Y, He X, Jin L, Jin D. Enhanced plasma miR‐142‐5p promotes the progression of intrahepatic cholangiocarcinoma via targeting PTEN. Exp Ther Med. 2019;17:4190‐4196. [DOI] [PMC free article] [PubMed] [Google Scholar]
- 24. Wu J, Yang B, Zhang Y, et al. miR‐424‐5p represses the metastasis and invasion of intrahepatic cholangiocarcinoma by targeting ARK5. Int J Biol Sci. 2019;15:1591‐1599. [DOI] [PMC free article] [PubMed] [Google Scholar]
- 25. Zhang JW, Wang X, Li GC, et al. MiR‐30a‐5p promotes cholangiocarcinoma cell proliferation through targeting SOCS3. J Cancer. 2020;11:3604‐3614. [DOI] [PMC free article] [PubMed] [Google Scholar]
- 26. Zu C, Liu S, Cao W, et al. MiR‐590‐3p suppresses epithelial‐mesenchymal transition in intrahepatic cholangiocarcinoma by inhibiting SIP1 expression. Oncotarget. 2017;8:34698‐34708. [DOI] [PMC free article] [PubMed] [Google Scholar]
- 27. Liu Q, Luo J, Wang H, Zhang L, Jin G. SNHG1 functions as an oncogenic lncRNA and promotes osteosarcoma progression by up‐regulating S100A6 via miR‐493‐5p. Acta Bioch Bioph Sin. 2022;54:1‐11. [DOI] [PMC free article] [PubMed] [Google Scholar]
- 28. Huang Z, Wang C, Zhao X. circFIG 4 drives the carcinogenesis and metastasis of esophagus cancer via the miR‐493‐5p/E2F3 axis. Thorac Cancer. 2022;13:783‐794. [DOI] [PMC free article] [PubMed] [Google Scholar]
- 29. Liu Z, Wang Y, Ding Y. Circular RNA circPRKDC promotes tumorigenesis of gastric cancer via modulating insulin receptor substrate 2 (IRS2) and mediating microRNA‐493‐5p. Bioengineered. 2021;12:7631‐7643. [DOI] [PMC free article] [PubMed] [Google Scholar]
- 30. Abels M, Riva M, Shcherbina L, et al. Overexpressed beta cell CART increases insulin secretion in mouse models of insulin resistance and diabetes. Peptides. 2022;151:170747. [DOI] [PubMed] [Google Scholar]
- 31. Zhuang QS, Meng L, Wang Z, Shen L, Ji HF. Associations between obesity and Alzheimer's disease: multiple bioinformatic analyses. J Alzheimer's Dis. 2021;80:271‐281. [DOI] [PubMed] [Google Scholar]
- 32. Lu K, Wang X, Zhang W, et al. Clinicopathological and genomic features of breast mucinous carcinoma. Breast. 2020;53:130‐137. [DOI] [PMC free article] [PubMed] [Google Scholar]
Associated Data
This section collects any data citations, data availability statements, or supplementary materials included in this article.
Supplementary Materials
Table S1.