

Abstract
Extensive desmoplasia and poor vasculature renders pancreatic tumors severely hypoxic, contributing to their aggressiveness and therapy resistance. Here, we identify the HuR/MYB/HIF1α axis as a critical regulator of the metabolic plasticity and hypoxic survival of pancreatic cancer cells. HuR undergoes nuclear‐to‐cytoplasmic translocation under hypoxia and stabilizes MYB transcripts, while MYB transcriptionally upregulates HIF1α. Upon MYB silencing, pancreatic cancer cells fail to survive and adapt metabolically under hypoxia, despite forced overexpression of HIF1α. MYB induces the transcription of several HIF1α‐regulated glycolytic genes by directly binding to their promoters, thus enhancing the recruitment of HIF1α to hypoxia‐responsive elements through its interaction with p300‐dependent histone acetylation. MYB‐depleted pancreatic cancer cells exhibit a dramatic reduction in tumorigenic ability, glucose‐uptake and metabolism in orthotopic mouse model, even after HIF1α restoration. Together, our findings reveal an essential role of MYB in metabolic reprogramming that supports pancreatic cancer cell survival under hypoxia.
Keywords: HIF1α, hypoxia, metabolic reprogramming, MYB, pancreatic cancer
Subject Categories: Cancer, Metabolism, RNA Biology
Tumor cells face hypoxic stress as they evolve, which modulates their behavior and treatment response. MYB supports the hypoxic survival of pancreatic cancer cells by controlling the transcriptional activity of HIF‐1α and metabolic plasticity.
Introduction
Pancreatic cancer (PC) is one of the most notorious malignancies, with a current five‐year survival rate of about 10% (Siegel et al, 2022). It is characterized by poor vasculature and extensive desmoplasia that create highly hypoxic niches within the tumor microenvironment, enforcing the selection of adaptive tumor cell types (Hingorani et al, 2003; Feig et al, 2012; Dauer et al, 2017; Yamasaki et al, 2020). In response to hypoxia, cancer cells undergo a reprogramming of cellular and metabolic pathways to sustain their survival and gain aggressive features (Eales et al, 2016; Hollinshead et al, 2020). Hypoxia‐inducible factors (HIFs) act as the master regulators of hypoxia‐activated gene expression and exhibit increased accumulation due to the inhibition of the proteasomal degradation (Semenza, 2013). HIF1α is ubiquitously expressed, and several of its target genes encode for metabolic enzymes and membrane transporters that help tumor cells adapt metabolically under the hypoxic environment and promote its aggressive progression (Marin‐Hernandez et al, 2009; Semenza, 2010, 2013). However, there is also evidence suggesting tumor suppressive functions of HIF1α in some malignancies, including pancreatic cancer, suggesting a complex regulation of its activity by other tumor‐associated proteins (Shen et al, 2011; Tiwari et al, 2020).
MYB is a proto‐oncogene that encodes for a transcription factor protein involved in the gene regulation (Slamon et al, 1986). It is expressed in immature hematopoietic cells of all lineages and plays a role in maintaining their undifferentiated proliferative state (Greig et al, 2008). Previously, we demonstrated a significant role of MYB in pancreatic tumor growth and metastasis (Srivastava et al, 2015). We also showed that MYB promoted desmoplasia by potentiating the bi‐directional crosstalk between pancreatic cancer and stellate cells (Singh et al, 2012). Further, the characterization of MYB‐regulated gene networks and secretome in PC cells suggested its broader pathobiological implications (Azim et al, 2016; Zubair et al, 2020). An aberrant expression of MYB has been reported in several malignancies, including PC (Slamon et al, 1986; Wallrapp et al, 1997; Weston, 1999; Li et al, 2014, 2016; Srivastava et al, 2021). Various mechanisms have been implicated in MYB regulation in normal and malignant cells (Gudas et al, 1995; Dasse et al, 2012; George & Ness, 2014). Further, MYB is shown to act in concert with other proteins in a context‐dependent manner to impact diverse biological functions (George & Ness, 2014). However, mechanisms underlying MYB dysregulation and its role in the adaptation of PC cells to a harsh tumor microenvironment are not well defined.
Human antigen R (HuR) is an RNA‐binding protein implicated in the post‐transcriptional gene regulation (Peng et al, 2018). It is overexpressed in PC and other cancers and associated with poor clinical outcomes (Heinonen et al, 2005; Wang et al, 2013; Peng et al, 2018). Here, we present data demonstrating a role for HuR in MYB upregulation, especially under hypoxia, through the stabilization of its transcripts. We also show that MYB acts as a positive regulator of HIF1α expression and transcriptional activity, and HIF1α stabilization alone is not sufficient for optimal survival of PC cells under hypoxia. MYB‐silenced PC cells fail to metabolically adapt under hypoxia and exhibit downregulation of several genes involved in glucose uptake, glycolysis, and lactate synthesis and transport. MYB binds to and enhances the recruitment of HIF1α and p300 to the promoter regions of multiple metabolic genes. MYB knockout PC cells exhibit a dramatic reduction in their tumorigenic ability, glucose uptake, and metabolism in an orthotopic mouse model that cannot be rescued by forced overexpression of HIF1α, supporting an essential role of MYB in PC pathobiology.
Results
MYB expression is crucial for the survival and metabolic reprogramming of pancreatic cancer cells under hypoxia
To investigate the role of MYB in hypoxic survival, three pancreatic cancer cell lines having endogenously high (MiaPaCa and Panc‐1) or low (BxPC3) MYB expression were used. MYB expression was silenced in MiaPaCa and Panc‐1 cells by stable transfection of MYB‐targeting shRNA, whereas it was forcedly overexpressed in BxPC3 cells. Cells were also transfected with scrambled shRNA sequence‐expressing plasmid (Scr) or empty vector (Neo) to generate control‐paired cell lines (MiaPaCa‐Scr/MiaPaCa‐shMYB; Panc‐1‐Scr/Panc‐1‐shMYB; BxPC3‐Neo/BxPC3‐MYB). MYB overexpression or knockdown was confirmed intermittently and prior to performing all assays by immunoblotting (Fig EV1A). To examine the effect of MYB modulation on hypoxic survival, cells were cultured under normoxia and hypoxia (1.0% O2) for different time intervals (0–96 h), and the number of viable cells was counted by trypan blue dye exclusion assay. MYB‐silenced cells (MiaPaCa‐shMYB and Panc‐1‐shMYB) exhibited a significant decrease in viable cell number under hypoxia with ∼50% reduction by 96 h. In contrast, MYB‐overexpressing control cells (MiaPaCa‐Scr and Panc‐1‐Scr) continued to grow and showed a ∼30–40% increase in viable cell count in that duration. Similarly, low MYB‐expressing BxPC3‐Neo cells exhibited ∼20% reduced survival under hypoxia, while forced MYB‐overexpressing BxPC3‐MYB cells had an ∼80% increase in their growth after 96 h of incubation under hypoxia (Fig 1A). These findings were further confirmed by flow cytometry‐based measurement of Annexin‐V and 7‐AAD stained cells and fluorescence microscopy analysis of Calcein‐AM/EthD‐1 staining of live/dead cells. Flow cytometry‐based assessment shows a greater proportion of apoptotic cells in MYB knockdown groups than the scrambled control groups, whereas it is decreased in forced MYB‐expressing BxPC3‐MYB cells relative to low MYB expressing BxPC3‐Neo cells (Fig 1B). Similarly, we observe a significant reduction in live: dead cell ratio in MYB‐silenced cells cultured under hypoxia for 48 h (Fig EV1B). It is to be noted that MYB silencing and endogenous or forced overexpression sustain for a longer duration upon culturing of the cells under hypoxia (Appendix Fig S1A–C).
Figure EV1. MYB expression in parental and genetically modified stable pancreatic cancer cell lines and its effect on hypoxic survival.
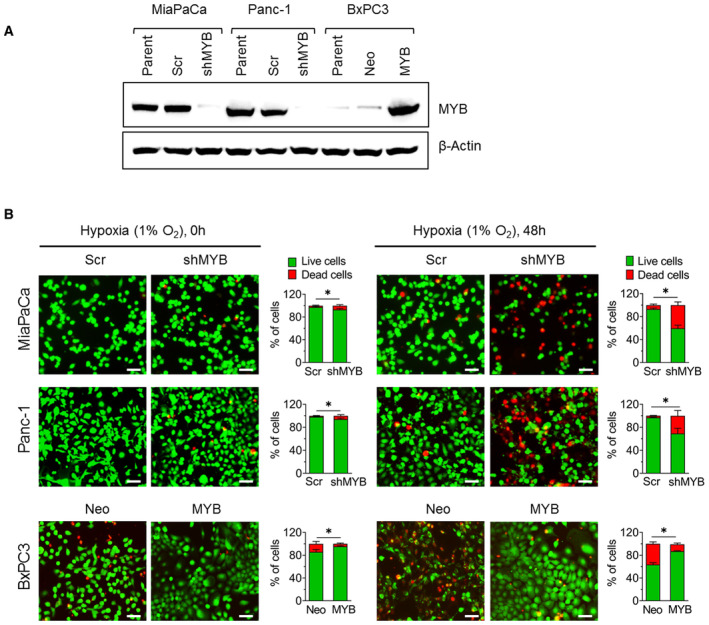
- MYB expression was analyzed by immunoblotting in MYB‐silenced (MiaPaCa‐shMYB and Panc‐1‐shMYB) and ectopic MYB‐overexpressing (BxPC3‐MYB) pancreatic cancer cell lines along with their parental and respective control sublines (MiaPaCa‐Scr, Panc‐1‐Scr, and BxPC3‐Neo). β‐Actin was used as a loading control.
- The survival of pancreatic cancer cells was examined by staining with Calcein‐AM (green) and ethidium homodimer‐1 (red) at 0 h and 48 h of incubation under hypoxia. Images were captured using a fluorescence microscope, and the number of live (green) and dead cells (red) were counted in at least 5 random fields. Scale bar, 150 μm (lower right corner).
Data information: Data are shown as means ± SD. The number of technical (B) replicates was 3. The reproducibility of the results (A, B) was confirmed at least three times in independent experiments. Two‐tailed unpaired Student's t‐test was used for statistical analyses. *P < 0.05.
Source data are available online for this figure.
Figure 1. MYB supports the survival and metabolic adaption of pancreatic cancer cells under hypoxia.
-
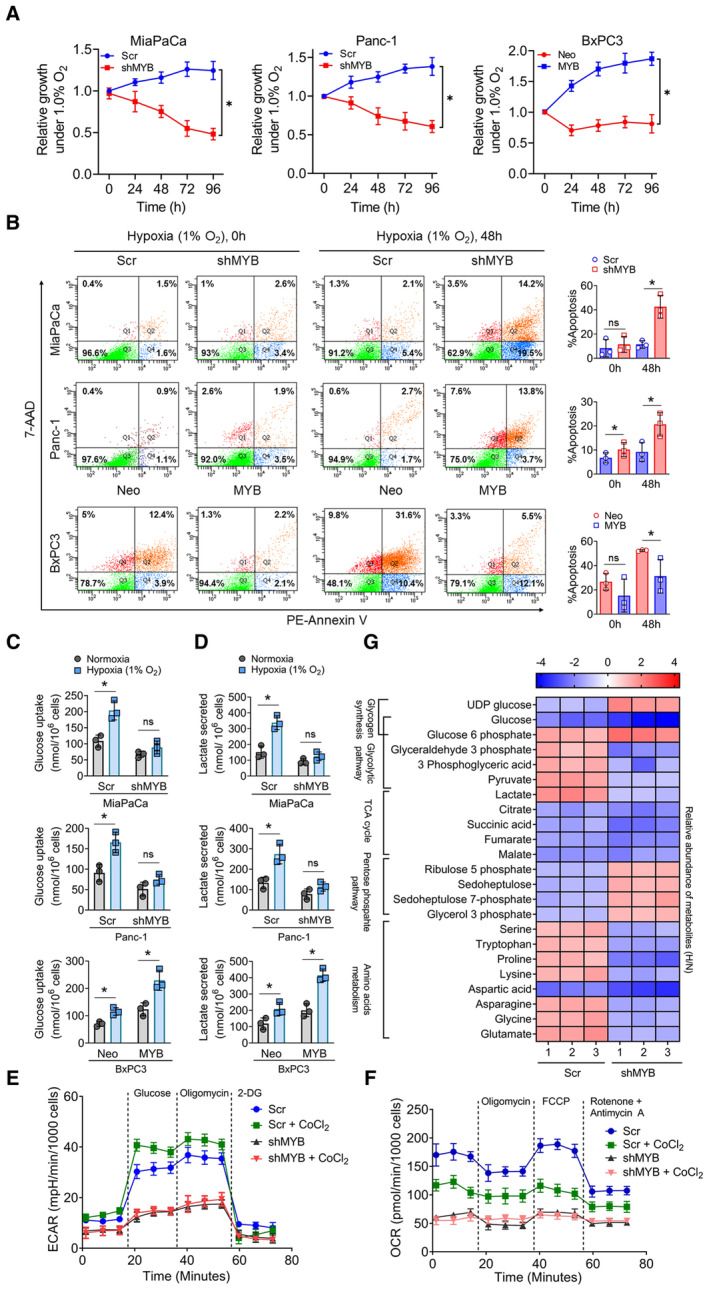
AMYB knockdown (MiaPaCa‐shMYB and Panc1‐shMYB) and forced MYB‐overexpressing (BxPC3‐MYB) PC cells along with their respective control cell lines (MiaPaCa‐Scr, Panc1‐Scr, and BxPC3‐Neo) were subjected to hypoxia (1% O2) treatment for different time intervals (0–96 h). Their growth was measured by viable cell counting using a trypan blue exclusion assay.
-
BApoptosis indices of genetically engineered MYB‐silenced or –overexpressing pancreatic cancer cells were analyzed by flow cytometry after staining with Annexin V and 7‐AAD.
-
C, DMYB‐modulated PC cells were cultured under hypoxia and normoxia for 48 h. Conditioned media was collected and analyzed for consumed glucose (C) and lactate secretion (D). The amount of glucose uptake and lactate secretion was normalized for the number of cells.
-
E, FECAR (E) and OCR (F) in control and MYB silenced MiaPaCa cells cultured under normoxia or treated with hypoxia mimetic CoCl2 (100 μM for 16 h). Thereafter, ECAR was measured in PC cells with sequential injection of glucose, oligomycin, and 2‐DG, while OCR was measured with the serial addition of oligomycin, FCCP, and antimycin A/rotenone.
-
GMiaPaCa‐Scr and MiaPaCa‐shMYB cells were cultured under normoxia and hypoxia for 48 h and harvested for metabolites extraction. The mean area covered by each metabolite's mass spectrum from the triplicate set of LC‐HRMS experiments was analyzed and normalized with protein concentration. The heat map was prepared after calculating the relative fold changes of metabolite levels in cells cultured under hypoxia (H) versus normoxia (N).
Data information: Data are shown as means ± SD. The number of technical (A, C–F) and biological (B, G) replicates were 3. The reproducibility of the results (A, C–F) was confirmed at least three times in independent experiments. Two‐tailed unpaired Student's t‐test was used for statistical analyses. n.s., not significant, *P < 0.05.
Since cancer cells exhibit a metabolic shift towards increased glycolysis and reduced mitochondrial metabolism under hypoxia to sustain their survival (Guillaumond et al, 2013; Eales et al, 2016; Lee et al, 2020), we examined glucose uptake and lactate secretion in PC cells upon their culturing under hypoxia. We observed a significant increase in glucose uptake and lactate secretion in cells with endogenous or forced MYB‐overexpression when cultured under hypoxia. In contrast, MYB‐silenced MiaPaCa and Panc‐1 cells did not exhibit any significant change, while a modest but significant increase was reported in low MYB‐expressing BxPC3 cells (Fig 1C and D). Similarly, we observed that high MYB‐expressing control cells exhibited a greater shift towards increased extracellular acidification rate (ECAR) and reduced oxygen consumption rate (OCR) relative to MYB‐silenced cells when subjected to hypoxia mimetic condition (Fig 1E and F). To further examine the role of MYB in metabolic reprogramming, we performed metabolite profiling of control and MYB‐silenced PC cells cultured under normoxia and hypoxia using high‐resolution mass spectrometry (LC‐HRMS). As expected, control cells exhibited enhanced glycolytic metabolites under hypoxia with a concomitant decrease in metabolites associated with the TCA cycle. However, MYB‐silenced cells exhibited a reduced accumulation of both glycolytic and mitochondrial metabolites under hypoxia (Fig 1G). Interestingly, an increased presence of UDP‐glucose and pentose phosphate pathway metabolites were observed in MYB‐knockdown cells, whereas high MYB‐expressing control cells exhibited increased levels of several amino acids, including serine, tryptophan, asparagine, glycine, and glutamic acid when cultured under hypoxia (Fig 1G). Altogether, these findings suggest that MYB plays an essential role in hypoxic survival by promoting metabolic reprogramming.
MYB expression is induced under hypoxia via a HuR‐mediated post‐transcriptional mechanism
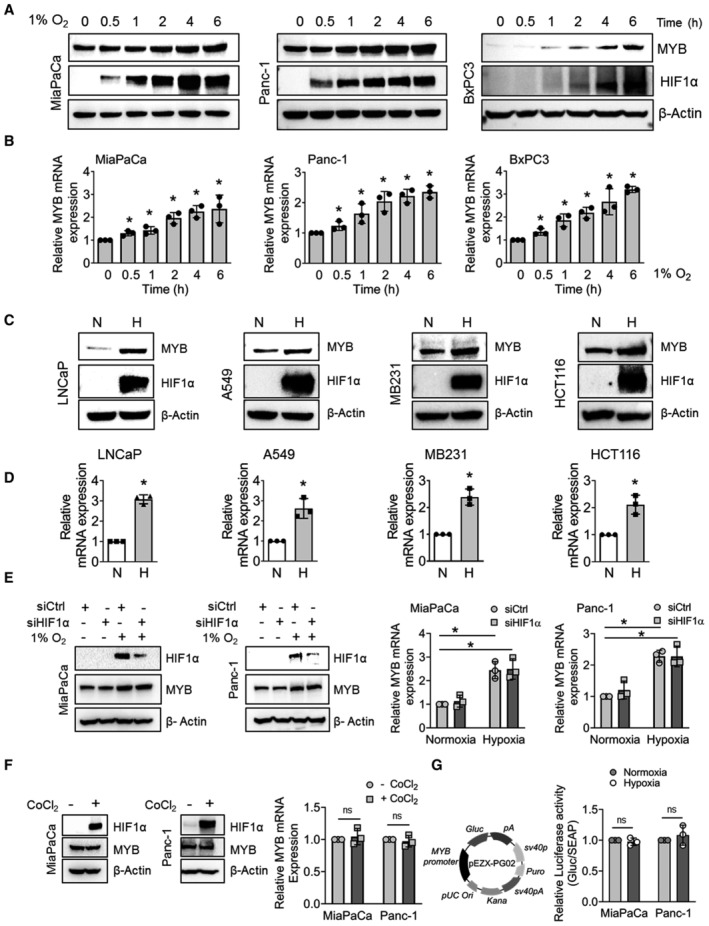
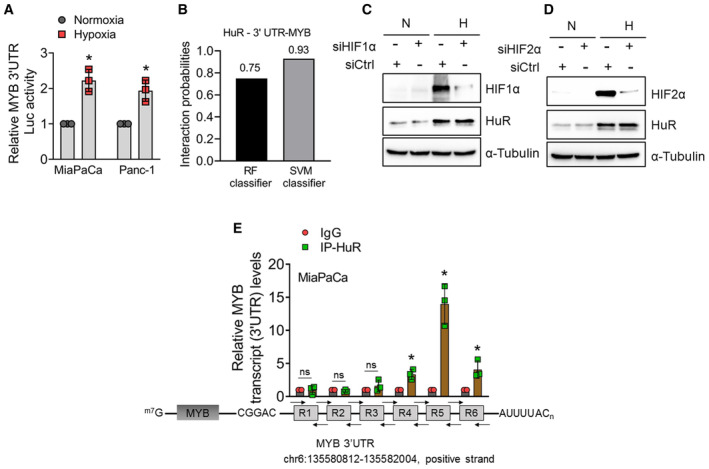
We next examined the effect of hypoxia on MYB expression in PC cells and observed a time‐dependent increase at both protein and mRNA levels (Fig 2A and B). Further, hypoxic induction of MYB was not restricted to PC cells but was also detected in prostate, lung, breast, and colon cancer cell lines (Fig 2C and D). Since HIF1α is a major hypoxia‐responsive transcription factor, we examined if it had a role in MYB induction. MYB expression remained unchanged upon HIF1α silencing in cells cultured under hypoxia (Fig 2E). Effect of HIF‐1α silencing on its established targets was also examined to confirm its functional inhibition (Fig EV2A). To further confirm this finding, we treated the PC cells with a hypoxia mimetic agent, cobalt chloride (CoCl2), or prolyl hydroxylases inhibitor, dimethyloxaloylglycine (DMOG) that led to hypoxia‐independent HIF‐1α stabilization. However, no noticeable change in MYB expression was reported in CoCl2 or DMOG‐treated PC cells (Figs 2F and EV2B). To exclude the possibility of HIF2α‐mediated MYB induction, we silenced its expression prior to the incubation of PC cells under hypoxia. No effect of HIF2α silencing was observed on MYB induction under hypoxia (Fig EV2C). Moreover, we did not observe any induction of MYB promoter‐driven luciferase activity in hypoxia‐treated PC cells (Fig 2G), suggesting the possibility of a post‐transcriptional regulatory mechanism. Actinomycin D chase assay revealed that MYB mRNA stability was increased significantly under hypoxia (t1/2, ∼ 4.5 h for MiaPaCa; ∼ 4.6 h for Panc‐1) relative to that under normoxia (t1/2, 2.3 h for MiaPaCa; 2.5 h for Panc‐1) (Fig 3A). Furthermore, we also observed greater luciferase activity in PC cells transfected with MYB‐3′UTR‐ luciferase reporter plasmid upon their incubation under hypoxia (Fig EV3A). Therefore, we mapped this region for the putative binding sites of RNA binding proteins (RBPs) using an in silico tool (RBPmap). Multiple binding sites for different RBPs, including HuR, were identified in 3′UTR of MYB (Appendix Table S1). HuR‐MYB mRNA interaction probability was further established by another in silico RNA–protein interaction prediction tool (RPISeq) (Fig EV3B). HuR was of interest since its rapid nuclear to cytoplasmic translocation under hypoxia is reported and associated with mRNA stabilization of genes through binding to the AU‐rich elements in their 3′UTRs (Blanco et al, 2016; Pan et al, 2019). An increase in the cytoplasmic accumulation of HuR in cells cultured under hypoxia was confirmed by immunofluorescence microscopy (Fig 3B) and immunoblot analyses (Fig 3C). Increased cytoplasmic accumulation of HuR under hypoxia was independent of HIF1α or HIF2α (Fig EV3C and D). Subsequently, we validated the interaction of MYB 3′UTR with HuR by RNA‐IP assay in cells cultured under hypoxia (Figs 3D and EV3E) and determined the effect of HuR silencing on MYB expression. HuR silencing reduced the luciferase activity in a MYB‐3′UTR‐ reporter assay (Fig 3E) and decreased the half‐life of MYB mRNA under both normoxia (siCtrl, ∼ 2.4 h; siHuR, 1.9 h) and hypoxia (siCtrl, ∼ 4.6 h; siHuR, ∼ 2.6 h) (Fig 3F). Also, we observed decreased levels of MYB mRNA and protein in HuR‐silenced PC cells (Fig 3G).
Figure 2. MYB upregulation under hypoxia is HIF1α‐independent and does not occur at the transcriptional level.
-
AMYB expression was analyzed by immunoblotting in pancreatic cancer cells cultured under hypoxia for different time intervals. HIF1α accumulation was examined as a positive control.
-
BMYB transcript levels were determined by qRT‐PCR in hypoxia‐treated cells.
-
C, DMYB protein (C) and transcript (D) levels were measured in the prostate (LNCaP), lung (A549), breast (MB231), and colon (HCT116) cancer cells cultured under normoxia and hypoxia (6 h) by immunoblotting and qRT‐PCR, respectively. β‐Actin/ACTB served as an internal control. N‐ normoxia and H‐ hypoxia.
-
EPancreatic cancer cells were transiently transfected either with non‐targeted control siRNA (siCtrl) or HIF1α ‐targeting siRNA (siHIF1α) for 24 h and then incubated under hypoxia for 6 h. MYB expression was analyzed at protein and mRNA levels.
-
FCells were treated with either vehicle or CoCl2 (100 μM) for 6 h, and total protein and RNA were isolated. The expression of HIF1α and MYB was examined. β‐Actin was used as an internal control.
-
GCells were co‐transfected with a plasmid expressing Gaussia luciferase under the control of MYB promoter and secreted alkaline phosphatase (SEAP) expression plasmid under a constitutive CMV promoter. After 24 h, media was replaced and cells were cultured under normoxia or hypoxia for 6 h. Luciferase and SEAP activities were analyzed and data presented as relative luciferase activity normalized with SEAP activity.
Data information: Data are shown as means ± SD. The number of technical (B, D–G) replicates was 3. Reproducibility of the results (A–G) was confirmed at least three times in independent experiments. Two‐tailed unpaired Student's t‐test was used for statistical analyses. n.s., not significant, *P < 0.05.
Source data are available online for this figure.
Figure EV2. Confirmation of functional inhibition of HIF1α upon RNAi‐mediated silencing by monitoring its target gene expression and effect of DMOG treatment or HIF2α silencing on MYB expression.
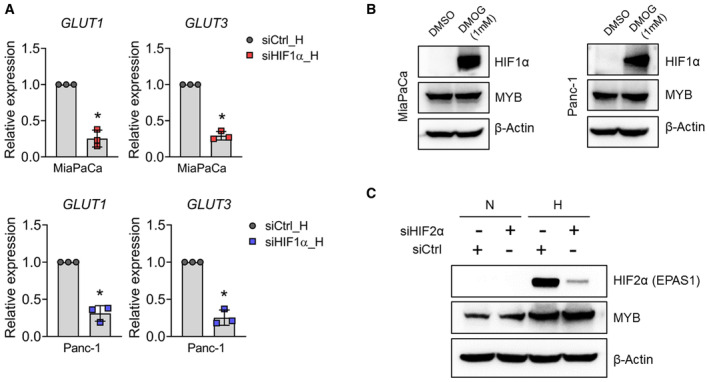
- After treatment with HIF1α‐specific siRNAs, the expression of its target genes, GLUT1 and GLUT3, was examined by qRT‐PCR. ACTB was used as an internal control.
- MiaPaCa and Panc‐1 cells were treated with 1 mM of Dimethyloxaloylglycine (DMOG) for 6 h. After that, total protein was extracted and subjected to immunoblotting for MYB and HIF1α expression analysis.
- MiaPaCa cells were treated with HIF2α (EPAS1)‐specific siRNAs for 24 h. Subsequently, cells were either incubated under normoxia or hypoxia for 6 h. Expression of HIF2α and MYB was analyzed by immunoblotting. β‐Actin was used as a loading control.
Data information: Data are shown as means ± SD. The number of technical (A) replicates was 3. Reproducibility of the results (A–C) was confirmed at least three times in independent experiments. Two‐tailed unpaired Student's t‐test was used for statistical analyses. *P < 0.05.
Source data are available online for this figure.
Figure 3. MYB is induced under hypoxia via a HuR‐mediated post‐transcriptional mechanism.
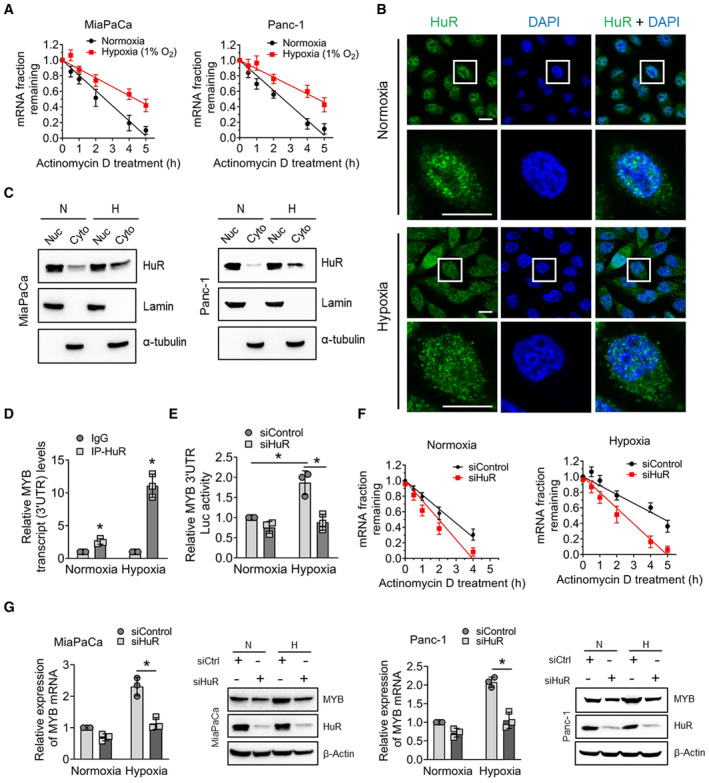
- Cells were pre‐treated with Actinomycin D (10 μg/ml) for 1 h followed by incubation under normoxia or hypoxia for indicated time points. Total RNA was collected and MYB mRNA levels were examined by q‐RT PCR. 18s rRNA was used as an internal control.
- HuR localization was examined by immunofluorescence microscopy in cells exposed to hypoxia for 1 h. HuR (green), and nucleus (blue). Scale bar, 25 μm (lower left corner). Lower panels are digitally magnified views of the marked rectangles.
- Cytosolic and nuclear protein fractions were prepared from cells cultured under hypoxia for 1 h and HuR expression was examined by immunoblotting. α‐Tubulin (nuclear) and Lamin A (cytoplasm) were used as loading controls.
- RNP‐IP assay was performed using the cytoplasmic fractions of cells exposed to hypoxia for 3 h. Following DNase I treatment, cytoplasmic fractions were sonicated and subjected to immunoprecipitation using an anti‐HuR antibody. MYB mRNA was checked by qRT‐PCR from isolated RNA fragments and normalized with IgG isotype control. 18s rRNA was used as an internal control.
- Following transfection with siHuR or control siRNA for 24 h, cells were co‐transfected with MYB 3′‐UTR‐firefly luciferase reporter and Renilla luciferase‐expressing control plasmid. After 24 h, cells were incubated under hypoxia for 6 h. Data are presented as Firefly luciferase activity normalized with Renilla luciferase activity.
- Cells transfected with HuR or control siRNA for 48 h were pretreated with Actinomycin D (10 μg/ml) for 1 h and then cultured under normoxia and hypoxia for various time points (0–6 h). Total RNA was collected, and MYB mRNA levels were checked in HuR‐silenced cells by q‐RT PCR. 18s rRNA was used as an internal control.
- Cells transfected with HuR or control siRNA for 48 h were exposed to hypoxia for 6 h, and MYB and HuR expression was determined by immunoblotting or qRT‐PCR.
Data information: Data are shown as means ± SD. The number of technical (A, D–G) replicates was 3. Reproducibility of the results (A–G) was confirmed at least three times in independent experiments. Two‐tailed unpaired Student's t‐test was used for statistical analyses. *P < 0.05.
Source data are available online for this figure.
Figure EV3. MYB 3′UTR luciferase assay, prediction of HuR interaction with MYB 3′UTR, validation of its direct binding to MYB 3′UTR, and HuR cytoplasmic expression in HIF1α or HIF2α‐silenced cells.
-
APancreatic cancer cells were co‐transfected with pGL3‐MYB 3′UTR firefly luciferase and pGL3‐TK renilla luciferase control plasmids for 24 h and then cultured under hypoxia or normoxia for another 6 h. Firefly luciferase activity was normalized with Renilla luciferase activity to control for the differences in the transfection efficiency.
-
BThe probability of interaction between HuR and MYB mRNA was predicted using RNA‐protein interaction prediction (RPISeq) software.
-
C, DImmunoblot analysis of HuR cytoplasmic expression in (C) HIF1α‐ and (D) HIF2α‐ silenced cells cultured under normoxia or hypoxia (6 h). α‐tubulin was used as a loading and positive control for a cytoplasmic fraction.
-
ERNA‐immunoprecipitation was performed on the cytoplasmic fractions collected from MiaPaCa cells exposed to hypoxia for 3 h using antibodies specific to HuR or control IgG. The immunoprecipitated RNA fragments were converted into cDNA by reverse transcription and then amplified by q‐PCR analysis using six primer sets covering ∼190 bp region of the MYB 3′ UTR (R1‐R6). Levels of 18s rRNA were used as an internal control.
Data information: Data are shown as means ± SD. The number of technical (A, E) replicates was 3. The reproducibility of the results (A, C–E) was confirmed at least three times in independent experiments. Two‐tailed unpaired Student's t‐test was used for statistical analyses. n.s. non‐significant, *P < 0.05.
Source data are available online for this figure.
MYB binds to the HIF1α promoter and transcriptionally upregulates its expression
HIF1α is a master regulator of hypoxia adaptive response, which gets rapidly stabilized under hypoxia due to the inhibition of its proteasomal degradation (Salceda & Caro, 1997). Having observed a role of MYB in hypoxic survival, we examined if it had any effect on HIF1α expression. Immunoblot analysis demonstrated that after incubation in hypoxia, high MYB‐expressing control cells accumulated greater levels of HIF1α compared with the MYB‐silenced cells or those having low endogenous MYB expression (Fig 4A). Interestingly, we also observed higher levels of HIF1α transcript in MYB‐overexpressing cells under both hypoxic and normoxic conditions (Fig 4B). A significant reduction in the transcriptional activity of the HIF1α promoter was also reported in MYB‐silenced PC cells under both normoxia (∼ 1.9 folds, MiaPaCa; ∼2.0 folds, Panc‐1) and hypoxia (∼ 3.0 folds, MiaPaCa; ∼ 2.8 folds, Panc‐1). Likewise, forced overexpression of MYB in BxPC3 enhanced the HIF1α promoter activity under both normoxia (∼2.9 folds) and hypoxia (∼ 3.5 folds) (Fig 4C). No MYB‐dependent changes in HIF1α mRNA stability were reported in either MYB‐silenced or MYB–overexpressing PC cells (Appendix Fig S2). We next examined the possibility of MYB‐mediated direct transcriptional regulation of HIF1α. In silico analysis using PROMO‐ ALGGEN (Messeguer et al, 2002) and TFBIND (Tsunoda & Takagi, 1999) identified three putative MYB binding regions upstream of the transcription start site in the HIF1α promoter (Fig 4D), of which significant enrichment of MYB was recorded in the proximal region under both normoxia and hypoxia by chromatin immunoprecipitation (ChIP) assay (Fig 4E). Together, these findings suggest that MYB transcriptionally upregulates HIF1α by directly binding to its promoter.
Figure 4. MYB regulates HIF1α expression at the transcriptional level by directly binding to its promoter.
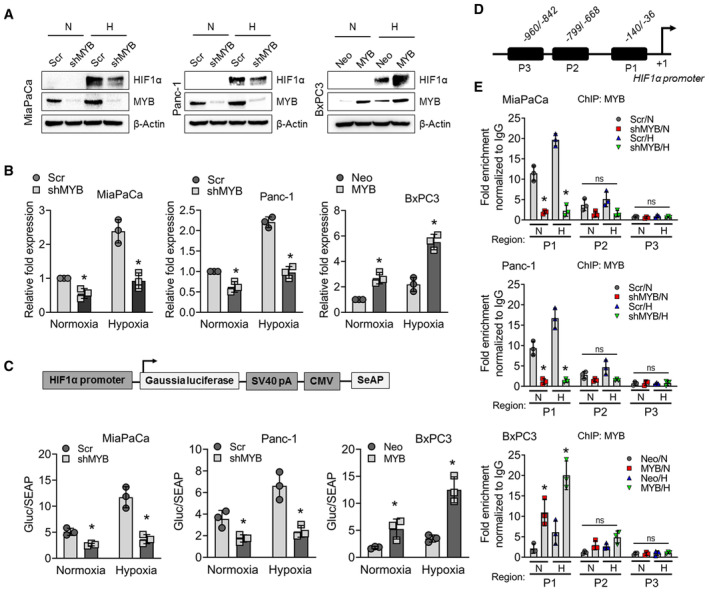
- MYB‐silenced (MiaPaCa‐shMYB and Panc1‐shMYB) and MYB‐overexpressing (BxPC3‐MYB) PC cells, along with their control cell lines (MiaPaCa‐Scr, Panc1‐Scr, and BxPC3‐Neo) were exposed to hypoxia for 6 h. Protein lysates were made, and the expression of MYB and HIF1α was examined by immunoblotting. β‐Actin served as a loading control.
- Total RNA was also isolated from MYB‐modulated pancreatic cancer cells incubated under hypoxia (6 h). Levels of HIF1α transcripts were measured by qRT‐PCR. β‐Actin served as an internal control. Bars represent relative fold change in HIF1α transcripts.
- The transcriptional activity of the HIF1α promoter was determined by performing the promoter‐reporter assay. MYB‐modulated PC cell lines were transfected with the reporter plasmid, and after 24 h of transfection, cells were cultured under hypoxia or normoxia for 24 h, and the supernatant was collected. HIF1α promoter‐driven Gaussia luciferase activity was normalized with SEAP activity, and the data were presented as a bar diagram.
- In silico analysis of the HIF1α promoter was performed to identify MYB binding sites using PROMO‐ ALGGEN and TFBIND. Three putative binding regions, P1 (−36 to −140), P2 (−668 to −799), and P3 (−842 to −960) preceding the transcription start site, were predicted.
- MYB‐silenced or ‐overexpressing PC cell lines were exposed to normoxia or hypoxia for 6 h and subjected to chromatin immunoprecipitation using anti‐MYB antibodies or IgG control followed by qPCR analysis using site‐specific primers.
Data information: Data are shown as means ± SD. The number of technical (B, C, E) replicates was 3. The reproducibility of the results (A–C, E) was confirmed at least three times in independent experiments. Two‐tailed unpaired Student's t‐test was used for statistical analyses. n.s., not significant, *P < 0.05.
Source data are available online for this figure.
HIF1α overexpression in MYB‐silenced pancreatic cancer cells fails to rescue their survival and metabolic adaptation under hypoxia
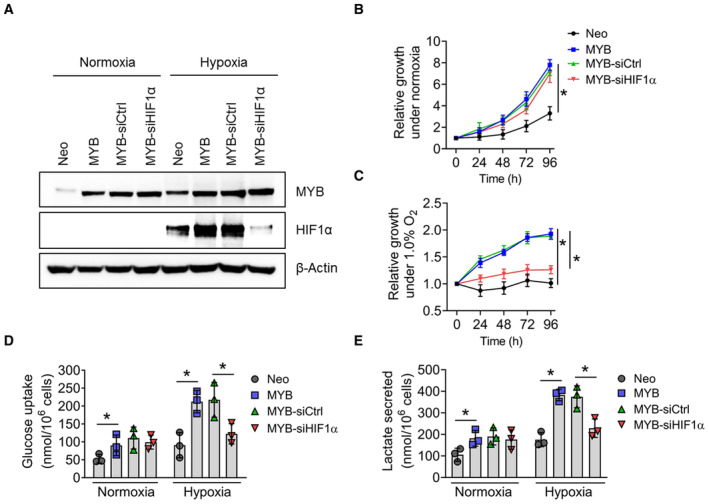
Having observed reduced HIF1α accumulation in MYB‐silenced PC cells, we next examined whether restoring HIF1α expression would rescue their growth under hypoxia. For this, we forcedly overexpressed HIF1α under the control of a constitutive CMV promoter in MYB knockdown PC cells (Fig 5A). After that, we cultured these cells under hypoxia for different time duration and examined their growth using the trypan blue dye exclusion assay. Our results show that despite restored expression of HIF1α, MYB‐silenced PC cells exhibited a ∼ 35% decrease in their growth when cultured under hypoxia for 96 h, whereas ∼ 25–30% increase was reported in both MYB and HIF1α‐expressing PC cells in that duration (Fig 5B). These observations were further confirmed by live‐dead cell staining, which showed that MYB‐silenced PC cells continued to exhibit increased proportion of dead cells under hypoxia even after restored HIF1α expression (Fig 5C). Notably, when we performed metabolic profiling of MYB‐silenced cells after exogenously restoring HIF1α expression, we still did not see a desired metabolic shift (Fig 5D and E). These findings were further confirmed by glucose uptake and lactate secretion assays (Fig 5F). Interestingly, in a converse approach, we found that HIF1α silencing in ectopic MYB‐overexpressing cells diminished their survival, glucose uptake, and lactate secretion, thus underscoring the functional significance of MYB‐HIF1α crosstalk in hypoxia adaptive responses (Fig EV4A–E).
Figure 5. Forced expression of HIF1α in MYB‐silenced pancreatic cancer cells fails to rescue their survival and metabolic shift under hypoxia.
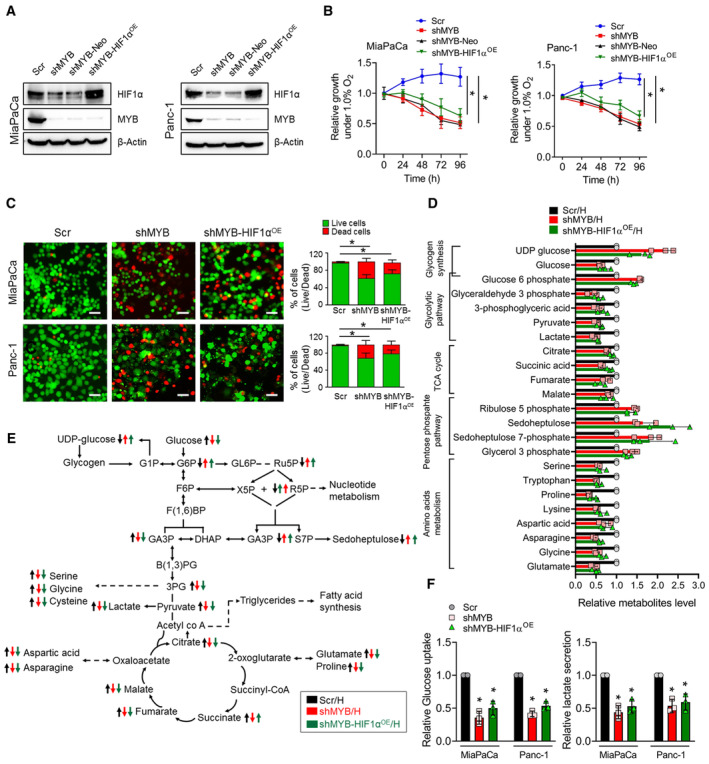
- Immunoblot analysis was performed to analyze HIF1α and MYB expression in MYB‐silenced (shMYB) and those having a forced overexpression of HIF1α (shMYB‐HIF1αOE) along with their respective controls (Scr and shMYB‐Neo) cultured under hypoxia. β‐Actin served as a loading control.
- The cell viability was determined by trypan blue exclusion method in MYB knockdown cells or with ectopic expression of HIF1α in MiaPaCa and Panc‐1 along with their control cells exposed to hypoxia at different time intervals (0–96 h).
- Live/Dead staining was performed in MYB‐silenced MiaPaCa and Panc‐1 or MYB silenced‐ HIF1α overexpressed cells cultured under hypoxia for 48 h. Cells were visualized under a fluorescence microscope. Representative fluorescence micrographs are presented. The number of live and dead cells was counted from the captured random images. Scale bar, 150 μm (lower right corner).
- Relative levels of metabolites were calculated in MiaPaCa‐Scr, ‐shMYB, and ‐HIF1α‐overexpressing shMYB cells exposed to hypoxia, and data normalized with protein concentration.
- A schematic diagram shows metabolic pathways with altered changes in metabolites in genetically engineered cell lines having a differential expression of MYB and HIF1α.
- MYB‐silenced and HIF1α overexpressing MYB knockdown PC cells and control cells were cultured under hypoxia for 48 h. Conditioned media was collected and analyzed to assess glucose consumption and lactate secretion by measuring their levels. The data were normalized with the number of cells and presented as relative fold changes.
Data information: Data are shown as means ± SD. The number of technical (B–D, F) replicates was 3. The reproducibility of the results (A‐D, F) was confirmed at least three times in independent experiments. Two‐tailed unpaired Student's t‐test (B, F) and one‐way ANOVA (C) were used for statistical analyses. *P < 0.05.
Source data are available online for this figure.
Figure EV4. Effect of HIF1α silencing on cell survival, glucose uptake, and lactate secretion in genetically‐modified BxPC3 cells cultured under normoxia and hypoxia.
-
AEctopic MYB‐overexpressing BxPC3 cells (BxPC3‐MYB) along with its control line (BxPC3‐Neo) were transfected with either non‐targeted control (siCtrl) or HIF1α‐targeted siRNAs (siHIF1α). MYB and HIF1α expression were examined by immunoblotting under both normoxia and hypoxia. β‐Actin was used as a loading control.
-
B, CThe effect of HIF1α‐silencing on cell viability was examined by Trypan blue exclusion assay in MYB‐overexpressing BxPC3 cells under (B) normoxia and (C) hypoxia at different time intervals. Data are presented as mean ± SD after ordinary one‐way ANOVA analysis to determine statistical significance between multiple groups (*P < 0.05).
-
D, EMYB‐overexpressing BxPC3 cells were cultured under normoxia or hypoxia for 48 h. Conditioned media was collected and analyzed for (D) consumed glucose and (E) lactate secretion. The data were normalized with the number of cells. Data are shown as means ± SD.
Data information: The number of technical (B–E) replicates was 3. The reproducibility of the results (A–E) was confirmed at least three times in independent experiments. Two‐tailed unpaired Student's t‐test (D, E) and One‐way ANOVA (B, C) were used for statistical analyses. *P < 0.05.
Source data are available online for this figure.
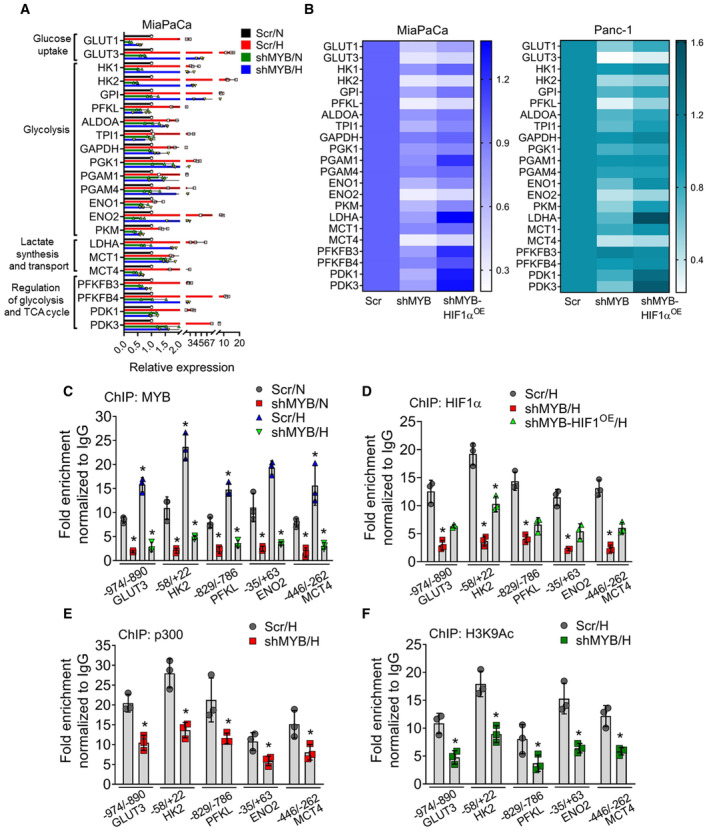
MYB regulates the expression of metabolic genes and facilitates the recruitment of HIF1α and p300 to their promoters under hypoxia
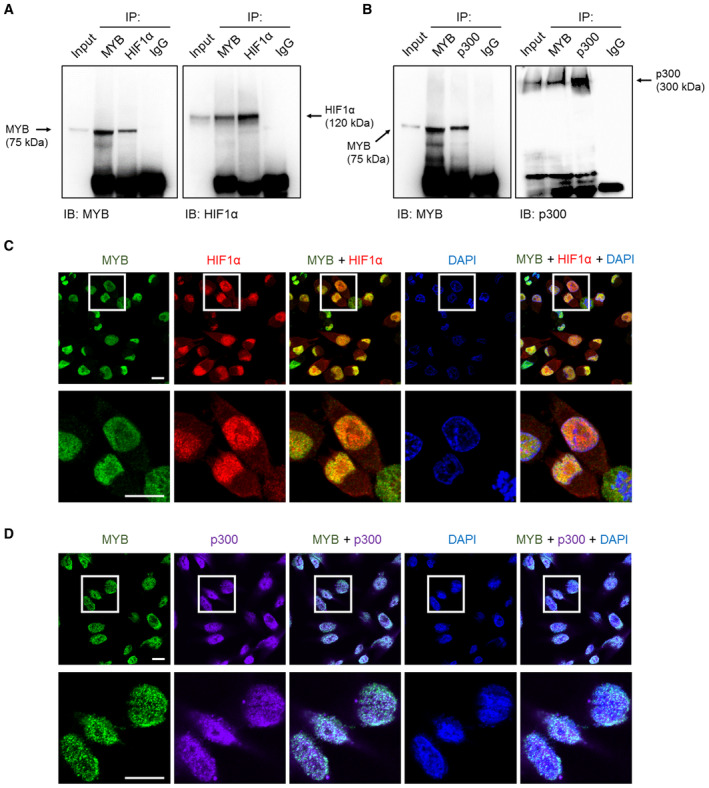
HIF1α is a crucial regulator of transcriptional reprogramming under hypoxia that helps cancer cells in the metabolic adaptation (Majmundar et al, 2010; Eales et al, 2016). Since we observed that MYB‐silenced PC cells failed to adapt metabolically under hypoxia despite exogenous HIF1α overexpression, we explored the role of MYB in transcriptional response to hypoxia. For this, we examined the expression profile of a panel of adaptive metabolism response‐associated genes in MYB‐overexpressing and knockdown PC cells under normoxia and hypoxia. The data reveal that MYB silencing affected the ability of PC cells to make adaptive changes in the expression of several genes involved in glucose transport, glycolysis, gluconeogenesis, pentose phosphate pathway, and lactate transport under hypoxia (Fig 6A). This adaptive transcriptional response was not rescued for several genes even after the restoration of HIF1α expression, even though many of them are established HIF1α targets (Fig 6B), leading us to hypothesize that MYB and HIF1α engage in cooperative gene regulation. Therefore, we performed in silico analysis and identified putative MYB binding sites in the promoter of at least five genes (GLUT3, HK2, PFKL, ENO2, and MCT4) in close vicinity of hypoxia response elements (HRE) (Appendix Fig S3A–E). ChIP analyses showed that MYB was efficiently bound to the proximal promoter regions of HK2, ENO2, and MCT4 and the distal region of GLUT3 and PFKL promoters, and MYB binding was further increased under hypoxia (Fig 6C). Subsequently, we analyzed the effect of MYB on HIF1α binding to the HRE in these gene promoters under hypoxia and found that HIF1α binding was significantly reduced in MYB‐silenced cells and only partly rescued in MYB‐silenced, HIF1α‐overexpressing cells (Fig 6D). Moreover, our data from ChIP assays demonstrated enhanced p300 binding on the promoters of metabolic genes under hypoxia and enhanced histone H3 acetylation at lysine9 (H3K9‐Ac) in MYB‐expressing cells relative to MYB‐silenced cells (Fig 6E and F). Furthermore, MYB co‐immunoprecipitated with HIF1α and its co‐activator, p300 (Fig 7A and B), and exhibited nuclear co‐localization (Fig 7C and D).
Figure 6. MYB alters the expression of a select set of metabolic genes by binding to their promoters and enhancing the recruitment of HIF1α and p300.
-
AMYB modulated PC cells (MiaPaCa Scr and shMYB) were cultured under normoxia/hypoxia for 12 h. Afterward, total RNA was isolated, and relative fold change in the mRNA expression of genes associated with glucose metabolism was examined by qRT PCR. ACTB was used as an internal control.
-
BHeat map showing the relative fold changes in glucose metabolism‐associated gene expression in Scr control, shMYB, and shMYB‐HIF1αOE MiaPaCa and Panc‐1 cells cultured under hypoxia for 12 h.
-
CQuantitative ChIP‐qPCR was performed to analyze the occupancy of MYB under normoxia and hypoxia at promoter regions of selected glycolytic genes (GLUT3, HK2, PFKL, ENO2, and MCT4) using anti‐MYB or IgG control antibodies. The enrichment of promoter regions was compared between cells cultured under normoxia or hypoxia.
-
D–FGenomic occupancy of HIF1α (D), p300 (E), and H3K9ac (F) on the promoter regions were also confirmed by ChIP‐ qPCR using specific antibodies and fold enrichment calculated and presented as a bar graph after normalization with control IgG.
Data information: Data are shown as means ± SD. The number of technical (A–F) replicates was 3. The reproducibility of the results (A–F) was confirmed at least three times in independent experiments. Two‐tailed unpaired Student's t‐test was used for statistical analyses. *P < 0.05.
Figure 7. MYB interacts with HIF1α and p300 and exhibits nuclear co‐localization.
-
A, BInteraction of MYB with HIF1α (A) and p300 (B) was examined by co‐immunoprecipitation assays in the lysates of pancreatic cancer cells cultured under hypoxia for 6 h. Immunoprecipitation with IgG isotype antibody was used as a control. 10% of total cell lysate was used as input for western blot analysis.
-
C, DCo‐localization of MYB with HIF1α (C) and p300 (D) was examined in pancreatic cancer cells grown under hypoxia for 6 h by immunofluorescence assays followed by confocal microscopy. Scale bar, 30 μm (lower left corner). Lower panels are digitally magnified views of the marked rectangles. For ease of visualization, a pseudo color (purple) was adopted for p300 staining.
Data information: Reproducibility of the results (A–D) was confirmed at least three times in independent experiments.
Source data are available online for this figure.
MYB knockout pancreatic cancer cells exhibit reduced tumorigenicity, glucose uptake, and lactate synthesis in vivo despite restored HIF1α expression
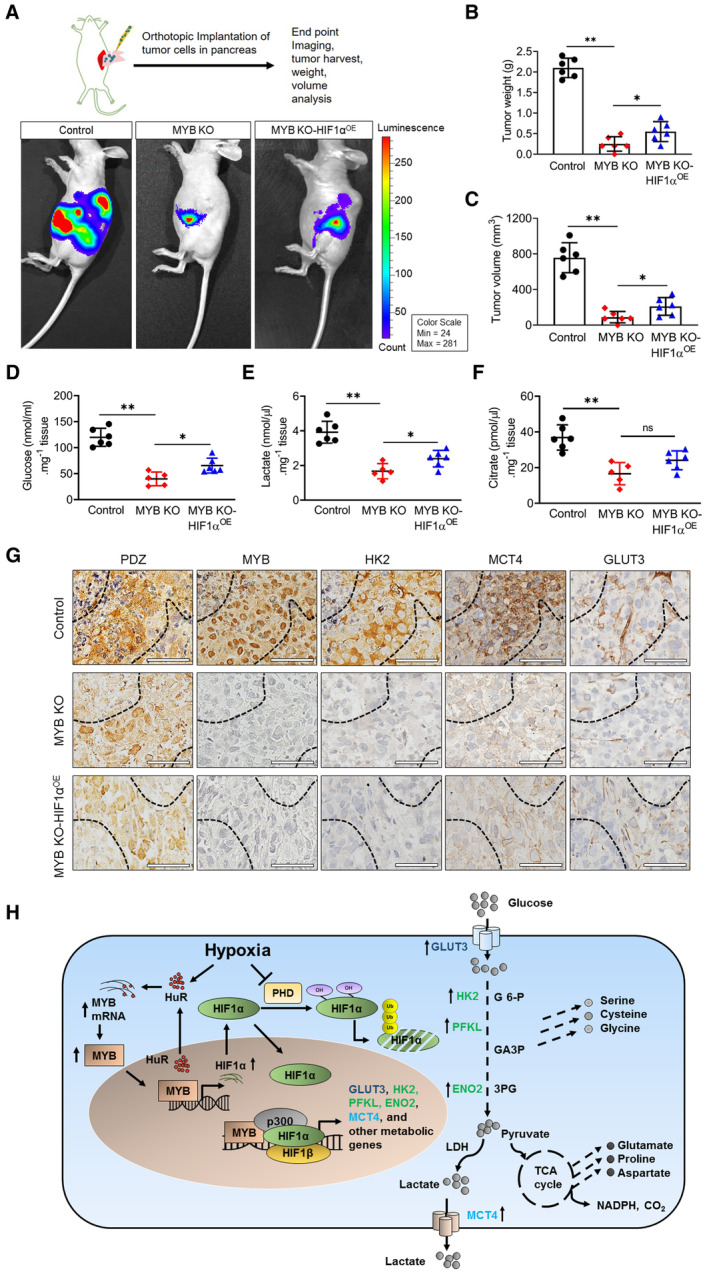
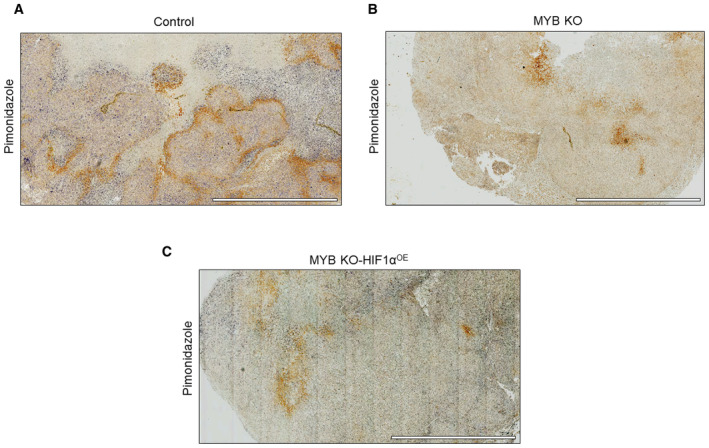
Next, we sought to determine the significance of our observations in an orthotopic mouse model. We first generated the MYB knockout (MYB KO) MiaPaCa cell line using CRISPR‐Cas9 technology (Appendix Fig S4A and B) to avoid any artifact emerging from the clonal selection in the long‐term animal study. After that, HIF1α was stably overexpressed in MYB KO cells (Appendix Fig S4C). The luciferase‐tagged control, MYB KO and MYB KO‐ HIF1αOE cells were injected into the mouse pancreas, and growth was monitored weekly by in vivo imaging (Fig 8A). Mice were sacrificed after 5 weeks, and data were recorded for tumor size and weight. The data show that MYB KO cells had drastically reduced tumor growth, which could not be rescued after ectopic HIF1α overexpression (Fig 8B and C). Further, analysis of tumor xenografts showed reduced levels of glucose (Fig 8D), lactate (Fig 8E), and citrate (Fig 8F) in both MYB KO and MYB KO‐HIF1αOE cells. Pimonidazole (PDZ) adduct staining demonstrated more number of hypoxic foci in control tumor xenografts, compared with MYB KO and MYB KO‐HIF1αOE xenografts (Fig EV5A–C). Furthermore, examination of serial sections stained for MYB, MCT4, GLUT3, and HK2 within the PDZ‐positive areas showed their decreased expression in MYB KO and MYB KO‐HIF1αOE tumors, compared with the control group (Fig 8G). Altogether, our findings demonstrate in vivo significance of MYB in pancreatic tumorigenicity and metabolic reprogramming.
Figure 8. Tumorigenicity of MYB‐silenced PC cells remains significantly reduced despite restored HIF1α expression.
-
ALuciferase tagged‐MiaPaCa control, MYB knockout, or HIF1α overexpressed MYB knockout cells were implanted into the tail of the pancreas of athymic nude mice (n = 6 per group).
-
B, CTumor growth was monitored by non‐invasive bioluminescence imaging. Tumors were resected at the experimental endpoint, and their weights (B) and volumes (C) were recorded.
-
D–FThe levels of glucose (D), lactate (E), and citrate (F) were also analyzed in the tumor tissues and normalized with the tissue weight used for metabolite extraction.
-
GTumor xenograft serial sections were immunostained for pimonidazole (PDZ) adduct, MYB, HK2, GLUT3, and MCT4 using specific antibodies. Images were taken at 40× magnification. Scale bar, 60 μm (lower left corner). The dashed lines demarcate the hypoxic region based on the PDZ staining pattern.
-
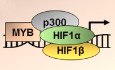
HSchematic figure showing MYB expression is induced under hypoxia via HuR, which then transcriptionally upregulates HIF1α leading to its more significant accumulation under hypoxia. Further, MYB interacts with HIF1α and p300 and enhances their recruitment to glycolytic gene promoters. Transcriptional upregulation of glycolytic genes via coordinated action of MYB, HIF1α, and p300 helps in the metabolic adaptation of cancer cells to sustain their growth and survival.
Data information: Data are shown as means ± SD (n = 6). The number of technical (D–F) replicates was 3. A one‐way ANOVA test was used for statistical analyses. *P < 0.05, **P < 0.01.
Figure EV5. Assessment of hypoxic regions in resected pancreatic tumor xenograft tissues from mice.
-
A–CThe extent of hypoxia was determined by pimonidazole (PDZ) staining of pancreatic tumor xenografts generated from (A) MiaPaCa control, (B) MYB knockout, and (C) HIF1α‐overexpressing MYB knockout cells in mice. Scale bar, 2 mm (lower left corner).
Discussion
Pancreatic cancer (PC) is characterized by poor tumor vasculature and high desmoplasia, making it one of the most hypoxic malignancies. Yet pancreatic tumor cells not only acclimatize to such a harsh hypoxic microenvironment but also exhibit relentless, aggressive progression due to their evolved adaptive properties. The current study identified MYB as an essential mediator of the hypoxic survival and hypoxia‐induced metabolic adaptation of PC cells. We observed that MYB expression increased under hypoxia via HuR‐mediated stabilization of its mRNA. Further, MYB transcriptionally upregulated HIF1α by binding to its promoter and acted in cooperation to regulate the expression of metabolic genes. We also observed that in the absence of MYB, HIF1α was not able to confer hypoxic cell survival as it failed to sufficiently cause desired alterations in metabolic gene regulation and cellular metabolism. We found that MYB bound to the promoters of several critical metabolic genes and facilitated HIF1α recruitment by causing histone modifications. Consequently, a significant reduction in the tumorigenicity of pancreatic cancer cells was also observed that could not be regained even after forced overexpression of HIF1α. These findings add a new mechanistic dimension to our previous observations suggesting a role of MYB in the pancreatic tumor pathobiology (Srivastava et al, 2015; Azim et al, 2016; Bhardwaj et al, 2016; Zubair et al, 2020).
The hypoxic microenvironment profoundly impacts the molecular and biological properties of cancer cells (Choudhry & Harris, 2018; Petrova et al, 2018; Lee et al, 2020). These changes are predominantly mediated through HIF1α, which mediates the adaptive changes in the gene expression (Dengler et al, 2014; Wang et al, 2021). However, in our findings, we did not see an effect of HIF1α silencing or accumulation on MYB expression. Instead, we identified that MYB was regulated post‐transcriptionally via HuR, resulting from its enhanced cytoplasmic accumulation and enhanced binding to 3′UTR of MYB transcript under hypoxia. HuR has previously been shown to exhibit cytoplasmic translocation under hypoxic conditions and post‐transcriptionally regulate the expression of other genes (Blanco et al, 2016; Reglero et al, 2020). In other reports, post‐transcriptional regulation of MYB via miRNA or other mechanisms has been demonstrated (Gudas et al, 1995; Xiao et al, 2007; Navarro et al, 2009; Mets et al, 2015; Elcheva et al, 2020). However, our findings are the first to show hypoxia‐induced MYB upregulation involving a HuR‐mediated mechanism. Overexpression of HuR has been reported in pancreatic and other gastrointestinal cancers and is associated with aggressive tumor phenotypes and chemoresistance (Mrena et al, 2005; Costantino et al, 2009). In that context, our findings identify a novel HuR‐MYB axis that supports the hypoxia survival of pancreatic cancer cells.
Post‐translational ubiquitination following oxygen‐dependent hydroxylation on proline residues (P402 and P564) by prolyl hydroxylases (PHDs) is considered a significant mechanism for HIF1α regulation. Under hypoxia, the activity of PHDs is inhibited due to decreased oxidation preventing ubiquitin‐mediated HIF1α proteasomal degradation (Salceda & Caro, 1997; Semenza, 2013; Choudhry & Harris, 2018). However, some reports indicate HIF1α regulation by oxygen‐independent mechanisms. It is shown that other post‐translational mechanisms, such as methylation and acetylation, can enhance HIF1α stability primarily in the nucleus, independent of proline hydroxylation, under both normoxic and hypoxic conditions (Kim et al, 2016). On the contrary, a hypoxia‐inducible miRNA, miR‐429, is shown to cause post‐transcriptional repression of HIF1α, while in other reports, NF‐κB is shown to act as its transcriptional regulator (Arora et al, 2013; Azoitei et al, 2016). Thus, our findings demonstrating transcriptional regulation of HIF1α by MYB under both normoxia and hypoxia suggest another novel mode of HIF‐1α regulation in pancreatic cancer.
Cancer cells undergo metabolic reprogramming to support their survival and proliferation under a hypoxic environment. These changes include a shift from mitochondrial oxidative phosphorylation to cytoplasmic glycolysis because of decreased oxygen availability, and HIF1α is suggested to be a primary driver of these metabolic alterations (Denko, 2008; Semenza, 2013; Eales et al, 2016). However, in our study, MYB‐silenced pancreatic cancer cells failed to survive and exhibit the desired change in cellular metabolism despite forced overexpression of HIF1α. Indeed, we found that the knockdown of MYB greatly affected the glucose and amino acid metabolism in pancreatic cancer cells, even under well‐oxygenated conditions. A significant decrease was recorded in intracellular glucose, pyruvate, and glycolytic and TCA cycle intermediates under both normoxia and hypoxia in MYB knockdown cells. Interestingly, we observed increased levels of UDP‐glucose and glucose 6‐phosphate in MYB knockdown cells, which is indicative of the conversion of glucose to glycogen. It is shown that glycogen content in the cells inversely correlates with the proliferation rate (Rousset et al, 1981). Further, hypoxia induces an early glycogen accumulation followed by a gradual decline as cells adapt and regain their proliferation (Favaro et al, 2012). Thus, the continued shift towards glycogen synthesis in MYB knockdown cells may suggest their impaired ability to adapt under hypoxia. Moreover, increased levels of pentose phosphate pathway intermediates in MYB knockdown cells could indicate a metabolic shift due to the underutilization of glucose 6‐phosphate via glycolytic and TCA cycle pathways (Jiang et al, 2014). Besides glucose metabolism, we observed a noticeable decrease in the accumulation of several amino acids in MYB knockdown cells, exhibiting further reduction under hypoxia. This could be due to their reduced uptake or decreased availability of glycolytic and TCA cycle intermediates, limiting their shunting into the amino acid biosynthetic pathways (Jochmanova & Pacak, 2016; Xu et al, 2020).
Since MYB‐silenced pancreatic cancer cells failed to adapt metabolically despite the restored expression of HIF1α, we examined its effect on the hypoxia‐induced transcriptional response on crucial metabolic genes. The data revealed that MYB downregulation affected the ability of pancreatic cancer cells to upregulate the expression of several genes, including those involved in glucose uptake (GLUT3), glycolysis (HK2, PFKL, and ENO2), and lactate transport (MCT4). Furthermore, we confirmed that MYB physically bound and occupied the promoter region of these genes, and its binding increased under hypoxia. We also observed that MYB enhanced the recruitment of HIF1α and histone acetyltransferase p300 to the promoter of these genes and increased the H3K9 acetylation and HIF1α transcriptional activity. Thus, our findings suggest that MYB modulates hypoxia signaling by not only regulating the levels of HIF1α but also supporting its interaction with its target gene promoters. It is reported that p300 acts as a coactivator for both MYB and HIF1α and enhances their transcriptional activity through the chromatin modification (Arany et al, 1996; Kasper et al, 2002; Liu et al, 2015; Fuglerud et al, 2018). By co‐immunoprecipitation and confocal microscopy, we confirmed the interaction of MYB with both HIF1α and p300, indicating their presence in a transcriptional complex that facilitates hypoxia‐induced transcriptional reprogramming. A large body of evidence suggests MYB and HIF1α interaction with other transcription factors (Pawlus et al, 2014; Srivastava et al, 2021). Indeed, a recent genome‐wide ChIP‐seq analysis of human acute myeloid leukemia cells has identified MYB binding sites in the vicinity of HIF1α bound regions in gene promoters, along with other transcription factors suggestive of their cooperative action in the gene regulation (Wierenga et al, 2019).
In summary, our findings support a crucial role of MYB in the hypoxic survival of pancreatic cancer cells (Fig 8H). We identify MYB as a novel transcriptional regulator of HIF1α expression and present evidence for a novel mechanistic relationship between these two proteins. We show that MYB interacts with HIF1α and p300 and enhances their occupancy on glycolytic gene promoters through chromatin modification. An impact of MYB on cellular metabolism regardless of oxygen availability is suggestive of its both HIF1α‐dependent and –independent functions. It appears that MYB is essential for the metabolic plasticity of the cancer cell and helps it adapt to the constantly changing surrounding environment.
Materials and Methods
Cell lines, transfection, and treatment
Human pancreatic cancer (PC) cell lines, MiaPaCa (high MYB‐expressing), Panc1 (high MYB‐expressing), and BxPC3 (low MYB‐expressing), were used in this study. Their stable knockdown (MiaPaCa‐shMYB and Panc‐1‐shMYB) and forced overexpressing (BxPC3‐MYB) derivative lines along with corresponding control cell lines (MiaPaCa‐Scr, Panc‐1 Scr, and BxPC3‐Neo) were generated previously (Srivastava et al, 2015). For transient transfection of HIF1α and HuR siRNAs, cells at 50–70% confluence were treated with 100 nM of non‐targeting siGENOME™ control pool (siControl, #D‐001206‐13‐05) or ON‐TARGETplus SMARTPool siRNAs against HIF1α (siHIF‐1α, #L‐004018‐00‐0005) or HIF2α (siHIF2α, #L‐004814‐00‐0005) or HuR (siHuR, #L‐003773‐00‐0005) (Dharmacon™) using XtremeGene™ siRNA Transfection Reagent (Roche, Indianapolis, IN) as per manufacturer's instructions. To achieve stable forced expression of HIF1α in MiaPaCa‐shMYB and Panc1‐shMYB cells, we transfected them with the pcDNA3‐HIF1α construct (#18949, Addgene) using X‐tremeGENE™ HP DNA Transfection Reagent (Roche). Control cells were generated by stable transfection with a pcDNA3‐Neo plasmid (#10792, Addgene). The transfected cells were selected in media containing G418/Neomycin (200 μg/ml). MiaPaCa and BxPC3 cells were maintained in RPMI media (Corning, Glendale, AZ), whereas Panc‐1 cells were grown in DMEM media (Corning). Both media were supplemented with 10% fetal bovine serum (Atlanta Biologicals, Lawrenceville, GA, USA) and 100 U/ml penicillin/streptomycin (Sigma‐Aldrich). All cell lines were routinely tested for Mycoplasma and authenticated using short tandem repeats genotyping or expression of marker proteins. For hypoxia treatment, cells (2 × 10⁵) were seeded in 60 mm culture dishes, allowed to grow for 24 h, and then subjected to 1.0% O2 in a hypoxia chamber equipped with an oxygen controller (BioSpherix, Parish, NY) for 0–96 h. For creating hypoxia mimetic condition under normoxia, PC cells were treated with prolyl hydroxylase inhibitors, cobalt chloride (CoCl2, 100 μM) or dimethyloxaloylglycine (DMOG, 1 mM) for 6 h. These treatments lead to hypoxia‐independent stabilization of HIF1α and thus are useful in monitoring HIF1α‐dependent gene regulatory and phenotypic responses. However, a limitation of these treatments besides toxicity concerns is that we cannot determine HIF1α‐independent effects of hypoxia (Byrne et al, 2014).
RNA extraction and quantitative real‐time PCR
Total RNA from cells was extracted using TRIzol reagent (Invitrogen, Carlsbad, CA, USA) and quantified using Nanodrop 1000 (Thermo Scientific). cDNA was synthesized using two μg of total RNA and a High‐Capacity Complementary DNA Reverse Transcription Kit (Thermo Scientific) following the manufacturer's instructions. q‐RT PCR was performed using Maxima SYBR Green/ROX qPCR Master Mix kit (Thermo Scientific) on the CFX96™ real‐time system (Bio‐Rad, Hercules, CA, USA) using gene‐specific primer pair sets (Appendix Table S2).
Measurement of mRNA stability and RNA‐IP assay
The stability of mRNA was measured as previously described (Zhang et al, 2021). In brief, cells were grown to 60–80% confluence in 60 mm dishes and treated with 10 μg/ml Actinomycin D (Sigma) 1 h before incubation under normoxia or hypoxia (1.0% O2). Total RNA was isolated at various time intervals and analyzed for HIF1α mRNA levels using quantitative RT‐PCR. RNA immunoprecipitation was performed using an RNA ChIP‐IT kit (#53024, Active Motif) following the manufacturer's instructions with slight modifications. Briefly, PC cells (5 × 10⁶/150‐mm dish) were cultured and treated under hypoxia or normoxia for 6 h, and the RNA‐protein complex was cross‐linked using 1.0% formaldehyde. Cells were then lysed and fractionated into cytoplasmic and nuclei fractions. Cytoplasmic fractions were sonicated (10 cycles of 20 s on/off, 20% amplitude) followed by DNase I treatment and afterward subjected to immunoprecipitation using protein G magnetic beads with either anti‐HuR or control anti‐IgG antibodies. After overnight incubation at 4°C, beads were washed sequentially, eluted, and reverse cross‐linked at 65°C for 2 h after proteinase K treatment. The RNA was extracted using the Trizol method, and RT‐PCR was performed using sets of primers specific for the 3′UTR region of MYB (Appendix Table S3).
Chromatin‐immunoprecipitation (ChIP) assay
The binding of MYB and HIF1α to their target gene promoters was analyzed by performing a ChIP assay as described earlier (Arora et al, 2013). Briefly, cells (5 × 10⁶) were cultured in 150 mm dishes to 60–70% confluence and subjected to hypoxia treatment for 6 h. After that, cells were incubated with 1.0% formaldehyde (Sigma) for 10 min to cross‐link cellular DNA and proteins, then scraped in an ice‐cold cell scraping solution supplemented with protease inhibitors. DNA was enzymatically sheared using ChIP‐IT Express Enzymatic Kit (Active Motif, CA, USA) and immunoprecipitated using protein G magnetic beads with anti‐MYB or anti‐HIF1α or normal rabbit IgG (control) antibodies by overnight incubation. Magnetic beads were washed, cross‐linking reversed in reverse cross‐linking buffer, followed by protein digestion using proteinase K and DNA isolation. The purified ChIPed DNA was amplified by PCR using promoter sequence‐specific primer sets (Appendix Table S4).
Measurement of cell viability
Cells were trypsinized, stained with 0.4% Trypan Blue (Thermo Fisher Scientific), and counted on Countess Automated Cell Counter (Life Technologies) as described earlier (Patton et al, 2020). For direct measurement of live‐dead cells, cells were cultured in FluoroDish (#FD35‐100, World Precision Instruments, Inc., Sarasota, FL, USA), subjected to hypoxia for 48 h, and then incubated with PBS containing 2 μM Calcein AM (Invitrogen) and 4 μM EthD‐1 (Invitrogen) dyes for 15 min. After washing with PBS, cells were observed under the fluorescence microscope (Nikon, Lewisville, TX, USA). The dead cells were detected by bright red fluorescence, and live cells were identified by green fluorescence and counted using Image J software as described earlier (Khan et al, 2020). The measurement of apoptosis was performed using PE Annexin V Apoptosis Detection Kit (BD Biosciences, San Diego, CA, USA), followed by flow cytometry as described previously (Arora et al, 2011). Briefly, 5 × 10⁵ cells were cultured in 60 mm dishes and allowed to grow under normoxia and hypoxia for 48 h; thereafter, cells were harvested and stained with PE Annexin V and 7‐AAD for 15 min followed by FACS analysis.
Protein extraction and immunoblot analysis
Total protein was extracted from cells in Pierce™ RIPA Buffer (Thermo Scientific) supplemented with Halt™ Single‐Use Cocktail (100×) of protease and phosphatase inhibitors (Thermo Scientific). Cytoplasmic and nuclear protein fractions were isolated using NE‐PER™ Nuclear and Cytoplasmic Extraction Reagents (Thermo Fisher Scientific, Logan, UT, USA). Protein concentration was estimated using a protein assay kit (Bio‐Rad). Following quantification, 60–80 μg protein (unless specified) was resolved on SDS‐PAGE, blotted on PVDF membrane (0.45 μm) (Thermo Scientific), and protein signals were detected using SuperSignal West Femto Maximum sensitivity substrate kit (Thermo Scientific). Protein bands were visualized and photographed using a ChemiDoc XRS+ system (Bio‐Rad Laboratories, Inc., California, USA).
Luciferase promoter‐reporter assay
Cells were grown to 50–60% confluence in 6‐well plates and transfected with 500 ng of either GLuc‐ON™ HIF1α promoter‐reporter plasmid (HPRM39172‐PG04, GeneCopoeia, MD, USA) or MYB promoter‐reporter luciferase plasmid (HPRM34981‐PG02, GeneCopoeia) and Secreted alkaline phosphatase (SEAP) Expression plasmid (SEAP‐PA01) or pGL3‐MYB‐3′UTR (#25798, Addgene) (Navarro et al, 2009). After 24 h, media was replaced, and cells were exposed to hypoxia (1.0% O2) for 12 h or cultured under normoxic conditions. The conditioned media was collected to measure secretory Gaussia luciferase (GLuc) and Alkaline Phosphatase (SEAP) activities using Secrete‐Pair™ Dual Luminescence Assay Kit (GeneCopoeia, MD, USA) following the manufacturer's protocol. Gaussia luciferase activity was normalized with SEAP activity to control for transfection efficiency.
Lactate secretion and glucose uptake assay
Cells (1 × 10⁵) were seeded in 6‐well plates and grown to 50–60% confluence. After that, the media was replaced, and cells were incubated under hypoxia for 48 h. The conditioned media (CM) was collected and stored at −80°C until further use. The lactate and glucose concentrations in the CM were measured using commercial Lactate (K607‐100) and Glucose (K686‐100) assay kits (BioVision, CA, USA) following the manufacturer's instructions.
Measurement of extracellular acidification rate and oxygen consumption rate
The basal rates of glycolysis and oxidative phosphorylation were evaluated using the Glycolysis Stress Test kit (# 103020‐100, Seahorse Bioscience) and Mito Stress Test kit (#103015‐100, Seahorse Bioscience), respectively, on XFe96 Extracellular Flux Analyzer (Seahorse Biosciences). Briefly, cells (10 × 103) were seeded in 96‐well XFe96 cell culture plates and allowed to grow for 24 h followed by treatment with CoCl2 (100 μM) for 16 h. For extracellular acidification rate (ECAR), cells were incubated with fresh media containing glutamine (2 mM) but without serum, glucose, or bicarbonate and incubated in a non‐CO2 incubator for 1 h. At the time of measurement, glucose (10 mM), oligomycin (1 μM), and 2‐deoxy‐D‐glucose (50 mM) were diluted in RPMI media and sequentially loaded into the injection ports of the flux analyzer. For oxygen consumption rate (OCR) determination, cells were incubated with serum‐free fresh media containing glutamine (2 mM), glucose (10 mM), and pyruvate (1 mM) for 1 h at 37°C in a non‐CO2 incubator. pH or oxygen‐sensitive probes equipped cartridges were pre‐incubated with calibration solution overnight in an incubator without CO2. Time‐course analysis of OCR was done before and after injection of ATP synthase complex inhibitor, oligomycin (1 μM), ATP synthesis uncoupler, Carbonyl cyanide‐p‐trifluoromethoxyphenylhydrazone (FCCP, 0.5 μM), and a mixture of complex I inhibitor, rotenone, and complex III inhibitor, antimycin A (0.5 μM) diluted in RPMI and sequentially loaded into injection ports. Three baseline measurements of OCR or ECAR were taken before sequential injection of the reagents or mitochondrial inhibitors. Each assay was run in one plate with 3–4 replicates and repeated at least thrice. Data were normalized with cell numbers counted in each well using Celigo Image Cytometer (Nexcelom Bioscience LLC, Lawrence, MA, USA).
Extraction of metabolites and quantification by mass spectrometry
Cells (4 × 10⁶) were cultured in 150 mm dishes and incubated under hypoxia for 48 h at subconfluence. Metabolites were extracted as described earlier with slight modifications (Tadi et al, 2013; Gunda et al, 2018). In brief, media was aspirated, and cells were rinsed with MS grade water (ThermoFisher Scientific), followed by the addition of ice‐cold 80% methanol and 10 min incubation at −80°C. After that, cells were scraped and further incubated at −80°C for 10 min, followed by thorough vortexing and centrifugation at 3,000 g for 10 min at 4°C. The supernatant was collected and lyophilized using a freeze drier until further assay. Lyophilized extracts of metabolites were reconstituted in 10 mM ammonium acetate and injected in Agilent Zorbax 300SB (C18, 2.1 × 150 mm) Column on Agilent 1200 series LC. Initially, the flow rate used for LC separation was 50 μl/min for 20 min, which was further ramped to 150 μl/min until the completion of the run. A gradient of eluent (Eluent A – 10 mM ammonium acetate in 0.1% formic acid and Eluent B – 0.1% formic acid in methanol) was used to separate metabolites. The gradient condition was as follows: 2% eluent B for 20 min, followed by 95% eluent B for 5 min, and 2% eluent B for 15 min. The LC eluent was subjected to a Thermo Qe Orbitrap Mass spectrometer (Thermo Scientific, San Jose, CA, USA) equipped with electrospray ionization. The electrospray ionization spray voltage was 3.5 kV, vaporizer temperature was 300°C, sheath gas N2 pressure was 20 (arbitrary unit), auxiliary gas pressure was 4 (arbitrary units), and ion sweep gas pressure was 1. The metabolites spectrum data were acquired in negative ionization in SIM mode and processed using Xcalibur software (Thermo Fisher Scientific).
Co‐immunoprecipitation
Cells lysates (150 μg, pre‐cleared with protein A agarose beads) were incubated with anti‐MYB, anti‐HIF1α, anti‐p300, or control anti‐IgG antibodies (1 μg each) overnight at 4°C followed by incubation with Protein A agarose beads (Thermo Scientific) for 3 h at 4°C. The immunoprecipitated complex was centrifuged and washed with NP‐40 lysis buffer. Samples were eluted using elution buffer (primary amine, pH 2.8), mixed with 6× sample loading buffer containing 1 M Tris, and subjected to immunoblotting using anti‐MYB, ‐HIF1α, and ‐p300 antibodies.
Confocal microscopy
Cells (2.5 × 10⁴) were cultured in FluoroDish (#FD35‐100, World Precision Instruments, Inc., Sarasota, FL, USA) for 48 h, followed by incubation under hypoxia for 6 h. After that, cells were washed with 1× PBS, fixed in 4% paraformaldehyde for 10 min, and incubated with 5% BSA for 60 min for blocking. Cells were then incubated with anti‐MYB (#12319S) rabbit monoclonal, anti‐HIF1α (#79233S) mouse monoclonal, anti‐HuR (#12582) rabbit monoclonal (Cell Signaling Technology, Danvers, MA, USA), and anti‐p300 (#AF3789) goat polyclonal antibodies (R&D system, Minneapolis, MN, USA) at 1:100 dilution for overnight at 4°C. After that, cells were washed with 1× PBS and incubated with secondary antibodies [Alexa Fluor™ 568 (#A11004, anti‐mouse, Invitrogen, Carlsbad, CA, USA), Alexa Fluor® 647 (#A21447, anti‐goat), and Alexa Fluor 488 (#A11008, anti‐rabbit)] (Thermo Scientific, Rockford, IL, USA) for 60 min. Following washing with 1× PBS, cells were mounted with an anti‐fade Vectashield mounting medium (Vector Laboratories, Burlingame, CA, USA) and imaged using a Nikon TE2000‐E Automated Widefield Microscope equipped with a CoolSnap HQ CCD camera (Nikon Instruments Inc., Melville, NY, USA).
Generation of CRISPR/Cas9 knockout cell lines
Alt‐R CRISPR‐Cas9 gene‐editing system from IDT (Integrated DNA Technologies, Coralville, Iowa, USA) was used to generate MYB knockout pancreatic cancer cells. To prepare sgRNA, two pre‐designed Alt‐R CRISPR‐Cas9 crRNA for MYB, Hs. Cas9.MYB.1.AA (MYB exon 6, positive strand, AGG PAM site, sequence: GAATTCTACAATGCGTCGGA) and Hs. Cas9.MYB.1.AB (MYB exon 2, positive strand, TGG PAM site sequence: CAAGTCTGGAAAGCGTCACT) were mixed in an equimolar ratio with Alt‐R® CRISPR‐Cas9 tracrRNA, ATTO™ 550 (#1075928, IDT). After heating at 95°C for 5 min, the reaction mixture was allowed to cool at RT for 1 h, and the Cas9RNP complex was formed by adding sgRNA and purified Cas9 Nuclease V3 enzyme (#1081058) at 1 μM working concentration and incubated for 15 min at 37°C. After that, the transfection complex was prepared by mixing the Cas9RNP complex with Lipofectamine® CRISPRMAX transfection reagent (#CMAX00003, Invitrogen) following the instruction manual and mixed with the cells (3 × 10⁵) in 12‐well plates. Cells were allowed to grow for 48 h, followed by single‐cell sorting into a 96‐well plate based on ATTO™ 550 fluorescence. Positive clones were verified using PCR amplification and Western blotting.
Animal studies
Animal studies were performed after obtaining the necessary approval from the Institutional Animal Care and Use Committee (IACUC). Athymic nude mice (4–6 weeks old) were purchased (Harlan Laboratories, Prattville, AL) and randomly allocated (n = 6 in each group) to three experimental groups (MiaPaCa control; MiaPaCa‐ MYB KO; and MiaPaCa‐ MYB KO‐ HIF1αOE). After an acclimatization period of 1 week, luciferase‐tagged cells (1.0 × 10⁶) were injected into the tail of the pancreas of mice as described previously (Srivastava et al, 2015). All mice were kept in a sterile and comfortable environment and provided food and water ad libitum. Mice were monitored daily by the investigating team and the vivarium staff for any signs of pain and distress. An unblinded, non‐invasive bioluminescence imaging of mice was performed to observe tumor growth using Xenogen‐IVIS‐cooled CCD optical system (IVIS Spectrum) after i.p. injection of D‐luciferin (150 mg/kg body weight). Hypoxic cell marker, pimonidazole hydrochloride (Hypoxyprobe, Burlington, MA, USA), was injected intraperitoneally into the mice (60 mg/kg body weight) 2 h before sacrificing the animals as described earlier (Guillaumond et al, 2013; Conway et al, 2018). All mice were sacrificed after 5 weeks of tumor cell injection, and tumors were resected, weighed, and their volumes measured using the following formula: (A × B2)/2, where A is the larger and B is the smaller of the two dimensions. Levels of glucose, lactate, and citrate metabolites were measured in tumor xenograft tissues using commercial assay kits (#ab169559, #ab65331, and #ab83396) (Abcam, Cambridge, MA, USA). In brief, tissue (∼10 mg) was lysed in 500 μl assay buffer using Dounce homogenizer (15–20 strokes) on ice, followed by centrifugation (5 min) at 13,400 g. The supernatant was collected, and glucose, lactate, and citrate metabolites were measured following the manufacturer's protocol.
Immunohistochemistry
The pancreatic tumor xenografts were excised and processed for immunohistochemistry as described previously (Khan et al, 2020). Briefly, tumor tissues were fixed in formalin, embedded in paraffin, and cut into 5‐μm thick sections. After deparaffinization, rehydration, and antigen retrieval, endogenous peroxidase activity was blocked by incubating the sections in Peroxidazed 1 (#PX968MM; Biocare Medical), followed by blocking in background sniper (#BS966L; Biocare Medical). Tumor sections were then incubated with primary antibodies specific to GLUT3 (anti‐rabbit # ab41525), HK2 (anti‐rabbit, # ab209847), and MCT4 (anti‐mouse, #sc‐376140), and pimonidazole adducts (anti‐rabbit # HP PAb27) followed by washing and incubation with HRP‐labeled secondary antibodies (anti‐rabbit #M3R531 and anti‐mouse; #M3M530; Biocare Medical). The brown color was developed after adding 3, 3′ diaminobenzidine (DAB) substrate (BDB2004L; Biocare Medical). Immunostained sections were scanned, and images were captured using Aperio Scanscope (Leica Biosystems, CA, USA).
Statistical analysis
All the experiments were performed at least three times, and data were analyzed in Excel (Microsoft) or Prism 8.1 (GraphPad) spreadsheets and expressed as mean ± SD. A Student's t‐test was performed to compare two groups, and one‐way ANOVA was used for multiple comparisons. P < 0.05 was considered statistically significant.
Author contributions
Shashi Anand: Conceptualization; formal analysis; investigation; visualization; methodology; writing – original draft; writing – review and editing. Mohammad Aslam Khan: Conceptualization; formal analysis; validation; investigation; visualization; methodology; writing – original draft; writing – review and editing. Haseeb Zubair: Conceptualization; formal analysis; investigation; visualization; methodology; writing – review and editing. Sarabjeet Kour Sudan: Formal analysis; investigation; visualization; writing – review and editing. Kunwar Somesh Vikramdeo: Formal analysis; validation; investigation; writing – review and editing. Sachin Kumar Deshmukh: Investigation; writing – review and editing. Shafquat Azim: Formal analysis; validation; writing – review and editing. Sanjeev Kumar Srivastava: Investigation; writing – review and editing. Seema Singh: Writing – review and editing. Ajay Pratap Singh: Conceptualization; resources; formal analysis; supervision; funding acquisition; project administration; writing – review and editing.
Disclosure and competing interests statement
The authors declare that they have no conflict of interest.
Supporting information
Appendix
Expanded View Figures PDF
Source Data for Expanded View and Appendix
PDF+
Source Data for Figure 2
Source Data for Figure 3
Source Data for Figure 4
Source Data for Figure 5
Source Data for Figure 7
Acknowledgements
We acknowledge the support of Mass Spectrometry, USA Health Biobank Histology, Flow Cytometry, and Bioimaging core facilities of the University of South Alabama. Schematic summary figure was created with BioRender.com. This work was supported, in part, by a grant (R01CA224306 to APS) from the National Cancer Institute (NCI/NIH).
EMBO reports (2023) 24: e55643
Data availability
Our study includes no data deposited in external repositories.
References
- Arany Z, Huang LE, Eckner R, Bhattacharya S, Jiang C, Goldberg MA, Bunn HF, Livingston DM (1996) An essential role for p300/CBP in the cellular response to hypoxia. Proc Natl Acad Sci U S A 93: 12969–12973 [DOI] [PMC free article] [PubMed] [Google Scholar]
- Arora S, Bhardwaj A, Srivastava SK, Singh S, McClellan S, Wang B, Singh AP (2011) Honokiol arrests cell cycle, induces apoptosis, and potentiates the cytotoxic effect of gemcitabine in human pancreatic cancer cells. PLoS One 6: e21573 [DOI] [PMC free article] [PubMed] [Google Scholar]
- Arora S, Bhardwaj A, Singh S, Srivastava SK, McClellan S, Nirodi CS, Piazza GA, Grizzle WE, Owen LB, Singh AP (2013) An undesired effect of chemotherapy: gemcitabine promotes pancreatic cancer cell invasiveness through reactive oxygen species‐dependent, nuclear factor kappaB‐ and hypoxia‐inducible factor 1alpha‐mediated up‐regulation of CXCR4. J Biol Chem 288: 21197–21207 [DOI] [PMC free article] [PubMed] [Google Scholar]
- Azim S, Zubair H, Srivastava SK, Bhardwaj A, Zubair A, Ahmad A, Singh S, Khushman M, Singh AP (2016) Deep sequencing and in silico analyses identify MYB‐regulated gene networks and signaling pathways in pancreatic cancer. Sci Rep 6: 28446 [DOI] [PMC free article] [PubMed] [Google Scholar]
- Azoitei N, Becher A, Steinestel K, Rouhi A, Diepold K, Genze F, Simmet T, Seufferlein T (2016) PKM2 promotes tumor angiogenesis by regulating HIF‐1alpha through NF‐kappaB activation. Mol Cancer 15: 3 [DOI] [PMC free article] [PubMed] [Google Scholar]
- Bhardwaj A, Srivastava SK, Singh S, Tyagi N, Arora S, Carter JE, Khushman M, Singh AP (2016) MYB promotes desmoplasia in pancreatic cancer through direct transcriptional up‐regulation and cooperative action of sonic hedgehog and adrenomedullin. J Biol Chem 291: 16263–16270 [DOI] [PMC free article] [PubMed] [Google Scholar]
- Blanco FF, Jimbo M, Wulfkuhle J, Gallagher I, Deng J, Enyenihi L, Meisner‐Kober N, Londin E, Rigoutsos I, Sawicki JA et al (2016) The mRNA‐binding protein HuR promotes hypoxia‐induced chemoresistance through posttranscriptional regulation of the proto‐oncogene PIM1 in pancreatic cancer cells. Oncogene 35: 2529–2541 [DOI] [PMC free article] [PubMed] [Google Scholar]
- Byrne MB, Leslie MT, Gaskins HR, Kenis PJA (2014) Methods to study the tumor microenvironment under controlled oxygen conditions. Trends Biotechnol 32: 556–563 [DOI] [PMC free article] [PubMed] [Google Scholar]
- Choudhry H, Harris AL (2018) Advances in hypoxia‐inducible factor biology. Cell Metab 27: 281–298 [DOI] [PubMed] [Google Scholar]
- Conway JRW, Warren SC, Herrmann D, Murphy KJ, Cazet AS, Vennin C, Shearer RF, Killen MJ, Magenau A, Melenec P et al (2018) Intravital imaging to monitor therapeutic response in moving hypoxic regions resistant to PI3K pathway targeting in pancreatic cancer. Cell Rep 23: 3312–3326 [DOI] [PMC free article] [PubMed] [Google Scholar]
- Costantino CL, Witkiewicz AK, Kuwano Y, Cozzitorto JA, Kennedy EP, Dasgupta A, Keen JC, Yeo CJ, Gorospe M, Brody JR (2009) The role of HuR in gemcitabine efficacy in pancreatic cancer: HuR up‐regulates the expression of the gemcitabine metabolizing enzyme deoxycytidine kinase. Cancer Res 69: 4567–4572 [DOI] [PMC free article] [PubMed] [Google Scholar]
- Dasse E, Volpe G, Walton DS, Wilson N, Del Pozzo W, O'Neill LP, Slany RK, Frampton J, Dumon S (2012) Distinct regulation of c‐myb gene expression by HoxA9, Meis1 and Pbx proteins in normal hematopoietic progenitors and transformed myeloid cells. Blood Cancer J 2: e76 [DOI] [PMC free article] [PubMed] [Google Scholar]
- Dauer P, Nomura A, Saluja A, Banerjee S (2017) Microenvironment in determining chemo‐resistance in pancreatic cancer: neighborhood matters. Pancreatology 17: 7–12 [DOI] [PMC free article] [PubMed] [Google Scholar]
- Dengler VL, Galbraith M, Espinosa JM (2014) Transcriptional regulation by hypoxia inducible factors. Crit Rev Biochem Mol Biol 49: 1–15 [DOI] [PMC free article] [PubMed] [Google Scholar]
- Denko NC (2008) Hypoxia, HIF1 and glucose metabolism in the solid tumour. Nat Rev Cancer 8: 705–713 [DOI] [PubMed] [Google Scholar]
- Eales KL, Hollinshead KE, Tennant DA (2016) Hypoxia and metabolic adaptation of cancer cells. Oncogene 5: e190 [DOI] [PMC free article] [PubMed] [Google Scholar]
- Elcheva IA, Wood T, Chiarolanzio K, Chim B, Wong M, Singh V, Gowda CP, Lu Q, Hafner M, Dovat S et al (2020) RNA‐binding protein IGF2BP1 maintains leukemia stem cell properties by regulating HOXB4, MYB, and ALDH1A1. Leukemia 34: 1354–1363 [DOI] [PMC free article] [PubMed] [Google Scholar]
- Favaro E, Bensaad K, Chong MG, Tennant DA, Ferguson DJ, Snell C, Steers G, Turley H, Li JL, Gunther UL et al (2012) Glucose utilization via glycogen phosphorylase sustains proliferation and prevents premature senescence in cancer cells. Cell Metab 16: 751–764 [DOI] [PubMed] [Google Scholar]
- Feig C, Gopinathan A, Neesse A, Chan DS, Cook N, Tuveson DA (2012) The pancreas cancer microenvironment. Clin Cancer Res 18: 4266–4276 [DOI] [PMC free article] [PubMed] [Google Scholar]
- Fuglerud BM, Ledsaak M, Rogne M, Eskeland R, Gabrielsen OS (2018) The pioneer factor activity of c‐Myb involves recruitment of p300 and induction of histone acetylation followed by acetylation‐induced chromatin dissociation. Epigenetics Chromatin 11: 35 [DOI] [PMC free article] [PubMed] [Google Scholar]
- George OL, Ness SA (2014) Situational awareness: regulation of the myb transcription factor in differentiation, the cell cycle and oncogenesis. Cancers (Basel) 6: 2049–2071 [DOI] [PMC free article] [PubMed] [Google Scholar]
- Greig KT, Carotta S, Nutt SL (2008) Critical roles for c‐Myb in hematopoietic progenitor cells. Semin Immunol 20: 247–256 [DOI] [PubMed] [Google Scholar]
- Gudas JM, Klein RC, Oka M, Cowan KH (1995) Posttranscriptional regulation of the c‐myb proto‐oncogene in estrogen receptor‐positive breast cancer cells. Clin Cancer Res 1: 235–243 [PubMed] [Google Scholar]
- Guillaumond F, Leca J, Olivares O, Lavaut MN, Vidal N, Berthezene P, Dusetti NJ, Loncle C, Calvo E, Turrini O et al (2013) Strengthened glycolysis under hypoxia supports tumor symbiosis and hexosamine biosynthesis in pancreatic adenocarcinoma. Proc Natl Acad Sci U S A 110: 3919–3924 [DOI] [PMC free article] [PubMed] [Google Scholar]
- Gunda V, Kumar S, Dasgupta A, Singh PK (2018) Hypoxia‐induced metabolomic alterations in pancreatic cancer cells. Methods Mol Biol 1742: 95–105 [DOI] [PubMed] [Google Scholar]
- Heinonen M, Bono P, Narko K, Chang SH, Lundin J, Joensuu H, Furneaux H, Hla T, Haglund C, Ristimaki A (2005) Cytoplasmic HuR expression is a prognostic factor in invasive ductal breast carcinoma. Cancer Res 65: 2157–2161 [DOI] [PubMed] [Google Scholar]
- Hingorani SR, Petricoin EF, Maitra A, Rajapakse V, King C, Jacobetz MA, Ross S, Conrads TP, Veenstra TD, Hitt BA et al (2003) Preinvasive and invasive ductal pancreatic cancer and its early detection in the mouse. Cancer Cell 4: 437–450 [DOI] [PubMed] [Google Scholar]
- Hollinshead KER, Parker SJ, Eapen VV, Encarnacion‐Rosado J, Sohn A, Oncu T, Cammer M, Mancias JD, Kimmelman AC (2020) Respiratory Supercomplexes promote mitochondrial efficiency and growth in severely hypoxic pancreatic cancer. Cell Rep 33: 108231 [DOI] [PMC free article] [PubMed] [Google Scholar]
- Jiang P, Du W, Wu M (2014) Regulation of the pentose phosphate pathway in cancer. Protein Cell 5: 592–602 [DOI] [PMC free article] [PubMed] [Google Scholar]
- Jochmanova I, Pacak K (2016) Pheochromocytoma: the first metabolic endocrine cancer. Clin Cancer Res 22: 5001–5011 [DOI] [PMC free article] [PubMed] [Google Scholar]
- Kasper LH, Boussouar F, Ney PA, Jackson CW, Rehg J, van Deursen JM, Brindle PK (2002) A transcription‐factor‐binding surface of coactivator p300 is required for haematopoiesis. Nature 419: 738–743 [DOI] [PubMed] [Google Scholar]
- Khan MA, Srivastava SK, Zubair H, Patel GK, Arora S, Khushman M, Carter JE, Gorman GS, Singh S, Singh AP (2020) Co‐targeting of CXCR4 and hedgehog pathways disrupts tumor‐stromal crosstalk and improves chemotherapeutic efficacy in pancreatic cancer. J Biol Chem 295: 8413–8424 [DOI] [PMC free article] [PubMed] [Google Scholar]
- Kim Y, Nam HJ, Lee J, Park DY, Kim C, Yu YS, Kim D, Park SW, Bhin J, Hwang D et al (2016) Methylation‐dependent regulation of HIF‐1alpha stability restricts retinal and tumour angiogenesis. Nat Commun 7: 10347 [DOI] [PMC free article] [PubMed] [Google Scholar]
- Lee P, Chandel NS, Simon MC (2020) Cellular adaptation to hypoxia through hypoxia inducible factors and beyond. Nat Rev Mol Cell Biol 21: 268–283 [DOI] [PMC free article] [PubMed] [Google Scholar]
- Li L, Chang W, Yang G, Ren C, Park S, Karantanos T, Karanika S, Wang J, Yin J, Shah PK et al (2014) Targeting poly(ADP‐ribose) polymerase and the c‐Myb‐regulated DNA damage response pathway in castration‐resistant prostate cancer. Sci Signal 7: ra47 [DOI] [PMC free article] [PubMed] [Google Scholar]
- Li Y, Jin K, van Pelt GW, van Dam H, Yu X, Mesker WE, Ten Dijke P, Zhou F, Zhang L (2016) c‐Myb enhances breast cancer invasion and metastasis through the Wnt/beta‐catenin/Axin2 pathway. Cancer Res 76: 3364–3375 [DOI] [PubMed] [Google Scholar]
- Liu X, Gold KA, Dmitrovsky E (2015) The Myb‐p300 interaction is a novel molecular pharmacologic target. Mol Cancer Ther 14: 1273–1275 [DOI] [PMC free article] [PubMed] [Google Scholar]
- Majmundar AJ, Wong WJ, Simon MC (2010) Hypoxia‐inducible factors and the response to hypoxic stress. Mol Cell 40: 294–309 [DOI] [PMC free article] [PubMed] [Google Scholar]
- Marin‐Hernandez A, Gallardo‐Perez JC, Ralph SJ, Rodriguez‐Enriquez S, Moreno‐Sanchez R (2009) HIF‐1alpha modulates energy metabolism in cancer cells by inducing over‐expression of specific glycolytic isoforms. Mini Rev Med Chem 9: 1084–1101 [DOI] [PubMed] [Google Scholar]
- Messeguer X, Escudero R, Farre D, Nunez O, Martinez J, Alba MM (2002) PROMO: detection of known transcription regulatory elements using species‐tailored searches. Bioinformatics 18: 333–334 [DOI] [PubMed] [Google Scholar]
- Mets E, van der Meulen J, van Peer G, Boice M, Mestdagh P, van de Walle I, Lammens T, Goossens S, de Moerloose B, Benoit Y et al (2015) MicroRNA‐193b‐3p acts as a tumor suppressor by targeting the MYB oncogene in T‐cell acute lymphoblastic leukemia. Leukemia 29: 798–806 [DOI] [PMC free article] [PubMed] [Google Scholar]
- Mrena J, Wiksten JP, Thiel A, Kokkola A, Pohjola L, Lundin J, Nordling S, Ristimaki A, Haglund C (2005) Cyclooxygenase‐2 is an independent prognostic factor in gastric cancer and its expression is regulated by the messenger RNA stability factor HuR. Clin Cancer Res 11: 7362–7368 [DOI] [PubMed] [Google Scholar]
- Navarro F, Gutman D, Meire E, Caceres M, Rigoutsos I, Bentwich Z, Lieberman J (2009) miR‐34a contributes to megakaryocytic differentiation of K562 cells independently of p53. Blood 114: 2181–2192 [DOI] [PubMed] [Google Scholar]
- Pan H, Strickland A, Madhu V, Johnson ZI, Chand SN, Brody JR, Fertala A, Zheng Z, Shapiro IM, Risbud MV (2019) RNA binding protein HuR regulates extracellular matrix gene expression and pH homeostasis independent of controlling HIF‐1alpha signaling in nucleus pulposus cells. Matrix Biol 77: 23–40 [DOI] [PMC free article] [PubMed] [Google Scholar]
- Patton MC, Zubair H, Khan MA, Singh S, Singh AP (2020) Hypoxia alters the release and size distribution of extracellular vesicles in pancreatic cancer cells to support their adaptive survival. J Cell Biochem 121: 828–839 [DOI] [PMC free article] [PubMed] [Google Scholar]
- Pawlus MR, Wang L, Hu CJ (2014) STAT3 and HIF1alpha cooperatively activate HIF1 target genes in MDA‐MB‐231 and RCC4 cells. Oncogene 33: 1670–1679 [DOI] [PMC free article] [PubMed] [Google Scholar]
- Peng W, Furuuchi N, Aslanukova L, Huang YH, Brown SZ, Jiang W, Addya S, Vishwakarma V, Peters E, Brody JR et al (2018) Elevated HuR in pancreas promotes a pancreatitis‐like inflammatory microenvironment that facilitates tumor development. Mol Cell Biol 38: e00427‐17 [DOI] [PMC free article] [PubMed] [Google Scholar]
- Petrova V, Annicchiarico‐Petruzzelli M, Melino G, Amelio I (2018) The hypoxic tumour microenvironment. Oncogene 7: 10 [DOI] [PMC free article] [PubMed] [Google Scholar]
- Reglero C, Lafarga V, Rivas V, Albitre A, Ramos P, Berciano SR, Tapia O, Martinez‐Chantar ML, Mayor F Jr, Penela P (2020) GRK2‐dependent HuR phosphorylation regulates HIF1alpha activation under hypoxia or adrenergic stress. Cancers (Basel) 12: 1216 [DOI] [PMC free article] [PubMed] [Google Scholar]
- Rousset M, Zweibaum A, Fogh J (1981) Presence of glycogen and growth‐related variations in 58 cultured human tumor cell lines of various tissue origins. Cancer Res 41: 1165–1170 [PubMed] [Google Scholar]
- Salceda S, Caro J (1997) Hypoxia‐inducible factor 1alpha (HIF‐1alpha) protein is rapidly degraded by the ubiquitin‐proteasome system under normoxic conditions. Its stabilization by hypoxia depends on redox‐induced changes. J Biol Chem 272: 22642–22647 [DOI] [PubMed] [Google Scholar]
- Semenza GL (2010) Defining the role of hypoxia‐inducible factor 1 in cancer biology and therapeutics. Oncogene 29: 625–634 [DOI] [PMC free article] [PubMed] [Google Scholar]
- Semenza GL (2013) HIF‐1 mediates metabolic responses to intratumoral hypoxia and oncogenic mutations. J Clin Invest 123: 3664–3671 [DOI] [PMC free article] [PubMed] [Google Scholar]
- Shen C, Beroukhim R, Schumacher SE, Zhou J, Chang M, Signoretti S, Kaelin WG Jr (2011) Genetic and functional studies implicate HIF1alpha as a 14q kidney cancer suppressor gene. Cancer Discov 1: 222–235 [DOI] [PMC free article] [PubMed] [Google Scholar]
- Siegel RL, Miller KD, Fuchs HE, Jemal A (2022) Cancer statistics, 2022. CA Cancer J Clin 72: 7–33 [DOI] [PubMed] [Google Scholar]
- Singh AP, Arora S, Bhardwaj A, Srivastava SK, Kadakia MP, Wang B, Grizzle WE, Owen LB, Singh S (2012) CXCL12/CXCR4 protein signaling axis induces sonic hedgehog expression in pancreatic cancer cells via extracellular regulated kinase‐ and Akt kinase‐mediated activation of nuclear factor kappaB: implications for bidirectional tumor‐stromal interactions. J Biol Chem 287: 39115–39124 [DOI] [PMC free article] [PubMed] [Google Scholar]
- Slamon DJ, Boone TC, Murdock DC, Keith DE, Press MF, Larson RA, Souza LM (1986) Studies of the human c‐myb gene and its product in human acute leukemias. Science 233: 347–351 [DOI] [PubMed] [Google Scholar]
- Srivastava SK, Bhardwaj A, Arora S, Singh S, Azim S, Tyagi N, Carter JE, Wang B, Singh AP (2015) MYB is a novel regulator of pancreatic tumour growth and metastasis. Br J Cancer 113: 1694–1703 [DOI] [PMC free article] [PubMed] [Google Scholar]
- Srivastava SK, Khan MA, Anand S, Zubair H, Deshmukh SK, Patel GK, Singh S, Andrews J, Wang B, Carter JE et al (2021) MYB interacts with androgen receptor, sustains its ligand‐independent activation and promotes castration resistance in prostate cancer. Br J Cancer 126: 1205–1214 [DOI] [PMC free article] [PubMed] [Google Scholar]
- Tadi S, Kim SJ, Ryu MJ, Jeong J‐S, Kweon GR, Shong M, Yim Y‐H (2013) Metabolic rebalancing of CR6 interaction factor 1‐deficient mouse embryonic fibroblasts: a mass spectrometry‐based metabolic analysis. Bull Korean Chem Soc 34: 35–41 [Google Scholar]
- Tiwari A, Tashiro K, Dixit A, Soni A, Vogel K, Hall B, Shafqat I, Slaughter J, Param N, Le A et al (2020) Loss of HIF1A from pancreatic cancer cells increases expression of PPP1R1B and degradation of p53 to promote invasion and metastasis. Gastroenterology 159: 1882–1897 [DOI] [PMC free article] [PubMed] [Google Scholar]
- Tsunoda T, Takagi T (1999) Estimating transcription factor bindability on DNA. Bioinformatics 15: 622–630 [DOI] [PubMed] [Google Scholar]
- Wallrapp C, Muller‐Pillasch F, Solinas‐Toldo S, Lichter P, Friess H, Buchler M, Fink T, Adler G, Gress TM (1997) Characterization of a high copy number amplification at 6q24 in pancreatic cancer identifies c‐myb as a candidate oncogene. Cancer Res 57: 3135–3139 [PubMed] [Google Scholar]
- Wang J, Guo Y, Chu H, Guan Y, Bi J, Wang B (2013) Multiple functions of the RNA‐binding protein HuR in cancer progression, treatment responses and prognosis. Int J Mol Sci 14: 10015–10041 [DOI] [PMC free article] [PubMed] [Google Scholar]
- Wang Y, Lyu Y, Tu K, Xu Q, Yang Y, Salman S, Le N, Lu H, Chen C, Zhu Y et al (2021) Histone citrullination by PADI4 is required for HIF‐dependent transcriptional responses to hypoxia and tumor vascularization. Sci Adv 7: eabe3771 [DOI] [PMC free article] [PubMed] [Google Scholar]
- Weston K (1999) Reassessing the role of C‐MYB in tumorigenesis. Oncogene 18: 3034–3038 [DOI] [PubMed] [Google Scholar]
- Wierenga ATJ, Cunningham A, Erdem A, Lopera NV, Brouwers‐Vos AZ, Pruis M, Mulder AB, Gunther UL, Martens JHA, Vellenga E et al (2019) HIF1/2‐exerted control over glycolytic gene expression is not functionally relevant for glycolysis in human leukemic stem/progenitor cells. Cancer Metab 7: 11 [DOI] [PMC free article] [PubMed] [Google Scholar]
- Xiao C, Calado DP, Galler G, Thai TH, Patterson HC, Wang J, Rajewsky N, Bender TP, Rajewsky K (2007) MiR‐150 controls B cell differentiation by targeting the transcription factor c‐Myb. Cell 131: 146–159 [DOI] [PubMed] [Google Scholar]
- Xu R, Yang J, Ren B, Wang H, Yang G, Chen Y, You L, Zhao Y (2020) Reprogramming of amino acid metabolism in pancreatic cancer: recent advances and therapeutic strategies. Front Oncol 10: 572722 [DOI] [PMC free article] [PubMed] [Google Scholar]
- Yamasaki A, Yanai K, Onishi H (2020) Hypoxia and pancreatic ductal adenocarcinoma. Cancer Lett 484: 9–15 [DOI] [PubMed] [Google Scholar]
- Zhang H, Zhao X, Guo Y, Chen R, He J, Li L, Qiang Z, Yang Q, Liu X, Huang C et al (2021) Hypoxia regulates overall mRNA homeostasis by inducing met(1)‐linked linear ubiquitination of AGO2 in cancer cells. Nat Commun 12: 5416 [DOI] [PMC free article] [PubMed] [Google Scholar]
- Zubair H, Patel GK, Khan MA, Azim S, Zubair A, Singh S, Srivastava SK, Singh AP (2020) Proteomic analysis of MYB‐regulated Secretome identifies functional pathways and biomarkers: potential pathobiological and clinical implications. J Proteome Res 19: 794–804 [DOI] [PMC free article] [PubMed] [Google Scholar]