Abstract
Interleukin 22 (IL‐22) has an important role in colorectal tumorigenesis and many colorectal diseases such as inflammatory bowel disease and certain infections. However, the regulation of IL‐22 production in the intestinal system is still unclear. Here, we present evidence that butyrophilin‐like protein 2 (BTNL2) is required for colorectal IL‐22 production, and BTNL2 knockout mice show decreased colonic tumorigenesis and more severe colitis phenotypes than control mice due to defective production of IL‐22. Mechanistically, BTNL2 acts on group 3 innate lymphoid cells (ILC3s), CD4+ T cells, and γδ T cells to promote the production of IL‐22. Importantly, we find that a monoclonal antibody against BTNL2 attenuates colorectal tumorigenesis in mice and that the mBTNL2‐Fc recombinant protein has a therapeutic effect in a dextran sulfate sodium (DSS)‐induced colitis model. This study not only identifies a regulatory mechanism of IL‐22 production in the colorectal system but also provides a potential therapeutic target for the treatment of human colorectal cancer and inflammatory bowel diseases.
Keywords: BTNL2, colitis, colorectal cancer, IL‐22
Subject Categories: Cancer, Immunology
BTNL2 promotes colonic tumorigenesis in mice by regulating colorectal IL‐22 production, while it has a protective role against severe colitis. A monoclonal antibody against BTNL2 attenuates colorectal tumorigenesis.

Introduction
IL‐22 belongs to the IL‐10 cytokine family and functions through a transmembrane receptor complex that consists of IL‐22R1 and IL‐22R2 (Dumoutier et al, 2000; Sabat et al, 2014). The binding of IL‐22 to its receptor leads to specific gene expression or inhibition (Ouyang et al, 2011). IL‐22 strongly activates STAT3, which results in the expression of certain inflammatory genes and antibacterial peptides and plays an essential role in tissue inflammation, tissue repair, and host defense against different pathogens (Wolk et al, 2004; Kryczek et al, 2014). It has been reported that colorectal IL‐22 is mainly produced by ILC3s, CD4+ T cells, intestinal NKp46+ T cells, and γδ T cells, while the regulation of IL‐22 production in c tissue is still unclear (Satoh‐Takayama et al, 2008; Broadhurst et al, 2010; Kirchberger et al, 2013; Mielke et al, 2013; Longman et al, 2014; Rankin et al, 2016).
IL‐22 is involved in colorectal tumorigenesis through the activation of STAT3, which is an established oncogene associated with the development and progression of many cancers (Guo et al, 2014). It was found that tumor burden is significantly reduced in IL‐22 knockout mice but is greatly increased in IL‐22 binding protein (IL‐22BP) knockout mice (Huber et al, 2012). This effect is due to IL‐22 dependence, epithelial cell proliferation, and apoptotic resistance (Sabat et al, 2014). Contrary to the role of IL‐22 in colonic tumors, IL‐22 plays a protective role in colitis. In IBD patients, IL‐22‐producing cells are significantly increased in inflamed intestinal tissues (Andoh et al, 2005). In a DSS‐induced colitis model and a cell‐transferred Rag1 −/− mouse colitis model, IL‐22 knockout mice showed a more severe phenotype than control mice (Zenewicz et al, 2008). The protective role of IL‐22 in IBD is due to increased expression of mucus‐associated molecules and antibacterial proteins (Sugimoto et al, 2008; Pickert et al, 2009; Zenewicz et al, 2013). IL‐22 also contributes to the restitution of mucus‐producing goblet cells and increased proliferation of colorectal and epithelial cells, which are also reasons for its protective role in IBD (Sugimoto et al, 2008; Zenewicz et al, 2008, 2013). In addition to its role in oncologic and inflammatory diseases, the physiological role of IL‐22 is host defense against different pathogens, such as invasive bacteria and parasites. IL‐22 is required for host defense against multiple pathogenic bacteria, fungi, and parasites such as Citrobacter rodentium, avium, Listeria monocytogenes, Salmonella enterica, Candida albicans, Aspergillus fumigatus, and Toxoplasma gondii (Schulz et al, 2008; Zheng et al, 2008; De Luca et al, 2010; Kisand et al, 2010; Wilson et al, 2010; Basu et al, 2012; Gessner et al, 2012).
Butyrophilin‐like protein 2 (BTNL2) is a transmembrane protein that is highly expressed in the intestinal tract (Swanson et al, 2013; Du et al, 2022). The mBTNL2‐Fc recombinant protein inhibits the activation of CD4+ T cells in vitro, although the cognate receptor of BTNL2 is still unknown (Nguyen et al, 2006; Arnett et al, 2007). BTNL2 gene polymorphisms and their altered expression levels are related to susceptibility to many human diseases, such as lung and colon adenocarcinoma, IBD, and psoriasis (Franke et al, 2008; Silverberg et al, 2009; Shiraishi et al, 2012, 2016; Prescott et al, 2015; Lebrero‐Fernandez et al, 2016; Zhou et al, 2016). Our previous study found that BTNL2 was a novel suppressor of antitumor immunity and promoted IL‐17A production, γδ T cell differentiation, and the recruitment of myeloid‐derived suppressor cells (MDSCs) to inhibit antitumor immunity (Du et al, 2022). In the former study, we mainly explored its role in subcutaneous tumors. In this study, we used a DSS+ azomethane (AOM)‐induced, spontaneous colorectal tumor model to explore the role of BTNL2 in tumorigenesis. Here, we find that BTNL2 plays a tumorigenic role in the DSS+AOM‐induced colonic tumor model and a protective role in the DSS‐induced colitis model. These effects are due to its important role in IL‐22 production. Importantly, we show evidence that a monoclonal antibody against BTNL2 has a therapeutic effect on mouse colonic tumors and that the mBTNL2‐Fc recombinant protein attenuates the colitis phenotype in mice.
Results
BTNL2 is required for DSS+AOM‐induced mouse colorectal tumorigenesis
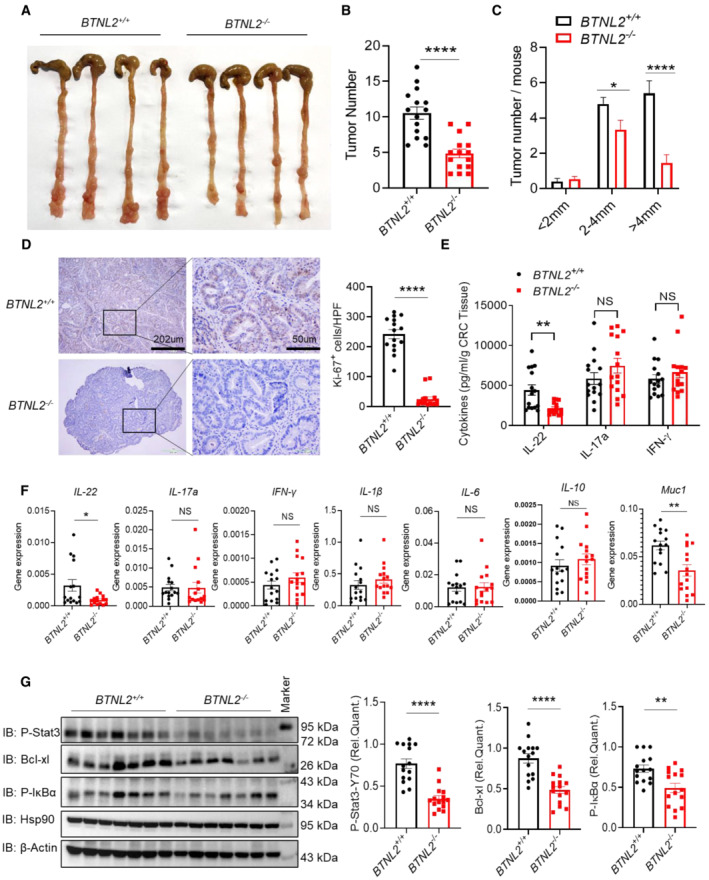
In our previous work, we found that BTNL2 is a potential target for oncologic immunotherapy, and blockade of BTNL2 with a monoclonal neutralizing antibody showed a significant therapeutic effect for multiple mouse tumors (Du et al, 2022). We mainly used a subcutaneous tumor model in a previous study, and considering the high expression level of BTNL2 in the gastrointestinal tract (Du et al, 2022), we explored the function of BTNL2 in intestinal tumors in situ. We found that BTNL2 was exclusively expressed in nonimmune cells in the colon (Fig EV1). We used a colitis‐associated mouse colon tumor model to display the administration of the mutagen AOM and the induction of chronic colitis via DSS‐promoted tumorigenesis in the intestine. We found that the tumor burden was significantly reduced in BTNL2‐knockout (BTNL2−/−) mice compared with control mice (Fig 1A–C). IHC staining showed that the level of Ki‐67 in the tumors of BTNL2‐KO mice was significantly reduced compared to that in the tumors of control mice (Fig 1D). Thereafter, we analyzed the secretion of cytokines in tumors and found that the protein and mRNA levels of IL‐22 were significantly reduced in the tumors of BTNL2‐KO mice compared with control mice, while the levels of IL‐17a and IFN‐γ were not changed (Fig 1E and F). Consistently, we found that the expression level of Muc1, which is a downstream gene of IL‐22, was significantly reduced in the tumors of BTNL2‐KO mice compared with control mice (Fig 1F), and a high level of Muc1 expression in the rectum was associated with advanced colon cancer stages and deeper, more distant invasion, including lymph node metastasis (Sugimoto et al, 2008). However, the expression of other inflammatory factors, such as IL‐1β, IL‐6, and IL‐10, was not significantly changed in the tumors of BTNL2‐KO mice compared with control mice (Fig 1F). It has been reported that IL‐22 promotes the proliferation of the intestinal epithelium through the IL‐22‐STAT3 axis, and IL‐22 also plays an antiapoptotic role through the IL‐22‐STAT3‐Bcl‐xl axis and activates the transcription factor nuclear factor kappa‐light‐chain enhancer of activated B cells (NF‐κB) (Sabat et al, 2014). We found that in the tumors of BTNL2‐KO mice, the levels of P‐Stat3, Bcl‐xl, and P‐IκBα were significantly reduced compared to those in control mice (Fig 1G). Therefore, BTNL2 plays an essential role in colorectal tumorigenesis, possibly via the regulation of IL‐22 production.
Figure EV1. Analysis of BTNL2 expression in mouse colonic epithelial cells and. immune cells.
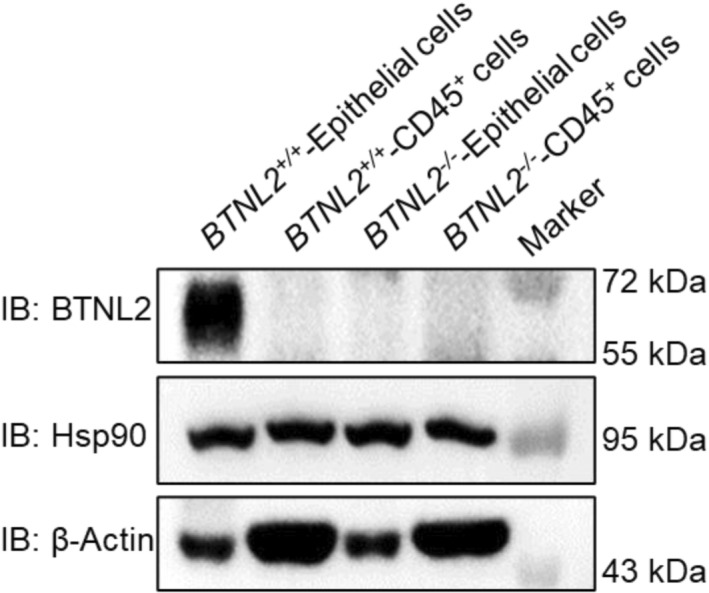
Colonic epithelium cells were scraped with a razor blade, and CD45+ cells from LPLs were sorted by FACS. Cells were lysed, and BTNL2 protein level was analyzed by immunoblot.Source data are available online for this figure.
Figure 1. BTNL2 is required for DSS+AOM‐induced colorectal tumorigenesis.
-
A–CRepresentative colonic tumor burden (A), tumor number and tumor size per mouse (B, C) from wild‐type control mice or BTNL2‐KO mice after DSS+AOM treatment were shown (n = 15).
-
DQuantity of Ki67+ cells in tumor and representative histology images analyzed by immunohistochemistry (IHC) that described in (A) were shown. Ki67 expression was analyzed in average number of four high‐power field (HPF).
-
EIL‐22, IL‐17a, and IFN‐γ secreted by infiltrating cells in tumor that described in (A) were measured by ELISA.
-
FRelative mRNA expression of IL‐22, IL‐17a, IFN‐γ, IL‐1β, IL‐6, IL‐10, and Muc1 of colon tumor described in (A) was shown.
-
GRepresentative immunoblot images (left) and quantification analysis of P‐Stat3, Bcl‐xl, and P‐IκBα protein expression (right) in the tumor described in (A) were shown.
Data information: All data are mean ± s.e.m. NS, not significant. *P < 0.05, **P < 0.01, ****P < 0.0001 based on two‐tailed Student's t‐test for (B–G). Each dot represents one mouse, n = 15. Data are representative of three biological replicates.
Source data are available online for this figure.
BTNL2 has a protective role in the mouse colitis model
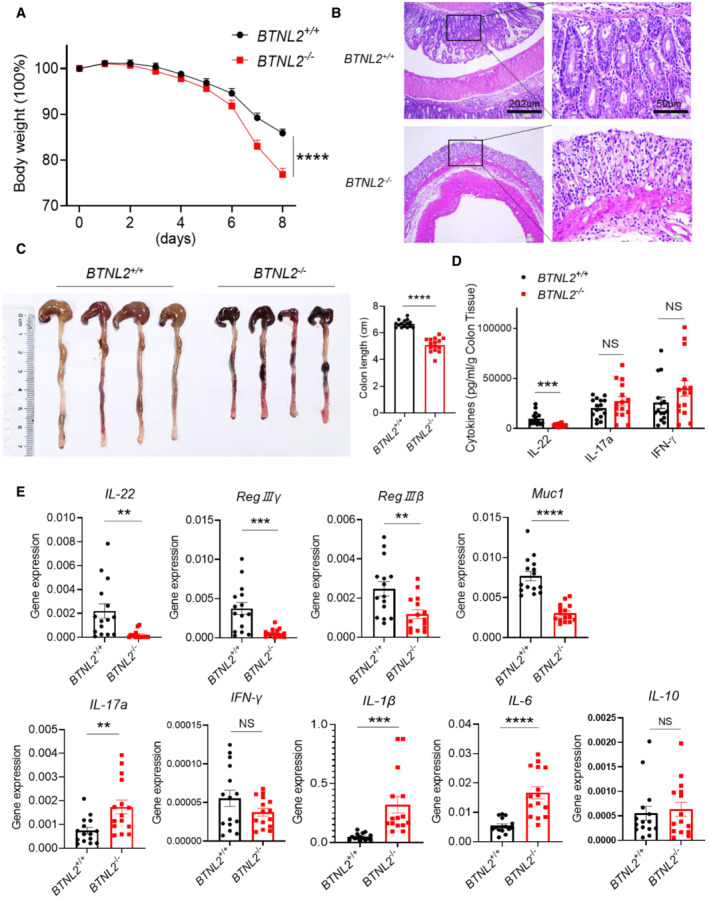
To exclude the possibility that the phenotype of the colorectal tumor model was due to reduced inflammation in the colon of BTNL2‐KO mice, we examined the role of BTNL2 in the DSS‐induced colitis model. BTNL2‐KO mice exhibited greater weight loss and more severe inflammation than their wild‐type littermates (Fig 2A and B). The colon length of BTNL2‐KO mice was significantly shorter than that of their littermate controls (Fig 2C). These results indicate that BTNL2 plays a protective role in colitis. Consistent with the data described in Fig 1, we found that the protein and mRNA levels of IL‐22 in colon tissue were significantly reduced in BTNL2‐KO mice compared with control mice after DSS treatment (Fig 2D and E). As an indicator of the inflammatory level, the gene expression levels of IL‐17a, IL‐6, and IL‐1β in BTNL2‐KO mice were significantly increased, while there was no significant difference in the expression of IL‐10 (Fig 2E). IL‐22 plays critical roles in tissue homeostasis and host defense against different pathogens by regulating gut epithelial barrier functions such as mucus and antimicrobial peptide production (Sabat et al, 2014), and consistent with the decreased IL‐22 level in the colon of BTNL2‐KO mice, the expression of Muc1 and the antimicrobial peptides RegIIIβ and RegIIIγ mRNA was significantly reduced in the colon tissue of BTNL2‐KO mice compared to that of control mice (Fig 2E). Thus, BTNL2 plays a protective role in colitis, possibly by regulating IL‐22 production in colorectal tissues.
Figure 2. BTNL2 has a protective role in mice colitis model.
-
A–CBody weight changes (A), representative histological images (B), and representative colon image (left) and colon length (right) (C) of wild‐type control mice or BTNL2‐KO mice treated with 2% DSS for 8 days were shown (n = 15).
-
DIL‐22, IL‐17a, and IFN‐γ secreted from colonic tissues in (A) measured by ELISA were shown.
-
ERelative mRNA expression of IL‐22, RegIIIγ, RegIIIβ, Muc1, IL‐17a, IFN‐γ, IL‐1β, IL‐6, and IL‐10 of colonic tissues described in (A) was shown.
Data information: All data are mean ± s.e.m. NS, not significant. **P < 0.01, ***P < 0.001, ****P < 0.0001 based on two‐way ANOVA for (A) and two‐tailed Student's t‐test for (C–E). Each dot represents one mouse, n = 15. Data are representative of three biological replicates.
Source data are available online for this figure.
BTNL2 regulates tumorigenesis and colitis by regulating IL‐22 production
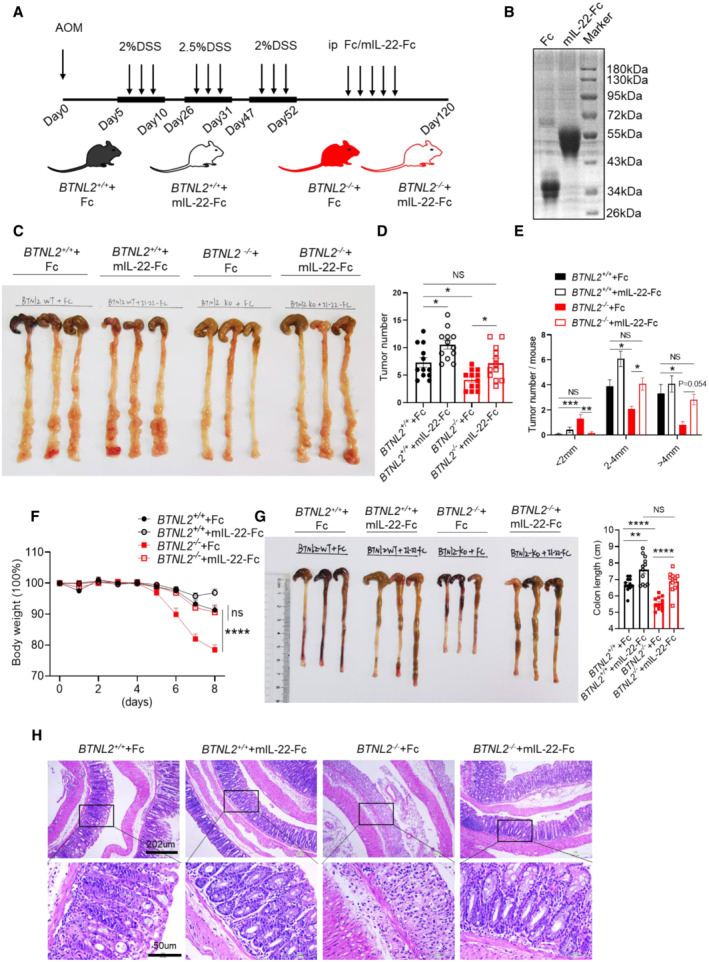
To further examine the role of IL‐22 in the colorectal tumor and colitis phenotypes of BTNL2 knockout mice, we administered Fc or the mIL‐22‐Fc recombinant protein to control mice or BTNL2‐KO mice in the DSS+AOM‐induced colonic tumor model (Fig 3A and B). Interestingly, BTNL2‐KO mice that received the mIL‐22‐Fc recombinant protein treatment showed a tumor burden comparable to that of Fc‐treated control mice (Fig 3C–E). Next, we found that BTNL2‐KO mice treated with mIL‐22‐Fc recombinant protein showed comparable weight loss, histopathological damage, and colonic length to that exhibited by Fc‐treated control mice in the DSS‐induced colitis model (Fig 3F–H). Collectively, these data indicate that BTNL2 regulates IL‐22 production in colorectal tissues, and the colorectal tumorigenesis and colitis observed in BTNL2‐KO mice are due to reduced IL‐22 production in the colon of BTNL2‐KO mice.
Figure 3. BTNL2 regulates colorectal tumorigenesis and colitis by regulating IL‐22 production.
-
AMice were intraperitoneally injected with Fc or mIL‐22‐Fc recombinant proteins (5 μg/mouse) three times a week after the last round of DSS treatment. Arrows represent the AOM/DSS and Fc or mIL‐22‐Fc treatment.
-
BPurified Fc and mIL‐22‐Fc recombinant proteins were analyzed by SDS–PAGE and Coomassie brilliant blue staining.
-
C–ERepresentative colonic tumor burden (C), tumor number (D), and tumor size per mouse (E) which described in (A) were shown (n = 12).
-
F–HBody weight changes (F), colon length (G), and representative H&E images (H) of wild‐type control mice or BTNL2‐KO mice treated with Fc or mIL‐22‐Fc (ip. 5 μg/mouse) at day 0, 2, 4, and 6 during 2% DSS treatment were shown (n = 12).
Data information: All data are mean ± s.e.m. NS, not significant. *P < 0.05, **P < 0.01, ***P < 0.001, ****P < 0.0001 based on one‐way ANOVA for (D, E, G) and two‐way ANOVA for (F). Each dot represents one mouse, n = 12 for (D–G). Data are representative of three biological replicates (B, C, left panel of G, H). Pooled data from three biological replicates are shown in (D–F) and in the right panel of (G).
Source data are available online for this figure.
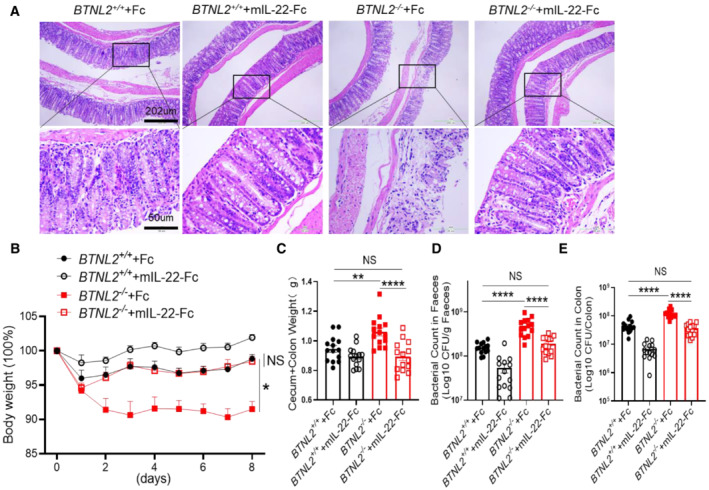
It was found that IL‐22 played an essential role in host defense against C. rodentium infection (Basu et al, 2012), and we challenged wild‐type and BTNL2‐KO mice with C. rodentium to examine whether BTNL2‐KO mice were susceptible to C. rodentium infection due to defective IL‐22 production. Histological analysis showed that BTNL2‐KO mice had enhanced structural disruption of the colonic epithelium compared with control mice (Fig EV2A). BTNL2‐KO mice infected with C. rodentium rapidly lost body weight, whereas wild‐type control mice did not lose weight (Fig EV2B). Furthermore, the intestinal weights of BTNL2‐KO mice were significantly greater than those of wild‐type mice (Fig EV2C), and bacterial numbers in the colon and feces of BTNL2‐KO mice were considerably higher (as much as 100‐fold greater) than those in wild‐type control mice (Fig EV2D and E). The weight loss, histological score, colonic weight, and bacterial number in the feces and colon of BTNL2‐KO mice were comparable to those of Fc‐treated control mice after mIL‐22‐Fc recombinant protein treatment (Fig EV2A–E). Collectively, these data further demonstrate an evident role of BTNL2 in gut immunity via regulation of IL‐22 production.
Figure EV2. mIL‐22‐Fc recombinant protein reversed the defective phenotype of BTNL2 KO mice against C. rodentium infection.
-
A, BRepresentative H&E images (A) and body weight changes (B) in wild‐type control mice or BTNL2‐KO mice treated with Fc or mIL‐22‐Fc (ip. 5 μg/mouse) at day 0, 2, 4, and 6 during C. rodentium infection were shown (n = 14).
-
C–EWeight of cecum and colon (C) and bacterial titers in homogenates of fecal (D) or colon (E) from mice in (A) at day 9 after infection were shown (n = 14).
Data information: All data are mean ± s.e.m. NS, not significant. *P < 0.05, **P < 0.01, ****P < 0.0001 based on two‐way ANOVA for (B) and one‐way ANOVA for (C–E). Each dot represents one repetition, n = 14. Data are representative of three independent biological replicates.
Source data are available online for this figure.
The mBTNL2‐Fc recombinant protein promotes IL‐22 production
Next, we examined whether BTNL2 could directly promote IL‐22 production. We treated cells isolated from lamina propria with the mBTNL2‐Fc recombinant protein and examined IL‐22 production via ELISA. Importantly, treatment of lamina propria lymphocytes (LPLs) with mBTNL2‐Fc resulted in the production of IL‐22, but not IL‐17 (Fig 4A and B). IL‐22 production induced by mBTNL2‐Fc was blocked by Anti‐BTNL2 mAb (Fig 4C). It was reported that the cellular populations of ILC3s, CD4+ T cells, and γδ T cells produce IL‐22 in the intestinal tract (Broadhurst et al, 2010; Basu et al, 2012; Kirchberger et al, 2013; Mielke et al, 2013; Kryczek et al, 2014). We explored which cellular type or types produced IL‐22 after mBTNL2‐Fc treatment. By stimulating isolated groups of cells, we found that ILC3s, CD4+ T cells, and γδ T cells produced IL‐22 after mBTNL2‐Fc treatment in vitro (Fig 4D). Although CD8+ T cells are not a major cellular source of IL‐22 in the gut, it has been reported that CD8+ T cells are capable of producing IL‐22 in the skin (Hijnen et al, 2013). We found that CD8+ T cells were also able to produce small amounts of IL‐22 after treatment with mBTNL2‐Fc (Fig 4D). To investigate whether mBTNL2‐Fc promotes naïve CD4+ T cells to produce IL‐22 or directly promotes mature Th17 and Th22 to produce IL‐22, we isolated naïve CD4+ T cells (CD4+CD44−CD62L+) from mouse spleen, simultaneously differentiated them into Th17 and Th22 in vitro and then stimulated them with mBTNL2‐Fc or Fc recombinant proteins (Fig EV3A). We found that mBTNL2‐Fc promoted IL‐22 production by mature Th17 and Th22 cells but not naïve CD4+ T cells (Fig 4E). Consistent with the in vitro data, mBTNL2‐Fc also induced IL‐22 production via ILC3s (CD45MedCD3−CD90.2+), CD4+ T cells (CD45+CD4+), and γδ T cells (CD45+γδ+) in vivo, and we found that ILC3s were the major IL‐22‐producing cells after mBTNL2‐Fc treatment in vivo (Figs EV3B and 4F). Because STAT3, RORC, and HIF‐1α are known to be involved in the regulation of IL‐22 production (Nurieva et al, 2007; Rutz et al, 2013; Fachi et al, 2021), we explored whether BTNL2‐induced IL‐22 production was dependent on STAT3, RORC and HIF‐1α. We found that the gene expression of IL‐22, RORC and HIF‐1α was upregulated after mBTNL2‐Fc treatment (Fig 4G). Interestingly, all of the inhibitors of STAT3, RORC, HIF‐1α, and JAK1/2 inhibited IL‐22 production by splenocytes treated with mBTNL2‐Fc, which suggests that BTNL2‐induced IL‐22 production is dependent on JAK1/2, STAT3, RORC, and HIF‐1α (Fig 4H). Consistently, mBTNL2‐Fc treatment induced JAK2 and STAT3 activation in splenocytes (Fig 4I). In our previous study, we found that BTNL2‐Fc could induce IL‐17A production by γδ T cells, and we now found that BTNL2‐induced IL‐17a production was also dependent on JAK1/2, STAT3, RORC, and HIF‐1α (Fig 4G–I). Together, these data indicate that BTNL2 acts on ILC3s, CD4+ T cells, and γδ T cells to produce IL‐22, and the functional role of BTNL2 is dependent on JAK1/2, STAT3, RORC, and HIF‐1α.
Figure 4. mBTNL2‐Fc recombinant protein promotes IL‐22 production.
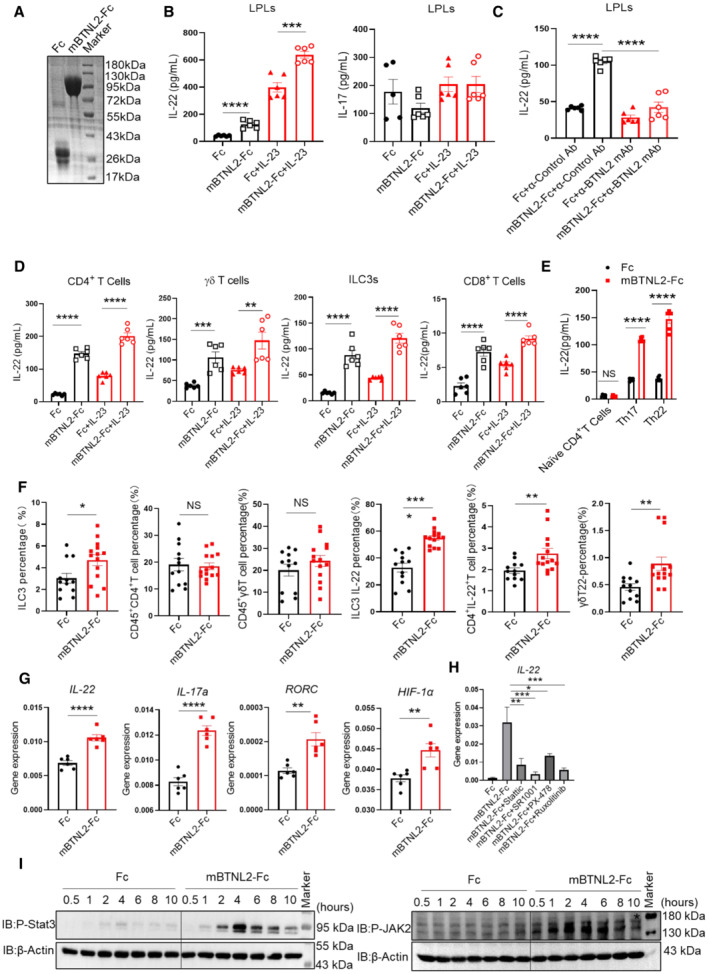
- Purified Fc and mBTNL2‐Fc recombinant proteins were analyzed by SDS–PAGE and Coomassie brilliant blue staining.
- IL‐22 and IL‐17a expression in lamina propria lymphocytes (LPLs) after cultured in plate‐coated Fc, mBTNL2‐Fc (30 μg/ml) with or without IL‐23 (10 ng/ml) for 20 h was analyzed by ELISA.
- IL‐22 production from cells of LPLs cultured in the presence of plate‐coated Fc, mBTNL2‐Fc with anticontrol Ab or anti‐BTNL2 mAb for 20 h was analyzed by ELISA.
- CD4+ T cells, γδ T cells, ILC3s, and CD8+ T cells sorted by FACS were cultured in the plate‐coated Fc, mBTNL2‐Fc with or without IL‐23 (10 ng/ml) for 20 h, and IL‐22 production was analyzed by ELISA.
- Naïve CD4+ T cells, Th17 and Th22 cells were cultured in the plate‐coated Fc or mBTNL2‐Fc (30 μg/ml) for 20 h, and IL‐22 production was analyzed by ELISA.
- IL‐22 production was analyzed by flow cytometry in LPLs of wild‐type mice treated with Fc or mBTNL2‐Fc (ip. 50 μg/mouse) on days 0, 2, 4, and 6 during 2% DSS treatment.
- IL‐22, IL‐17a, RORC, and HIF‐1α expression in splenocytes after cultured in plate‐coated Fc or mBTNL2‐Fc (30 μg/ml) for 20 h was analyzed by real‐time PCR.
- Splenocytes were pretreated with stattic (20 μM, P‐Stat3 inhibitor), SR1001 (10 μM, RORC inhibitor), PX‐478 (10 μM, HIF‐1α inhibitor), and Ruxolitinib (10 μM, P‐JAK1/2 inhibitor) for 2 h and then cultured in 96‐well plate coated with Fc or mBTNL2‐Fc (30 μg/ml) for 20 h, followed by real‐time PCR analysis for IL‐22 and IL‐17a mRNA expression.
- Splenocytes were treated with Fc (30 μg/ml) or mBTNL2‐Fc (30 μg/ml) for the indicated times and followed by immunoblot analysis of indicated protein expression.
Data information: All data are mean ± s.e.m. NS, not significant. *P < 0.05, **P < 0.01, ***P < 0.001, ****P < 0.0001 based on two‐tailed Student's t‐test for (B–G) and one‐way ANOVA (H). Each dot represents one repetition, n = 6 (B–E, G, H). Each dot represents one mouse, n = 12 for the Fc group and n = 14 for the mBTL2‐Fc group (F). Data are representative of three biological replicates (A, E, G–I). Pooled data from three biological replicates were shown as (B–D, F).
Source data are available online for this figure.
Figure EV3. Schematic diagram of flow cytometry.
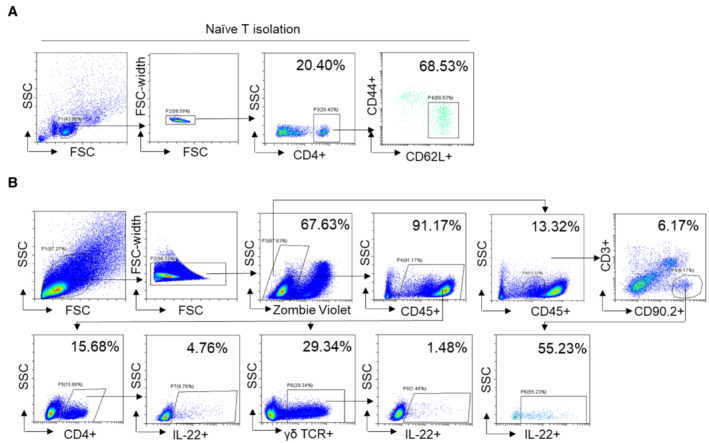
- Schematic diagram of FACS sorted CD4+CD44−CD62L+Naïve CD4+ T cells from splenocytes.
- Schematic diagram of CD45MedCD3−CD90.2+IL‐22+ ILC3s, CD45+CD4+ IL‐22+ CD4+ T cells, and CD45+ γδ+ IL‐22+ γδ T cells in mouse colonic LPLs analyzed by flow cytometry.
mBTNL2‐Fc has a therapeutic effect on mouse colitis and infection models
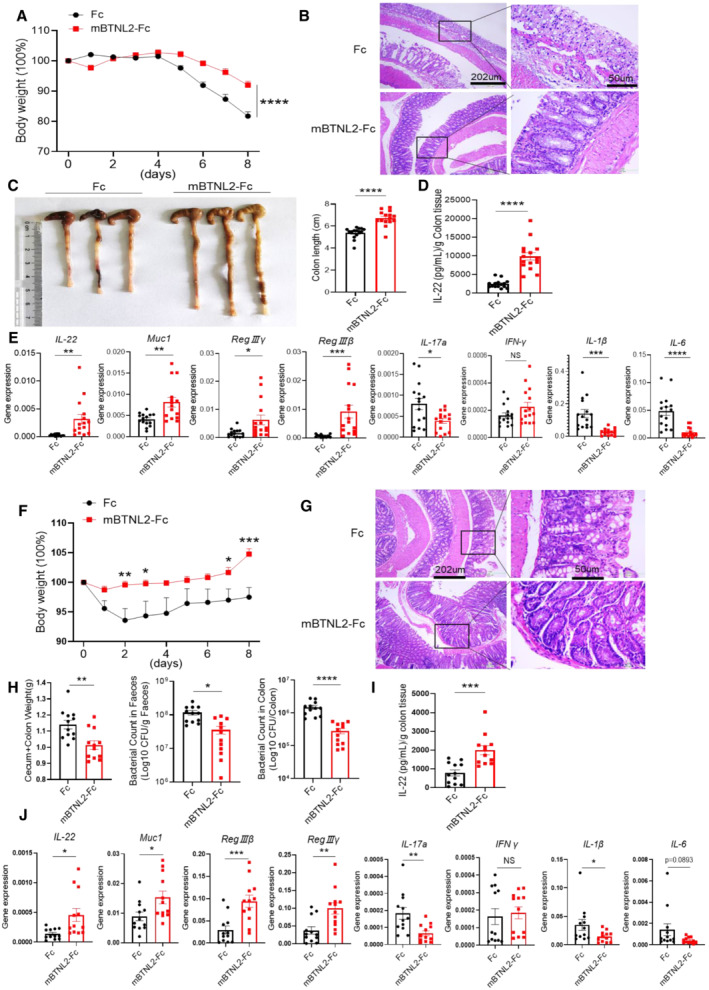
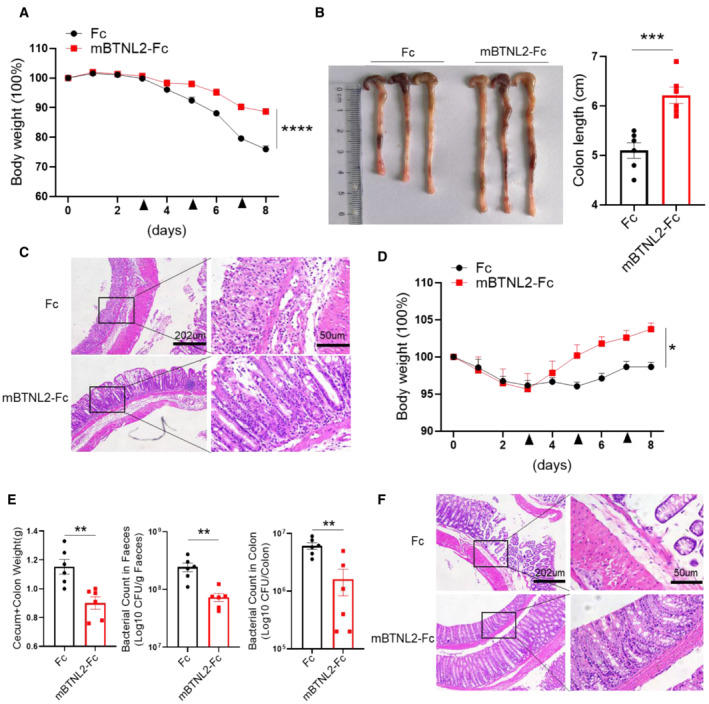
It was reported that mBTNL2‐Fc has therapeutic effects on graft‐versus‐host disease (GVHD) and type I diabetes (Cui et al, 2019; Tian et al, 2019). We found that the mBTNL2‐Fc recombinant protein promoted IL‐22 production in vitro and in vivo, and it was reported that IL‐22 had a protective effect against colitis and certain bacterial infections (Ouyang et al, 2011; Mielke et al, 2013; Guo et al, 2014; Sabat et al, 2014). Therefore, we explored whether the mBTNL2‐Fc recombinant protein had any therapeutic effect on colitis and bacterial infection. Strikingly, mBTNL2‐Fc had a significant therapeutic effect on colitis, which was manifested by weight loss, histological staining, and colon length (Fig 5A–C). Consistent with our former data, IL‐22 production from colonic tissue was significantly increased after mBTNL2‐Fc treatment compared with the control Fc treatment (Fig 5D and E). The gene expression levels of IL‐22 and its downstream target genes, such as Muc1, RegIIIβ, and RegIIIγ, were significantly increased in the colonic tissues after mBTNL2‐Fc treatment compared with Fc treatment, while the expression levels of proinflammatory genes, such as IL‐17a, IL‐6, and IL‐1β, were significantly reduced compared with the control treatment (Fig 5E). Consistent with the role of IL‐22 in the host defense against C. rodentium, we found that treatment with mBTNL2‐Fc significantly reduced the C. rodentium infection phenotype, including characteristics such as weight loss, histological staining, caecum and colon weight, and bacteria in feces or colon tissue (Fig 5F–H). IL‐22 protein and mRNA levels were also significantly increased after mBTNL2‐Fc treatment compared with control treatment (Fig 5I and J). The mRNA levels of Muc1, RegIIIβ, and RegIIIγ were significantly increased, while the proinflammatory cytokine genes IL‐17a, IL‐6, and IL‐1β were significantly reduced after mBTNL2‐Fc treatment compared with the control treatment (Fig 5J). To further clarify the therapeutic effect of the mBTNL2‐Fc recombinant protein on colitis and gut infection, we administered mBTNL2‐Fc 3 days after DSS‐induced colitis or C. rodentium infection. We found that mBTNL2‐Fc still had a protective effect on colitis and C. rodentium infection, which was manifested by weight loss, colon length, histological staining, and bacterial counts (Fig EV4A–F). Therefore, these data indicate that mBTNL2‐Fc has a therapeutic effect on colitis and C. rodentium infection due to the induction of IL‐22 production in the colon.
Figure 5. mBTNL2‐Fc has a therapeutic effect on mouse colitis and infection models.
-
A–CBody weight changes (A), representative histological images (B), and representative colon image (left) and colon length (right) (C) of wild‐type mice treated with Fc or mBTNL2‐Fc (ip. 50 μg/mouse) on days 0, 2, 4, and 6 during 2% DSS treatment were shown (n = 15).
-
DIL‐22 secreted by colonic tissues in (A) was measured by ELISA.
-
ERelative mRNA expression of IL‐22, RegIIIγ, RegIIIβ, Muc1, IL‐17a, IFN‐γ, IL‐1β, and IL‐6 from colonic tissues described in (A) was shown.
-
F, GBody weight changes (F) and representative histological images (G) of wild‐type mice treated with Fc or mBTNL2‐Fc (ip. 50 μg/mouse) on days 0, 2, 4, and 6 during C. rodentium infection (orally with 2 × 10⁹ colony‐forming units (CFU) of C. rodentium) were shown (n = 12).
-
HWeight of cecum and colon, bacterial titers in homogenates of fecal or colon from mice in (F) at day 9 after infection were shown.
-
IIL‐22 secreted by colonic tissues in (F) was measured by ELISA.
-
JRelative mRNA expression of IL‐22, RegIIIγ, RegIIIβ, Muc1, IL‐17a, IFN‐γ, IL‐1β, and IL‐6 of colonic tissue described in (F) was shown.
Data information: All data are mean ± s.e.m. NS, not significant. *P < 0.05, **P < 0.01, ***P < 0.001, ****P < 0.0001 based on two‐way ANOVA for (A) and two‐tailed Student's t‐test for (C–F, H–J). Each dot represents one repetition, n = 15 (A, C–E), n = 12 (F, H–J). Data are representative of three biological replicates (B, left panel of C, G). Pooled data from three biological replicates are shown in (A), right panel of (C, D–F, H–J).
Source data are available online for this figure.
Figure EV4. BTNL2 has a protective role in mice colitis and C. rodentium infection after disease's onset.
-
A–CBody weight changes (A), representative colon image (left) and colon length (right) (B), and representative histological images (C) of wild‐type mice treated with Fc or mBTNL2‐Fc (ip. 50 μg/mouse) at day 3, 5, and 7 during DSS treatment were shown (n = 6).
-
DBody weight changes in wild‐type mice treated with Fc or mBTNL2‐Fc (ip. 50 μg/mouse) at day 3, 5, and 7 during C. rodentium infection were shown (n = 6).
-
E, FWeight of cecum and colon, bacterial titers in homogenates of fecal or colon (E) and representative histological images (F) from mice in (D) at day 9 after infection were shown (n = 6).
Data information: All data are mean ± s.e.m. NS, not significant. *P < 0.05, **P < 0.01, ***P < 0.001, ****P < 0.0001 based on two‐way ANOVA for (A, D) and two‐tailed Student's t‐test for (B, E). Each dot represents one repetition, n = 6.
Source data are available online for this figure.
Anti‐BTNL2 mAb has a therapeutic effect on mouse colonic tumorigenesis
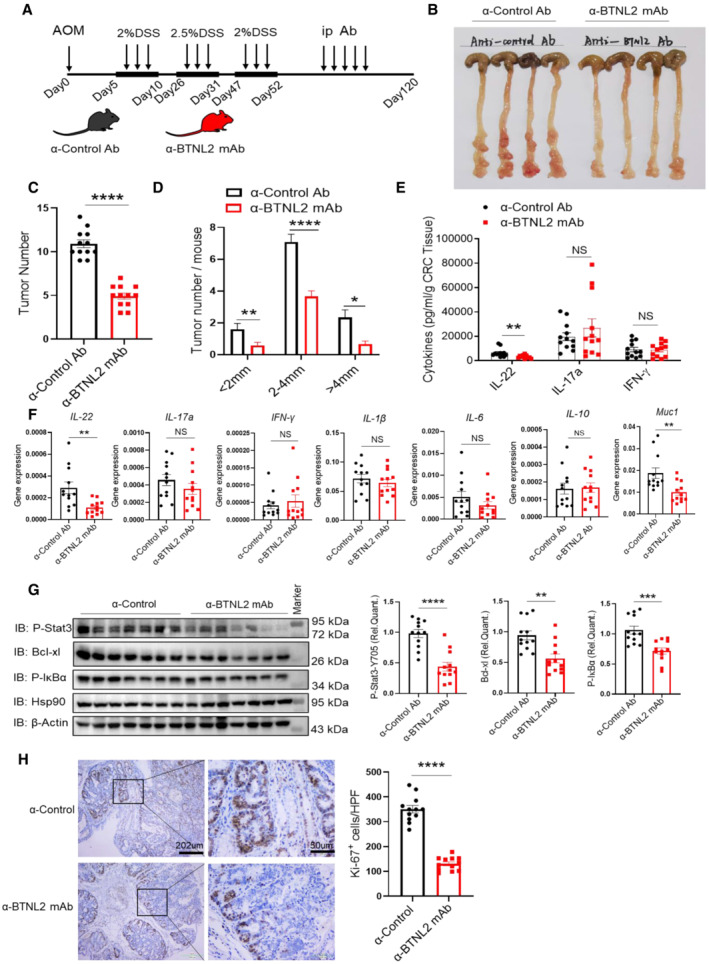
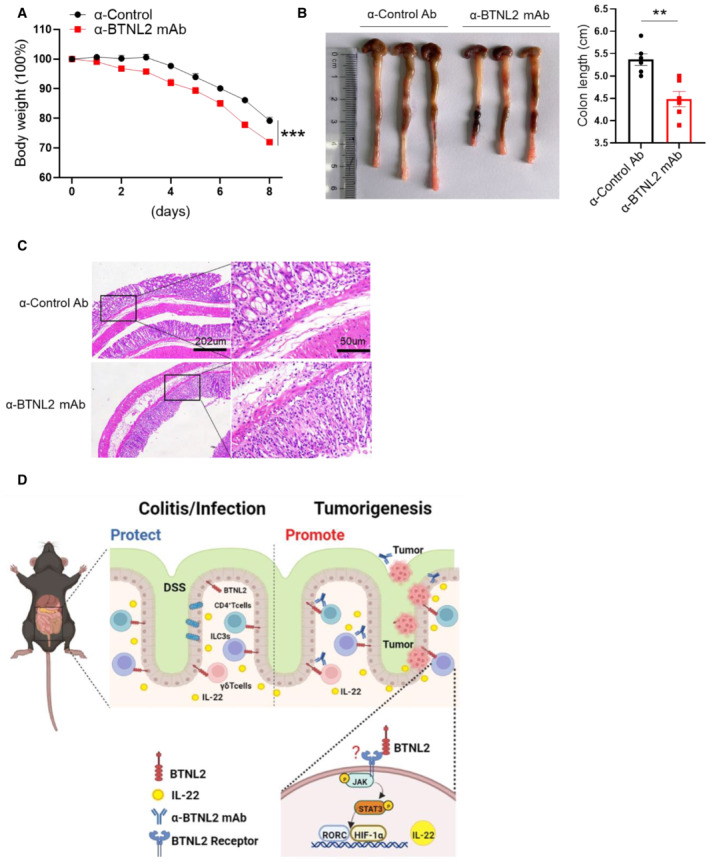
It was reported that IL‐22 had a tumorigenic capacity in colon tissues (Huber et al, 2012; Kirchberger et al, 2013). In our previous study, we screened an anti‐BTNL2 blocking mAb that inhibited the binding of BTNL2 to its receptor on T cells (Du et al, 2022). Therefore, we explored whether the anti‐BTNL2 mAb had any therapeutic effect on mouse colonic tumors. We found that anti‐BTNL2 mAb significantly reduced tumor burden compared with control Ab treatment by measuring tumor number and size (Fig 6A–D). Consistently, IL‐22 protein and mRNA levels were significantly reduced after anti‐BTNL2 mAb treatment compared with control Ab treatment (Fig 6E and F). However, the expression of IL‐17a and IFN‐γ did not show significant changes (Fig 6E and F). The expression of other inflammatory factors, such as IL‐1β, IL‐6, and IL‐10, did not show any significant changes (Fig 6F). IL‐22 activates STAT3, the NF‐κB signaling pathway, and Bcl‐xl, the survival signaling pathway; we found that anti‐BTNL2 mAb treatment significantly reduced P‐Stat3, Bcl‐xl, and P‐IκBα expression levels in the tumor tissues compared with the control Ab treatment (Fig 6G). Consistent with the finding of reduced STAT3 and NF‐κB signaling pathway activation after anti‐BTNL2 mAb treatment, Ki‐67 staining was also significantly reduced after anti‐BTNL2 mAb treatment compared with the control Ab treatment (Fig 6H). In addition, we found that the colitis phenotype was aggravated after anti‐BTNL2 mAb treatment compared with control Ab treatment in the DSS‐induced colitis model, which was manifested by weight loss, colon length, and histological staining (Fig EV5A–C). These data suggest that the blockage of BTNL2 may result in the susceptibility of patients to colitis in clinical applications. Together, these data indicate that BTNL2 blockade has a therapeutic effect on mouse colonic tumors.
Figure 6. Anti‐BTNL2 mAb has a therapeutic effect on mouse colonic tumorigenesis.
-
AIsotype rat IgG1 control Ab or anti‐BTNL2 mAb (200 μg/mouse) were injected intraperitoneally three times a week after the last round of DSS treatment, and arrows represent the treatment time of AOM/DSS, anticontrol Ab or BTNL2 mAb.
-
B–DRepresentative colonic tumor burden (B), tumor number (C), and tumor size per mouse (D) that described in (A) were shown (n = 12).
-
EIL‐22, IL‐17a, and IFN‐γ secreted by infiltrating cells in tumor that described in (A) were measured by ELISA.
-
FRelative mRNA expression of IL‐22, IL‐17a, IFN‐γ, IL‐1β, IL‐6, IL‐10, and Muc1 of colonic tumor described in (A) was shown.
-
GRepresentative immunoblot images (left) and quantification analysis of P‐Stat3, Bcl‐xl, P‐IκBα protein (right) expression of tumor described in (A) were shown.
-
HQuantity of Ki67+ cells in tumors and representative histology images that described in (A) were shown. Ki67 expression was analyzed in average number of four high‐power field (HPF).
Data information: All data are mean ± s.e.m. NS, not significant. *P < 0.05, **P < 0.01, ***P < 0.001, ****P < 0.0001 based on two‐tailed Student's t‐test for (C–H). Each dot represents one mouse, n = 12. Data are representative of three biological replicates (B, left panel of G). Pooled data from three biological replicates are shown in (C–F), right panel of (G) and (H).
Source data are available online for this figure.
Figure EV5. Anti‐BTNL2 mAb aggravates DSS‐induced colitis in mice.
-
A–CBody weight changes (A), representative colon image (left) and colon length (right) (B), and representative histological images (C) of wild‐type mice treated with Isotype rat IgG1 control Ab or anti‐BTNL2 mAb (ip. 200 μg/mouse) at day 0, 2, 4, and 6 during DSS treatment were shown (n = 6). Data information: All data are mean ± s.e.m. **P < 0.01, ***P < 0.001 based on two‐way ANOVA for (A) and two‐tailed Student's t‐test for (B). Each dot represents one repetition, n = 6.
-
DSummary schematic. BTNL2 acts on Group 3 innate lymphoid cells (ILC3s), CD4+ T cells, and γδ T cells in the gut to produce IL‐22 through JAK‐STAT3‐HIF‐1α/RORC pathway, and a monoclonal antibody blocking BTNL2 attenuates colorectal tumorigenesis in mice by attenuating IL‐22 production in the gut.
Source data are available online for this figure.
BTNL2 expression correlates with IL‐22 in human colorectal cancer
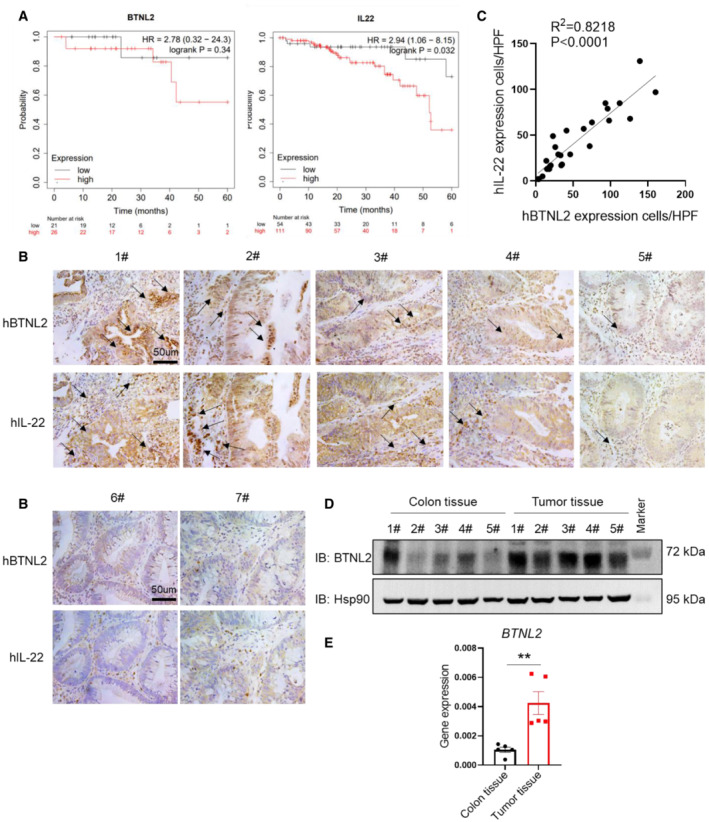
Our previous study showed that BTNL2 is widely expressed in a variety of human oncologic samples, and patients with lung adenocarcinoma and colon adenocarcinoma that expressed low levels of BTNL2 had significantly improved survival compared to those expressing high levels of BTNL2 (Du et al, 2022). However, the functional mechanism of BTNL2 in colon cancer is still unclear. In this study, we found that BTNL2 affects the progression of colorectal cancer by regulating IL‐22 production. Through database analysis (Kaplan–Meier, https://kmplot.com/analysis/), we found that the 5‐year survival rate of colorectal cancer patients with higher BTNL2 expression was lower than that of patients with lower BTNL2 expression. Interestingly, the patients with higher IL‐22 expression also had a lower 5‐year survival rate than the patients with lower IL‐22 expression (Fig 7A). Via histological analysis, we found that the expression of BTNL2 was highly correlated with IL‐22 expression in colorectal cancer specimens (Fig 7B and C), which is consistent with our findings from a mouse study. In addition, we found that the expression levels of BTNL2 and IL‐22 were quite low in the samples collected from two noncancer patients (colon polyps; Fig 7B, lower panel). Consistently, we found that the protein and RNA levels of BTNL2 were increased in DSS+AOM‐induced tumor tissues compared with normal colon tissues in a mouse colorectal tumor model (Fig 7D and E). Thus, BTNL2 may affect the progression of human colon cancer by regulating IL‐22, and these data suggest that BTNL2 may be a potential therapeutic target for colorectal cancer and could also be used as a biomarker for colorectal cancer.
Figure 7. BTNL2 expression correlates with IL‐22 in human colorectal cancer samples.
-
ASurvival of patients with colorectal cancer from Kaplan–Meier database was analyzed (https://kmplot.com/analysis/). Left panel of (A) were representative of 150 technical replicates, and right panel of (A) were representative of 499 technical replicates.
-
B, CQuantification analysis of BTNL2 and IL‐22 protein expression and representative histology images in human colorectal cancer specimens (1#–5#) and human colon polyp specimens (6#–7#) were shown. Number of cells expressed BTNL2 or IL‐22 was analyzed in high‐power field (HPF); arrows indicate cells expressed BTNL2 or IL‐22 (B). Correlation analysis of BTNL2 and IL‐22 expression in human colorectal cancer specimens by counting the number of positive cells in the same HPF was shown (C). Each dot represents one colorectal cancer specimen (n = 26).
-
D, EExpression of BTNL2 in normal colon tissue or DSS+AOM‐induced tumor tissue was measured by immunoblot (D) and real‐time PCR (E) (n = 5).
Data information: All data are mean ± s.e.m. NS, not significant. **P < 0.01 based on two‐tailed Student's t‐test for (E). Each dot represents one mouse, n = 5.
Source data are available online for this figure.
Discussion
In this study, we showed that BTNL2 is a critical regulator of IL‐22 production in the colonic tract and that targeting BTNL2 showed a therapeutic effect on colonic tumorigenesis by regulating IL‐22 production (Fig EV5D). It was reported that polymorphisms of the BTNL2 gene were related to susceptibility to many human diseases such as lung and colon adenocarcinoma, IBD, and psoriasis (Arnett et al, 2007; Franke et al, 2008; Silverberg et al, 2009; Shiraishi et al, 2012, 2016; Prescott et al, 2015; Lebrero‐Fernandez et al, 2016; Cui et al, 2019; Tian et al, 2019). One of the possible reasons for the susceptibility of the BTNL2 gene to diseases may be due to altered IL‐22 expression, because IL‐22 is known to play an essential role in human cancer and autoimmune diseases (Ouyang et al, 2011; Sabat et al, 2014). BTNL2‐Fc recombinant protein was shown to have a therapeutic effect on type I diabetes and graft‐versus‐host disease (GVHD; Cui et al, 2019; Tian et al, 2019). These findings can be also explained by the induction of IL‐22 by BTNL2, because IL‐22 is known to have a protective role against type I diabetes and GVHD (Sabat et al, 2014).
In our previous study, we found that BTNL2 promoted IL‐17A production and γδ T cell differentiation and recruited MDSCs for T cell inhibition (Du et al, 2022). However, we did not find significant IL‐17A level changes in the current in situ colonic tumor model. One of the possible reasons may be that we predominantly employed a subcutaneous tumor model in our previous study; that is, the functional mechanisms of BTNL2 in different tumor models could vary because the cellular composition in the tumor microenvironment (TME) is quite different between subcutaneous tumors and in situ colonic tumors. For example, the ILC3 cell population is only present in in situ colonic tumors and is absent in the subcutaneous tumor microenvironment, and ILC3s are known to produce large amounts of IL‐22 in the gut. Another possibility may be due to different tumor types because we mainly employed a lung adenocarcinoma model in our previous study, and this study was an in situ, colonic tumor model. Again, the functional role of BTNL2 in a variety of tumor types could be different.
In this study, we showed that BTNL2 is a critical regulator of IL‐22 production in the colonic tract. Interestingly, we found that BTNL2 promotes mouse colorectal tumorigenesis while protecting mice from colitis or C. rodentium infection. The contradictory phenotypes of promoting tumorigenesis and protection from colitis and bacterial infection of BTNL2 are actually consistent with the role of BTNL2 in the regulation of IL‐22 in the intestinal system because IL‐22 showed the same phenotype in tumorigenesis and colitis/antibacterial infections. One of the major mysteries of the current study is the molecular mechanism by which BTNL2 regulates IL‐22 production. IL‐6 and IL‐23 drive IL‐22 production via Th17 cells, and it has been reported that IL‐23 drives CD8+ T cells, γδ T cells, and natural killer T (NKT) cells producing IL‐22, and IL‐12 drives Th1 cells producing IL‐22 (Wolk et al, 2002; Witte et al, 2010; Rutz et al, 2011; Hijnen et al, 2013). This is the first time that we found that a membrane protein, BTNL2, could promote IL‐22 production through the JAK‐STAT3 signaling pathway. Although the exact signaling transduction induced by BTNL2 is still unknown, one possibility is that after BTNL2 ligation, an unknown receptor on the cell membrane directly recruits Jak kinases to activate STAT3, and activated STAT3 upregulates RORC expression together with HIF‐1α. Therefore, the receptors that activate Jak kinases may be good candidates for searching for the receptor of BTNL2.
One obvious question is how does BTNL2 promote IL‐22 expression? What is the cognate receptor of BTNL2 on T cells, and which signaling pathway is activated after BTNL2 ligation? We found that BTNL2 could act on ILC3s, CD4+ T cells, and γδ T cells in the production of IL‐22. However, does BTNL2 bind to the same receptor on these different cell types, or does it have different receptors on different cells? These questions need to be further investigated in the future to further understand the functional role of BTNL2 in antitumor immune escape.
Materials and Methods
Clinical specimens
Cancer samples were remaining specimen obtained from patients with colorectal cancer who underwent surgical resection at the Department of Gastroenterology, Renmin Hospital of Wuhan University. All samples were anonymously coded in accordance with local ethical guidelines (as stipulated by the Declaration of Helsinki and the Department of Health and Human Services Belmont Report). These studies were conducted according to the Declaration of Helsinki and informed consent was obtained from all subjects and the experiments conformed to the principles set out in the WMA Declarations of Helsinki and the Department of Health and Human Services Belmont Report, and the protocols were approved by the Review Board of the Renmin Hospital of Wuhan University (Approval No: WDRY2022‐K251).
Mice
BTNL2‐KO mice were made by Cyagen Biosciences Inc. by Crispr‐cas9, and the design strategy was shown in the literature (Du et al, 2022). Female or male BTNL2‐KO mice were C57BL/6 background. Six‐ to eight‐week‐old female or male C57BL/6 mice were obtained from Beijing Vital River Laboratory Animal Technology Co., Ltd. Mice used in our experiments were housed in specific pathogen‐free (SPF) condition, the ambient temperature is between 20 and 25°C, the humidity is between 40 and 70%, and the environmental light/dark cycle is 12 h light and 12 h dark. All mice were euthanized after experiments. The experimental protocol was approved by the Institutional Animal Care and Use Committee of Tongji Medical College, Huazhong University of Science & Technology (reference number s909). All animal experiments were carried out in compliance with the ethical regulations.
Reagents
A rat‐anti‐mouse BTNL2 monoclonal antibody was made by Atagenix company (Du et al, 2022). Isotype control rat IgG1 antibody was bought from R&D Systems (Clone 43414R, cat no. MAB005R). Anti‐BTNL2 monoclonal antibody for IHC was made by Atagenix company. Anti‐β‐Actin (1:1,000, clone C4, cat no. sc‐47778) and anti‐HSP90 (1:1,000, clone F‐8, cat no. sc‐13119) antibodies were bought from SANT CRUZ. The antibodies of anti‐p‐IκBα antibody (Cell Signaling Technology, 2859), anti‐p‐STAT3 antibody (Cell Signaling Technology, 9145), and anti‐p‐Jak2 antibody (3771) for western blot were bought from Cell Signaling Technology. Anti‐Bcl‐xl antibody and anti‐p‐JAK2 antibody were bought from ABclonal (cat no. A0209 and AP0373). Flow antibodies of anti‐CD4 (clone RM4‐5, cat no. 100510), anti‐IL‐22 (clone of Poly5164, cat no. 516404), anti‐γδ TCR (clone GL3, cat no. 118116), anti‐CD45 (clone of 30‐F11, cat no. 103116), anti‐CD16/32 (clone 93, cat no. 101302), anti‐CD3 (clone 17A2, cat no. 100203), and anti‐CD90.2 (clone of 30‐F11, cat no. 105311) were bought from Biolegend. Zombie Violet Fixable Viability kit and Cell Activation Cocktail (with Brefeldin A) were bought from Biolegend (cat no. 423114 and 423304). Mouse IL‐22, IL‐17, and IFN‐γ ELISA kits were bought from Biolegend (cat no. 436304, 432504 and 430807). pINFUSE‐hIgG2‐Fc2 vector was bought from Invivogen (cat no. pfc2‐hgin2). Recombinant murine IL‐23 proteins were bought from Sino Biological (cat no. CT028‐M08H). Stattic (HY‐13818), SR1001 (HY‐13421), PX‐478 (HY‐10231), and Ruxolitinib (HY‐50856) were bought from MCE.
Cells
HEK293T cells were maintained in DMEM medium plus 10% FBS and 1% Penicillin–Streptomycin. Cells were maintained and amplified in CO2 incubator in a condition of 37°C, 5% CO2. 293F cells were maintained in GIBCO FreeStyle 293 Expression Medium (Thermo Fisher, cat no. 12338026) and were maintained and amplified in CO2 shaking incubator in a condition of 37°C, 5% CO2, 130 rpm.
Preparation of murine BTNL2‐Fc and IL‐22‐Fc recombinant proteins
The cDNA sequence coding the murine extracellular portion of BTNL2 protein (aa 27–452) was PCR amplified and subcloned into pINFUSE‐hIgG2‐Fc2 vector (Invivogen, cat no. pfc2‐hgin2) backbone with a human IgG2 Fc tag. The cDNA sequence coding for murine extracellular portion of IL‐22 protein (aa 1–179) was PCR amplified and subcloned into pINFUSE‐hIgG2‐Fc2 vector. The BTNL2‐Fc or IL‐22‐Fc expression vector was transiently transfected into 293F cells by using FectoPRO transfection reagent from PolyPlus company according to the manufacturer's instruction (cat no. 116‐040). Five to six days after transfection, cell supernatants were harvested and purified by affinity chromatography with protein A in accordance with the manufacturer's purification system. SDS–PAGE and Coomassie blue staining were used to analyze the protein preparation, which showed only one major band at the predicted molecular weight.
Immunohistochemistry
Formalin‐fixed tumor or colon tissue samples were sent to the company (Servicebio) for paraffin embedding, sectioning, hematoxylin–eosin (HE) staining. After blocking with DAKO's block buffer, avidin/biotin block, sections were incubated with anti‐IL‐22 antibody (Servicebio, cat no. GB11259) or anti‐BTNL2 antibody (anti‐BTNL2 monoclonal antibody made by Atagenix company) for 1 h at room temperature. After incubation with biotin‐conjugated goat anti‐mouse/rabbit IgG secondary antibody and streptavidin‐HRP, positive signals were visualized by DAB kit (BD pharmingen) and counterstained with Harris hematoxylin (Fisher Scientific).
Flow cytometry
Mice lamina propria lymphocytes (LPLs) were isolated, and single‐cell suspensions in T cell culture medium (RPMI‐1640, 10% FBS, 1% Penicillin–Streptomycin, 1% Sodium pyruvate, 0.5% β‐mercaptoethanol) were stimulated with Cell Activation Cocktail (with Brefeldin A) for 4 h (for intracellular staining). After stimulation, cells were incubated with anti‐CD16/CD32 (Biolegend) before staining with fluorochrome‐conjugated monoclonal antibodies. Cell surface staining was done for 30 min at 4°C. Intracellular staining was done using a fixation/permeabilization kit (Biolegend). Zombie Violet Fixable Viability kit (1:400; Biolegend) was added to exclude dead cells. Flow cytometry data analysis was performed by using CytExpert. General flow cytometry gating strategy is shown in Fig EV3B.
ELISA
Colonic tumors or colonic tissues (tumors or tissues were cut into small pieces with approximately 50 mm3 per piece and 3–4 pieces per 48‐well) were cultured in 0.5 ml RPMI medium containing 10% fetal bovine serum (FBS) and antibiotics overnight. Supernatants were collected, centrifuged, and analyzed with a murine IL‐22, IL‐17A, and IFN‐γ ELISA kit. Cytokine concentration was normalized to the weight of tumours or colonic tissues in each well.
Lamina propels lymphocyte isolation and cell in vitro stimulation
Mice were sacrificed, and their small intestines or colons were removed and placed in cold DMEM medium plus 1% Penicillin–Streptomycin. After removing any remaining fat tissues and Peyer's patches, samples were flushed by RPMI‐1640 medium plus 10% FBS, 1% Penicillin–Streptomycin, 1% Sodium pyruvate and then cut open longitudinally, and then cut into about 0.5 cm pieces. Samples were shaken at 37°C for 40 min in RPMI‐1640 medium containing 1 mM EDTA and 1 Mm DTT and then pass through 70 μm filter, and the filtrate cells were intestinal epithelium cells (IECs). For LPLs isolation, the filter remaining intestines or colons tissue samples were minced and transferred to 12‐well plate (Jet Biofil) digested in DMEM containing 2 mg/ml collagenase I (Gibicol) and 0.2 mg/ml DNase I (Biofroxx) for 30 min at 37°C, then grinded, and filtered into 50‐ml tubes (Jet Biofil). After centrifugation, cells were resuspended to 40%/80% Percoll density gradient separation. LPLs at the interphase of the two Percoll solutions were collected and resuspended in 1 × PBS for counting, staining, culture, and/or sorting. FACS sorted naïve CD4+ T cells, CD4+ T cells, γδ T cells, and ILC3 from spleen or LPLs. CD8+ T cells were isolated from the spleen using EasySep Mouse CD8+ T cell Isolation Kit (cat no. 19853). Naïve CD4+ T cells differentiated into Th17 or Th22 for 3 days in the presence of anti‐CD3 (0.5 μg/ml), anti‐CD28 (1 μg/ml), anti‐IL‐4 (5 μg/ml), anti‐IFN‐γ (5 μg/ml), IL‐6 (20 ng/ml), and TGF‐β (2 ng/ml) or TNF‐α (50 ng/ml). LPLs, CD4+ T cells, γδ T cells, CD8+ T cells, ILC3, naïve CD4+ T cells, Th17, and Th22 were cultured with plate‐coated Fc or mBTNL2‐Fc recombinant proteins (30 μg/ml of recombinant proteins were coated on the plates at room temperature for 2 h) in IL‐23 (10 ng/ml). After 20 h of stimulation, IL‐22 concentrations were determined by ELISA.
Immunoblot
Colorectal tumor tissue was harvested and homogenated and then was lysed on ice in lysis buffer containing 0.5% Triton X‐100, 20 mM Hepes pH 7.4, 150 mM NaCl, 12.5 mM β‐glycerophosphate, 1.5 mM MgCl2, 10 mM NaF, 2 mM dithiothreitol, 1 mM sodium orthovanadate, 2 mM EGTA, 20 mM aprotinin, and 1 mM phenylmethylsulfonyl fluoride for 30 min, followed by centrifuging at 13,680 g for 15 min. 5 × loading buffer was added to the supernatant, followed by boiling for 10 min. Quantification analysis of immunoblot images was performed with Bio‐Rad Image Lab Software 5.2.
Real‐time PCR
Total RNA was extracted from colon tissue or colorectal tumor tissue with TRIzol (Invitrogen) according to the manufacturer's instructions. One microgram total RNA for each sample was reverse transcribed using the SuperScript® II Reverse Transcriptase from Thermo Fisher Scientific. The resulting complementary DNA was analyzed by real‐time PCR using SYBR Green Real‐Time PCR Master Mix. All gene expression results were expressed as arbitrary units relative to the expression of Actb. Real‐time PCR primers are listed in Table EV1.
DSS+AOM‐induced mice colorectal tumor models
Experiment colorectal tumors were induced with a single azoxymethane (AOM) injection and three repeated DSS administration. Eight to ten‐week‐old mice (BTNL2+/+ or BTNL2−/− littermates on C57BL/6 background) were injected intraperitoneal (i.p.) with AOM (Sigma‐Aldrich) dissolved in PBS at a dose of 10 mg/kg body weight. After 5 days of injection, mice were treated with 2% (w:v) DSS (M. M. 36,000–50,000 kDa; MP Biomedicals, LLC., 160110) in drinking water ad libitum for 5 days and then followed by regular water for 16 days. This process of DSS treatment was repeated for a total of 3 cycles and 2.5% DSS for the second treatment. The body weight was assessed at least 4 days per week throughout the course of the experiment. Mice were sacrificed 8 weeks after the last DSS cycle. Colons were removed and cut longitudinally and then flushed with 1 × PBS carefully to remove feces. All of the colon tumors were grossly counted, and each tumor was measured the largest dimension with sliding calipers in a blinded fashion. All tumors of mice were then categorized based on size (˂2 mm, 2–4 mm, or ˃4 mm). Part of representative tumors were fixed in 4% paraformaldehyde, embedded in paraffin for histology analysis. Another part of tumors was preparation for subsequent molecular biological experiments. The person who measured the tumor number and size/mice weight/colon length was blinded to the genotyping or treatment of the mice.
DSS‐induced colitis and C. rodentium infection models
For dextran sodium sulfate (DSS)‐induced colitis model, 8‐week‐old mice and littermates were subjected to DSS. From day 0, mice received drinking water with 2.5% DSS to induce acute colitis. After 8 days of treatment, mice were sacrificed and murine colon was removed and flushed carefully with 1 × PBS buffer. Colon length was measured. Body weights were assessed at the beginning of DSS treatment daily throughout the treatment. Fc/mBTNL2‐Fc (50 μg/per mouse)/mIL‐22‐Fc (5 μg/per mouse) was intraperitoneally injected on days 0, 2, 4, and 6 or 3, 5, and 7. For the C. rodentium infection model, C. rodentium strain DBS100 (ATCC51459; American Type Culture Collection) was prepared by shaking overnight at 37°C in Luria–Bertani broth. Bacterial cultures were serially diluted and plated on MacConkey agar plates, so the CFU dose administered could be confirmed. For infection model, mice were made to fast for 8 h before oral inoculation with 2 × 10⁹ CFU C. rodentium in a total volume of 100 μl per mouse. After 9 days of treatment, mice were sacrificed, and body weights were assessed at the beginning of infection and daily throughout the infection. Fc/mBTNL2‐Fc (50 μg/per mouse)/mIL‐22‐Fc (5 μg/per mouse) was intraperitoneally injected on days of 0, 2, 4, and 6 or 3, 5, and 7. Colons were removed aseptically, weighed, and homogenized in 1 × PBS. Homogenates were serially diluted and plated on MacConkey agar plates for determination of CFU counts. Citrobacter rodentium colonies (pink with white rings) were counted after overnight incubation at 37°C. Fecal specimens were collected, weighed, and homogenized in 1 × PBS, and then the CFU counts were determined.
Statistics
Statistical significance between two groups was determined by unpaired two‐tailed t‐test; multiple‐group comparisons were performed using one‐way ANOVA; the weight change curve was analyzed by two‐way ANOVA test for multiple comparisons. P < 0.05 was considered to be significant. Results are shown as mean and the error bar represents standard error of mean (s.e.m.) technical as indicated in the figure legend. For every figure, statistical tests are justified as appropriate. The data meet the assumptions of the tests. We use Kolmogorov–Smirnov (KS normality test) to assess the normal distribution. There is an estimate of variation within each group of data, and the variance is similar between the groups that are statistically compared. All the statistical analysis was done by using GraphPad Prism 8.02 software. Sample size estimation was based on former studies. No sample was excluded from the analysis. The number of times the experiment was replicated is stated in the figure legends, and whether data describe technical or biological replicates is stated in the figure legends.
Disclosure and competing interests statement
The authors declare that they have no conflict of interest.
Supporting information
Expanded View Figures PDF
Table EV1
Source Data for Expanded View
PDF+
Source Data for Figure 1
Source Data for Figure 2
Source Data for Figure 3
Source Data for Figure 4
Source Data for Figure 5
Source Data for Figure 6
Source Data for Figure 7
Acknowledgements
This investigation was supported by the grant from the Original Exploration Program of the National Natural Science Foundation of China (82150102, to CHW); the National Science Fund for Distinguished Young Scholars (82225029, to CHW); the National Key Research and Development Program of China (2020YFA0710700, to CHW); the Key Research and Development Program of Sichuan province (22ZDYF3738, to CHW); the Postdoctoral Foundation of China (2022M720658, to YYD, and 2022M720659 to RRH); the Sichuan Postdoctoral Innovation Plan (BX202202, to YYD); the Postdoctoral Foundation of Sichuan Provincial People's Hospital (2022BH01, to RRH and 2022BH07, to MY); the Postdoctoral Foundation of Sichuan Provincial (TB2022086, to RRH).
Author contributions
Qianwen Peng: Data curation; formal analysis; validation; investigation; methodology; project administration. Ting Pan: Data curation; formal analysis; validation; investigation; visualization; methodology; project administration. Ruirui He: Data curation; formal analysis; funding acquisition; validation; investigation; methodology. Ming Yi: Data curation; formal analysis; funding acquisition; validation; investigation. Lingyun Feng: Data curation; formal analysis; investigation; methodology. Zhihui Cui: Data curation; formal analysis; investigation; methodology. Ru Gao: Validation; investigation; methodology. Heping Wang: Data curation; investigation; methodology. Xiong Feng: Formal analysis; methodology. Hui Li: Data curation; formal analysis. Yuan Wang: Formal analysis; validation. Cun‐jin Zhang: Resources. Du Cheng: Resources; supervision. Yanyun Du: Data curation; formal analysis; supervision; validation; investigation. Chenhui Wang: Conceptualization; resources; data curation; formal analysis; supervision; funding acquisition; investigation; methodology; writing – original draft; writing – review and editing.
EMBO reports (2023) 24: e56034
Contributor Information
Du Cheng, Email: drchengdu@whu.edu.cn.
Yanyun Du, Email: yanyundu1@163.com.
Chenhui Wang, Email: wangchenhui@hust.edu.cn.
Data availability
This study includes no data deposited in external repositories.
References
- Andoh A, Zhang Z, Inatomi O, Fujino S, Deguchi Y, Araki Y, Tsujikawa T, Kitoh K, Kim‐Mitsuyama S, Takayanagi A et al (2005) Interleukin‐22, a member of the IL‐10 subfamily, induces inflammatory responses in colonic subepithelial myofibroblasts. Gastroenterology 129: 969–984 [DOI] [PubMed] [Google Scholar]
- Arnett HA, Escobar SS, Gonzalez‐Suarez E, Budelsky AL, Steffen LA, Boiani N, Zhang M, Siu G, Brewer AW, Viney JL (2007) BTNL2, a butyrophilin/B7‐like molecule, is a negative costimulatory molecule modulated in intestinal inflammation. J Immunol 178: 1523–1533 [DOI] [PubMed] [Google Scholar]
- Basu R, O'Quinn DB, Silberger DJ, Schoeb TR, Fouser L, Ouyang W, Hatton RD, Weaver CT (2012) Th22 cells are an important source of IL‐22 for host protection against enteropathogenic bacteria. Immunity 37: 1061–1075 [DOI] [PMC free article] [PubMed] [Google Scholar]
- Broadhurst MJ, Leung JM, Kashyap V, McCune JM, Mahadevan U, McKerrow JH, Loke P (2010) IL‐22+ CD4+ T cells are associated with therapeutic trichuris trichiura infection in an ulcerative colitis patient. Sci Transl Med 2: 60ra88 [DOI] [PubMed] [Google Scholar]
- Cui C, Tian X, Lin Y, Su M, Chen Q, Wang SY, Lai L (2019) In vivo administration of recombinant BTNL2‐Fc fusion protein ameliorates graft‐versus‐host disease in mice. Cell Immunol 335: 22–29 [DOI] [PMC free article] [PubMed] [Google Scholar]
- De Luca A, Zelante T, D'Angelo C, Zagarella S, Fallarino F, Spreca A, Iannitti RG, Bonifazi P, Renauld JC, Bistoni F et al (2010) IL‐22 defines a novel immune pathway of antifungal resistance. Mucosal Immunol 3: 361–373 [DOI] [PubMed] [Google Scholar]
- Du Y, Peng Q, Cheng D, Pan T, Sun W, Wang H, Ma X, He R, Zhang H, Cui Z et al (2022) Cancer cell‐expressed BTNL2 facilitates tumour immune escape via engagement with IL‐17A‐producing gammadelta T cells. Nat Commun 13: 231 [DOI] [PMC free article] [PubMed] [Google Scholar]
- Dumoutier L, Louahed J, Renauld JC (2000) Cloning and characterization of IL‐10‐related T cell‐derived inducible factor (IL‐TIF), a novel cytokine structurally related to IL‐10 and inducible by IL‐9. J Immunol 164: 1814–1819 [DOI] [PubMed] [Google Scholar]
- Fachi JL, Pral LP, Dos Santos JAC, Codo AC, de Oliveira S, Felipe JS, Zambom FFF, Camara NOS, Vieira P, Colonna M et al (2021) Hypoxia enhances ILC3 responses through HIF‐1alpha‐dependent mechanism. Mucosal Immunol 14: 828–841 [DOI] [PMC free article] [PubMed] [Google Scholar]
- Franke A, Balschun T, Karlsen TH, Sventoraityte J, Nikolaus S, Mayr G, Domingues FS, Albrecht M, Nothnagel M, Ellinghaus D et al (2008) Sequence variants in IL10, ARPC2 and multiple other loci contribute to ulcerative colitis susceptibility. Nat Genet 40: 1319–1323 [DOI] [PubMed] [Google Scholar]
- Gessner MA, Werner JL, Lilly LM, Nelson MP, Metz AE, Dunaway CW, Chan YR, Ouyang W, Brown GD, Weaver CT et al (2012) Dectin‐1‐dependent interleukin‐22 contributes to early innate lung defense against Aspergillus fumigatus . Infect Immun 80: 410–417 [DOI] [PMC free article] [PubMed] [Google Scholar]
- Guo X, Qiu J, Tu T, Yang X, Deng L, Anders RA, Zhou L, Fu YX (2014) Induction of innate lymphoid cell‐derived interleukin‐22 by the transcription factor STAT3 mediates protection against intestinal infection. Immunity 40: 25–39 [DOI] [PMC free article] [PubMed] [Google Scholar]
- Hijnen D, Knol EF, Gent YY, Giovannone B, Beijn SJ, Kupper TS, Bruijnzeel‐Koomen CA, Clark RA (2013) CD8+ T cells in the lesional skin of atopic dermatitis and psoriasis patients are an important source of IFN‐gamma, IL‐13, IL‐17, and IL‐22. J Invest Dermatol 133: 973–979 [DOI] [PMC free article] [PubMed] [Google Scholar]
- Huber S, Gagliani N, Zenewicz LA, Huber FJ, Bosurgi L, Hu B, Hedl M, Zhang W, O'Connor W Jr, Murphy AJ et al (2012) IL‐22BP is regulated by the inflammasome and modulates tumorigenesis in the intestine. Nature 491: 259–263 [DOI] [PMC free article] [PubMed] [Google Scholar]
- Kirchberger S, Royston DJ, Boulard O, Thornton E, Franchini F, Szabady RL, Harrison O, Powrie F (2013) Innate lymphoid cells sustain colon cancer through production of interleukin‐22 in a mouse model. J Exp Med 210: 917–931 [DOI] [PMC free article] [PubMed] [Google Scholar]
- Kisand K, Boe Wolff AS, Podkrajsek KT, Tserel L, Link M, Kisand KV, Ersvaer E, Perheentupa J, Erichsen MM, Bratanic N et al (2010) Chronic mucocutaneous candidiasis in APECED or thymoma patients correlates with autoimmunity to Th17‐associated cytokines. J Exp Med 207: 299–308 [DOI] [PMC free article] [PubMed] [Google Scholar]
- Kryczek I, Lin Y, Nagarsheth N, Peng D, Zhao L, Zhao E, Vatan L, Szeliga W, Dou Y, Owens S et al (2014) IL‐22+CD4+ T cells promote colorectal cancer stemness via STAT3 transcription factor activation and induction of the methyltransferase DOT1L. Immunity 40: 772–784 [DOI] [PMC free article] [PubMed] [Google Scholar]
- Lebrero‐Fernandez C, Wenzel UA, Akeus P, Wang Y, Strid H, Simren M, Gustavsson B, Borjesson LG, Cardell SL, Ohman L et al (2016) Altered expression of Butyrophilin (BTN) and BTN‐like (BTNL) genes in intestinal inflammation and colon cancer. Immun Inflamm Dis 4: 191–200 [DOI] [PMC free article] [PubMed] [Google Scholar]
- Longman RS, Diehl GE, Victorio DA, Huh JR, Galan C, Miraldi ER, Swaminath A, Bonneau R, Scherl EJ, Littman DR (2014) CX3CR1+ mononuclear phagocytes support colitis‐associated innate lymphoid cell production of IL‐22. J Exp Med 211: 1571–1583 [DOI] [PMC free article] [PubMed] [Google Scholar]
- Mielke LA, Jones SA, Raverdeau M, Higgs R, Stefanska A, Groom JR, Misiak A, Dungan LS, Sutton CE, Streubel G et al (2013) Retinoic acid expression associates with enhanced IL‐22 production by gammadelta T cells and innate lymphoid cells and attenuation of intestinal inflammation. J Exp Med 210: 1117–1124 [DOI] [PMC free article] [PubMed] [Google Scholar]
- Nguyen T, Liu XK, Zhang Y, Dong C (2006) BTNL2, a butyrophilin‐like molecule that functions to inhibit T cell activation. J Immunol 176: 7354–7360 [DOI] [PMC free article] [PubMed] [Google Scholar]
- Nurieva R, Yang XO, Martinez G, Zhang Y, Panopoulos AD, Ma L, Schluns K, Tian Q, Watowich SS, Jetten AM et al (2007) Essential autocrine regulation by IL‐21 in the generation of inflammatory T cells. Nature 448: 480–483 [DOI] [PubMed] [Google Scholar]
- Ouyang W, Rutz S, Crellin NK, Valdez PA, Hymowitz SG (2011) Regulation and functions of the IL‐10 family of cytokines in inflammation and disease. Annu Rev Immunol 29: 71–109 [DOI] [PubMed] [Google Scholar]
- Pickert G, Neufert C, Leppkes M, Zheng Y, Wittkopf N, Warntjen M, Lehr HA, Hirth S, Weigmann B, Wirtz S et al (2009) STAT3 links IL‐22 signaling in intestinal epithelial cells to mucosal wound healing. J Exp Med 206: 1465–1472 [DOI] [PMC free article] [PubMed] [Google Scholar]
- Prescott NJ, Lehne B, Stone K, Lee JC, Taylor K, Knight J, Papouli E, Mirza MM, Simpson MA, Spain SL et al (2015) Pooled sequencing of 531 genes in inflammatory bowel disease identifies an associated rare variant in BTNL2 and implicates other immune related genes. PLoS Genet 11: e1004955 [DOI] [PMC free article] [PubMed] [Google Scholar]
- Rankin LC, Girard‐Madoux MJ, Seillet C, Mielke LA, Kerdiles Y, Fenis A, Wieduwild E, Putoczki T, Mondot S, Lantz O et al (2016) Complementarity and redundancy of IL‐22‐producing innate lymphoid cells. Nat Immunol 17: 179–186 [DOI] [PMC free article] [PubMed] [Google Scholar]
- Rutz S, Noubade R, Eidenschenk C, Ota N, Zeng W, Zheng Y, Hackney J, Ding J, Singh H, Ouyang W (2011) Transcription factor c‐Maf mediates the TGF‐beta‐dependent suppression of IL‐22 production in T(H)17 cells. Nat Immunol 12: 1238–1245 [DOI] [PubMed] [Google Scholar]
- Rutz S, Eidenschenk C, Ouyang W (2013) IL‐22, not simply a Th17 cytokine. Immunol Rev 252: 116–132 [DOI] [PubMed] [Google Scholar]
- Sabat R, Ouyang W, Wolk K (2014) Therapeutic opportunities of the IL‐22‐IL‐22R1 system. Nat Rev Drug Discov 13: 21–38 [DOI] [PubMed] [Google Scholar]
- Satoh‐Takayama N, Vosshenrich CA, Lesjean‐Pottier S, Sawa S, Lochner M, Rattis F, Mention JJ, Thiam K, Cerf‐Bensussan N, Mandelboim O et al (2008) Microbial flora drives interleukin 22 production in intestinal NKp46+ cells that provide innate mucosal immune defense. Immunity 29: 958–970 [DOI] [PubMed] [Google Scholar]
- Schulz SM, Kohler G, Schutze N, Knauer J, Straubinger RK, Chackerian AA, Witte E, Wolk K, Sabat R, Iwakura Y et al (2008) Protective immunity to systemic infection with attenuated salmonella enterica serovar enteritidis in the absence of IL‐12 is associated with IL‐23‐dependent IL‐22, but not IL‐17. J Immunol 181: 7891–7901 [DOI] [PubMed] [Google Scholar]
- Shiraishi K, Kunitoh H, Daigo Y, Takahashi A, Goto K, Sakamoto H, Ohnami S, Shimada Y, Ashikawa K, Saito A et al (2012) A genome‐wide association study identifies two new susceptibility loci for lung adenocarcinoma in the Japanese population. Nat Genet 44: 900–903 [DOI] [PubMed] [Google Scholar]
- Shiraishi K, Okada Y, Takahashi A, Kamatani Y, Momozawa Y, Ashikawa K, Kunitoh H, Matsumoto S, Takano A, Shimizu K et al (2016) Association of variations in HLA class II and other loci with susceptibility to EGFR‐mutated lung adenocarcinoma. Nat Commun 7: 12451 [DOI] [PMC free article] [PubMed] [Google Scholar]
- Silverberg MS, Cho JH, Rioux JD, McGovern DP, Wu J, Annese V, Achkar JP, Goyette P, Scott R, Xu W et al (2009) Ulcerative colitis‐risk loci on chromosomes 1p36 and 12q15 found by genome‐wide association study. Nat Genet 41: 216–220 [DOI] [PMC free article] [PubMed] [Google Scholar]
- Sugimoto K, Ogawa A, Mizoguchi E, Shimomura Y, Andoh A, Bhan AK, Blumberg RS, Xavier RJ, Mizoguchi A (2008) IL‐22 ameliorates intestinal inflammation in a mouse model of ulcerative colitis. J Clin Invest 118: 534–544 [DOI] [PMC free article] [PubMed] [Google Scholar]
- Swanson RM, Gavin MA, Escobar SS, Rottman JB, Lipsky BP, Dube S, Li L, Bigler J, Wolfson M, Arnett HA et al (2013) Butyrophilin‐like 2 modulates B7 costimulation to induce Foxp3 expression and regulatory T cell development in mature T cells. J Immunol 190: 2027–2035 [DOI] [PubMed] [Google Scholar]
- Tian X, Lin Y, Cui C, Su M, Lai L (2019) BTNL2‐Ig protein attenuates type 1 diabetes in non‐obese diabetic (NOD) mice. Adv Healthc Mater 8: e1800987 [DOI] [PMC free article] [PubMed] [Google Scholar]
- Wilson MS, Feng CG, Barber DL, Yarovinsky F, Cheever AW, Sher A, Grigg M, Collins M, Fouser L, Wynn TA (2010) Redundant and pathogenic roles for IL‐22 in mycobacterial, protozoan, and helminth infections. J Immunol 184: 4378–4390 [DOI] [PMC free article] [PubMed] [Google Scholar]
- Witte E, Witte K, Warszawska K, Sabat R, Wolk K (2010) Interleukin‐22: a cytokine produced by T, NK and NKT cell subsets, with importance in the innate immune defense and tissue protection. Cytokine Growth Factor Rev 21: 365–379 [DOI] [PubMed] [Google Scholar]
- Wolk K, Kunz S, Asadullah K, Sabat R (2002) Cutting edge: immune cells as sources and targets of the IL‐10 family members? J Immunol 168: 5397–5402 [DOI] [PubMed] [Google Scholar]
- Wolk K, Kunz S, Witte E, Friedrich M, Asadullah K, Sabat R (2004) IL‐22 increases the innate immunity of tissues. Immunity 21: 241–254 [DOI] [PubMed] [Google Scholar]
- Zenewicz LA, Yancopoulos GD, Valenzuela DM, Murphy AJ, Stevens S, Flavell RA (2008) Innate and adaptive interleukin‐22 protects mice from inflammatory bowel disease. Immunity 29: 947–957 [DOI] [PMC free article] [PubMed] [Google Scholar]
- Zenewicz LA, Yin X, Wang G, Elinav E, Hao L, Zhao L, Flavell RA (2013) IL‐22 deficiency alters colonic microbiota to be transmissible and colitogenic. J Immunol 190: 5306–5312 [DOI] [PMC free article] [PubMed] [Google Scholar]
- Zheng Y, Valdez PA, Danilenko DM, Hu Y, Sa SM, Gong Q, Abbas AR, Modrusan Z, Ghilardi N, de Sauvage FJ et al (2008) Interleukin‐22 mediates early host defense against attaching and effacing bacterial pathogens. Nat Med 14: 282–289 [DOI] [PubMed] [Google Scholar]
- Zhou F, Cao H, Zuo X, Zhang T, Zhang X, Liu X, Xu R, Chen G, Zhang Y, Zheng X et al (2016) Deep sequencing of the MHC region in the Chinese population contributes to studies of complex disease. Nat Genet 48: 740–746 [DOI] [PubMed] [Google Scholar]


