Abstract
Acute myeloid leukemia (AML) is a hematopoietic malignancy with poor prognosis and limited treatment options. Here we provide a comprehensive census of the bone marrow immune microenvironment in adult and pediatric patients with AML. We characterize unique inflammation signatures in a subset of AML patients, associated with inferior outcomes. We identify atypical B cells, a dysfunctional B-cell subtype enriched in patients with high-inflammation AML, as well as an increase in CD8+GZMK+ and regulatory T cells, accompanied by a reduction in T-cell clonal expansion. We derive an inflammation-associated gene score (iScore) that associates with poor survival outcomes in patients with AML. Addition of the iScore refines current risk stratifications for patients with AML and may enable identification of patients in need of more aggressive treatment. This work provides a framework for classifying patients with AML based on their immune microenvironment and a rationale for consideration of the inflammatory state in clinical settings.
AML is the most common acute leukemia in adults and accounts for approximately 15% of acute leukemias in children. Despite the approval of multiple targeted therapies, treatment options remain limited and survival is dismal1. The bone marrow (BM) microenvironment plays an important role in supporting myeloid cell transformation and the clonal outgrowth of AML. Disease progression is accompanied by changes in the BM mesenchymal niche2; however, the immune response to AML establishment and progression in the BM has not been thoroughly characterized.
Inflammation is one of the hallmarks of cancer3 and is associated with many types of solid malignancies4. In AML, inflammation has been linked to progression from myelodysplastic syndrome to AML5. Additionally, it was shown that inflammatory cytokines can regulate hematopoietic stem cells (HSCs) and promote disease progression in animal models6. Furthermore, several mutations in genes associated with myeloid malignancies have been shown to render HSCs more susceptible to inflammation7. As AML is a disease prevalent mainly in older individuals, age-induced inflammation may contribute to AML development in elderly patients. In solid malignancies, inflammation is often associated with a unique immune microenvironment and can affect response to immunotherapy and patient prognosis8; however, the effects of inflammation on the composition of the BM immune microenvironment and clinical outcomes in AML have not been demonstrated. In addition, attempts to target immune cell function in AML have so far yielded only modest results9,10, highlighting the need for further understanding of the AML immune microenvironment and the role of inflammation in AML.
Recent advances in single-cell technologies have facilitated generation of high-resolution maps of healthy tissues and malignancies11–14. These cell atlases have led to important insights into disease development, as well as identification of new therapeutic targets. In AML, single-cell RNA sequencing (scRNA-seq) of adult AML BM samples has revealed distinct differentiation hierarchies and connected them to specific oncogenic drivers15. Moreover, single-cell DNA sequencing, combined with single-cell epitope quantification, has yielded insights into clonal evolution of AML and identified surface markers associated with specific mutations16. Here we apply scRNA-seq and combined indexing of transcriptomes and epitopes sequencing (CITE-seq)17 to adult and pediatric AML BM patient samples and provide a detailed characterization of both malignant and microenvironment cells in adult and pediatric patients. Our analysis identifies a subset of adult and pediatric patients expressing high levels of inflammatory genes in malignant cells. Furthermore, characterization of the BM immune microenvironment demonstrates distinct remodeling of the BM in response to AML-driven inflammation, highlighting specific B-cell and T-cell populations that are expanded in high-inflammation patients. Collectively, these findings demonstrate that despite previously held beliefs, a subset of AML is highly immunogenic and pinpoint several populations that could be targeted therapeutically in AML.
Results
Malignant and immune landscape of adult and pediatric AML
To examine the BM immune microenvironment in adult and pediatric AML, we performed scRNA-seq on ten BM samples from healthy donors (young donors, median age 20 (range 19–26) years and older donors, median age 47 (range 39–53) years; total 50,244 cells), 20 diagnostic BM aspirates from adult patients with AML (median age 68.5 (range 32–84) years; 89,733 cells) and 22 diagnostic BM aspirates from pediatric patients with AML (median age 7.4 years (range 2 months to 21 years); 74,440 cells) (Supplementary Table 1). Uniform Manifold Approximation and Projection (UMAP) demonstrated remodeling of the BM in both adult and pediatric AML with some clusters overlapping in healthy and AML BM and some clusters dominated by either adult or pediatric AML cells (Fig. 1a). To start characterizing the changes in the BM immune microenvironment in AML, we annotated cells based on their transcriptional profile and cell-surface protein expression (Fig. 1b,Extended Data Fig. 1a and Supplementary Table 2). Patients with AML had an increase in specific subsets of hematopoietic stem and progenitor cells (HSPCs)—HSCs, multipotent progenitors and granulocyte-monocyte progenitors (Extended Data Fig. 1b). Myeloid populations were largely unchanged, but individual patients had expansion of specific myeloid cell types (Extended Data Fig. 1c). In the lymphoid lineage, pre- and pro-B cells were severely depleted in patients and plasmablasts and plasma cells were diminished in pediatric patients with AML (Extended Data Fig. 1d). CD4+ and CD8+ T cells were also depleted in pediatric patients, whereas mucosal-associated invariant T (MAIT) cells and natural killer (NK) cells were diminished in both adult and pediatric patients (Extended Data Fig. 1e). Overall, this analysis demonstrates that the BM immune microenvironment is strongly altered in patients with AML, with potential implications for disease progression.
Fig. 1 |. The single-cell landscape of adult and pediatric AML.
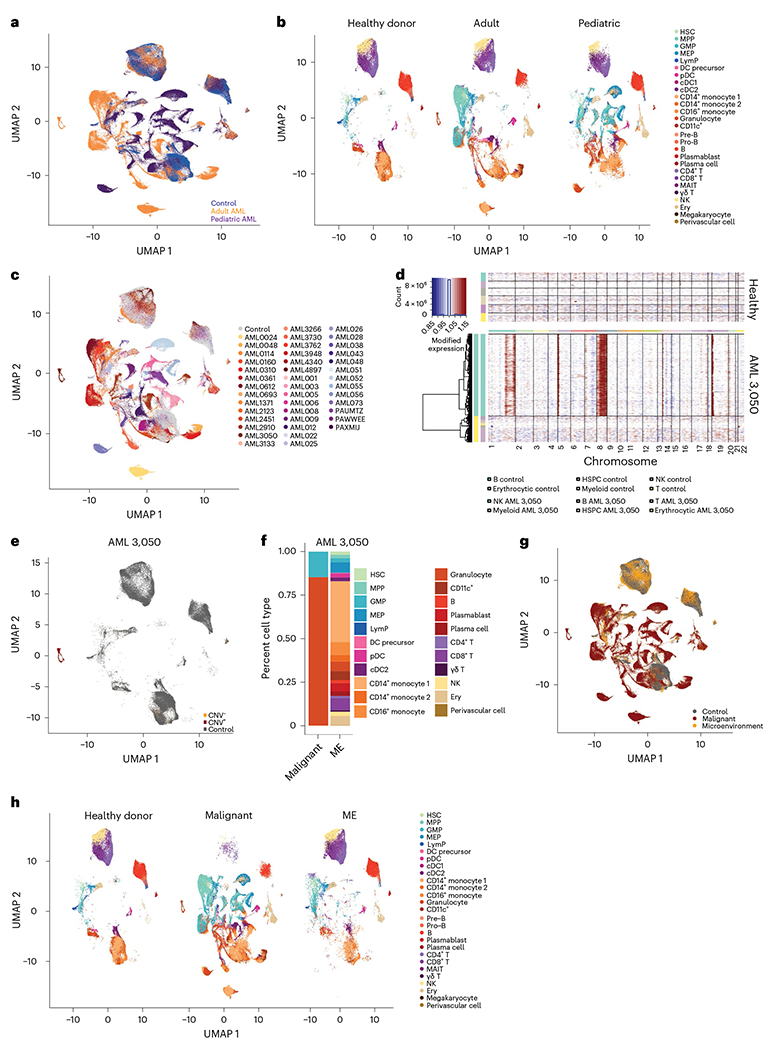
a, UMAP projection of healthy donors (n = 10), adult (n = 20) and pediatric (n = 22) AML BM cells. b, Split UMAP projection of healthy donors (n = 10), adult (n = 20) and pediatric (n = 22) AML cells, annotated by cell type based on transcriptome and surface protein expression. MEP, megakaryocyte progenitor; LymP, lymphoid progenitor; DC, dendritic cell; Ery, erythrocyte. c, UMAP representation of cells from healthy donors (n = 10, gray) or patients with AML (n = 42, colored), highlighting patient-specific clusters in AML. d, InferCNV heat map demonstrating copy gains in chromosomes 1, 5, 8 and 19 for sample AML 3050. e, UMAP projection of control, CNV+and CNV− cells from sample AML 3050.Gray indicates healthy donor cells (n = 10). f, Quantification of malignant and microenvironment (ME) cells from sample AML 3050. g, UMAP projection of healthy donors (n = 10), malignant and microenvironment cells from patients with AML (n = 37), following inferCNV and occupancy score analysis. h, Split UMAP projection of annotated cells from healthy donors (n = 10), malignant and microenvironment populations (n = 37 patients with AML) in the BM. All UMAP projections are based on the same coordinates.
To further characterize the remodeled BM immune microenvironment in AML, we sought to separate malignant cells from their healthy counterparts. In scRNA-seq analysis of solid tumors, malignant cells often form distinct, patient-specific clusters after dimensionality reduction18–21. We therefore hypothesized that patient-specific clusters (Fig. 1c) may represent malignant cells. InferCNV has been used in solid malignancies to identify tumor cells22, but to date has not been used in leukemias, in part due to the relative paucity of chromosome gains or losses in hematologic malignancies. To examine whether patient-specific clusters were enriched in cells containing chromosomal copy number variations (CNVs), we applied inferCNV. Our patient cohort includes several patients with documented chromosome gains or losses (Supplementary Table 1), which were effectively captured by InferCNV (Fig. 1d and Extended Data Fig. 2a). Notably, we did not detect any CNVs in healthy BM samples (Extended Data Fig. 2b). In patients with annotated karyotype abnormalities most cells carrying CNVs (CNV+) occupied patient-specific clusters, allowing us to separate malignant cells from immune microenvironment cells (Fig. 1e,f and Extended Data Fig. 2c). The high abundance of CNV+ cells in patient-specific clusters supports the hypothesis that these represent malignant cells from individual patients. Therefore, we clustered all cells and calculated for each cluster an occupancy score, representing the fraction of cells from an individual patient in each cluster23 (Extended Data Fig. 3a,b). Clusters with an occupancy score larger than 0.70, indicating more than 70% of cells in the cluster originated from one patient, were designated as patient-specific clusters. Patient-specific clusters were then annotated as malignant cells specific to a given patient with AML.
To validate this approach, we analyzed a previously published AML scRNA-seq dataset, where malignant cells were identified using single-cell genotyping for specific mutations15. Annotation of malignant cells by occupancy score overlapped with single-cell genotyping detection of malignant cells (Extended Data Fig. 3c,d). In our cohort, we were also able to detect small chromosomal aberrations in patients without annotated chromosome gains or losses (Extended Data Fig. 4a), suggesting that scRNA-seq can provide karyotypic information. Patient occupancy scoring and single-cell karyotyping with inferCNV allowed us to effectively separate the majority of malignant and microenvironment cells in 37 out of 42 patients (Fig. 1g). For the five remaining patients, overlap with healthy donor cells and lack of CNV+ cells prevented us from confidently identifying malignant cells and they were therefore excluded from further analysis. Malignant cells consisted mostly of myeloid cells or HSPCs, with small fractions of T and B cells (Fig. 1h). In 11 out of 42 (26%) patients we also identified small numbers of CNV+ cells in all hematopoietic lineages, including B, T and NK cells, suggesting that in these patients, chromosomal gains/losses occurred at an early developmental stage, allowing for dissemination across all hematopoietic lineages. T and B cells carrying CNVs were present in both pediatric and adult patients (Extended Data Fig. 4b), in line with previous reports of identification of leukemic mutations across all hematopoietic lineages16.
Inflammatory gene signatures in adult and pediatric AML
To characterize pathogenic processes underlying AML progression, we performed non-negative matrix factorization (NMF) and differential expression analysis on healthy and malignant HSPCs and myeloid cells. Common gene expression profiles identified in NMF included cell-type-specific, as well as distinct cellular programs. Malignant cells showed expression of programs enriched for cell cycle, RNA splicing, unfolded protein response, metabolic processes and inflammation (Extended Data Fig. 5a, Fig. 2a–c and Supplementary Table 3). Further differential expression analysis, comparing different subsets of malignant cells to their counterparts in healthy donors (malignant HSPC-like cells compared to healthy donor HSPCs and malignant myeloid-like cells compared to healthy donor myeloid cells) revealed dysregulated expression of a number of genes associated with inflammatory processes, including class II antigen presentation (HLA-DRA, HLA-DMA, HLA-DPB1 and HLA-DPA1), S100 alarmins (S100A6, S100A4 and S100A12), chemokines (CXCL8) and interferon response genes (IRF2BP2, ISG15, IFI44L and IFI27) (Fig. 2d,e and Supplementary Table 4). To further examine the role of inflammation in AML, we generated adult-specific and pediatric-specific inflammation signatures, consisting of inflammation-related genes that were dysregulated in malignant cells from adult or pediatric patients, respectively. While both the pediatric and adult inflammation signatures consist of similar pathways (Extended Data Fig. 6a and Supplementary Tables 5 and 6), only 95 genes overlap between the signatures (Extended Data Fig. 6b), in line with known differences in tumor genomics and immune system maturation between pediatric and adult patients with AML; however, despite differences in most of the individual inflammation-associated genes, shared resulting pathway activation between pediatric and adult patients suggests that an inflammatory immune response is an important factor in AML, which is present across the entire age spectrum of patients with leukemia.
Fig. 2 |. Inflammatory pathways in malignant AML cells.
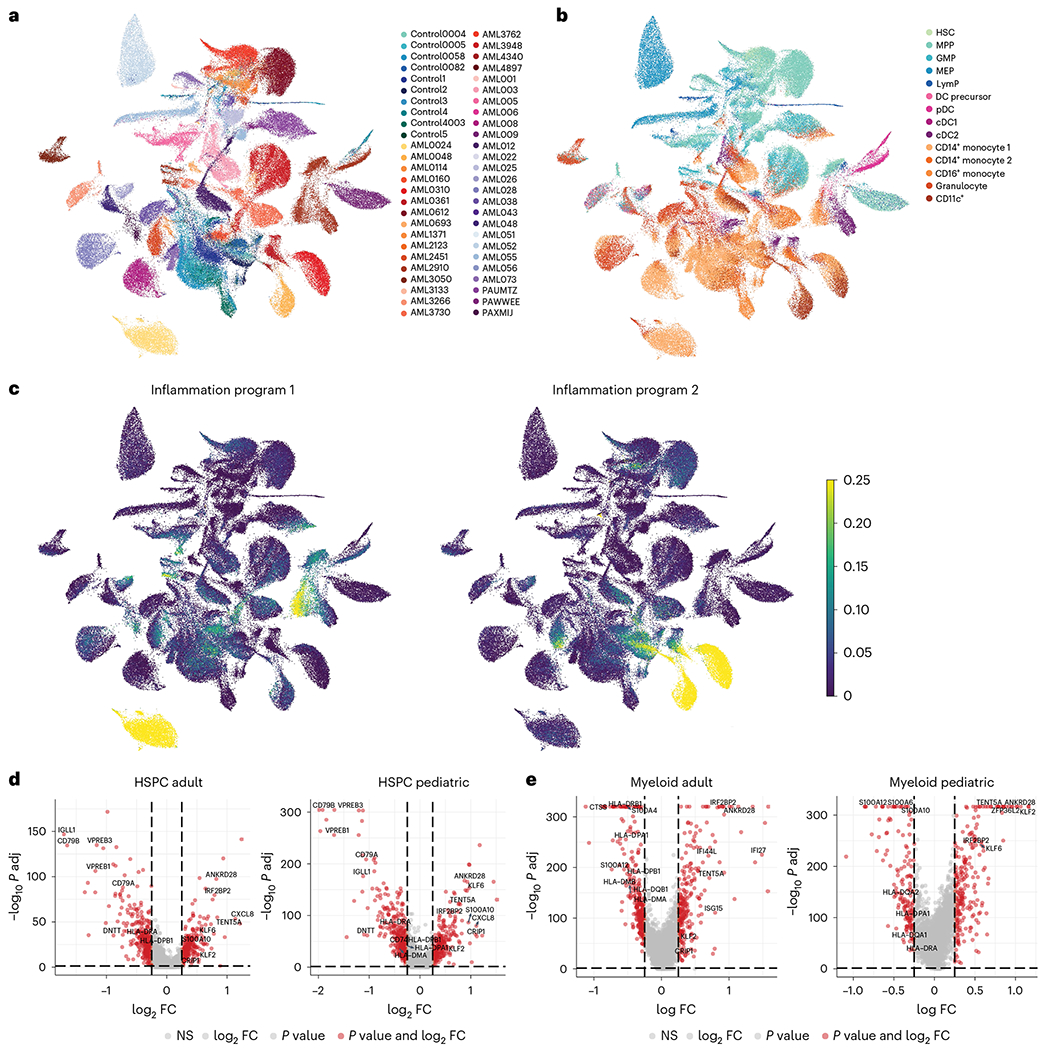
a, UMAP representation of healthy donor HSPCs and myeloid cells and malignant cells from adult and pediatric patients with AML. b, UMAP representation of healthy donor and malignant cells annotated by cell type. c, UMAP representation of cells expressing inflammation-related features identified by NMF. d, Volcano plots depicting genes enriched (right) or depleted (left) in malignant HSPCs from adult and pediatric patients with AML. FC, fold change; NS, not significant. e, Volcano plots depicting genes enriched (right) or depleted (left) in malignant myeloid cells from adult and pediatric patients with AML. For all panels, healthy donor n = 10 and patients with AML n = 37 (n = 18 adult, n = 19 pediatric)
To examine expression of the inflammation signatures in patients with AML, we generated pseudobulk expression data from the scRNA-seq cohorts, then classified the patients based on their inflammatory states, defined by the identified inflammation-associated gene expression program. Inflammation is known to increase with age, therefore we examined the inflammatory state separately in the pediatric and adult cohorts. In adult patients with AML, there was no correlation between the age of the patients and their inflammatory state. Indeed, the youngest patient in our adult cohort had the highest inflammation score (Extended Data Fig. 6c). We compared expression of the adult inflammation signature in adult patients to older healthy BM donors and the expression of the pediatric inflammation signature in pediatric patients to younger healthy BM donors. In adult patients, approximately half of the patients (9 out of 20; 45%) had increased inflammation compared to healthy donors (Extended Data Fig. 6d). In pediatric patients, the inflammation score clearly separated patients into two groups (Extended Data Fig. 6e), with 7 out of 22 patients (32%) showing high inflammation scores. To optimize analysis of the inflammation program in AML, we designated the top 50% of adult patients as highly inflamed and the bottom 50% as low inflammation and the top third of pediatric patients as high inflammation, whereas the bottom two-thirds were designated as low inflammation. Patient-by-patient examination revealed that messenger RNA expression of inflammation-related genes varied between patients with AML in both the adult and pediatric single-cell cohort (Extended Data Fig. 6f,g).
Atypical B cells are associated with inflammation in AML
Separation of malignant and myeloid cells enabled us to examine the effect of inflammation on the AML immune microenvironment. To investigate changes in the AML immune microenvironment, we focused on lymphoid lineages in the BM. Initially, we clustered B cells and annotated different populations based on transcriptome and surface protein expression (Fig. 3a, Extended Data Fig. 7a,b and Supplementary Table 7). Notably, a subset of B cells, atypical B cells (expressing ITGAX, FCRL3 and FCRL5; Supplementary Table 7), were enriched in adult and pediatric patients with AML combined (Fig. 3b and Extended Data Fig. 7c). As atypical B cells are often found in patients with chronic or recurrent infections24–27, we examined whether they were more abundant in high-inflammation patients with AML. Analysis of the Alliance cohort, The Cancer Genome Atlas (TCGA) and the TARGET-AML pediatric cohorts revealed that the atypical B-cell gene signature is highly correlated with the inflammatory state in both adult and pediatric patients with AML (Fig. 3c and Extended Data Fig. 7d), indicating that such cells are specifically enriched in patients with AML with high inflammation.
Fig. 3 |. Atypical B cells are associated with high inflammation in AML.
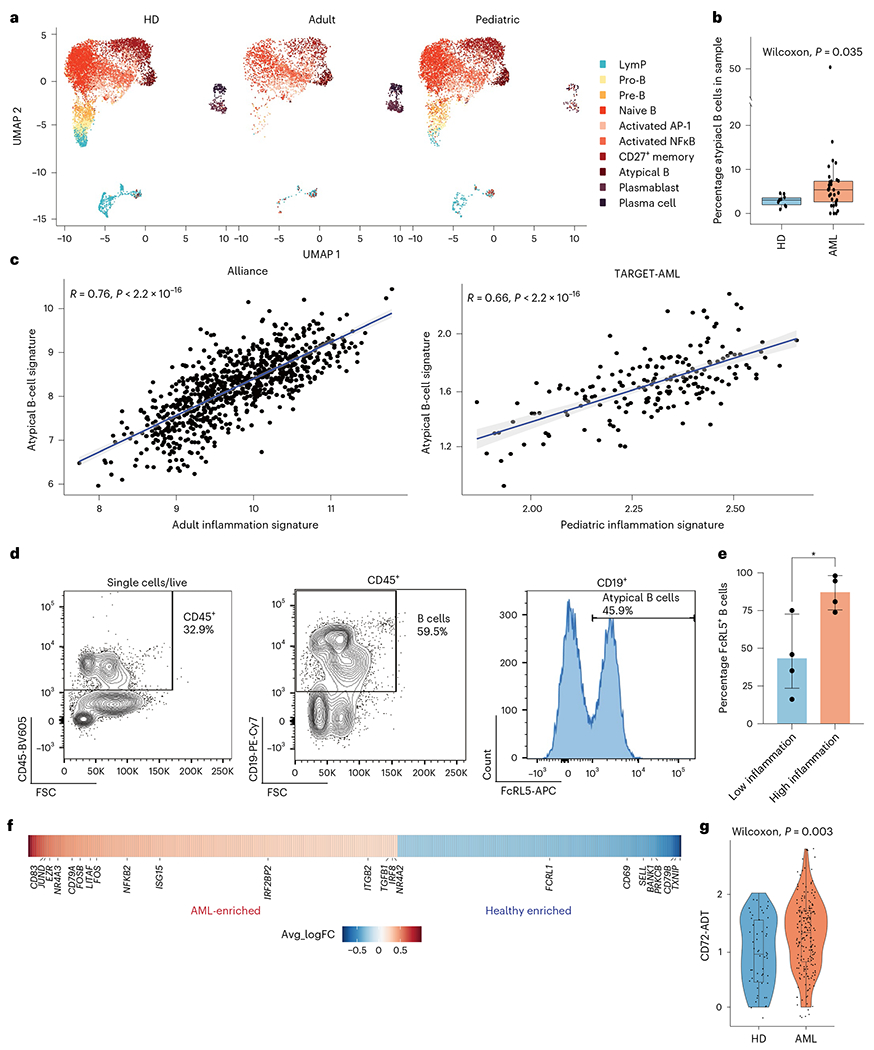
a, Split UMAP projection of B cells from healthy donors (HDs) (n = 10), adult (n = 20) and pediatric (n = 22) AML BM, annotated based on transcriptome and surface protein expression. b, Quantification of atypical B cells in healthy donors (n = 10) and AML (n = 30) BM. Wilcoxon test was used to evaluate statistical significance. Box plots represent the median with the box bounding the interquartile range (IQR) and whiskers showing the most extreme points within 1.5 × IQR. c, Correlation between the atypical B-cell signature and the inflammation signature in the Alliance cohort (adult patients, n = 872) and the TARGET-AML cohort (pediatric patients, n = 157). d, Representative FACS plot showing gating strategy for atypical B cells in BM aspirates. e, Quantification of FACS analysis of atypical B cells in BM aspirates from low-inflammation (blue, n = 4) and high-inflammation (red, n = 4) patients with AML. Error bars represent s.d. A t-test was used to evaluate statistical significance. f, Heat map of genes upregulated (red) or downregulated in atypical B cells from patients with AML compared to control. g, CD72 surface protein expression on atypical B cells from control (blue, n = 2) and patients with AML (red, n = 10). Wilcoxon test was used to evaluate statistical significance. Box plots represent the median with the box bounding the IQR and whiskers showing the most extreme points within 1.5 × IQR. All statistical tests shown in this figure are two-sided.
TET2 is frequently mutated in patients with AML28,29 and was previously found to be associated with inflammation30,31. Therefore, we examined a BM scRNA-seq dataset of mice carrying mutations in Tet2, developing myeloid malignancies, including AML32. We clustered B cells from the BM of wild-type (WT) and mutant mouse BM (Extended Data Fig. 7e), identifying clusters enriched in WT or Tet2-mutant mice (Extended Data Fig. 7f). We examined expression of the atypical B-cell gene signature across all B-cell clusters, identifying three B-cell clusters enriched in Tet2-mutant mice and expressing atypical B-cell marker genes (clusters 2, 4 and 9; Extended Data Fig. 7f,g), in agreement with our human CITE-seq studies.
In Tet2-mutant mice, the percentage of atypical B cells in the BM additionally correlated with disease severity (Extended Data Fig. 7h).
To further validate the enrichment of atypical B cells in patients with high-inflammation AML, we performed FACS analysis of BM samples from an additional cohort of adult patients with AML with high or low-inflammation scores (Extended Data Fig. 7i). High-inflammation patients had a higher percentage of atypical B cells in the BM compared to patients with low inflammation (Fig. 3d,e). Atypical B cells consist of both class-switched and non-class-switched B cells and are thought to be a suppressive B-cell population with impaired antibody-production capacity25,27. To assess the function of atypical B cells in patients with AML, we compared the transcriptional profile of atypical B cells in healthy BM donors and in patients with AML. Atypical B cells from patients with AML expressed high levels of genes involved in B-cell activation, such as CD83 (ref. 33), JUND (ref. 34), FOSB34 and NFKB2 (ref. 35), as well as NR4A3, NR4A2and ITGB2, which have been previously reported to be upregulated in atypical B cells from patients with chronic infections27. Furthermore, IRF8, which is associated with B-cell anergy36, was also upregulated in patients with AML. On the other hand, genes involved in the germinal center reaction, such as BANK1 (ref. 37), PRKCB38 and TXNIP39 were downregulated in patients with AML (Fig. 3f and Supplementary Table 8). CITE-seq analysis revealed that cell-surface marker CD72, which inhibits B-cell receptor signaling40, was also upregulated in AML-associated atypical B cells (Fig. 3g). Overall, these data suggest that atypical B cells in AML are a suppressive B-cell population, which are prevalent in high-inflammation AML BM.
Diverging T-cell responses in high- and low-inflammation AML
We next sought to characterize the T-cell and NK-cell compartment in AML. We annotated T and NK cells based on their transcriptome and surface protein expression (Fig. 4a, Extended Data Fig. 8a,b and Supplementary Table 9) and quantified different subpopulations in the BM. It has previously been reported that cytotoxic CD8+ T cells are depleted and regulatory T (Treg) cells are expanded in patients with AML15. We did not observe significant changes in either cytotoxic or Treg populations in either adult or pediatric patients in the single-cell cohort, although cytotoxic T cells were slightly expanded in patients’ BM (Fig. 4b,c). Inflammation is known to affect T-cell populations in solid tumors and inflamed tumors are considered more immunogenic in this setting4,41. Therefore, we sought to examine the effects of inflammation on the T-cell compartment in AML. While in adult patients we did not see any significant differences between high- and low-inflammation patients, (Extended Data Fig. 8c), in pediatric patients, Treg cells and GZMK+ CD8+ T cells were significantly expanded in inflamed patients (Fig. 4d,e). GZMK+CD8+ T cells have previously been shown to be progenitors of terminally exhausted CD8+ T (Tpex) cells that traffic to sites of inflammation and were suggested to respond to immune checkpoint blockade therapy42,43. GZMK+ CD8+ T cells in our dataset expressed a Tpex cell gene signature, including several exhaustion markers (PDCD1, TIGIT and TOX; Fig. 4f). Overall, these data suggest the T-cell response is suppressed in high-inflammation pediatric patients with AML.
Fig. 4 |. T-cell responses in human AML.
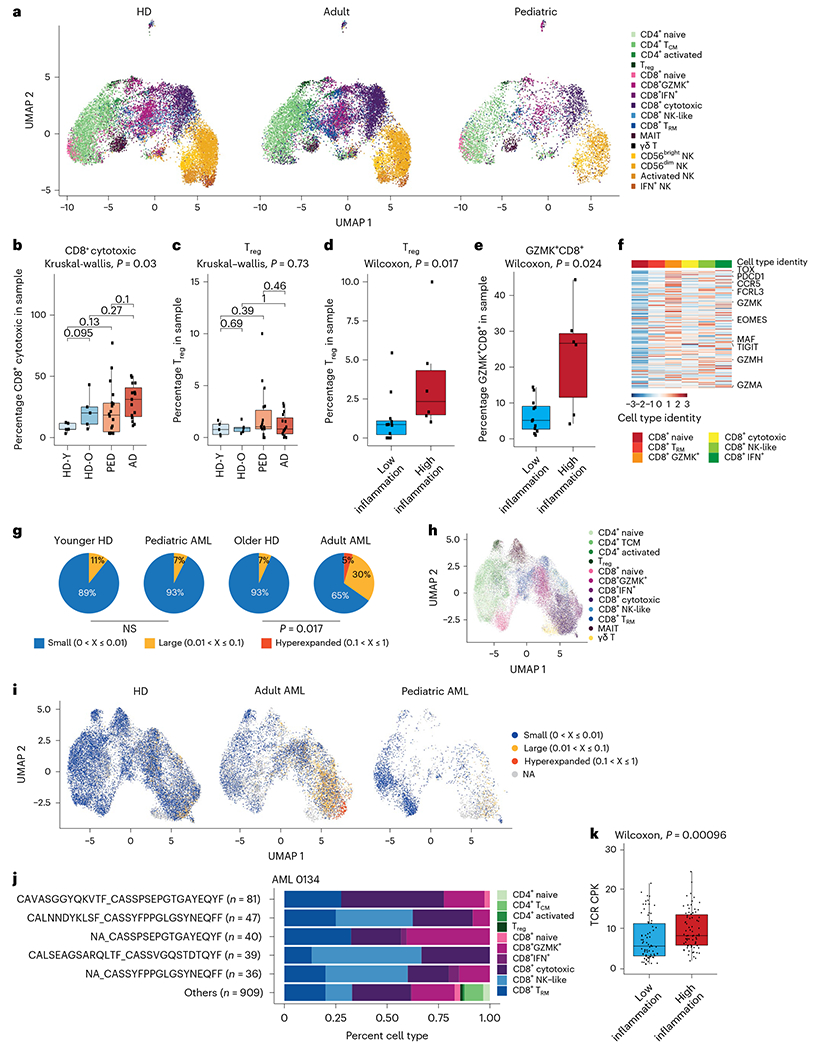
a, Split UMAP projection of T and NK cells from healthy donors (n = 10) and adult (n = 20) and pediatric (n = 22) patients with AML. b, Quantification of cytotoxic CD8+ T cells in healthy donors and pediatric and adult patients with AML. HD_Y, healthy donors 19–26 years old (n = 5); HD_O, healthy donors 39–55 years old (n = 5); PED, pediatric AML (n = 22); AD, adult AML (n = 20). Box plots represent the median with the box bounding the IQR and whiskers showing the most extreme points within 1.5 × IQR. A Kruskal–Wallis test was used to evaluate statistical significance in multigroup comparison, whereas a Wilcoxon test was used for two-group comparisons. c, Quantification of Treg cells in healthy donors, and pediatric and adult patients with AML. Box plots represent the median with the box bounding the IQR and whiskers showing the most extreme points within 1.5 × IQR. A Kruskal–Wallis test was used to evaluate statistical significance in multigroup comparison, whereas a Wilcoxon test was used for two-group comparisons. d, Quantification of Treg cells in low- (n = 12) or high-inflammation (n = 6) pediatric patients with AML. Box plots represent the median with the box bounding the IQR and whiskers showing the most extreme points within 1.5 × IQR. A Wilcoxon test was used to evaluate statistical significance. e, Quantification of GZMK+ CD8+ T cells in low- (n = 12) or high-inflammation (n = 6) pediatric patients with AML. Box plots represent the median with the box bounding the IQR and whiskers showing the most extreme points within 1.5 × IQR. A Wilcoxon test was used to evaluate statistical significance. f, Heat map of expression of the Tpex cell gene signature in CD8+ T cells in the BM. g, Pie charts representing the fraction of small (0–1%), large (1–10%) or hyperexpanded (10–100%) T-cell clones in controls and patients with AML (adult, n = 7; pediatric, n = 3). Younger HD, healthy donors 19–22 years old (n = 3); older HD, healthy donors 43–55 years old (n = 2). NS, not significant. h, UMAP projection of T cells from healthy donors (n = 5) and adult (n = 7) and pediatric (n = 3) patients with AML, annotated based on transcriptome. i, UMAP projection of T-cell clones from healthy donors (n = 5) and adult (n = 7) and pediatric (n = 3) patients with AML. NA, not available. j, Quantification of CD8+ subsets from expanded clones for sample AML 0134. A full list of expanded clonotypes is in Supplementary Table 10. k, Clonal diversity in low-inflammation (n = 75) and high-inflammation (n = 76) patients with AML from the TCGA cohort. Box plots represent the median with the box bounding the IQR and whiskers showing the most extreme points within 1.5 × IQR. A Wilcoxon test was used to evaluate statistical significance. All statistical tests shown in this figure were two-sided.
To further characterize the T-cell response to AML, we sorted T cells from the BM of five healthy donors, three pediatric and seven adult patients with AML (Extended Data Fig. 8d) and performed single-cell T-cell receptor (TCR) sequencing (scTCR-seq). Examination of clone distribution in the BM revealed that while in adult patients with AML T-cell clones are expanded, in three out of four (75%) of the pediatric patients we did not observe clonal expansion of T cells (Fig. 4g and Extended Data Fig. 8e). These patients were characterized by very young age (<3.5 years), suggesting that the T-cell response is abrogated in early childhood patients with AML. Indeed, an older pediatric patient (4.7 years old) did demonstrate clonal expansion of T cells at similar levels to adult patients (Extended Data Fig. 8e), suggesting that antitumor T-cell response in AML could be defined by patient age.
We further sought to characterize expanded T-cell clones in the AML BM. Projection of clonal information on the T-cell UMAP revealed that the majority of expanded clones in adult and pediatric AML are activated CD8+ T cells (Fig. 4h,i). Further examination of expanded clones from patients with AML revealed that cells from specific expanded clones can be found across all CD8+ activation states, demonstrating a continuum of activation (Fig. 4j and Extended Data Fig. 8f). Finally, we examined how inflammation affects clonal expansion in patients with AML. Analysis of deconvoluted bulk TCR data for the TCGA dataset44 demonstrated that high-inflammation patients with AML have increased clonal diversity, indicating higher immunogenic potential and less clonal expansion in high-inflammation patients with AML (Fig. 4k); however, in pediatric patients from the TARGET-AML cohort we did not observe a significant difference in clonal diversity between high and low-inflammation patients (Extended Data Fig. 8g), potentially as a result of overall lower clonal expansion in pediatric patients. In conclusion, inflammation affects the T-cell response and repertoire in patients with AML, leading to an abrogated T-cell response. Our data raise the possibility that high-inflammation patients may be more likely to respond to T-cell-stimulating therapies.
Clinical implications of inflammation in AML
To study the effects of inflammation on patient prognosis, we examined the association between the inflammation signature genes and overall survival (OS) in adult and pediatric patients. In adult patients, 78 and 116 genes (31.7% and 47.1%) were negatively associated with OS (for patients <60 years old and patients ≥60 years old, respectively), whereas in pediatric patients, 63 genes (33.8%) were negatively associated with OS, suggesting a subset of the inflammation gene signature has prognostic value in AML (Supplementary Table 10). To better examine the association of inflammation with survival, we derived an inflammation risk score, incorporating the Cox regression β coefficient value for each gene. High-inflammation risk score correlated with reduced OS, in both adult and pediatric patients (Extended Data Fig. 9a,b). We next reduced the inflammation gene sets of both pediatric and adult patients to generate clinically applicable gene signatures, using sparse regression analysis on the inflammation gene signatures in bulk RNA-seq cohorts for adult (Alliance) and pediatric (TARGET-AML) patients. This resulted in 38 and 11 core inflammation genes representing the survival risk associated with inflammation genes (iScore) for adult and pediatric patients, respectively (Supplementary Table 11), with continuous distribution across both cohorts as well as across all risk stratifications (Extended Data Fig. 9c,d).
To further delineate molecular features associated with higher or lower iScores, we compared the iScore levels across known AML-associated molecular subtypes. Adult and pediatric bulk RNA-seq data were visualized using t-distributed stochastic neighbor embedding (t-SNE) based on correlations of the most variable genes in each cohort, resulting in clusters that reflected the transcriptional identity and mutation profile of the patients (Fig. 5a,b). In both pediatric and adult patients with AML, we observed strong associations of the iScore with specific molecular drivers and transcriptional identity profiles (Fig. 5c,d). Specifically, there was a strong association of low iScore with favorable molecular features such as inv(16) AML (P < 0.001 adult and pediatric cohorts) NPM1 mutations (P < 0.001 adult cohort, P = 0.08 pediatric cohort). In contrast, established molecular adverse prognosticators, such as complex karyotype (P < 0.001 adult cohort), CBFA2T3-GLIS2 (P < 0.001 pediatric cohort), FLT3-ITD (P < 0.001 adult cohort), RUNX1 (P < 0.001 adult cohort) and TP53 mutations (P < 0.001 adult cohort) were associated with a high iScore. (Supplementary Table 12). Notably, despite the strong association with known molecular drivers and established outcome predictors, the iScore had added prognostic value in both adult and pediatric patients. In adult patients, a high iScore added independent prognostic impact in the context of other clinical prognostic parameters, such as stemness (LSC17 score45), in both younger and older patients (Extended Data Fig. 9e). In pediatric patients with AML consideration of the inflammatory state provided independent prognostic information in addition to established clinical parameters such as oncogenic drivers, transcriptional identifiers and LSC6 stemness score46 (Extended Data Fig. 9f).
Fig. 5 |. iScore associates with distinct subsets of human AML.
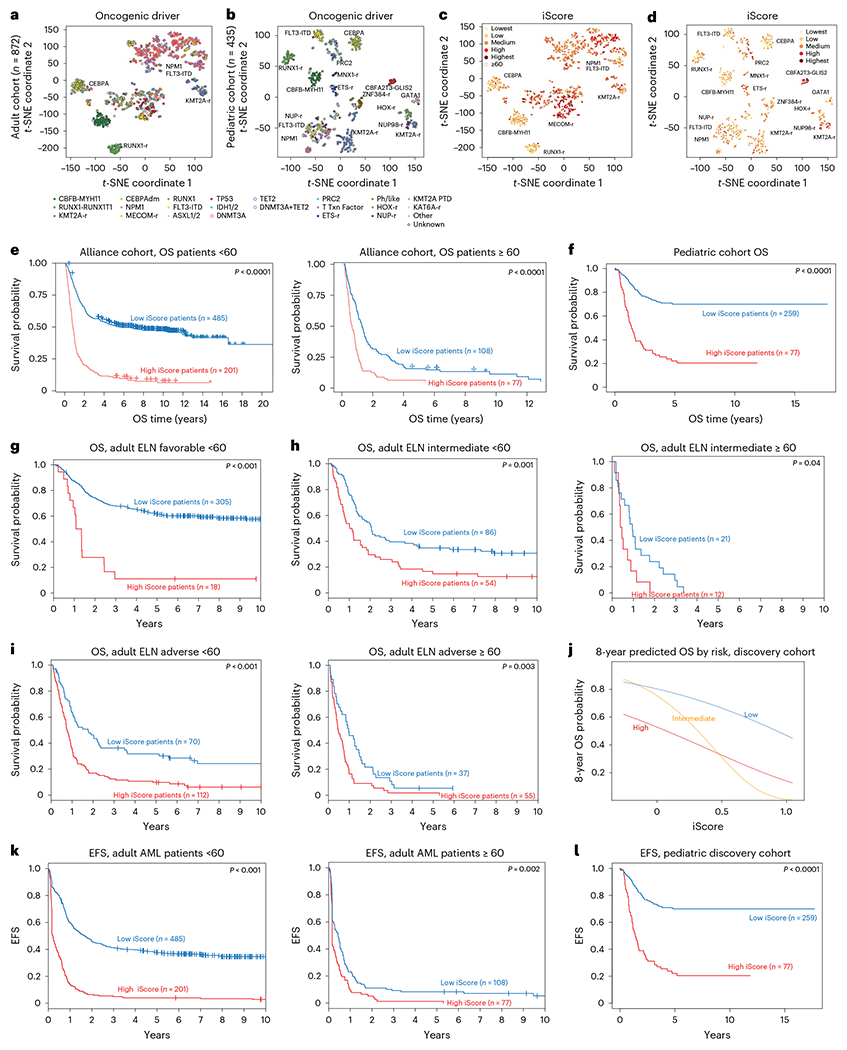
a, t-SNE representation of bulk RNA-seq data of adult patients with AML in the Alliance cohort (n = 872). b, t-SNE representation of bulk RNA-seq data of pediatric patients with AML in a large bulk RNA-seq cohort46 (n = 435). c, Adult iScore in bulk RNA-seq data of patients in the Alliance cohort (n = 872). d, Pediatric iScore in bulk RNA-seq data of patients in a pediatric bulk RNA-seq cohort (n = 435). e, OS of high and low iScore adult patients with AML in the Alliance cohort (n = 872). Log-rank test was used to evaluate significance. f, OS of high and low iScore pediatric patients with AML in the TARGET-AML cohort (n = 336). Log-rank test was used to evaluate significance. g, OS of adult ELN favorable high and low iScore patients in the Alliance cohort (n = 323). Log-rank test was used to evaluate significance. h, OS of adult ELN intermediate high and low iScore patients in the Alliance cohort (n = 140, <60 years old; n = 33, ≥60 years old). Log-rank test was used to evaluate significance. i, OS of adult ELN adverse high and low iScore patients in the Alliance cohort (n = 182, <60 years old; n = 92, ≥60 years old). Log-rank test was used to evaluate significance. j, Eight-year predicted OS in low-, intermediate- and high-risk patients in a pediatric cohort (n = 336). k, EFS in high and low iScore patients in the Alliance AML cohort (n = 686, <60 years old; n = 185, ≥60 years old). Log-rank test was used to evaluate significance. l, EFS in high and low iScore pediatric patients (n = 336). Log-rank test was used to evaluate significance.
Next, to assess whether the iScore adds clinically relevant information to established clinical and molecular parameters associated with treatment response and survival, we tested the performance of the iScore by itself, as well as in the context of other risk stratifiers, including the European LeukemiaNet (ELN) 2017 genetic risk classification for adult patients. Remarkably, in both adult and pediatric46 patients with AML, those with higher iScores had inferior OS (Fig. 5e,f). These results were validated in TCGA and Beat AML for adult patients and in a pediatric AML cohort of 399 patients with microarray data (Extended Data Fig. 9g–i; adult, ELN favorable, intermediate and adverse; pediatric, genomic stratification per ClinicalTrials.gov NCT03164057). Notably, implementation of the iScore within the ELN risk categories was able to markedly refine the current risk groups. Specifically, the OS of ELN favorable risk patients with high iScore was close to that of low iScore adverse risk patients (Extended Data Fig. 9h), suggesting that these patients may benefit from different treatment intensities and/or modalities than conventional chemotherapy alone. In fact, examination of the iScore in patients with different risk stratifications (adult, ELN favorable, intermediate and adverse) revealed that patients with high iScore have worse outcomes across all risk stratifications (Fig. 5g–j). Furthermore, in both adult (<60) and pediatric patients, patients with high iScore had worse event-free survival (EFS) (Fig. 5k,l and Extended Data Fig. 10a–e). Overall, these data suggest that clinical implementation of iScore could refine patient risk stratification, which is a major determinant in the decision to transplant a patient in first remission or treat them with chemotherapy alone.
Discussion
AML is an aggressive hematological cancer with low survival rates, in both adult and pediatric patients. Here we provide a comprehensive census of the BM microenvironment in adult and pediatric AML. We distinguish between malignant and microenvironment cells in the BM, characterize inflammatory programs in adult and pediatric patients with AML, provide a detailed analysis of the different components of the BM immune microenvironment in AML and describe clinically relevant inflammation risk scores (iScore) that improve patient risk stratification.
Adult and pediatric AML have similar clinical manifestations; however, in adults, AML is thought to be a progressive disease, arising over years due to acquisition of sequential mutations and often going through pre-malignant stages of clonal hematopoiesis and myelodysplasia. In pediatric patients, AML is often thought to arise due to acquisition of mutations during early development of the hematopoietic system. Therefore, it is remarkable that the BM microenvironment in adult and pediatric patients with AML was largely similar, with only a few exceptions. One is the increase in plasma cells in adult patients, which could reflect immunity to different pathogens acquired over years. The other is the lack of T-cell clonal expansion in infant patients, a finding supported by recent bulk RNA-seq and in silico TCR clonality predictions44. The T-cell compartment is immature in newborns; however, infants can acquire T-cell immunity to bacterial or viral pathogens47. It is possible that in infant patients with AML, mutations acquired in utero disseminate across all hematopoietic lineages, affecting development of the immune system. In addition, early acquisition of AML-associated mutations may induce tolerance to these mutations, which prevents their recognition by T and B cells.
While our analysis demonstrated that inflammation can be present across all differentiation stages in AML, there was a strong association between a more myeloid-like phenotype and inflammation. Thus, while inflammation is a global pathogenic module in AML, it is possible that the inflammation signature is partially driven by a specific differentiation stage. Studies suggest inflammation may play a role in many aspects of AML, including disease progression, chemoresistance and myelosuppression48. Further inflammation can lead to prothrombotic events such as stroke and cardiovascular complications49. The associations we identified with specific B-cell and T-cell populations in the BM microenvironment suggest that this is a functional feature of AML malignant cells, with important clinical implications.
Notably, we found that inflammation is strongly associated with enrichment of atypical B cells, a B-cell population that emerges during chronic infections and is thought to serve as a suppressive B-cell population, limiting auto-immunity24–27. In AML, atypical B cells express genes associated with B-cell anergy and inhibition of B-cell receptor signaling, indicating that they serve a suppressive role in the AML microenvironment. Thus, while the immune system is activated, our findings suggest that in a subset of patients, inflammation triggers an ineffective response characterized by atypical B cells. Targeting of atypical B cells may therefore be beneficial for high-inflammation patients with AML.
Inflammation further remodeled the T-cell compartment in pediatric but not adult patients with AML. This may be due to differences in the inflammatory program in malignant cells, in line with a study identifying innate immune response genes as the main source of differential niche interactions between adult and pediatric AML in a mouse model50. High-inflammation pediatric patients with AML had an expansion of GZMK+ precursor CD8+ T cells. Precursor CD8+ T cells express high levels of immune checkpoints and are thought to drive the response to immune checkpoint blockade (ICB)42,43,51. In AML, it has recently been reported that GZMK+ T cells are enriched in patients responding to PD-1 blockade52. Furthermore, Treg cells were enriched in high inflammation pediatric patients with AML, potentially curbing the T-cell response to AML. Therefore, it is possible that pediatric patients with AML expressing high levels of the inflammation gene signature will benefit from ICB or therapies aimed to diminish Treg cell activity.
AML is often considered to be a ‘cold’ tumor due to its low tumor mutation burden and the poor response to ICB by patients with AML9,10; however, here we demonstrate that subsets of adult and pediatric patients with AML express inflammatory gene signatures in malignant cells, suggestive of an immune response, but conversely this response is associated with a poor outcome. Notably, a subset of inflammation-related genes provides independent prognostic information in both adult and pediatric patients. Therefore, examining the patient’s iScore in a clinical setting may be an important factor to be considered for more accurate prognosis assessment. This is particularly relevant for low and intermediate risk patients with AML who currently receive chemotherapy alone and may benefit from intensification with stem cell transplant in first remission. Of note, inflammation has also been associated with relapse and reduced EFS in AML53, suggesting that monitoring and possibly modifying, inflammation in patients with AML may be important in determining treatment and prognosis.
In summary, we provide a unique overview of the BM immune microenvironment in AML. We demonstrate that inflammation plays an important role in shaping the AML microenvironment and identify immune populations that are uniquely expanded in high-inflammation patients with AML. We describe an inflammation-related gene signature (iScore) with independent prognostic impact in AML. We propose that stratifying patients with AML based on their iScore could refine risk stratification in AML.
Methods
Ethical regulation
This study complies with all relevant ethical regulations and was approved by the Institutional Review Boards of New York University, Ohio State University and St. Jude Children’s Research Hospital.
Human patient samples
Cryopreserved, de-identified BM aspirates from newly diagnosed patients with AML were obtained from the OSU Leukemia Tissue Bank (adult AML samples, n = 29, 48% female), St. Jude Children’s Research Hospital (pediatric AML samples, n = 18) or the Children’s Oncology Group AML cell bank (pediatric AML samples, n = 3). Overall, in the pediatric cohort, 52% of patients were female. All participants provided written consent for banking and research use of these specimens, according to the Declaration of Helsinki in accordance with the regulations of the institutional review boards of all participating institutes. Cryopreserved primary human BM mononuclear cells (n = 10) were obtained from STEMCELL Technologies (catalog no. 70001) or from StemExpress (catalog no. BMMNC025C).
Frozen human BM mononuclear cell preparation
Frozen human BM samples were thawed and transferred into 50-ml conical tubes containing PBS + 2% fetal bovine serum (FBS). Cell suspensions were centrifuged at 350g for 5 min at 4 °C and the supernatant was discarded. Samples were then subjected to dead cell depletion, using a dead cell removal kit (Miltenyi Biotec, 130-090-101) or stained with 4,6-diamidino-2-phenylindole (DAPI) (0.5 μg ml−1) and sorted for live cells (DAPIneg), using a FACSAria IIu SORP cell sorter (BD Biosciences). For cell sorting, all samples were gated based on forward and side scatter, followed by doublet exclusion and then gated on DAPIneg for viable cells. Samples were sorted into 5-ml poly-propylene tubes containing 300 μl ice-cold PBS + 2% FBS. Following cell sorting, samples were centrifuged at 350g for 5 min at 4 °C.
For CITE-seq, enriched live cells were first tagged with cell-hashing oligonucleotide-tagged antibodies (1:250 dilution, BioLegend) according to manufacturer’s instructions. Samples were counted and a maximum of 105 cells for each sample was pooled together and stained either with a custom CITE-seq panel (1:100 dilution for all antibodies) or with a CITE-seq antibody cocktail (BioLegend) according to the manufacturer’s instructions. See Supplementary Table 1 for a list of patients stained with each panel and Supplementary Table 13 for a list of antibodies included in each panel.
For scTCR-seq, T cells were enriched using a pan T-cell isolation kit (Miltenyi Biotec, 130-096-535) or sorted for live CD45+CD3+ cells. For cell sorting, samples were stained with PerCP-conjugated anti-human CD45 (1:400 dilution, BioLegend, 304025), FITC-conjugated anti-human CD3 (1:100 dilution, BioLegend, 300452) and DAPI (0.5 μg ml−1). Sorted samples were gated based on forward and side scatter, followed by doublet exclusion and then gated on DAPIneg for viable cells. CD45+CD3+ cells were sorted into 5-ml poly-propylene tubes containing 300 μl ice-cold PBS + 2% FBS. Following cell sorting, samples were centrifuged at 350g for 5 min at 4 °C.
Libraries were prepared using Chromium Single Cell 3′ Reagent kits (v.3 and v.3.1, CITE-seq) or Chromium Single Cell Immune Profiling kits (v.1.1 and v.2, scTCR-seq, 10x Genomics). Hashtag and antibody-derived tag (ADT) libraries were prepared according to the New York Genome Center CITE-seq and hashing protocol (https://citeseq.files.wordpress.com/2019/02/cite-seq_and_hashing_protocol_190213.pdf). Libraries were sequenced on an Illumina NovaSeq 6000.
Single-cell RNA/CITE-seq pre-processing
Raw sequencing reads were converted to FASTQ format using Illumina bcl2fastq software. We used CellRanger Single Cell Gene Expression Software (v.5.0, 10x Genomics) to demultiplex and align raw 3′ library reads to GRCh38 (v.2020-A). All following downstream analysis was performed using the Seurat R package (v.3.2.2)54 and all visualizations were generated using ggplot2 (v.2_3.3.3).
We excluded cells with fewer than 400 or more than 6,000 unique feature counts, as well as cells with more than 15% transcripts originating from mitochondrial genes to filter low-quality cells and droplets that may have captured multiple cells.
To demultiplex hashed libraries, hashtag oligonucleotides were normalized using a centered log ratio (CLR) transformation across cells and HTODemux function in Seurat was applied. We used the 0.99 quantile as a cutoff (positive.quantile = 0.99) to define a cell as hashtag positive. Cells positive for more than one hashtag were excluded as doublets.
Independently, we used Souporcell55 on each of the hashed libraries to identify cells in which wrong hashtags may have been assigned. Souporcell remaps raw reads to GRCh38 reference using minimap2, identifies candidate variants using freebayes and counts cell alleles supported for each cell with vartrix. Sparse mixture model clustering is then used on the cell allele counts to detect doublets and infer genotypes of each cluster. We excluded cells assigned as doublets and cells in which genotype and HTODemux assignment did not match.
To further exclude doublets deriving from two cells from the same patient and from non-hashed libraries, we filtered the data using the scDblFinder package (v.1.5.13; https://github.com/plger/scDblFinder). For each of the hashed libraries, we used the recoverDoublets function to identify cells similar to those identified as doublets by HTODemux. For the non-hashed libraries, we ran scDblFinder function, with trajectoryMode = TRUE, which generates cluster-based artificial doublets to identify doublets.
To reduce ambient RNA contamination, we used the SoupX package56. SoupX uses empty droplets to identify ambient RNA expression profiles present in each library. To further estimate a global contamination rate, SoupX clusters the cells and identifies marker genes for each cluster to estimate the contamination in each cell. The most common contamination estimate is then used to remove contamination in each of the clusters. Contamination estimates in our libraries varied between 1 and 9.2%. SoupX estimated counts were used in all downstream analysis.
After filtering, RNA expression data were normalized by total expression, multiplied by a scaling factor of 10,000 and log-transformed. For ADTs) counts were divided by the geometric mean of each corresponding feature across cells and then log-transformed (CLR transformation). We captured on average 4,123.4 cells per patient with a mean and median of 1,620.772 and 1,581.257 genes detected per cell, respectively.
Analysis of single-cell RNA/CITE-seq data
Clustering and visualization.
To visualize RNA expression similarities between cells in two-dimensional space, we used the scaled data matrix to perform principal-component analysis on the 2,000 most variable genes. We ran UMAP57 on the first 30 principal components with 25 nearest neighbors defining the neighborhood size and a minimum distance of 0.3. We constructed a shared nearest neighbor graph using 25 nearest neighbors and clustered the graph using a range of resolutions from 0.1–10 to explore the cluster. Resolution 2, which yielded 85 clusters, was used for subsequent broad cell-type annotation and occupancy scoring analysis.
Broad cell type annotation.
Broad cell types, HSPCs, myeloid, B cells, T/NK cells and erythrocytes were annotated using known cell type markers as previously described58.
Malignant and microenvironment division.
For patients with clinically annotated karyotype aberrations (Supplementary Table 1), we ran inferCNV to identify malignant cells (v.1.2.1)22. We ran inferCNV on each patient individually annotating the broad cell type (HSPCs, myeloid, T cells, NK cells and B cells) within the control and patient cells. InferCNV was run with default settings, except min_cell_per_gene = 10, cutoff = 0.1, de-noise = TRUE, HMM = TRUE and analysis_mode = ‘subclusters’. Cell type-specific expression patterns can introduce noise in the analysis. To validate CNV+ T, B and NK cells, we additionally ran inferCNV on the T, B and NK cells of all patients, annotating the more granular cell types within each broad cell type compartments. We only kept CNV+ T, NK and B cells that were detected in both analyses.
To make use of cluster information, we calculated an occupancy score for each of the 85 clusters. For each patient and cluster, we divided the number of cells from the patient by the sum of the patient and control cells. When the occupancy score exceeded a threshold of 0.7, we designated the cluster as patient-specific and therefore malignant. By combining the CNV-positive cells with patient occupancy scoring, we were able to confidently split malignant and microenvironment cells in 37 out of 42 patients with AML. Five patients with incomplete splits were excluded from further analysis of HSPCs and myeloid microenvironment cells: AML 3133, AML 4897 (adult), AML 006, AML 056 and AML 025 (pediatric).
Granular cell type annotation.
We split microenvironment and control cells into broad cell types (HSPCs, B cells, T cells, NK cells and myeloid). To account for biological and technical batch effects, we applied Harmony integration (v.1.0)59 to each of the broad cell type objects using default parameters and the individual patients as integration variable. The first 20 dimensions of the Harmony embeddings were then used to generate UMAPs with 20 nearest neighbors defining the neighborhood size and a minimum distance of 0.3 for each of the broad cell types. We constructed shared nearest neighbor graphs using the first 20 dimensions of the Harmony embeddings and clustered the graph using a range of resolutions from 0.5–3. The following resolutions were used for manual cluster annotation based on cluster markers: HSPCs, resolution 1, 21 clusters; myeloid cells, resolution 1, 20 clusters; T/NK cells, resolution 3, 35 clusters; B cells, resolution 2, 22 clusters; and erythrocytes, resolution 1, 14 clusters. To identify cluster markers, we performed differential expression analysis between cells within each cluster against all other cells using the Wilcoxon rank-sum test with Bonferroni multiple-comparison correction (detected in at least 10% of the cluster cells, log2 fold change >0.25 or <−0.25, adjusted P < 0.05). Clusters expressing markers of other lineages were excluded as potential doublets from further analysis. To visualize the cluster markers for each identified cell type, cluster markers were re-calculated based on final cell type annotation and a cell-type average expression matrix was calculated. The top 20 marker genes for each cell type were shown in a row-scaled heat map using the pheatmap package (v.1.0.12) for each of the cell type subsets and the combined full annotation, as well as selected surface protein markers to further validate cell type annotations. Cluster markers for each cell type can be found in Supplementary Table 2. We used Wilcoxon rank-sum test to compare differences between two groups, whereas a Kruskal–Wallis test was used for more than two groups.
Annotation of malignant cells.
To assign a cell type identity to the AML malignant cells, we used the FindTransferAnchors function in Seurat60 to identify pairwise correspondence between cells in the annotated microenvironment/control cells and malignant cells and projected the cell type labels using the TransferData function using the first 30 principal components.
Non-negative matrix factorization.
To identify common gene expression profiles in malignant cells of adult and pediatric patients with AML, we subset malignant and healthy counterpart HSPC/myeloid populations and performed NMF using cNMF (v.1.1)61 which uses the NMF implementation in scikit-learn v.20.0. We filtered all genes expressed in fewer than 50 cells and used only the top 2,000 overdispersed genes in the NMF analysis. To identify the most stable and accurate number of components (k) within the range of 20 to 35 over 25 iterations, we used silhouette score and Frobenius reconstruction error as implemented in cNMF. k = 22 emerged as the smallest most stable solution. The consensus solution was determined over 250 iterations using a density threshold of 0.04 to exclude outlier solutions. UMAP visualization of the malignant and healthy counterpart HSPCs/myeloid was based on the same 2,000 overdispersed genes used in the NMF analysis. Cell type-related gene expression profiles (GEPs) were excluded by evaluating GEP usage in healthy control cells. We identified 12 cell type-specific GEPs, 2 patient-specific and 8 commonly used GEPs across the malignant cells. Marker genes for each GEP were identified using multiple least squares regression of normalized z-scored gene expression against the consensus GEP usage matrix as implemented in cNMF and positively associated genes were used for subsequent Gene Ontology (GO) analysis as in Kotliar et al.61. All analysis was performed in Python (v.3.7.0) using scanpy (v.1.6.0), pandas (v.1.1.3), numpy (v.1.19.2), matplotlib (v.3.3.2) and seaborn for visualizations (v.0.11.2).
Differential gene expression.
To identify differentially expressed genes between the malignant cells and their corresponding healthy counterparts, we broadly divided malignant cells into HSPC-like and myeloid-like and separated adult and pediatric patients as well as younger and older healthy controls. To avoid strong patient-specific effects we downsampled malignant cells to a maximum of 500 cells from each patient. Adult and pediatric malignant cells were compared to their corresponding age-matched controls. We used MAST62 to perform differential expression analysis as implemented in Seurat, which uses a generalized linear model framework to incorporate cellular detection rates as a covariant. We considered all genes detected in at least 10% of the AML cells with a log2 fold change larger than 0.25 or smaller than −0.25 and a Bonferroni-adjusted P < 0.05 as differentially expressed. Due to an imbalance of male and female patients in our cohort, we removed all genes derived from X and Y chromosomes. To determine differentially expressed genes between patients with AML and healthy control atypical B cells, we combined all patients’ atypical B cells (463 cells) and compared them to all atypical B cells identified in healthy controls (294 cells) as described above. Differentially expressed genes in malignant cells can be found in Supplementary Table 3. Differentially expressed genes in atypical B cells are in Supplementary Table 8.
Deriving the inflammation signatures.
We performed GO analysis for biological pathway subontology on the differentially expressed genes using the enrichGO function from the clusterProfiler package (v.3.14.3) with default parameters and expressed genes as a background. EnrichGO uses a one-sided Fisher’s exact test to determine overrepresentation of a specific pathway and performs Benjamini–Hochberg correction for multiple comparisons by default. Pathways were further filtered for duplicated terms using the simplify function in cluster-Profiler with default parameters. We used all inflammation-related terms within the top 30 GO terms of up- and downregulated genes to establish inflammation signatures for adult and pediatric patients independently. The final inflammation signatures included 246 and 187 genes in adults and pediatrics, respectively. GO pathways can be found in Supplementary Table 4. All gene signatures can be found in Supplementary Table 5.
To generate inflammation score cutoffs for adult and pediatric patients based on our single-cell cohorts, we generated pseudobulk data for each patient and the healthy controls and compared their inflammation scores. Inflammation scores were calculated using the same approach as for the broad cell type annotation described above, using patient averages instead of cluster averages in the calculation. High and low-inflammation thresholds for adult and pediatric patients were assigned based on inflammation score distribution (adults, 50% high inflammation; pediatric, 32% high inflammation). Those groupings were used in all single-cell downstream analysis.
FACS analysis of atypical B cells in high- and low-inflammation patients with AML
Frozen human BM samples were thawed and transferred into 50-ml conical tubes containing PBS + 2% FBS. Cell suspensions were centrifuged at 350g for 5 min at 4 °C and the supernatant was discarded. Cells were stained in an antibody cocktail containing BV605-conjugated anti-human CD45 (1:400 dilution, BioLegend, 304042), biotin-conjugated anti-human CD19 (1:400 dilution, BioLegend, 302203) and APC-conjugated anti-human FcRL5 (1:100 dilution, eBioscience, 50-3078-42), PE-Cy7-conjugated streptavidin (1:400 dilution, BD, 557598) and DAPI (0.5 μg ml−1). Samples were analyzed on a BD Fortessa. High- and low-inflammation grouping was determined based on bulk RNA-seq results, as described below.
TCR/5′ RNA-seq data analysis
The 5′ RNA-seq data were aligned to GRCh38 (v.2020-A) using Cell-Ranger Single Cell Gene Expression Software (v.6.0.1, 10x Genomics) and subsequent analysis was performed in Seurat R package (v.4.0.2)54. Visualization and clustering of data was performed as described for the 3′ data. Broad cell types were called and non-T-cell clusters were excluded from further analysis. T cells from the 15 patients were integrated using Harmony (v.1.0)59 and the UMAP was generated using the first 20 Harmony embeddings, the 20 nearest neighbors to define the neighborhood size and a minimum distance of 0.3. We used the scRepertoire package (v.1.1.4) to visualize and integrate the TCR data with Seurat. Cell-type annotation was performed based on cluster markers as described above (resolution 1.5, 27 clusters) (Supplementary Table 9). We annotated γδ T cells based on the presence of TRGV9, TRDV1 or TRDV2 and MAIT cells based on TRAV1–2 expression. Due to better capture of T-cell-relevant genes in the 5′ data, we transferred the labels from the 5′ T cells to the 3′ T cells as described above. A list of expanded clonotypes from each patient can be found in Supplementary Table 10.
AML bulk TCR data
TRUST-imputed TCR data for the TCGA and TARGET cohort was derived from Zhang et al.44 We used TCR CDR3s per kilo TCR reads to define clonotype diversity according to the original publication and divided TCGA and TARGET patients into high- and low-inflammation groups based on average log2 -transformed mean adult and pediatric inflammation scores, respectively. Adult patients were split based on the median scores, whereas pediatric patients were split based on the top versus bottom two tertiles.
AML bulk RNA-seq cohorts
TCGA Acute Myeloid Leukemia (LAML)63 and Therapeutically Applicable Research to Generate Effective Treatments (TARGET)64 AML RNA-seq data as well as clinical and survival annotations were downloaded from UCSC GDC Xena Hub (https://gdc.xenahubs.net). Beat AML data were derived from elsewhere65. Analysis was limited to diagnostic/de novo patients with AML in TCGA-LAML and Beat AML to match the Alliance cohort data. Alliance RNA-seq data from de novo patients with AML was derived from GSE137851 and GSE63646 and newly generated as described by Papaioannou et al.66. To generate gene signatures, we added one to the expression values and used the average of the log2-transformed values as the gene set score. Pearson’s product moment correlation coefficient was used to determine correlations between signatures.
t-SNE visualization of AML bulk cohorts
t-SNE gene expression maps were constructed as in Fornerod et al.46. For the adult AML cohort (n = 872), the 400 most-variant genes based on median absolute deviation were used, excluding sex-specific genes (n = 21) and HBB and genes clustering with HBB (n = 31), which were previously shown to correlate with sample purity. t-SNE was run twice (10,000 iterations) with perplexity value 10 and the run with the lowest final error was selected. For visualization of oncogenic drivers, the priority was MECOM-r, KMT2A-r, CEBPAdm, RUNX1-RUNX1T1, CBFB-MYH11, FLT3-ITD, NPM1, TP53, RUNX1, ASXL1/2 and IDH1/2. For the pediatric cohort (n = 435) t-SNE coordinates were taken from Fornerod et al.46 and visualization of oncogenic drivers was identical except that all FLT3-ITD mutations were co-colored.
Outcome analysis
Adult patients.
We investigated the molecular characteristics and outcome associations of 872 adult patients with de novo AML who were enrolled on CALGB/Alliance study protocols based on intensive cytarabine/daunorubicin-based chemotherapy. For all studies, per protocol, patients did not receive an allogeneic hematopoietic stem cell transplantation in first complete remission (CR). All patients gave written informed consent for participation in the studies. All study protocols were in accordance with the Declaration of Helsinki and approved by Institutional Review Boards at each treatment center. All patients were enrolled on CALGB 8461 (cytogenetic studies), CALGB 9665 (leukemia tissue bank) and CALGB 20202 (molecular studies) companion protocols. Mutational profiling of all patients has previously been published67 and was performed centrally at the Ohio State University by targeted amplicon sequencing using the MiSeq platform (Illumina) and additional Sanger sequencing for CEBPA mutations, adding up to a total of 81 genes analyzed. All outcome analyses on Alliance patients were performed by the Alliance Statistics and Data Center using SAS 9.4 and TIBCO Spotfire S+8.2.
Definition of clinical endpoints and statistics for adult patients with AML.
Clinical endpoints were defined according to generally accepted criteria. Patients not known to have relapsed or died at last follow-up were censored on the date they were last examined. OS was measured from the date of diagnosis to the date of death from any cause; patients not known to have died at last follow-up were censored on the date they were last known to be alive. Patients alive and in CR at the last follow-up were censored. Estimated probabilities of OS were calculated using the Kaplan–Meier method and the log-rank test was used to evaluate differences between survival distributions. Inflammatory risk score was calculated from gene expression values weighted by Cox proportional hazard β value for OS and summed per sample. All statistical analyses on Alliance patients were performed by the Alliance Statistics and Data Center.
Pediatric patients.
For the pediatric cohort with OS data (n = 409), inflammatory risk score was calculated from gene expression values46 of 185 out of 187 inflammatory genes matched (Supplementary Table 11) weighted by Cox proportional hazard β value and summed per sample. For the validation microarray cohort (n = 386, excluding cases which overlapped with the RNA-seq cohort, Supplementary Table 12), the same per-gene weights were used. Overall, 163 out of 187 inflammatory genes matched. In cases where multiple probesets matched a gene symbol, the probeset with the highest specificity was selected. If specificity was the same, the highest selectivity was selected. Probesets with specificity ≤0.8 were removed (n = 6). Patient characteristics and datasets of both pediatric cohorts have been previously published46.
LASSO-penalized proportional hazard model
To improve clinical applicability of the inflammation score, we performed 1,000 iterations of leave-out-10% cross validation of a LASSO-penalized proportional hazards model with the cv.glmnet function of the glmnet R package68 on the Alliance cohort for the adult inflammation score and the extended TARGET-AML cohort for the pediatric inflammation score. Genes selected in at least 900 of the 1,000 iterations were retained in the final model with coefficients defined as the average of their estimates over the 1,000 iterations. The final iScore for adult and pediatric patients contained 38 and 11 genes, respectively and was trained based on OS data. For adult and pediatric iScores, the performance of the signature was validated on independent AML cohorts in which the iScore was computed as a linear combination of expression values of the winner genes and fixed value coefficients defined as described above (for adult, TCGA and Beat AML; for pediatric, microarray cohort). The distribution of the score by risk was visualized using boxplots. The association of the score with OS and EFS was first addressed with Kaplan–Meier estimation where the continuous score was dichotomized using recursive partitioning method in the rpart function of the rpart R package69. Cut points were determined based on OS (separately for <60- and ≥60-year-old patients in adults) and the same groups were used in the EFS analysis. Cox proportional hazard regression was also applied to examine the association between the continuous score and survival adjusting for risk using the cph function of rms R package70. Hazard ratio and their confidence intervals were computed and the shape of the association was plotted.
Global test.
Global associations between inflammatory gene expression sets (see above), genomic variables, LSC17 (ref. 45), pLSC6 and OS were calculated using the global test package in R71,72, with interactions.
Tet2-mutant mice
Tet2HR mice were described previously32. For analysis of B cells in the Tet2HR BM, B cells were separated from single-cell data from these mice (GSE182615). The B-cell compartment was separately integrated using a Seurat anchor-based integration method60. To visualize the data in two-dimensional space, we used the first 20 principal components of the scaled integrated matrix to run UMAP projections. Atypical B cells were identified using previously published gene signatures73.
Statistics and reproducibility
No statistical method was used to predetermine sample size, but our sample sizes are similar to those reported in other publications15,19. For malignant and microenvironment analysis, we excluded three patients for whom we could not confidently separate malignant and microenvironment cells. For analysis of B and T cells, we excluded nine patients where fewer than 50 B or T cells were captured. No other data were excluded from the analysis. The experiments were not randomized. The investigators were not blinded to sample allocation during data collection, analysis and outcome assessment.
All statistical analysis was performed in R v.3.6.1. Only Alliance cohort outcome analysis was performed using SAS 9.4 and TIBCO Spotfire S+8.2. Comparisons of numerical variables according to disease state or inflammation state were carried out using the Wilcoxon rank-sum test for two-group comparisons and Kruskal–Wallis test for multiple-group comparisons. Whenever multiple tests were performed, P values were corrected for multiple comparison using Bonferroni correction unless otherwise stated. Estimated probabilities of OS were calculated using the Kaplan–Meier method and the log-rank test to evaluate differences between survival distributions. All statistical tests are listed in the corresponding method sections and figure legends for clarity.
Reporting summary
Further information on research design is available in the Nature Portfolio Reporting Summary linked to this article.
Extended Data
Extended Data Fig. 1 |. Cell populations in the bone marrow.
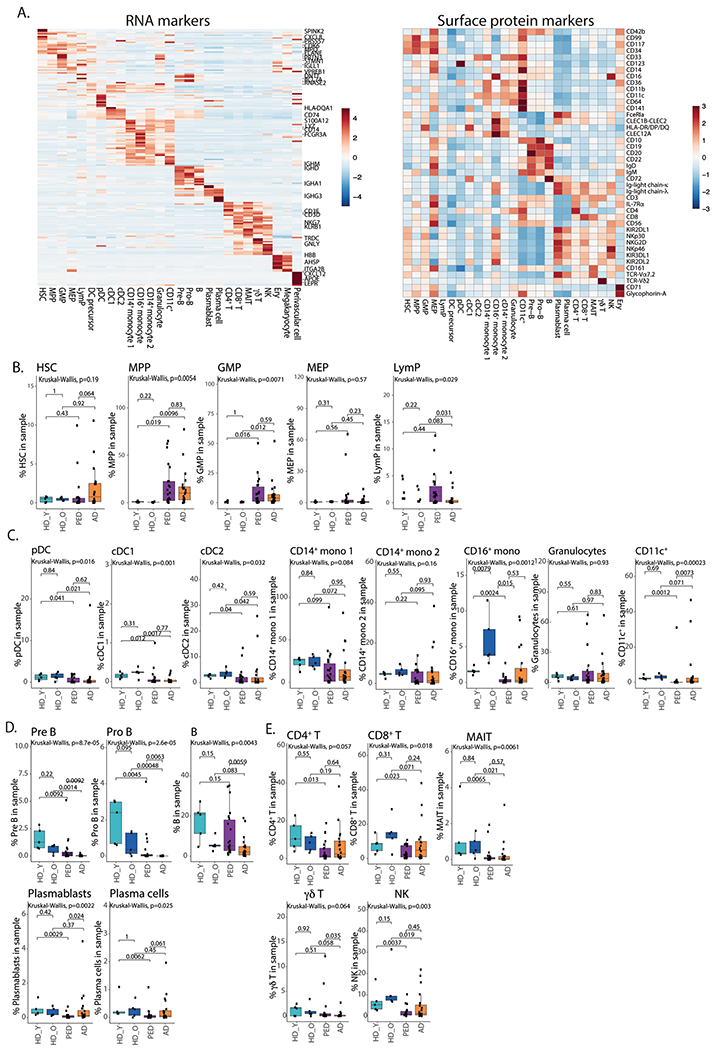
a. Heatmap of average expression of top RNA cluster markers for different cell subsets in the BM (left), heatmap of average expression of surface protein markers for different cell subsets in the BM (right). HSC – hematopoietic stem cells, MPP – multipotent progenitors, GMP – granulocyte-monocyte progenitors, MEP – megakaryocyte progenitors, LymP – lymphoid progenitors, DC – dendritic cells, Ery – erythrocytes. b. Quantification of HSPC subsets in the BM. Box plots represent the median with the box bounding the interquartile range (IQR) and whiskers showing the most extreme points within 1.5 × IQR. c. Quantification of myeloid subsets in the BM. Box plots represent the median with the box bounding the interquartile range (IQR) and whiskers showing the most extreme points within 1.5 × IQR. d. Quantification of B cell subsets in the BM. e. Quantification of conventional (CD4+, CD8+), non-conventional (MAIT, γδ) and NK cells in the BM. Box plots represent the median with the box bounding the interquartile range (IQR) and whiskers showing the most extreme points within 1.5× IQR. All statistical tests shown in this figure are two-sided. Pair-wise comparisons were evaluated using Wilcoxon test, multi-group comparisons were evaluated using Kruskal-Wallis test. For panels B-E, HD_Y – Healthy donors 19-26 years old (n = 5), HD_O – healthy donors 39-55 years old (n = 5), PED – pediatric patients with AML (n = 22), AD – adult AML patients (n = 20).
Extended Data Fig. 2 |. Separation of malignant and microenvironment cells in AML samples.
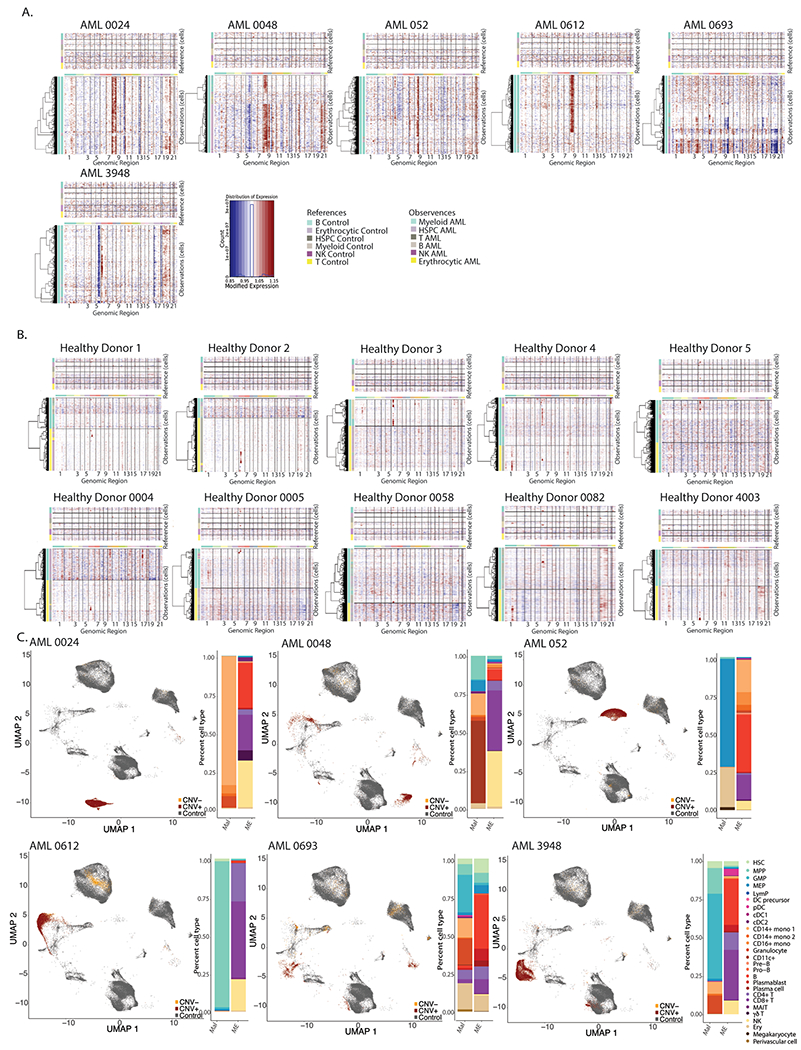
a. InferCNV heatmaps for patients with clinically annotated chromosome gains or losses. b. InferCNV heatmaps for healthy donor BM samples. c. UMAP projection of Healthy donors, CNV+ and CNV− cells from patients with annotated chromosome gains or losses (left), quantification of malignant and microenvironment cells for each sample (right).
Extended Data Fig. 3 |. Validation of occupancy score method.
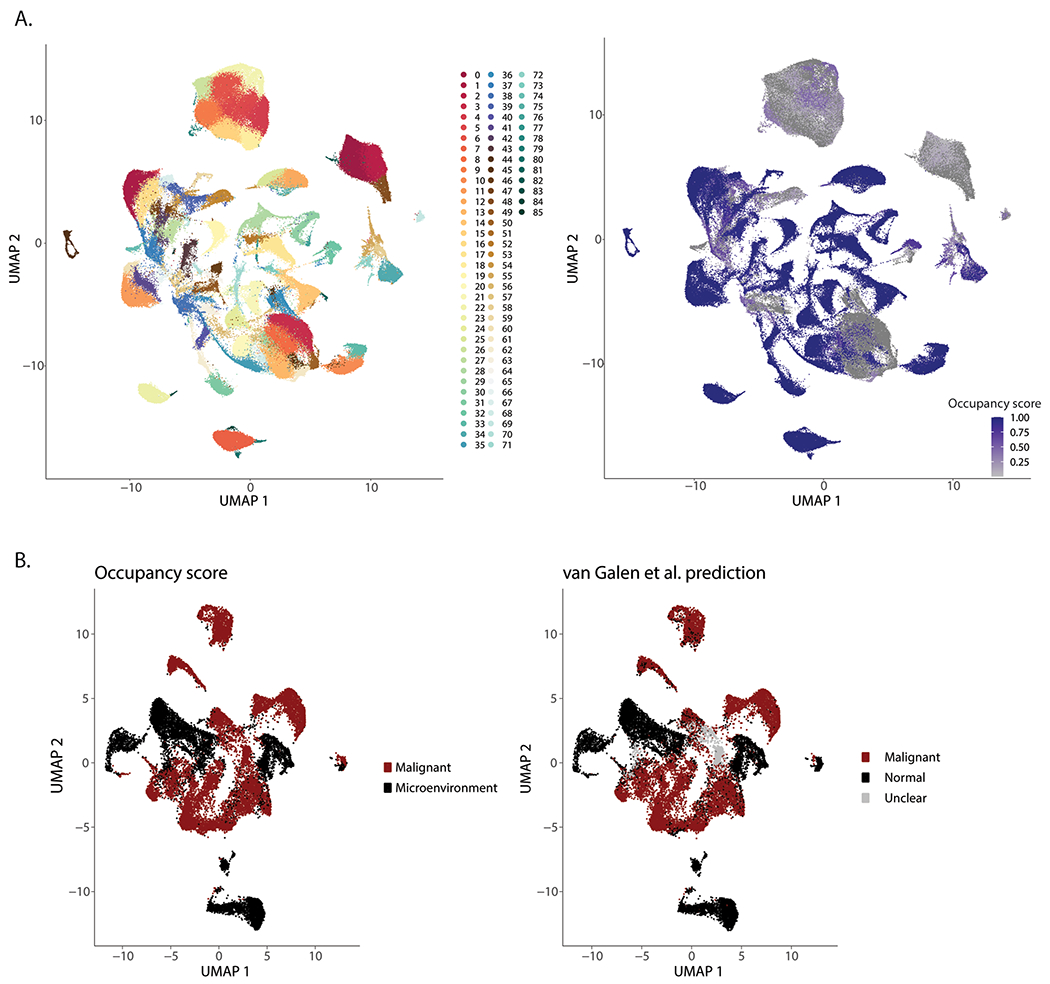
a. UMAP projection depicting cell clustering for calculation of occupancy scores. b. UMAP projection of occupancy score. c. UMAP projection of malignant and microenvironment cells based on occupancy scores (left) or single cell genotyping (right).
Extended Data Fig. 4 |. Non-annotated karyotype aberrations detected by InferCNV.
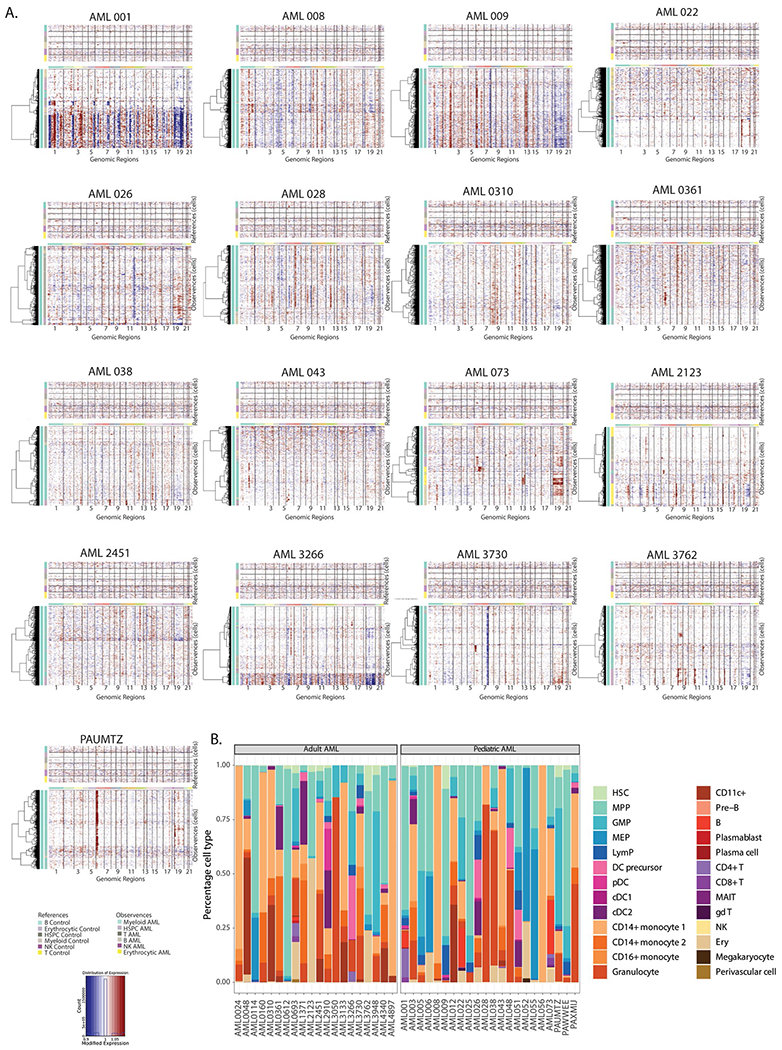
a. InferCNV heatmaps for patient samples with non-annotated karyotype aberrations. b. Patient-by-patient quantification of broad cell types in malignant cells.
Extended Data Fig. 5 |. Pathogenic programs in AML.
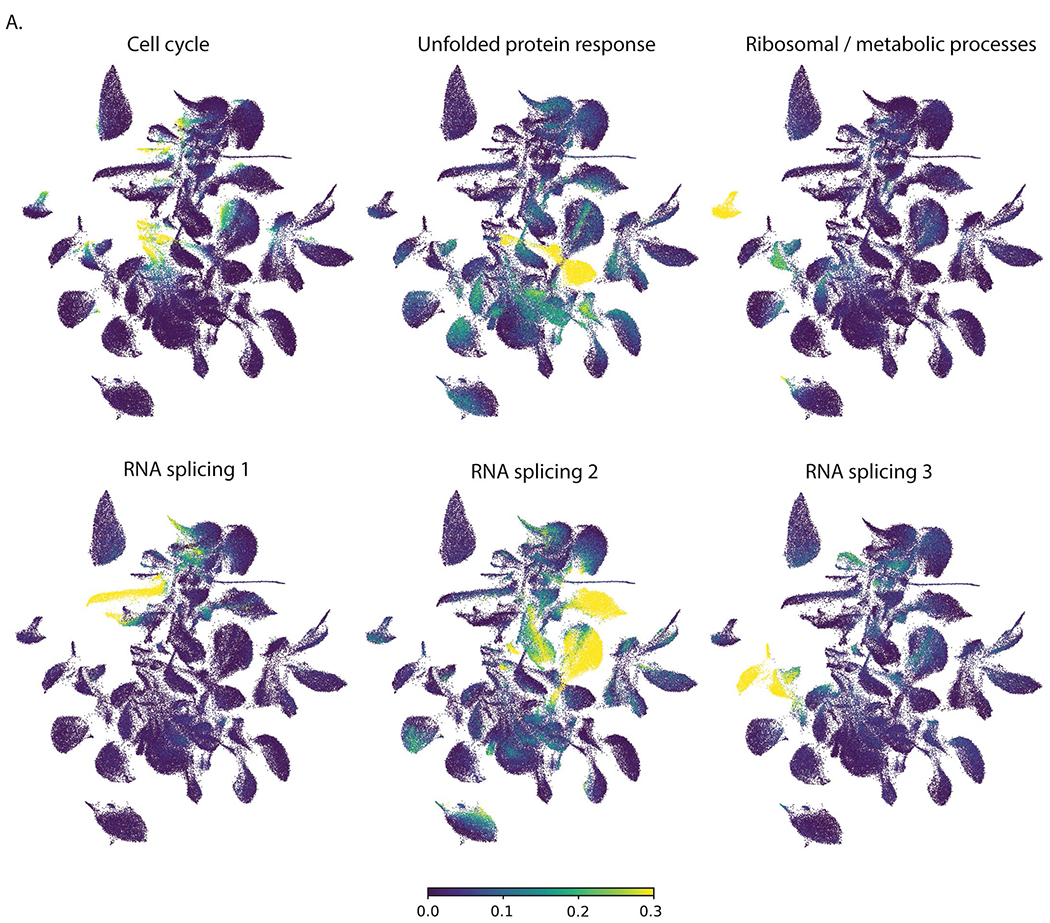
a. UMAP projections of cells expressing different gene expression programs identified by NMF.
Extended Data Fig. 6 |. Inflammatory signatures in AML.
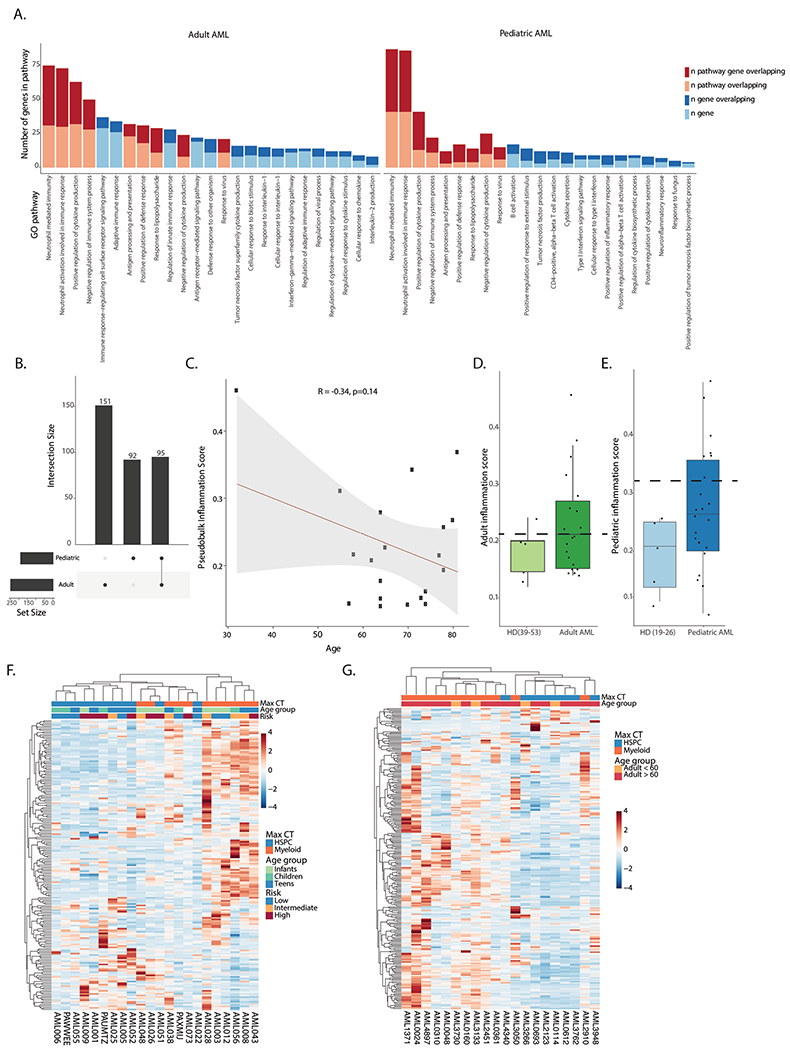
a. Pathway analysis for genes in the adult (left) and pediatric (right) inflammation signatures. b. Overlap between genes in the adult and pediatric inflammation signatures. c. Pearson correlation between age and inflammation score in the adult AML cohort. d. Inflammation score in older controls (n = 5) and adult AML patients (n = 20) in the single cell cohort. Dashed line represents cutoff for high or low inflammation. Box plots represent the median with the box bounding the interquartile range (IQR) and whiskers showing the most extreme points within 1.5× IQR. e. Inflammation score in younger controls (n = 5) and pediatric AML patients (n = 22). Dashed line represents cutoff for high or low inflammation. Box plots represent the median with the box bounding the interquartile range (IQR) and whiskers showing the most extreme points within 1.5× IQR. f. Heatmap of average expression of the pediatric inflammation signature in malignant cells from pediatric patients. Max CT – maximum cell count. Infants – 0–3 years old (n = 6), children – 3–12 years old (n = 9), teens − 12–21 years old (n = 7). g. Heatmap of average expression of the adult inflammation signature in malignant cells from adult patients. Max CT – maximum cell type.
Extended Data Fig. 7 |. Inflammatory B cells in AML.
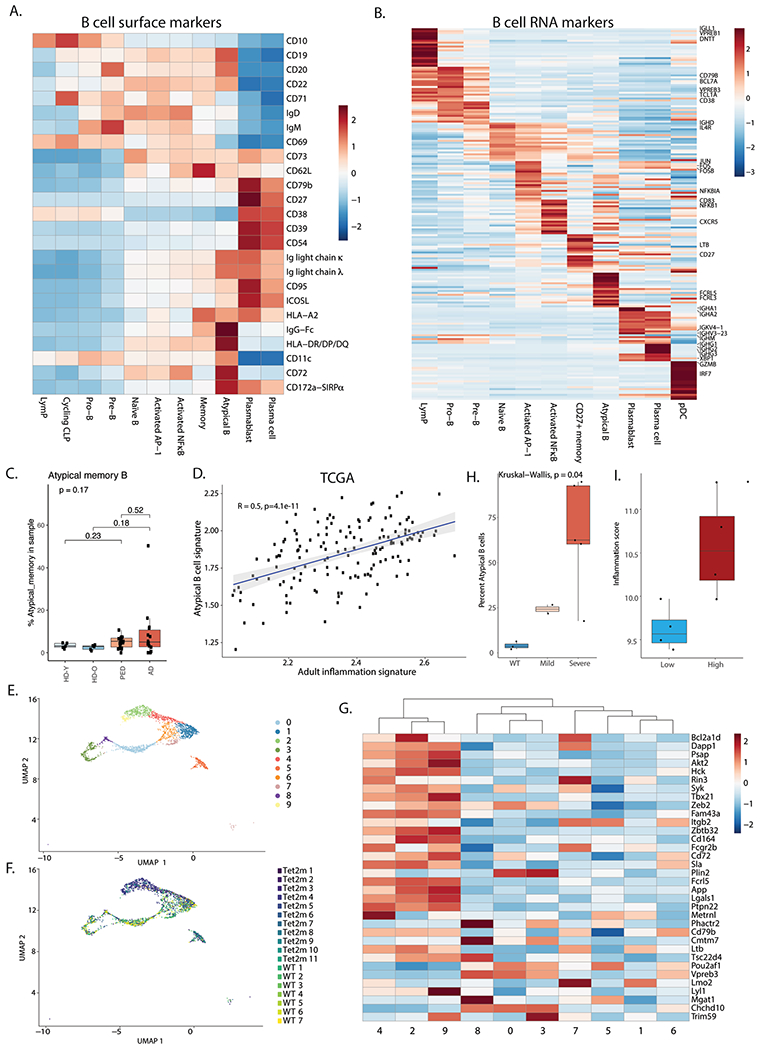
a. Heatmap of average expression of surface protein markers in different B cell subsets. CLP – common lymphoid progenitor. b. Heatmap of average expression of RNA markers in different B cell subsets. c. Quantification of Atypical B cells split by young healthy donor (n = 5), older healthy donors (n = 5) adult (n = 14) and pediatric (n = 19) AML patients. Note the reduction in patient numbers due to exclusion of patients with less than 50 B cells in the BM. Box plots represent the median with the box bounding the interquartile range (IQR) and whiskers showing the most extreme points within 1.5 × IQR. d. Pearson correlation between the atypical B cell gene signature and the adult inflammation signature in the TCGA cohort (n = 152). e. UMAP representation of B cells from wild type (WT, n = 7) and Tet2 mutant (n = 11) mouse BM. f. UMAP representation of wild type (WT, n = 7) and Tet2 mutant (n = 11) cell distribution in B cell clusters. g. Heatmap showing expression of the mouse atypical B cell gene signature in B cell clusters in wild type (WT, n = 7) and Tet2 (n = 11) mutant mouse BM. h. Quantification of atypical B cells in aged wild type (WT, n = 3) or Tet2 mutant mice (n = 7). Mild – mild disease (n = 2), severe – severe disease (n = 5). Statistical tests in this panel are two-sided. Box plots represent the median with the box bounding the interquartile range (IQR) and whiskers showing the most extreme points within 1.5 × IQR. i. Inflammation scores of samples used for FACS validation of atypical B cell expansion in high inflammation AML BM (high inflammation n = 4, low inflammation n = 4). Box plots represent the median with the box bounding the interquartile range (IQR) and whiskers showing the most extreme points within 1.5× IQR. All pair-wise comparisons were evaluated using Wilcoxon test, multi-group comparisons were evaluated using Kruskal-Wallis test.
Extended Data Fig. 8 |. T cell responses in AML.
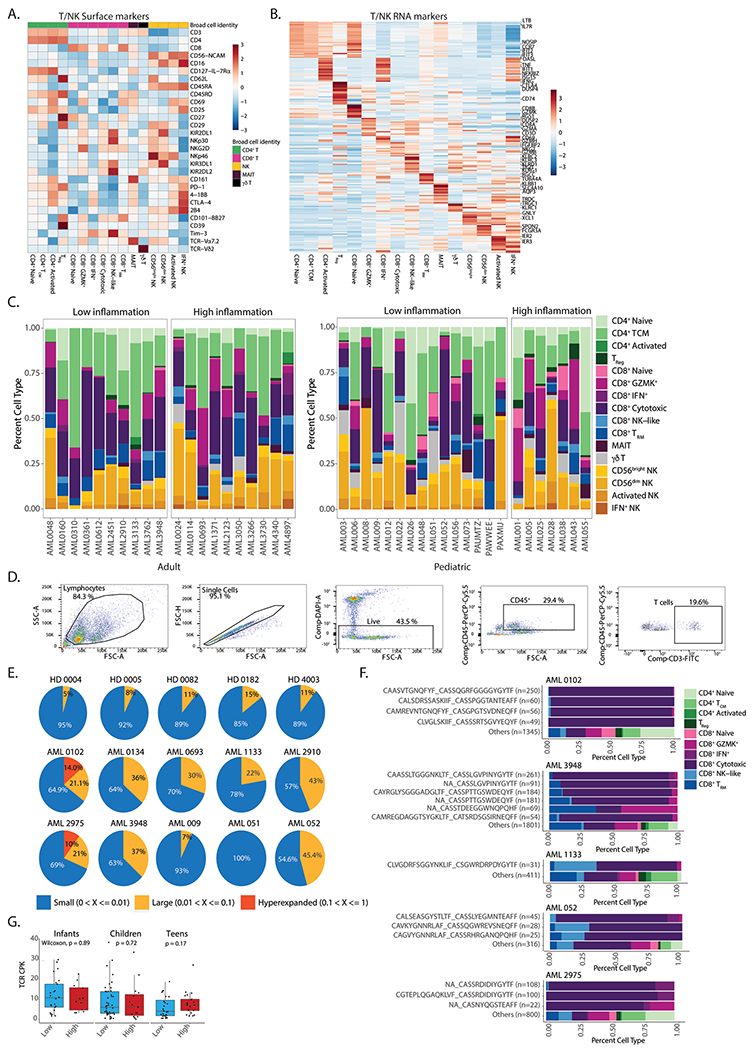
a. Heatmap of average expression of surface protein markers in different T cell subsets. TCM – central memory T cells; TReg – regulatory T cells; TRM – resident memory T cells. b. Heatmap of average expression of RNA markers in different T cell subsets. c. Quantification of T cell subsets in high and low inflammation AML patients. d. Gating strategy for sorting of T cells from AML or healthy donor BM aspirates. e. Pie charts representing the fraction of small (0-1%), large (1-10%) and hyperexpanded (10–100%) clones in individual samples. f. Quantification of CD8+ subsets from expanded clones in AML patients. g. Clonal diversity in infants (0-3 years old, n = 37), children (3-12 years old, n = 59) and teens (12-21 years old, n = 49) from the TARGET-AML bulk RNA-Seq cohort. All statistical tests shown in this figure are two-sided. All box plots represent the median with the box bounding the interquartile range (IQR) and whiskers showing the most extreme points within 1.5× IQR. All pair-wise comparisons were evaluated using Wilcoxon test.
Extended Data Fig. 9 |. Clinical implications of inflammation in AML.
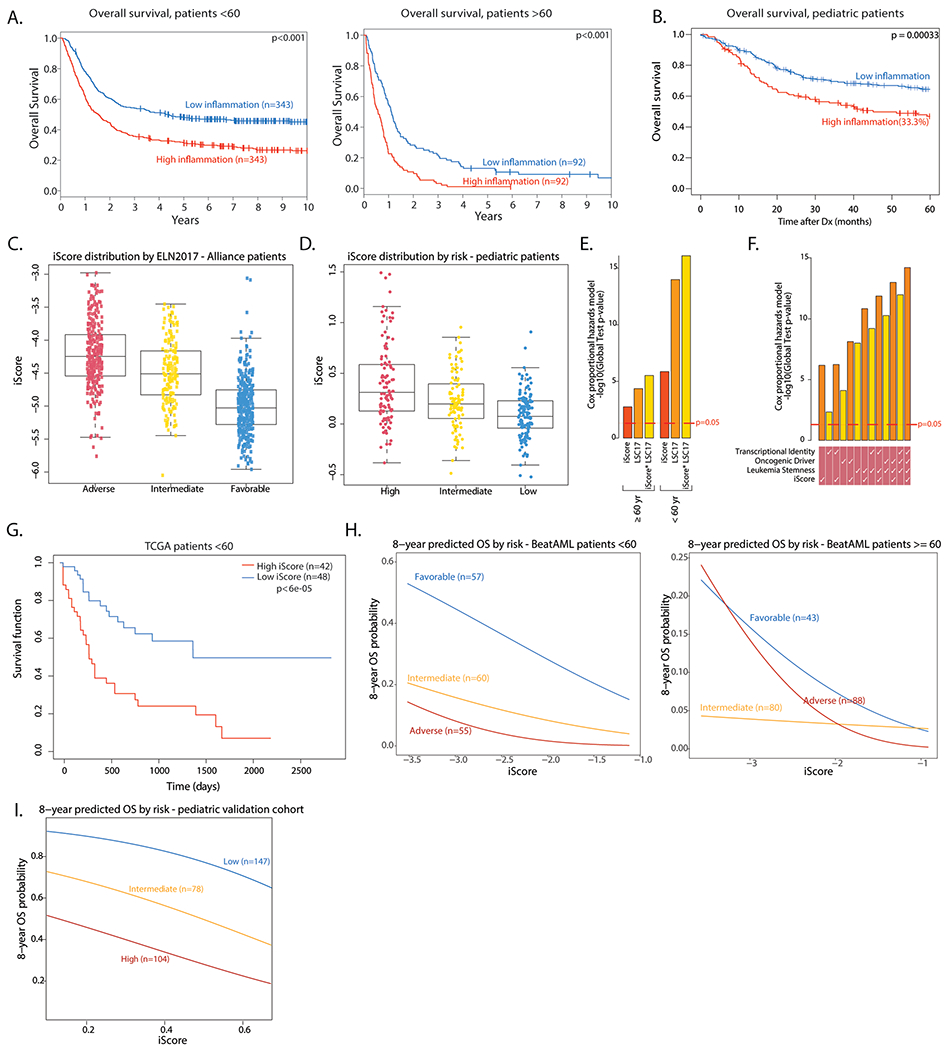
a. Overall survival of high and low inflammation adult AML patients in the Alliance cohort (n = 686 < 60 years old, n = 184 > =60 years old). Log rank test was used to evaluate significance. b. Overall survival of high and low inflammation pediatric AML patients in the TARGET-AML cohort (n = 336). Log rank test was used to evaluate significance. c. Distribution of the iScore in adult AML patients in the Alliance cohort, by risk (Adverse risk - n = 274, Intermediate risk - n = 176, Favorable - n = 359). Box plots represent the median with the box bounding the interquartile range (IQR) and whiskers showing the most extreme points within 1.5× IQR. d. Distribution of the iScore in pediatric AML patients in the TARGET cohort, by risk (High risk - n = 105, intermediate risk - n = 95, low risk - n = 136). Box plots represent the median with the box bounding the interquartile range (IQR) and whiskers showing the most extreme points within 1.5× IQR. e. Overall survival association of iScore and LSC17 in adult AML patients (n = 686 < 60 years old, n = 184 > =60 years old) assessed by global test. f. Overall survival association of iScore and other prognostic predictors in pediatric AML patients (n = 336) assessed by global test. g. Overall survival in high and low iScore patients in the TCGA AML cohort (<60 yrs, n = 90). h. 8-year predicted overall survival (OS) in favorable, intermediate and adverse risk adult AML patients in the BeatAML cohort (n = 172 < 60 years old, n = 211 > =60 years old), based on iScore. H. 8-year predicted OS in low, intermediate and high risk pediatric patients in a pediatric microarray cohort (n = 329), based on iScore.
Extended Data Fig. 10 |. Effect of iScore on event free survival in AML.
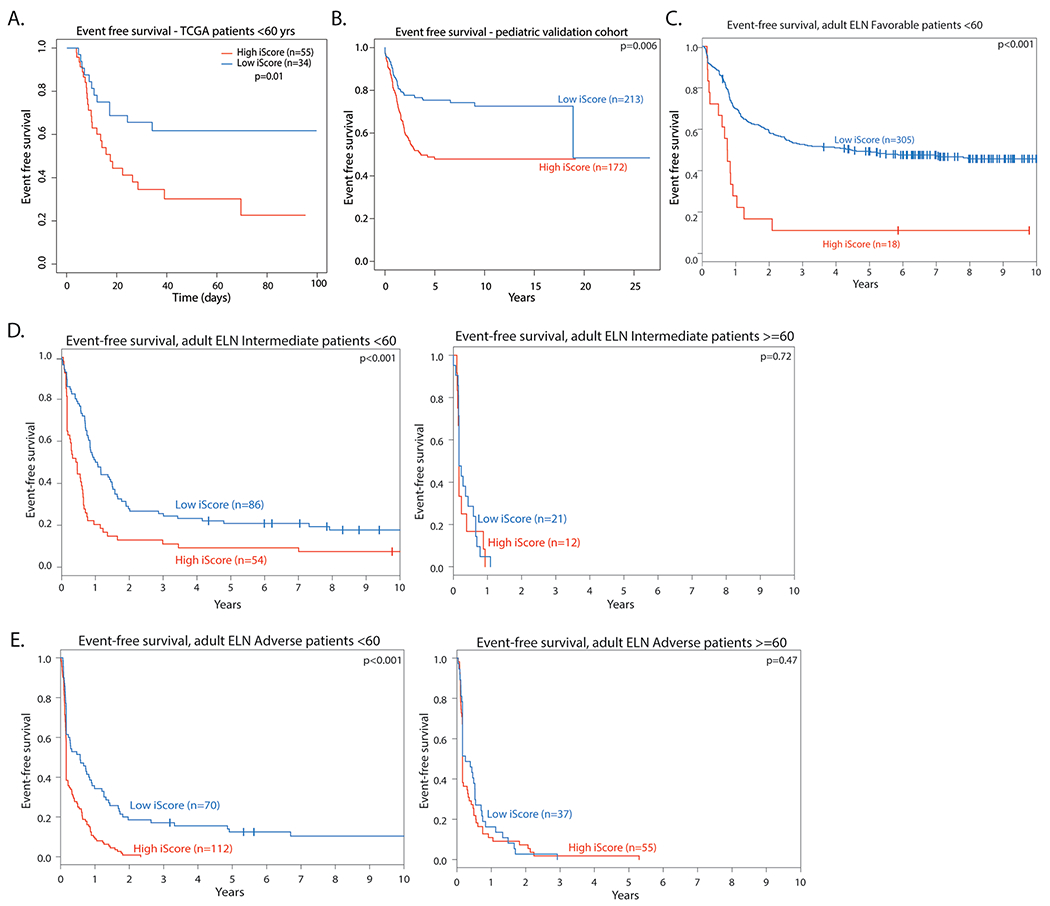
a. Event free survival in high and low iScore Favorable risk patients in adult patients in the TCGA AML cohort (<60 yrs, n = 89). Log rank test was used to evaluate significance. b. Event free survival in pediatric patients in a microarray cohort (n = 372). Log rank test was used to evaluate significance. c. Event Free survival in high and low iScore favorable risk patients in the Alliance AML cohort (n = 323 < 60 years old). Log rank test was used to evaluate significance. d. Event free survival in high and low iScore intermediate risk patients in the Alliance AML cohort (n = 140 < 60 years old, n = 33 > =60 years old). Log rank test was used to evaluate significance. e. Event free survival in high and low iScore adverse risk patients in the Alliance AML cohort (n = 182 < 60 years old, n = 92 > =60 years old). Log rank test was used to evaluate significance.
Supplementary Material
Acknowledgements
We thank all members of the Aifantis Laboratory for discussions throughout this project. A. Heguy and the NYU Genome Technology Center (supported in part by National Institutes of Health (NIH)/National Cancer Institute (NCI) grant P30CA016087-30) for expertise with sequencing experiments; the NYU Flow Cytometry facility for expert cell sorting and the Applied Bioinformatics Laboratory for computational assistance. I.A. is supported by the NIH (NCI and NHLBI) (R01CA271455, R01CA173636, 1R01CA228135, R01CA242020 and 1R01HL159175), the Vogelstein Foundation and the EvansMDS Foundation. T.A.G. was supported by the American Lebanese Syrian Associated Charities of St. Jude Children’s Research Hospital. A.L. was supported by the Aplastic Anemia and MDS International Foundation.
Footnotes
Code availability
All code used to generate and analyze data in this study is available on GitHub at https://github.com/BettinaNa/inflammation-immune-microenvironment-adult-pediatric-AML.
Competing interests
A.L., B.N., S.P., A.K.E., T.A.G. and A.I. submitted a patent application for the iScore patient risk stratification. I.A. is a consultant for Forsite Labs. T.A.G. is a consultant for Kura Oncology and Janssen. A.T. is a scientific advisor to Intelligencia AI.
Extended data is available for this paper at https://doi.org/10.1038/s43018-022-00480-0.
Supplementary information The online version contains supplementary material available at https://doi.org/10.1038/s43018-022-00480-0.
Data availability
Human scRNA-seq, CITE-seq and TCR-seq data were submitted to the Gene Expression Omnibus (GEO) repository and can be accessed under GEO accession no. GSE185381. The RNA expression data can be interactively explored and downloaded from the Single Cell Portal at https://singlecell.broadinstitute.org/single_cell/study/SCP1987. Newly generated RNA-seq data from the Alliance cohort can be accessed on GEO using accession no. GSE216738. Previously published AML cohorts and mouse scRNA-seq data that were re-analyzed here are available under GSE137851, GSE63646 and GSE182615. Human AML bulk RNA-seq data were derived from TCGA Research Network at http://cancergenome.nih.gov/. All other data supporting the findings of this study are available from the corresponding author on reasonable request. Source data are provided with this paper.
References
- 1.Shallis RM, Wang R, Davidoff A, Ma X & Zeidan AM Epidemiology of acute myeloid leukemia: Recent progress and enduring challenges. Blood Rev. 36, 70–87 (2019). [DOI] [PubMed] [Google Scholar]
- 2.Baryawno N. et al. A cellular taxonomy of the bone marrow stroma in homeostasis and leukemia. Cell 177, 1915–1932 (2019). [DOI] [PMC free article] [PubMed] [Google Scholar]
- 3.Hanahan D & Weinberg RA Hallmarks of cancer: the next generation. Cell 144, 646–674 (2011). [DOI] [PubMed] [Google Scholar]
- 4.Greten FR & Grivennikov SI Inflammation and cancer: triggers, mechanisms, and consequences. Immunity 51, 27–41 (2019). [DOI] [PMC free article] [PubMed] [Google Scholar]
- 5.Barreyro L, Chlon TM & Starczynowski DT Chronic immune response dysregulation in MDS pathogenesis. Blood 132, 1553–1560 (2018). [DOI] [PMC free article] [PubMed] [Google Scholar]
- 6.Carey A et al. Identification of Interleukin-1 by functional screening as a key mediator of cellular expansion and disease progression in acute myeloid leukemia. Cell Rep. 18, 3204–3218 (2017). [DOI] [PMC free article] [PubMed] [Google Scholar]
- 7.Hormaechea-Agulla D. et al. Chronic infection drives Dnmt3a-loss-of-function clonal hematopoiesis via IFNγ signaling. Cell Stem Cell 28, 1428–1442 (2021). [DOI] [PMC free article] [PubMed] [Google Scholar]
- 8.Galon J & Bruni D Tumor immunology and tumor evolution: Intertwined histories. Immunity 52, 55–81 (2020). [DOI] [PubMed] [Google Scholar]
- 9.Davids MS et al. Ipilimumab for patients with relapse after allogeneic transplantation. N. Engl. J. Med 375, 143–153 (2016). [DOI] [PMC free article] [PubMed] [Google Scholar]
- 10.Daver N. et al. Efficacy, safety, and biomarkers of response to azacitidine and nivolumab in relapsed/refractory acute myeloid leukemia: a nonrandomized, open-label, phase II study. Cancer Discov. 9, 370–383 (2019). [DOI] [PMC free article] [PubMed] [Google Scholar]
- 11.Domínguez Conde C. et al. Cross-tissue immune cell analysis reveals tissue-specific features in humans. Science 376, eabl5197 (2022). [DOI] [PMC free article] [PubMed] [Google Scholar]
- 12.Eraslan G. et al. Single-nucleus cross-tissue molecular reference maps toward understanding disease gene function. Science 376, eabl4290 (2022). [DOI] [PMC free article] [PubMed] [Google Scholar]
- 13.The Tabula Sapiens Consortium. The tabula sapiens: a multiple-organ, single-cell transcriptomic atlas of humans. Science 376, eabl4896 (2022). [DOI] [PMC free article] [PubMed] [Google Scholar]
- 14.Suo C. et al. Mapping the developing human immune system across organs. Science 0, eabo0510 (2022). [DOI] [PMC free article] [PubMed] [Google Scholar]
- 15.van Galen P. et al. Single-cell RNA-seq reveals AML hierarchies relevant to disease progression and immunity. Cell 176, 1265–1281 (2019). [DOI] [PMC free article] [PubMed] [Google Scholar]
- 16.Miles LA et al. Single-cell mutation analysis of clonal evolution in myeloid malignancies. Nature 587, 477–482 (2020). [DOI] [PMC free article] [PubMed] [Google Scholar]
- 17.Stoeckius M et al. Simultaneous epitope and transcriptome measurement in single cells. Nat. Methods 14, 865–868 (2017). [DOI] [PMC free article] [PubMed] [Google Scholar]
- 18.Darmanis S. et al. Single-cell RNA-seq analysis of infiltrating neoplastic cells at the migrating front of human glioblastoma. Cell Rep. 21, 1399–1410 (2017). [DOI] [PMC free article] [PubMed] [Google Scholar]
- 19.Jerby-Arnon L. et al. Opposing immune and genetic mechanisms shape oncogenic programs in synovial sarcoma. Nat. Med 27, 289–300 (2021). [DOI] [PMC free article] [PubMed] [Google Scholar]
- 20.Jerby-Arnon L. et al. A cancer cell program promotes T cell exclusion and resistance to checkpoint blockade. Cell 175, 984–997 (2018). [DOI] [PMC free article] [PubMed] [Google Scholar]
- 21.Neftel C. et al. An integrative model of cellular states, plasticity, and genetics for glioblastoma. Cell 178, 835–849 (2019). [DOI] [PMC free article] [PubMed] [Google Scholar]
- 22.Patel AP et al. Single-cell RNA-seq highlights intratumoral heterogeneity in primary glioblastoma. Science 344, 1396–1401 (2014). [DOI] [PMC free article] [PubMed] [Google Scholar]
- 23.Maynard A et al. Therapy-induced evolution of human lung cancer revealed by single-cell RNA sequencing. Cell 182, 1232–1251 (2020). [DOI] [PMC free article] [PubMed] [Google Scholar]
- 24.Braddom AE, Batugedara G, Bol S & Bunnik EM Potential functions of atypical memory B cells in Plasmodium-exposed individuals. Int. J. Parasitol 50, 1033–1042 (2020). [DOI] [PMC free article] [PubMed] [Google Scholar]
- 25.Portugal S. et al. Malaria-associated atypical memory B cells exhibit markedly reduced B cell receptor signaling and effector function. eLife 4, e07218 (2015). [DOI] [PMC free article] [PubMed] [Google Scholar]
- 26.Sutton HJ et al. Atypical B cells are part of an alternative lineage of B cells that participates in responses to vaccination and infection in humans. Cell Rep. 34, 108684 (2021). [DOI] [PMC free article] [PubMed] [Google Scholar]
- 27.Holla P. et al. Shared transcriptional profiles of atypical B cells suggest common drivers of expansion and function in malaria, HIV, and autoimmunity. Sci. Adv 10.1126/sciadv.abg8384 (2021). [DOI] [PMC free article] [PubMed] [Google Scholar]
- 28.Delhommeau F. et al. Mutation in TET2 in myeloid cancers. N. Engl. J. Med 360, 2289–2301 (2009). [DOI] [PubMed] [Google Scholar]
- 29.Papaemmanuil E. et al. Genomic classification and prognosis in acute myeloid leukemia. N. Engl. J. Med 374, 2209–2221 (2016). [DOI] [PMC free article] [PubMed] [Google Scholar]
- 30.Cai Z. et al. Inhibition of inflammatory signaling in Tet2 mutant preleukemic cells mitigates stress-induced abnormalities and clonal hematopoiesis. Cell Stem Cell 23, 833–849 (2018). [DOI] [PMC free article] [PubMed] [Google Scholar]
- 31.Zhang Q. et al. Tet2 is required to resolve inflammation by recruiting Hdac2 to specifically repress IL-6. Nature 525, 389–393 (2015). [DOI] [PMC free article] [PubMed] [Google Scholar]
- 32.Yeaton A et al. The impact of inflammation-induced tumor plasticity during myeloid transformation. Cancer Discov. 12, 2392–2413 (2022). [DOI] [PMC free article] [PubMed] [Google Scholar]
- 33.Krzyzak L. et al. CD83 modulates B Cell activation and germinal center responses. J. Immunol 196, 3581–3594 (2016). [DOI] [PubMed] [Google Scholar]
- 34.Ohkubo Y. et al. A role for c-fos/activator protein 1 in B lymphocyte terminal differentiation. J. Immunol 174, 7703–7710 (2005). [DOI] [PubMed] [Google Scholar]
- 35.Gerondakis S & Siebenlist U Roles of the NF-κB pathway in lymphocyte development and function. Cold Spring Harb. Perspect. Biol 2, a000182 (2010). [DOI] [PMC free article] [PubMed] [Google Scholar]
- 36.Pathak S, Ma S, Shukla V & Lu R A role for IRF8 in B cell anergy. J. Immunol 191, 6222–6230 (2013). [DOI] [PMC free article] [PubMed] [Google Scholar]
- 37.Holmes AB et al. Single-cell analysis of germinal-center B cells informs on lymphoma cell of origin and outcome. J. Exp. Med 217, e20200483 (2020). [DOI] [PMC free article] [PubMed] [Google Scholar]
- 38.Tsui C. et al. Protein kinase C-β dictates B cell fate by regulating mitochondrial remodeling, metabolic reprogramming, and heme biosynthesis. Immunity 48, 1144–1159 (2018). [DOI] [PMC free article] [PubMed] [Google Scholar]
- 39.Shao Y. et al. TXNIP regulates germinal center generation by suppressing BCL-6 expression. Immunol. Lett. 129, 78–84 (2010). [DOI] [PubMed] [Google Scholar]
- 40.Adachi T, Wakabayashi C, Nakayama T, Yakura H & Tsubata T CD72 negatively regulates signaling through the antigen receptor of B Cells. J. Immunol 164, 1223–1229 (2000). [DOI] [PubMed] [Google Scholar]
- 41.Gonzalez H, Hagerling C & Werb Z Roles of the immune system in cancer: from tumor initiation to metastatic progression. Genes Dev. 32, 1267–1284 (2018). [DOI] [PMC free article] [PubMed] [Google Scholar]
- 42.van der Leun AM, Thommen DS & Schumacher TN CD8+ T cell states in human cancer: insights from single-cell analysis. Nat. Rev. Cancer 20, 218–232 (2020). [DOI] [PMC free article] [PubMed] [Google Scholar]
- 43.Collier JL, Weiss SA, Pauken KE, Sen DR & Sharpe AH Not-so-opposite ends of the spectrum: CD8+ T cell dysfunction across chronic infection, cancer and autoimmunity. Nat. Immunol 22, 809–819 (2021). [DOI] [PMC free article] [PubMed] [Google Scholar]
- 44.Zhang J. et al. Immune receptor repertoires in pediatric and adult acute myeloid leukemia. Genome Med. 11, 73 (2019). [DOI] [PMC free article] [PubMed] [Google Scholar]
- 45.Ng SWK et al. A 17-gene stemness score for rapid determination of risk in acute leukaemia. Nature 540, 433–437 (2016). [DOI] [PubMed] [Google Scholar]
- 46.Fornerod M et al. Integrative genomic analysis of pediatric myeloid-related acute leukemias identifies novel subtypes and prognostic indicators. Blood Cancer Discov. 2, 586–599 (2021). [DOI] [PMC free article] [PubMed] [Google Scholar]
- 47.Kumar BV, Connors TJ & Farber DL Human T cell development, localization, and function throughout Life. Immunity 48, 202–213 (2018). [DOI] [PMC free article] [PubMed] [Google Scholar]
- 48.Récher C. Clinical implications of inflammation in acute myeloid leukemia. Front. Oncol 11, 623952 (2021). [DOI] [PMC free article] [PubMed] [Google Scholar]
- 49.Stark K & Massberg S Interplay between inflammation and thrombosis in cardiovascular pathology. Nat. Rev. Cardiol 18, 666–682 (2021). [DOI] [PMC free article] [PubMed] [Google Scholar]
- 50.Chaudhury S. et al. Age-specific biological and molecular profiling distinguishes paediatric from adult acute myeloid leukaemias. Nat. Commun 9, 5280 (2018). [DOI] [PMC free article] [PubMed] [Google Scholar]
- 51.Galletti G. et al. Two subsets of stem-like CD8+ memory T cell progenitors with distinct fate commitments in humans. Nat. Immunol 21, 1552–1562 (2020). [DOI] [PMC free article] [PubMed] [Google Scholar]
- 52.Abbas HA et al. Single cell T cell landscape and T cell receptor repertoire profiling of AML in context of PD-1 blockade therapy. Nat. Commun 12, 6071 (2021). [DOI] [PMC free article] [PubMed] [Google Scholar]
- 53.Stratmann S. et al. Transcriptomic analysis reveals pro-inflammatory signatures associated with acute myeloid leukemia progression. Blood Adv. 6, 152–164 (2022). [DOI] [PMC free article] [PubMed] [Google Scholar]
- 54.Butler A, Hoffman P, Smibert P, Papalexi E & Satija R Integrating single-cell transcriptomic data across different conditions, technologies, and species. Nat. Biotechnol 36, 411–420 (2018). [DOI] [PMC free article] [PubMed] [Google Scholar]
- 55.Heaton H. et al. Souporcell: robust clustering of single-cell RNA-seq data by genotype without reference genotypes. Nat. Methods 17, 615–620 (2020). [DOI] [PubMed] [Google Scholar]
- 56.Young MD & Behjati S SoupX removes ambient RNA contamination from droplet-based single-cell RNA sequencing data. GigaScience 9, giaa151 (2020). [DOI] [PMC free article] [PubMed] [Google Scholar]
- 57.Becht E. et al. Dimensionality reduction for visualizing single-cell data using UMAP. Nat. Biotechnol 37, 38–44 (2019). [DOI] [PubMed] [Google Scholar]
- 58.Witkowski MT et al. Extensive remodeling of the immune microenvironment in B cell acute lymphoblastic leukemia. Cancer Cell 37, 867–882 (2020). [DOI] [PMC free article] [PubMed] [Google Scholar]
- 59.Korsunsky I. et al. Fast, sensitive and accurate integration of single-cell data with Harmony. Nat. Methods 16, 1289–1296 (2019). [DOI] [PMC free article] [PubMed] [Google Scholar]
- 60.Stuart T. et al. Comprehensive integration of single-cell data. Cell 177, 1888–1902 (2019). [DOI] [PMC free article] [PubMed] [Google Scholar]
- 61.Kotliar D. et al. Identifying gene expression programs of cell-type identity and cellular activity with single-cell RNA-seq. eLife 8, e43803 (2019). [DOI] [PMC free article] [PubMed] [Google Scholar]
- 62.Finak G. et al. MAST: a flexible statistical framework for assessing transcriptional changes and characterizing heterogeneity in single-cell RNA sequencing data. Genome Biol. 16, 278 (2015). [DOI] [PMC free article] [PubMed] [Google Scholar]
- 63.The Cancer Genome Atlas Research Network. Genomic and epigenomic Landscapes of adult de novo acute myeloid Leukemia. N. Engl. J. Med 368, 2059–2074 (2013). [DOI] [PMC free article] [PubMed] [Google Scholar]
- 64.Farrar JE et al. Genomic profiling of pediatric acute myeloid Leukemia reveals a changing mutational Landscape from disease diagnosis to relapse. Cancer Res 76, 2197–2205 (2016). [DOI] [PMC free article] [PubMed] [Google Scholar]
- 65.Tyner JW et al. Functional genomic landscape of acute myeloid leukaemia. Nature 562, 526–531 (2018). [DOI] [PMC free article] [PubMed] [Google Scholar]
- 66.Papaioannou D. et al. The long non-coding RNA HOXB-AS3 regulates ribosomal RNA transcription in NPM1-mutated acute myeloid leukemia. Nat. Commun 10, 5351 (2019). [DOI] [PMC free article] [PubMed] [Google Scholar]
- 67.Eisfled A-K et al. The mutational oncoprint of recurrent cytogenetic abnormalities in adult patients with de novo acute myeloid leukemia. Leukemia 31, 2211–2218 (2017). [DOI] [PMC free article] [PubMed] [Google Scholar]
- 68.Simon N, Friedman JH, Hastie T & Tibshirani R Regularization paths for Cox’s proportional hazards model via coordinate descent. J. Stat. Softw 39, 1–13 (2011). [DOI] [PMC free article] [PubMed] [Google Scholar]
- 69.Breiman L, Friedman JH, Olshen RA & Stone CJ Classification And Regression Trees (Routledge, 2017). [Google Scholar]
- 70.Nicko V. Regression Modeling Strategies With Applications to Linear Models, Logistic and Ordinal Regression, and Survival Analysis. (Springer, 2015). [Google Scholar]
- 71.Goeman JJ, van de Geer SA, de Kort F & van Houwelingen HC A global test for groups of genes: testing association with a clinical outcome. Bioinformatics 20, 93–99 (2004). [DOI] [PubMed] [Google Scholar]
- 72.Goeman JJ ven de Geer SA & van Houwelingen HC Testing against a high dimensional alternative. J. R. Stat. Soc. Series B Stat. Methodol 10.1111/j.1467-9868.2006.00551.x (2006). [DOI] [Google Scholar]
- 73.Kim CC, Baccarella AM, Bayat A, Pepper M & Fontana MF FCRL5+ memory B cells exhibit robust recall responses. Cell Rep. 27, 1446–1460 (2019). [DOI] [PMC free article] [PubMed] [Google Scholar]
Associated Data
This section collects any data citations, data availability statements, or supplementary materials included in this article.
Supplementary Materials
Data Availability Statement
Human scRNA-seq, CITE-seq and TCR-seq data were submitted to the Gene Expression Omnibus (GEO) repository and can be accessed under GEO accession no. GSE185381. The RNA expression data can be interactively explored and downloaded from the Single Cell Portal at https://singlecell.broadinstitute.org/single_cell/study/SCP1987. Newly generated RNA-seq data from the Alliance cohort can be accessed on GEO using accession no. GSE216738. Previously published AML cohorts and mouse scRNA-seq data that were re-analyzed here are available under GSE137851, GSE63646 and GSE182615. Human AML bulk RNA-seq data were derived from TCGA Research Network at http://cancergenome.nih.gov/. All other data supporting the findings of this study are available from the corresponding author on reasonable request. Source data are provided with this paper.


