Abstract
Objective.
Our aim is to enhance sensory perception and spatial presence in artificial interfaces guided by EEG. This is done by developing a closed-loop electro-tactile system guided by EEG that adaptively update the electrical stimulation parameters to achieve EEG responses similar to the EEG responses generated from touching textured surface.
Approach.
In this work, we introduce a model that defines the relationship between the contact force profiles and the electrical stimulation parameters. This is done by using the EEG and force data collected from two experiments. The first was conducted by moving a set of textured surfaces against the subjects’ fingertip, while collecting both EEG and force data. Whereas the second was carried out by applying a set of different pulse and amplitude modulated electrical stimuli to the subjects’ index finger while recording EEG.
Main results.
We were able to develop a model which could generate electrical stimulation parameters corresponding to different textured surfaces. We showed by offline testing and validation analysis that the average error between the EEG generated from the estimated electrical stimulation parameters and the actual EEG generated from touching textured surfaces is around 7%.
Significance.
Haptic feedback plays a vital role in our daily life, as it allows us to become aware of our environment. Even though a number of methods have been developed to measure perception of spatial presence and provide sensory feedback in virtual reality environments, there is currently no closed-loop control of sensory stimulation. The proposed model provides an initial step towards developing a closed loop electro-tactile haptic feedback model that delivers more realistic touch sensation through electrical stimulation.
Keywords: haptics, EEG, electrical stimulation, touch
1. Introduction
In the last few decades there has been significant research efforts on developing haptic devices to deliver sense of touch. Haptic feedback devices provide tactile information to their users through the simulated sense of touch. For example, physicians training for surgical procedures in virtual environment, teleoperation of robotic arms and achieving sensation through neuroprothestics are some of the applications of such haptic devices [1–9]. Based on the stimulation methods/feedback to deliver sense of touch these devices can be separated into two categories (a) force and (b) electrical stimulation [10–13].
Force based devices use actuators, motors and vibrations to deliver touch-like sensation, while electrical stimulation devices use frequency and amplitude modulated electrical stimulation to deliver touch information. For example, pressure displays use simple actuators to press a surface against the user’s fingertip, which allows small forces to be detected by the user [14]. Vibrations with different patterns and frequencies are also used to deliver touch sensation through the user’s fingertip and forearm [15, 16]. Softness and hardness sensation of different objects can be delivered to users by changing the normal force patterns applied to the user’s skin [17, 18]. Texture properties of materials can be delivered by rendering friction using forces on the user’s hand [19]. Surface geometry, such as dents and bumps on a surface, is another factor that can be used to imitate shape cues. Moreover, through the generation of force patterns correlated with position, one can perceive perceptual cues of different objects [20]. Although there exists a vast development in force feedback based haptic devices, they tend to be expensive, heavy, not portable. Most importantly none of these devices provide tactile stimulation controlled based on a closed loop feedback such that the amount of force is controlled based on the feedback recorded from the users.
Electrical stimulation has gained more popularity due to its minimally invasive nature, small size, absence of the resonance characteristic of force actuators and ease of implementation [6–9, 21–24]. In previous studies, researchers succeeded in showing that electrical stimulation could be used as a potential mean of delivering sensation. For example, an electro-tactile augmentation method was developed to generate vibrotactile sensations, allowing texture modulation of real textured surfaces [25, 26]. This method was based on placing two stimulus electrodes at the subject’s finger to evoke neural activity. Results of this study showed that participants were able to perceive roughness of materials using electrotactile augmentation. Other studies showed that electrostatic force [27] and electrovibration [28] allow texture augmentation. Electrical stimulation also allowed texture augmentation for natural materials [29, 30]. Tactile grip force and hand opening information were delivered to the subjects using amplitude modulated electro-tactile feedback [31]. This was achieved by training and teaching the subjects to jointly distinguish between 27 different objects of varying size and their coupling electrotactile feedback. Subjects were able to distinguish between objects with 49.2% accuracy, which was shown to be above chance level. Although electrical stimulation devices gained popularity, they either depend on modulating the material or training the participants to perceive specific electrical stimulation patterns associated with touching various objects. In summary, force-feedback tends to be expensive, non-portable and limited to a small number of contact points. On the other hand, electro-tactile displays are compact and wearable but there remains many hurdles to be overcome to make the electrical stimulation-based tactile information more realistic the users. Finally, similar to the current force-based haptic devices, electrical stimulation-based haptic stimulation does not currently include any closed loop control.
Several parametric model-based approaches for haptic devices have been developed to mimic human’s touch sensation using electromyography signals [32–34]. However, these methods require knowing the exact muscle parameters. Furthermore, the convergence of these models’ parameters depend on the computational time and complexity. Recently, rapid advancements in machine learning (ML) lead to a huge progress in robotics [35–40], which lead to a development of several ML non-parametric models to mimic the human tactile sensation [41, 42]. However, none of the existing models include closed-loop feedback.
Electroencephalography (EEG) studies showed that EEG contains patterns that change when the amount or roughness of tactile feedback changes [32, 43–53]. Genna et al showed an increase in the power of the theta band (4–7 Hz) for 500 ms after the stimulus onset, which was distributed across the cortex, with a focus around the contralateral somatosensory region. This change was followed by a decrease in the power of the alpha band during passive stimulation, which was prominent in the somatosensory cortex and equally distributed in both contralateral and ipsilateral hemispheres [49, 54]. They also showed, in a later study, that there was a linear decrease in the alpha band amplitude when increasing the roughness of the tactile stimulus in both contralateral and ipsilateral sides [51]. Another study showed that there is a relation between roughness of the tactile stimulus and the power in the beta band over parietal regions contralateral to the stimulated sid [50]. Moreover, in previous work, we were able to identify EEG features, the total power in the mu (8–15 Hz) and beta (16–30 Hz) frequency generated around the sensorimotor region, that are able to classify textured surfaces on a single trial basis [52, 53].
Our overarching goal is to develop a closed-loop control of electrical stimulation to generate more realistic sense of touch. Our approach uses brain activity measured through EEG to develop a closed-loop generation of electrical stimulation that will have similar brain activity measured through EEG when an individual touches a textured surface and sense of touch depends on the contact forces. That is, in this paper we present an initial step towards building an EEG-guided closed-loop electro-tactile model that could generate electrical stimulation parameters corresponding to different force profile patterns. To achieve this, we first develop a model that defines the relationship between the brain activity recorded during passive touch and the brain activity in response to different electrical stimulation parameters. In order to obtain brain activity similar to the activity achieved in response to contact forces corresponding to different textured surfaces, the developed model is then used in an adaptive and closed-loop fashion, to update the electrical stimulation parameters.
2. Experimental study design
2.1. Participants
Eleven right-handed healthy subjects (five males, six females 27.5 ± 5.5 years) were recruited in this study. None of the subjects experience somatosensory or neurological deficits, physical limitation or skin rash. All subjects were provided written informed consent.
2.2. EEG data acquisition
For both the passive touch and electrical stimulation experiments, we recorded EEG according to the 10–20 system from 14-channels. The placement of the EEG electrodes was chosen to focus on the frontal and somatosensory cortices focusing around the sensorimotor integration regions (F3, F4, FC3, FC4, C1, C3, C5, CZ, C2, C4, C6, CP1, CPZ and CP2). For the reference, we used the left mastoid and for the ground we used the FPz. EEG data was recorded with 256 Hz sampling rate, then it was filtered using the amplifier’s filters; a 4th-order notch filter with cutoff frequencies of 58 and 62 HZ and an 8th-order bandpass filter with cutoff frequencies of 2 and 62 Hz. EEG data was further preprocessed using FIR band-pass filter designed using Kaiser window with cutoff frequencies: 8, 60 Hz.
2.3. Passive touch study
2.3.1. Tactile stimuli
We generated three textured surfaces (5 cm × 5 cm) using MATLAB, which represent three levels of roughness. Stereolithography (Viper SLA system, 3Dsystems, USA) was used for fabrication. Each texture is mounted on the force transducer and adjusted on a LEGO MINDSTORMS EV3 31313 Robot, as shown in figure 1. This robot was designed to perform both tap and rub movements. The subjects were asked to sit comfortably in front of the system setup and rest their right arm on a soft arm pillow.
Figure 1.

The passive touch study, where (a) the red rectangle showing the force transducer mounted on the robot moving arm. (b) The medium-rough surface mounted on top of the force transducer. (c) The robot’s moving arm tapping the participant’s finger tip with the medium- rough surface.
2.3.2. Data acquisition
Two g.USBamp (from g.tec medical engineering GmbH) amplifiers have been used for data recording, one for EEG data acquisition and one for force data. Force data was acquired using a force and torque transducer (NANO17 F/T transducer, ATI Industrial Automation, USA). Then, it was transferred to the analog inputs of the g.USBamp amplifier and sampled at 256 Hz. In previous work [52, 53], we showed that channels C1, C3 and C5 have the most significant responses related to texture information. In this study, we used the average of these three channels.
2.3.3. Experimental setup
The MINDSTORMS EV3 software was used to program 11 random set of sequences, one for each participant. Each sequence consists of six conditions: a combination of three texture surface and two movement types (rub or tap). Within a condition, each participant was instructed to place their hand comfortably on a foam hand-wrist rest while the robot moves its arm performing a rub or tap of the chosen surface multiple times for 2 min. The participants were also instructed to wear an ear-plug and look to a fixated cross on a black screen background during the robot movement. Cues were displayed to the subjects using Psychtoolbox (MATLAB) [55] and an event marker was sent to each amplifier to label the cue onset time of each condition (movement type and surface). Within each condition, there is a set of trials, which are segmented based on the normal force data to ensure we capture the first 500 ms after stimulation onset. A single trial is comprised of a complete rub or tap movement and lasts for 1 s, with inter-stimulus onset between one and two seconds chosen randomly. We followed the same steps we used in a previous work to segment the force and EEG data [52]. At the end of each condition, a ‘Rest’ message was displayed for 2 min. EEG and force data were then segmented per condition according to these event markers. Careful examination of the collected EEG and force data showed some artifacts in the force data collected. A window around the first 500 ms of data is chosen, and the data within this window is analyzed. The percentage of the rejected trials is 4% of the total number of trials.
2.4. Electrical stimulation study
2.4.1. Electrode location
The stimulus electrode is placed on the fingertip of the index finger near afferent nerves and the ground electrode is placed on the wrist bone. It is known that the fingertip has the highest density of mechanoreceptors, which are responsible for tactile sensation [56].
2.4.2. Data acquisition
An A-M systems 4100 Isolated High Power Stimulator was used to deliver the electrical stimulation pulses through disposable pre-gelled adhesive 20 mm Ag/AgCl disc electrodes. Moreover, a National Instrument USB Multifunction I/O DAQ Data Acquisition was used to synchronize both the EEG amplifier and the electrical stimulation device. Also this DAQ was used to send event markers to the amplifier to mark the beginning of the trial onset, while at the same time send the electrical stimulation parameters to the electrical stimulation device. These markers are then used to segment the EEG. The electrical stimuli in this study comprises of a sequence of amplitude and frequency modulated electrical pulses applied to the fingertip of the index finger. Figure 2 shows one of the subjects while being prepared for the experiment. Both perceptual and discomfort threshold levels for each participant were recorded using the fingertip of the right index finger. We conducted two experimental protocols; pulse modulation and amplitude modulation. The first is by varying the pulse rate and fixing the electrical stimulation amplitude. While the second protocol involves fixing the pulse rate and varying the electrical stimulation amplitude. Experimental protocol parameters as follows, pulse amplitude of 1.5 mA and pulse rate: 1, 50, 100, 200, 300, 400, 500 and 600 Hz. The second protocol has a pulse rate of 200 Hz and ten different pulse amplitude with a minimum value at the perception threshold and maximum value below the discomfort level, with a step equals = (the discomfort level – the perception threshold)/10. Both protocols have pulse width of 200 μs/phase, 20 ms of electrical stimulation. Each experimental protocol had a total of 500 trials delivered randomly to each participant, where the inter-stimulus interval was one second. Careful examination of the collected EEG data showed some artifacts in the EEG data collected from the electrical stimulation experiment. A window around the first 500 ms, at the beginning of trial onset time, of each trial data is chosen, and the data within this window is analyzed. The percentage of the rejected trials is between (min: 5, max: 12)% of the total number of trials per subject. Due to the limited number of samples per each stimulation condition, we grouped the data samples into four groups. Therefore, the frequency modulated data has originally eight conditions, we group them into two equal conditions, low and high frequency. Thus, low frequency group will contain the data coming from the following frequency conditions (1 Hz, 50 Hz, 100 Hz, 200 Hz), while the high frequency group contains the data have these conditions (300 Hz, 400 Hz, 500 Hz, 600 Hz). The amplitude modulated data is also grouped into two equal groups based on the amplitude condition used in the electrical stimuli.
Figure 2.
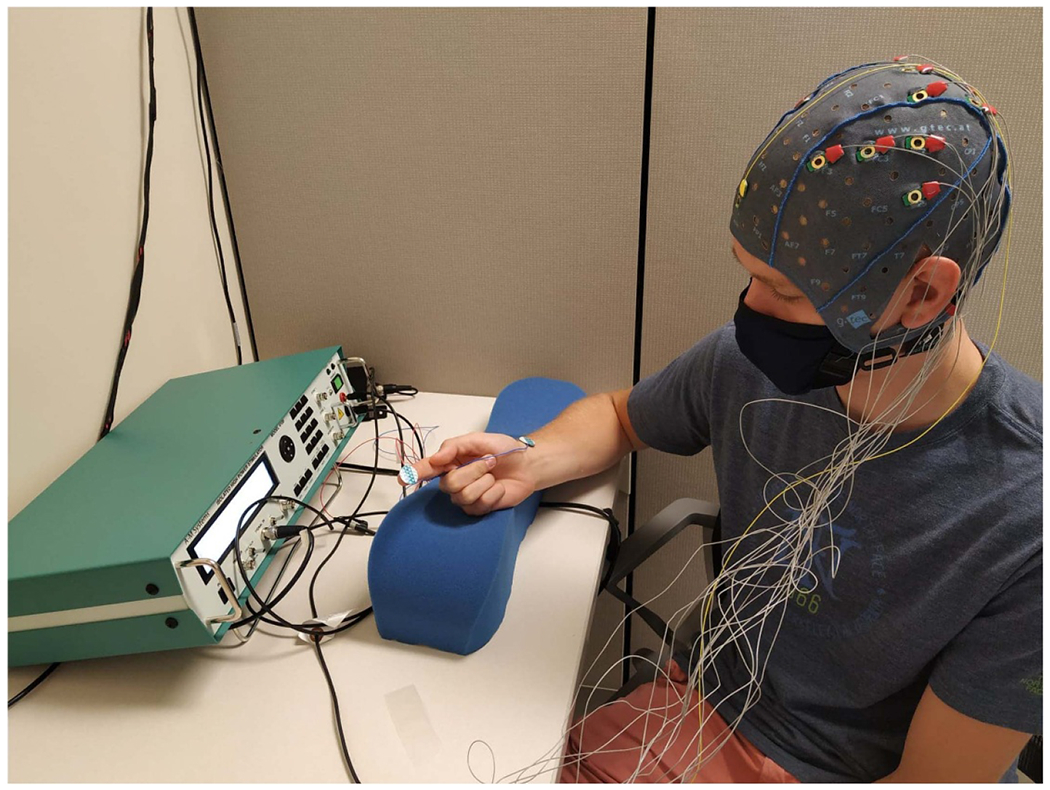
Experimental setup showing the participant getting ready for the experiment by wearing the EEG cap, while the electrical stimulation electrodes placed on the fingertip and wrist connected to the electrical stimulation device.
3. Methods
The flow diagram of the proposed model is shown in figure 3, where the oval shapes represent the input or output data and the rectangular shapes represent the operation that was done on the data. The details of each step are described in the following subsections.
Figure 3.
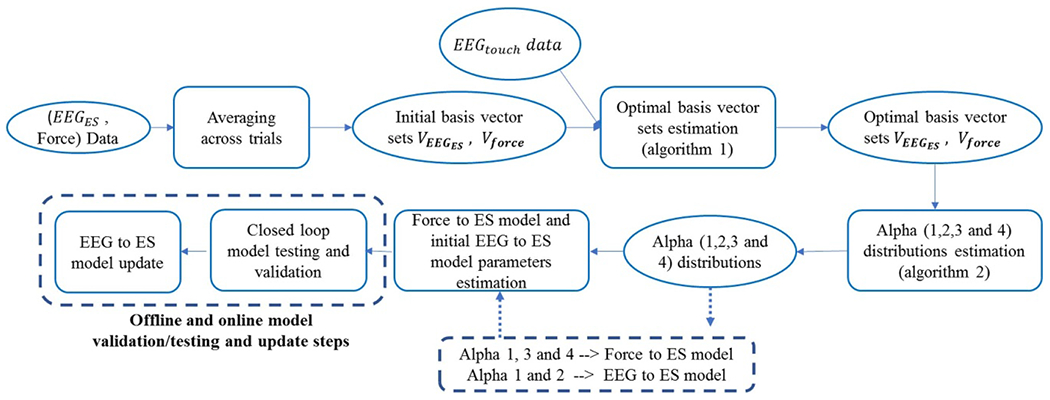
EEG guided electrical stimulation parameters generation from texture force profiles model’s flow diagram. The oval shapes represent the input/output data and the rectangular shapes represent the operation done on the data.
3.1. Model parameters
Four models have been designed to relate the EEG, force and electrical stimulation parameters as can be seen in table 1. Each alpha weight matrices (A1,A2,A3,A4) represent the projected weights or components of each set of data on the corresponding basis vectors set. For each movement condition (rub and tap), data collected during touch study was grouped into three groups based on the textured surface that was used. Also, the data collected during the electrical stimulation study was categorized into four groups based on the electrical stimulation condition as we described in the electrical stimulation data acquisition subsection. We refer to the EEG and force data collected during the touch study as EEGtouch and Force respectively, and the EEG collected during the electrical stimulation study as EEGES, where both EEGtouch and EEGES are the average of the EEG collected from channels C1, C3 and C5. Moreover, the electrical stimulation parameters were used to form a matrix called ES. each matrix of EEGtouch and Force is of size N × L, where N is the number of touch experiment trials, L is the trial length. While, each matrix of EEGES and ES is of size M × L, where M is the number of electrical stimulation trials and L is the trial length. For cross validation, each group of data (EEGtouch, Force, EEGES and ES), was divided into five folds, where 80% of the data was used during the training and 20% for testing.
Table 1.
Models and alpha notations.
| Alpha | Model equation |
|---|---|
| 1 | ES = A1 VEEGES |
| 2 | EEGES = A2 VEEGES |
| 3 | EEGtouch = A3 V force |
| 4 | EEGtouch = A4 VEEGES |
Algorithm 1.
Optimal set of basis vectors estimation.
| for Each Surface (l = 1 : 3) do |
| for Each model in table 1, Estimate Am,l where Output = AV do |
| * Estimate Am,l such that where V is the set of basis vectors. |
| * A number of circular shifts on the initial set of basis vectors were applied and the fitting error for each step of shift was recorded. |
| * For models 1, 2 and 4 estimate A1,l, A2,l and A4,l such that: |
| Then select the final set of basis vectors for VEEGES that minimize the fitting error of models 1, 2 and 4 such that: which can be written as: X = AVEEGES |
| Hence, VEEGES can be estimated as follows: |
| VEEGES = (ATA)−1 ATX |
| where By solving the three models simultaneously we ensure that the estimated VEEGES fit the three models. |
| For model 3, where EEGtouch = A3,lVforce |
| The optimal set of basis vectors can be found by solving |
| end for |
| end for |
Force and EEGES training data was used to form an initial set of basis vectors as shown in figure 4. A set of vectors, V is called a set of basis vectors if every element in the vector space can be written as a finite linear combination of the basis vector set in a unique way, and the elements of the basis vector are linearly independent [57]. We used the Gaussian–Jordan elimination method to check for linear independence for each set of basis vectors [58].
Figure 4.
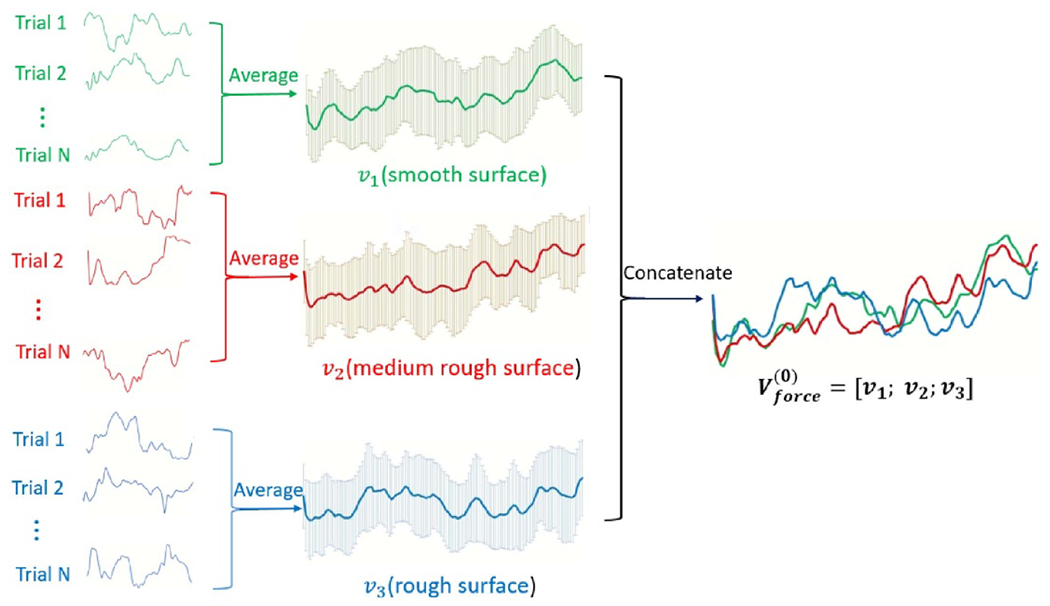
Basis vectors initial set illustration. The left hand side shows the trials of the force data averaged per each class (smooth in green, medium rough in red and rough in blue color). The results of each averaging operation is shown (mean ± SD) at each time index. The three averaged vectors is then concatenated to form the matrix V(force).
Therefore, the initial basis set of vectors for the force data collected can be written as:
| (1) |
where v1, v2 and v3 are the means of the force data trials collected during touching the smooth, medium rough and rough surfaces respectively, as can be seen in figures A1(a) and (b). Each basis vector, v, is of size 1 xL, where L is the trial length, and is of size 3 xL.
Moreover, the initial basis set of vectors for the EEG collected during the electrical stimulation experiment can be written as:
| (2) |
where v1:4 are the means of electrical stimulation trials data corresponding to (low, high frequency, low and high amplitude) groups. Each basis vector, v, is of size 1 xL, where L is the trial length, and is of size 4 XL.
After creating an initial sets of basis vectors, the circular shift method [59] was used to find the optimal set of basis vectors for each model that minimizes the fitting error, and the Gaussian-Jordan elimination method was applied after each shift to check for linear independence. The values of circular shift were chosen to minimize the overlap between the signals after applying the shift. The range of values are 50, 25, 12 and 6 ms. After finding the final optimal sets of basis vectors, the size of each alpha matrix would be as follows; A1 (MXK1), A2 (MXK1), A3 (NXK2) and A4 (NXK1), where N is the number of EEG trials during the passive touch study, M is the number of EEG trials during the electrical stimulation study. Furthermore, K1 represents the optimal number of basis vectors for VEEGES and K2 represents the optimal number of basis vectors for Vforce. A summary of the steps of estimating the optimal sets of basis vectors and fitting error calculation is shown in algorithm 1.
The components of each Alpha matrix, A, are used to form a distribution that represents each model. Therefore, kernel density estimation method was used to find the probability distributions of A1, A2, A3, and A4. Kernel density estimation is a non-parametric method used to estimate the probability density function of a random variable, where inferences about the population are made, based on a finite data sample [60, 61 ]. A summary of the steps of estimating the alpha distributions and sampling process is shown in algorithm 2. Note that the samples from these distributions are also used in this manuscript for five-fold cross validation and generalization testing.
Algorithm 2.
Alpha distributions estimation and sampling.
| for Each model m and Alpha weights Am where Output = AV do |
| * Kernel density estimation |
| for Each basis vector in the basis vector set V, where do |
| * We have Estimate the probability density function of the values of corresponding to the basis vector by using the kernel density estimation method. |
| * For each estimated probability density function, estimate the band width corresponding to . |
| * Sampling |
| for each sample do |
| * Randomly sample one value from . |
| * Build a normal distributions , where the mean is and the standard deviation is the band width estimated previously, . |
| * Sample value corresponding to which is a single sampled value from the estimated distribution . |
| * Repeat these steps for all basis vectors in the basis vector set V to get sample batches of . |
| end for |
| end for |
| end for |
3.2. Model equations and online update
By using models one, three and four shown in table 1, we can find a relation between the force profile parameters and electrical stimulation parameters. We know that:
| (3) |
| (4) |
Hence,
| (5) |
| (6) |
Also, we know that
| (7) |
Therefore, we can write the following equation which explains the relation between the electrical stimulation parameters and the force profile parameters as follows:
| (8) |
| (9) |
where β = A1(A4)−1A3.
Hence, by knowing the distributions of A1, A3 and A4, which have been generated using the data we collected previously; we can convert force patterns into electrical stimulation parameters. Our next step is to close the feedback loop and show how we are going to use this model in an online setup while adaptively improving the EEG signal elicited by the electrical stimulation to mimic the EEG signal elicited by touching different textured surfaces, as shown in figure 5.
Figure 5.
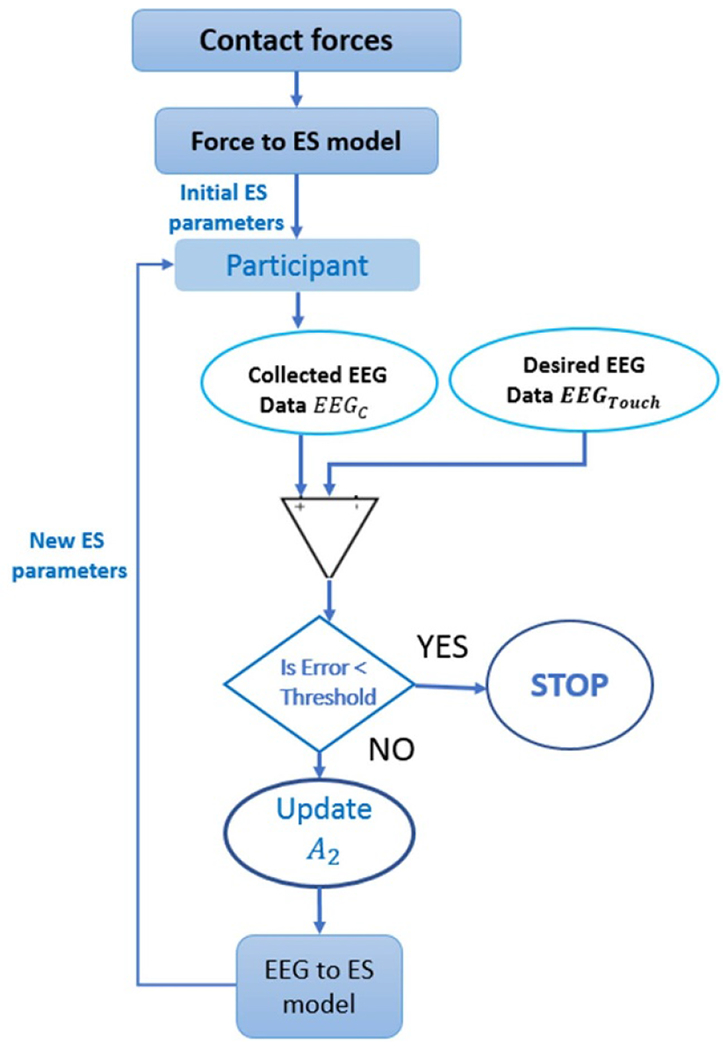
Schematic diagram showing the adaptively iterative method to update the electrical stimulation parameters guided by EEG data.
By using models one and two, we can write the following relation between the EEG elicited by electrical stimuli and the electrical stimulation parameters:
| (10) |
So we will start by sampling a batch of samples from A1, A3 and A4 distributions using the method shown in algorithm 2. Then estimate the initial electrical stimulation parameters ESs using the trained basis vector set Vforce and the sampled data , and as follows:
| (11) |
Afterwards, we will apply this set of electrical stimuli, ESs, and collect EEG data (EEGES0). The next step is to calculate the error between the newly collected EEG, EEGES0, and the EEG data we want to achieve, EEGtouch, we calculate the normalized mean squared error as follows:
| (12) |
The collected EEG data, EEGES0, then will be used to update the distribution of A2. Then in an iterative way, as shown in figure 5, we will follow the following steps:
- Estimate newly updated ES such that:
(13) Apply electrical stimulation and collect new EEG data.
Calculate the error between the newly collected EEG and EEGtouch, if below certain threshold, then the acquired EEG is similar to the EEGtouch, so we stop. If not, update the A2 distribution and repeat. By following these steps, we try to minimizes the difference between the EEG resulting from touching a specific surface and EEG coming from electrical stimulation.
3.3. Testing and validation
In order to test the validity of the proposed model in generating EEG signal elicited by the electrical stimulation that mimics the EEG signal elicited by touching different textured surfaces, we designed an offline validation test using the data we collected previously.
The first step in this validation test is to use the trained distributions A1, A2, A3 and A4 corresponding to textured surface l, to sample batch of M samples of , , and .
- Then, we estimate ESs and using the trained basis vector set Vforce and the sampled data , and as follows:
(14) (15) - Afterwards, we estimate
and calculate the error as follows:(16) (17) - The next step is to use the test data EEGtouchtest to estimate an update for and as follows:
(18) (19) - Then, update the electrical stimulation parameters:
(20) - Estimate new where:
where , where this condition will be satisfied when after a number of iterations at which will be similar to .(21) - Calculate
(22)
4. Results and discussion
4.1. Basis vectors and model fitting
Figures A1(a), (b) and A2 in appendix A, show the initial set of vectors for VEEGES and Vforce, where the x-axis is the time in milli-second and the y-axis is the amplitude in micro Volt for VEEGES and Newton for the Vforce. A set of vectors, V is called a set of basis vectors if every element in the vector space can be written as a finite linear combination of of the the basis vector set in a unique way, and the elements of the basis vector are linearly independent [57]. The initial set of vectors showed linear independence, but the fitting error was high. Therefore, a set of circular shifts were applied to each one of the initial sets of vectors, as shown in figures A3–A5 in appendix A. After each circular shift the number of basis vectors in the basis vector set increases which improve the signal presentation and model fitting. The Gaussian-Jordan elimination method was applied on every basis set of vectors after each circular shift to check for linear independence. The results showed that the linear independence condition was satisfied after each shift.
Figures A6–A8, in appendix A, show the progress of applying the circular shift on the fitting of the EEG signals. The x-axis represents the time in milli seconds and the y-axis represents the signal amplitude in micro Volt. Moreover, the blue line represents the true signal, where the red line represents the predicted signal. We can notice that after each increase of the circular shift step, the estimation of the predicted signal gets better. The initial set was able to capture some of the general behavior of the signals, while the first set was able to get more better prediction of this general behavior. We can notice that the second set of basis vectors was able to get a more refined representation of the peaks and valleys of the EEG signal, but failed to capture the fine details. The third set of basis vectors showed better representation in terms of the fine responses in the EEG while capturing all the large transitions. Finally, the fourth set shows the best prediction, where both the true and predicted signals look identical with very few minor differences. The mean and standard deviation of the fitting error per each circular shift step can be shown in figures 6 and 7, where the x-axis is the index of the basis vector set and y-axis is the normalized root mean squared error of fitting per each time index. We can see for each model that for each increase in the circular shift, which reflects the increase in the number of basis vectors, the overall average fitting error decreases.
Figure 6.

The mean and SD of the normalized RMSE for each set of basis vectors for model 1 (a) and model 2 (b) across the eleven participants, where x-axis is the index of the basis vector set and y-axis is normalized root mean square error of fitting (%).
Figure 7.

The mean and SD of the normalized RMSE for each set of basis vectors for model 3 (a) and model 4 (b) across the eleven participants, where x-axis is the index of the basis vector set and y-axis is normalized root mean square error of fitting (%).
Figure 6(a) shows the progress of fitting for the electrical stimulation parameters on the VEEGES basis vectors sets, which represents model 1 fitting progress. The fitting of low and high amplitude electrical stimulation parameters show better results than the high and low frequency parameters data, where at the end of the fourth circular shift all the data except for the low frequency data reach around 20% normalized root mean square error. The decrease in the average normalized root mean square error represents the enhancement in the ability of the model to represent the electrical stimulation parameters. We performed a one-sided Wilcoxon statistical rank test to compare the error between (a) low and high amplitude and (b) high and low-frequency parameters data. The null hypothesis states that the median of the accuracies of the low and high amplitude electrical stimulation data is not greater than that of high and low-frequency parameters data. While the alternative hypothesis states that the median of the accuracies of the low and high amplitude electrical stimulation data is greater than that of that of high and low-frequency parameters data. The results showed the rejection of the null hypothesis (equal accuracies) with a statistical significance p-value = 1.0326 × 10⁻⁴.
The fitting of the EEG induced by the electrical stimulation parameters using the VEEGES basis vectors sets is shown in figure 6(b), where the fitting error starts between(20%–23%) with around 8% standard deviation of error, until it reaches (4% ± 1%) of normalized root mean square error of fitting. The monotonic decrease of the average normalized root mean squared error shows the progress of the enhancement in the model fitting and it is ability to represent the EEG induced by the electrical stimulation. Similarly for figure 7(a), the fitting error progress for the EEG induced by touching the three textured surfaces starts with an average of (19% ± 4%) and reaches (5% ± 1%) at the end of the fourth circular shift. Finally, figure 7(b) shows the fitting error for the fourth model which starts with an average of (20% ± 3%) and reaches (4% ± 1%) at the end of the fourth circular shift. It can be shown that the average root mean square error starts to increase after the fourth circular shift, hence, the chosen basis vector sets shows the optimum number of basis vectors that provide the lowest fitting error for all the four models shown in table 1. For the cross validation step, we applied the chosen optimal set at each fold on the test data set. A sample of the results can be seen in figure 8, where the blue line represents the true test EEG data and red line is the predicted EEG data. We can see that the estimated model was able to predict the test data with very small differences between the true and predicted data. Moreover, the average and standard deviation of the root mean squared error on the test data as follows, 25 ± 8, 7 ± 3, 8 ± 2 and 5 ± 2.5 for models 1, 2, 3 and 4 respectively.
Figure 8.
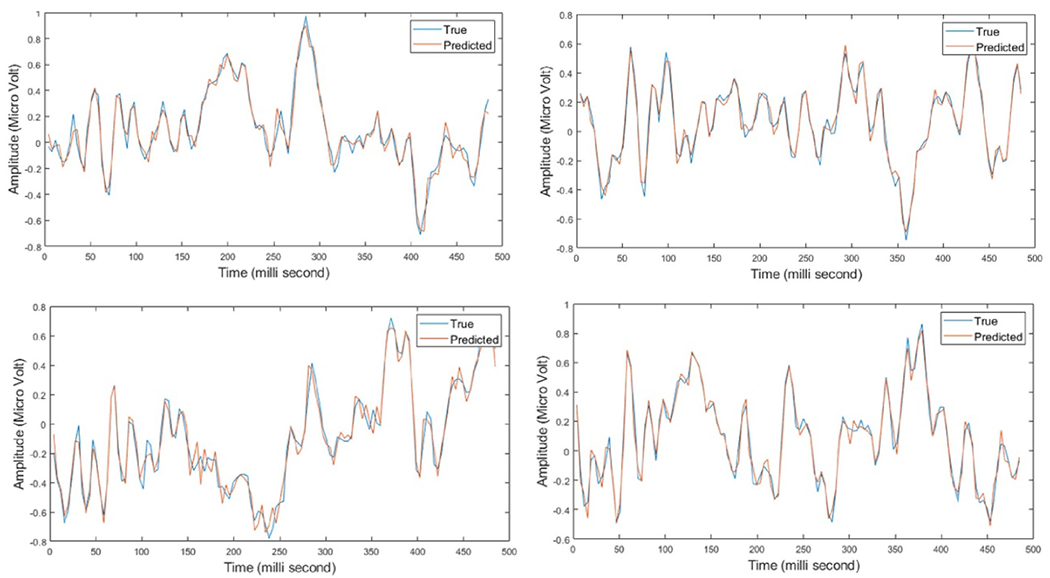
Four samples of the EEG (touch) test data after applying the optimal set of basis vectors for model 3, where the red line represents the estimated, after fitting, EEG (touch) data and blue line presents the actual EEG (touch) data. The x-axis represent time in milli-second, while the y-axis represent the amplitude in micro-Volt.
4.2. Model validation
The results of the validation of the proposed model in generating EEG signal elicited by electrical stimulation that mimics the EEG generated by touching textured surfaces is shown in figures 9 and 10. Our initial step was to sample a batch of alpha samples, then use these sampled alphas to generate an initial set of electrical stimulation. After that, we used equation 10 to find the expected EEGES. Then we use the same sampled patch of alpha 3 to generate EEGTouch. After that, we compare both estimated EEG signals to see how different the EEG generated by the initial set of electrical stimulation from the EEG generated from touching textured surface during the initial step. The average normalized root mean squared error between EEGtouch and the predicted signal EEGES was calculated on a window based approach is shown in figure 9. The window based approach starts by dividing the 500 ms signal into 15 equal segments, and the normalized average root mean square error is calculated within each segment. By doing that we can investigate the error propagation and distribution across each time segment. We can see that the error at this initial step is around 25% along the EEG signal for all surface and movement conditions. The next step is to estimate an update for alpha 3 and 4, and update the electrical stimulation parameters. By equating alpha 2 and alpha 4 distributions, we assume that EEGES is now similar to EEGtouch. Therefore, the corresponding electrical stimulation parameters can be used to generate EEG that mimics the EEG generated from touching the textured surfaces. We can see that the error decreases when both alpha 2 and alpha 4 distributions become similar, as shown in figure 10. It is worth mentioning that the average of the normalized root mean squared error between the EEG generated from ((a) smooth, (b) medium rough and (c) rough) surfaces is around 25% along the EEG signal. The mean and standard deviation of the error between each pair of data, across participants, (corresponding to EEG (surfaces)) is shown in figure B1 in appendix B.
Figure 9.
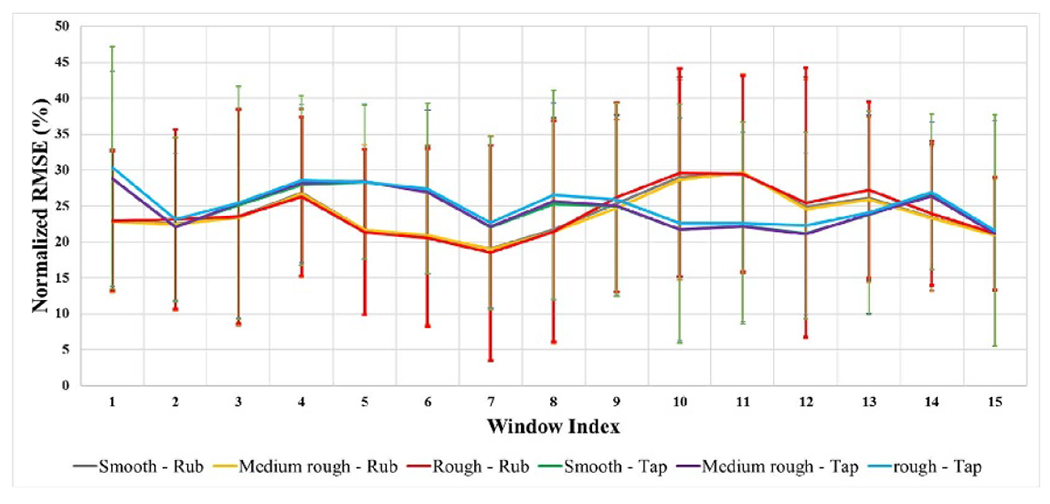
The mean and standard deviation of the normalized root mean squared error for validation step one.
Figure 10.
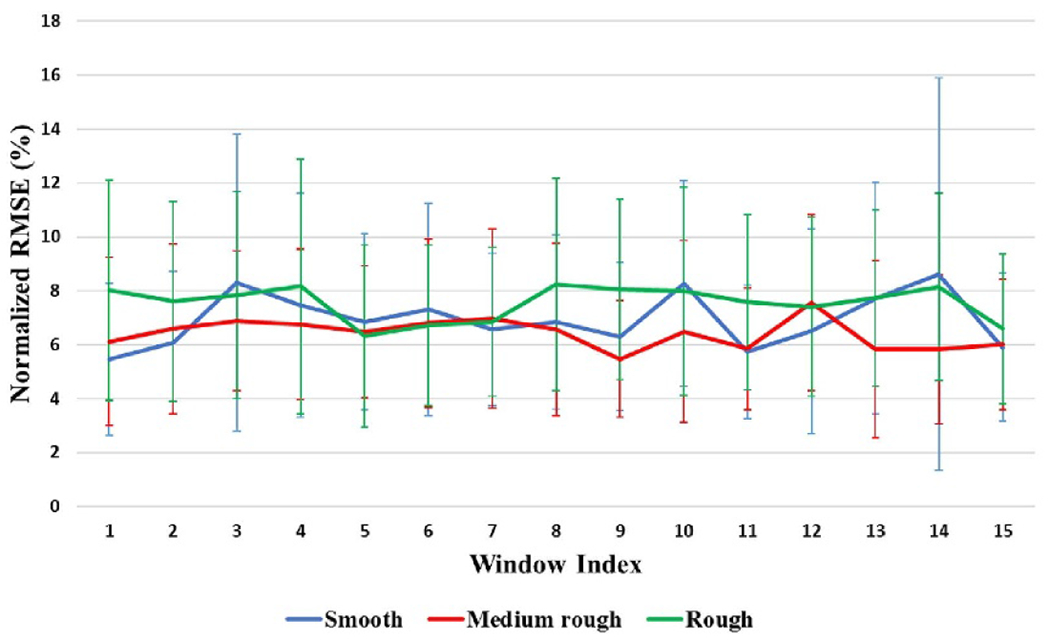
The mean and standard deviation of the normalized root mean squared error for validation step two.
Figure 11 shows a sample result of our offline validation, where the blue line represents the actual collected EEGtouch data and the red line represents the predicted EEGES after using the electrical stimulation parameters generated by our model.
Figure 11.

Two samples of the EEG (touch) data, where the red line represents the predicted EEG that has been generated by the proposed model and blue line presents the actual EEG (touch) data. The x-axis represent time in milli-second, while the y-axis represent the amplitude in Volt.
5. Conclusion
In this work, we propose a linear model based on collected EEG data from passive touch and electrical stimulation studies. This model is able to define the relation between the contact force profiles generated from touching different textured surfaces and the electrical stimulation parameters. Our aim is to use the EEG data to provide closed loop feedback, which enables an online update to the electrical stimulation parameters to achieve EEG signals elicited by electrical stimulation similar to the EEG signal generated from touching surfaces with different levels of roughness. We were able to show that at the initial step of our model update, we were able to achieve an average error 26% along the EEG signal. also, our offline validation analysis showed that by iteratively update the model parameters we would be able to decrease this error to around 7%. By using this model, we would be able develop electrical stimulation based haptic devices that use electrical stimulation pulses to mimic texture sensation, which overcomes the limitations of the force based haptic devices. Our future work is to validate this model in an online setting, by using the generated electrical stimulation parameters from the proposed model to generate electrical stimuli that will be applied to the participants while recording EEG. The collected EEG will be compared against the EEG collected during touching the textured surfaces. Moreover, participants will be asked to complete a set of questionnaires and surveys (such as presence questionnaire and immersive tendencies questionnaire) to measure the spatial presence they feel [62, 63].
Acknowledgment
This work was funded by the National Science Foundation Grant No. 1717654 and the National Institue of Health Grant No. T32 MH018951-32.
Appendix A. Basis vectors
Figure A1.

Force data initial basis vectors set while doing rub (a) and tap (b) movement, where x-axis is the time in milli-second and y-axis is the amplitude in N. Blue, red and green colors represent the force generated from touching the smooth, medium rough and rough surfaces, respectively.
Figure A2.
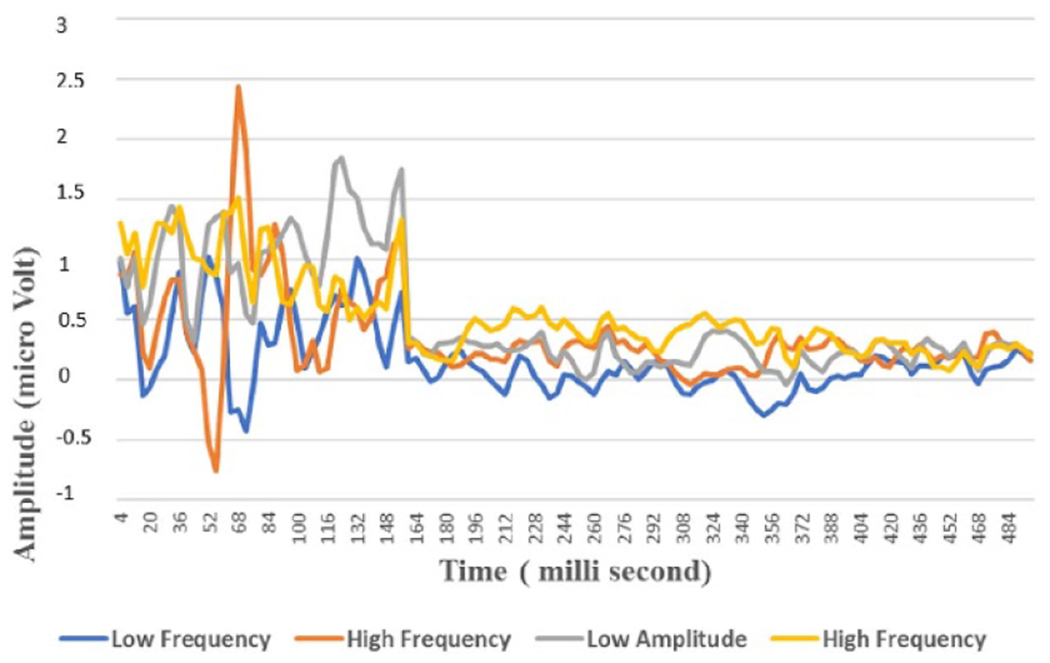
EEG electrical stimulation initial basis vectors set where x-axis is the time in milli-second and y-axis is the amplitude in micro Volt. Blue, orange, grey and yellow colors represent the low, high frequency, low and high amplitude EEG.
Figure A3.
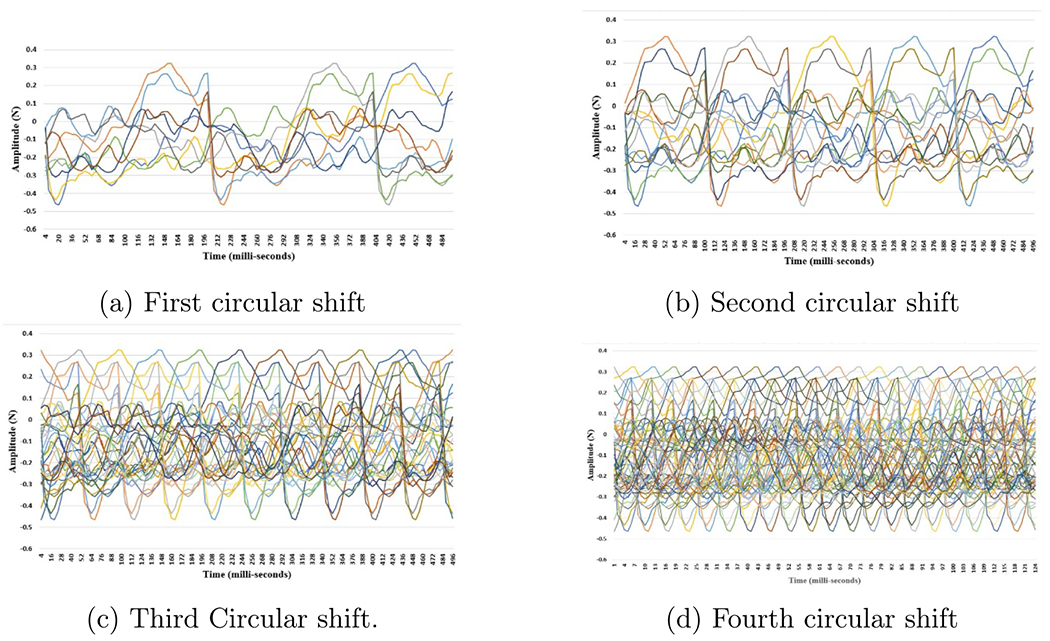
Force basis vectors sets generated from force data collected during rub movement, where x-axis is the time in milli-second and y-axis is the amplitude in N.Rub data.
Figure A4.
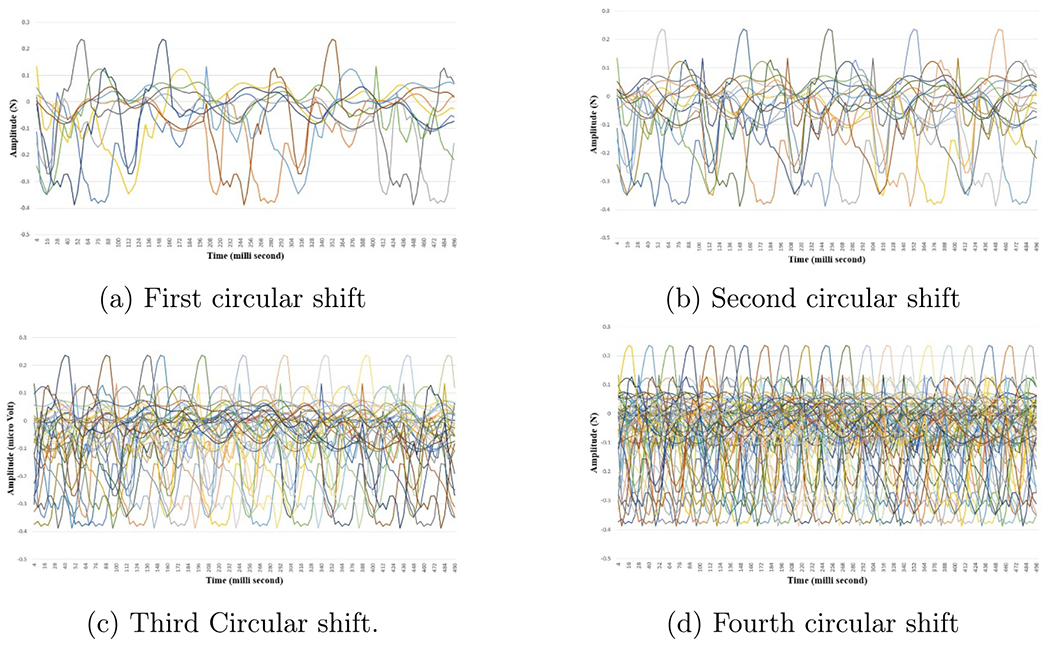
Force basis vectors sets generated from force data collected during tap movement, where x-axis is the time in milli-second and y-axis is the amplitude in micro Volt.
Figure A5.
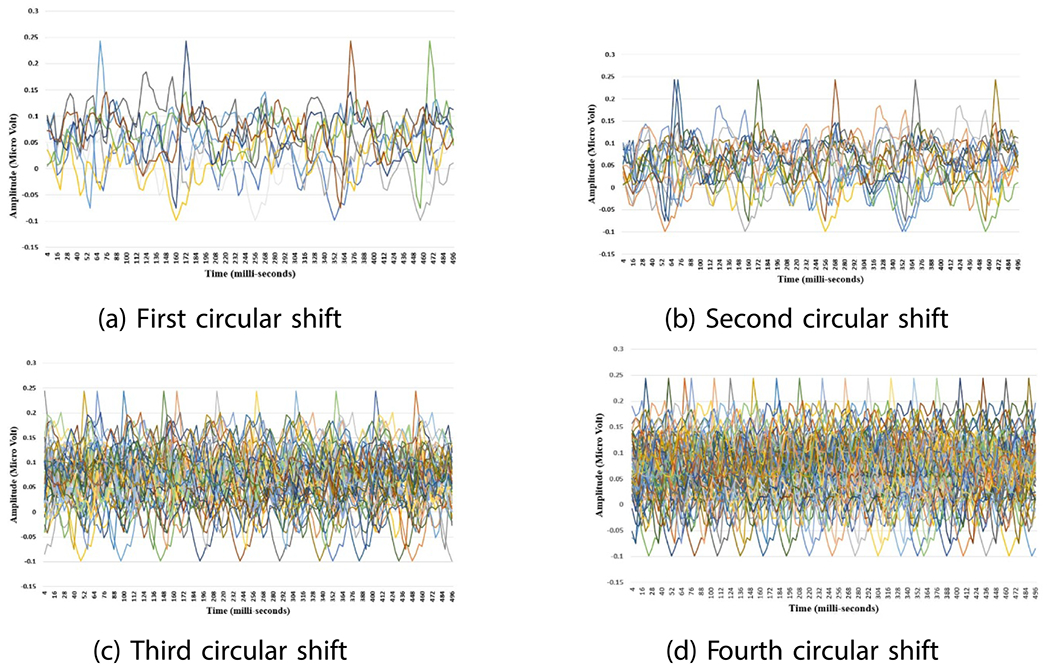
EEG induced by electrical stimulation basis vectors.
Figure A6.
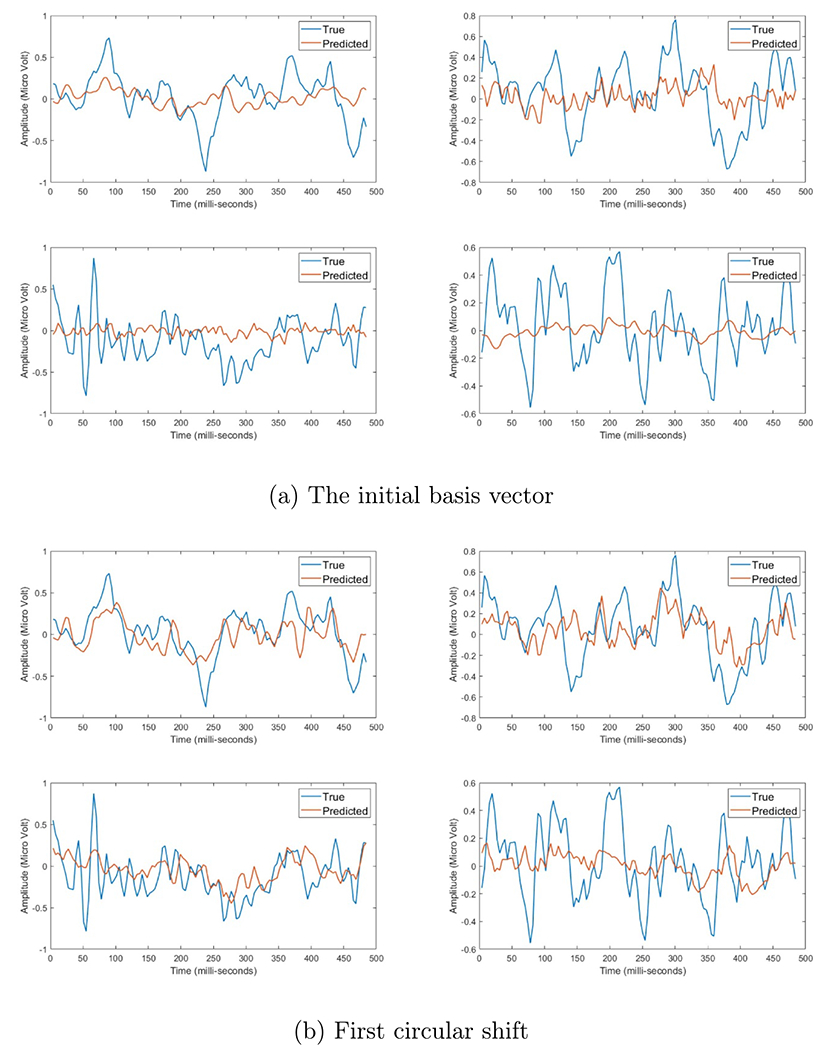
Four EEG responses induced by electrical stimulation after using each set of basis vectors, where the red line represents the estimated data and blue line presents the actual data. the x-axis represent time in milli-second, while the y-axis represent the amplitude in micro-Volt.
Figure A7.
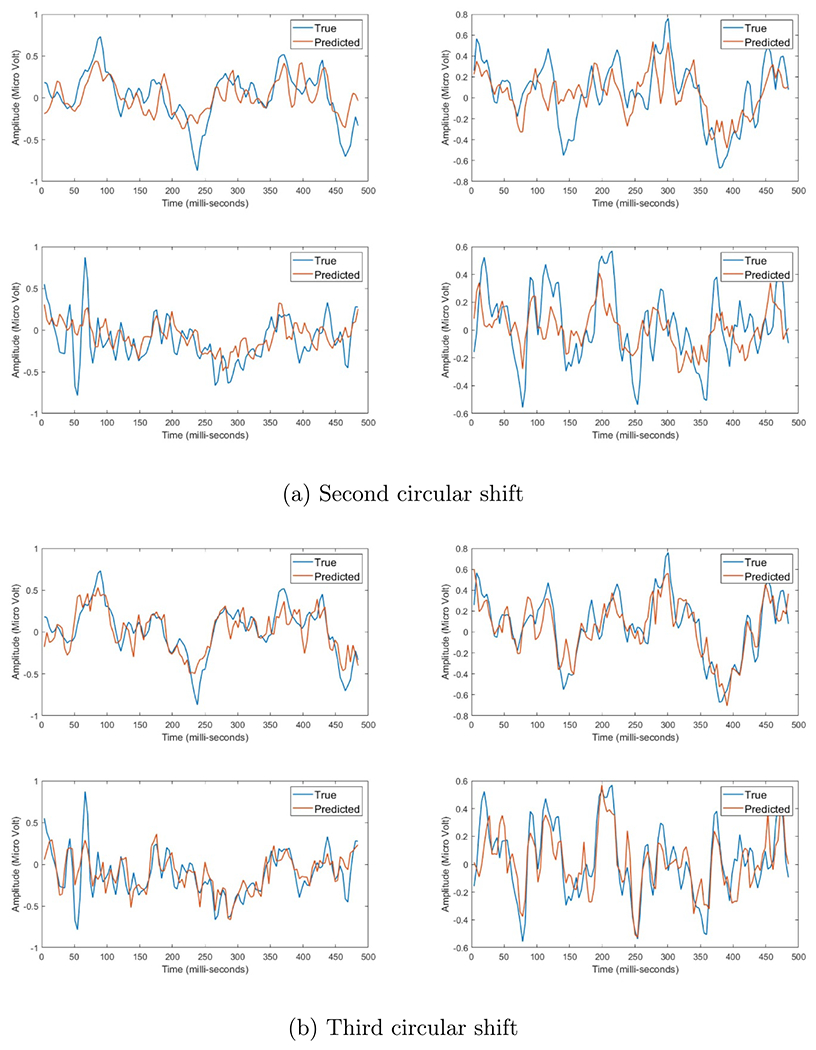
Four EEG responses induced by electrical stimulation after using each set of basis vectors, where the red line represents the estimated data and blue line presents the actual data. the x-axis represent time in milli-second, while the y-axis represent the amplitude in micro-Volt.
Figure A8.
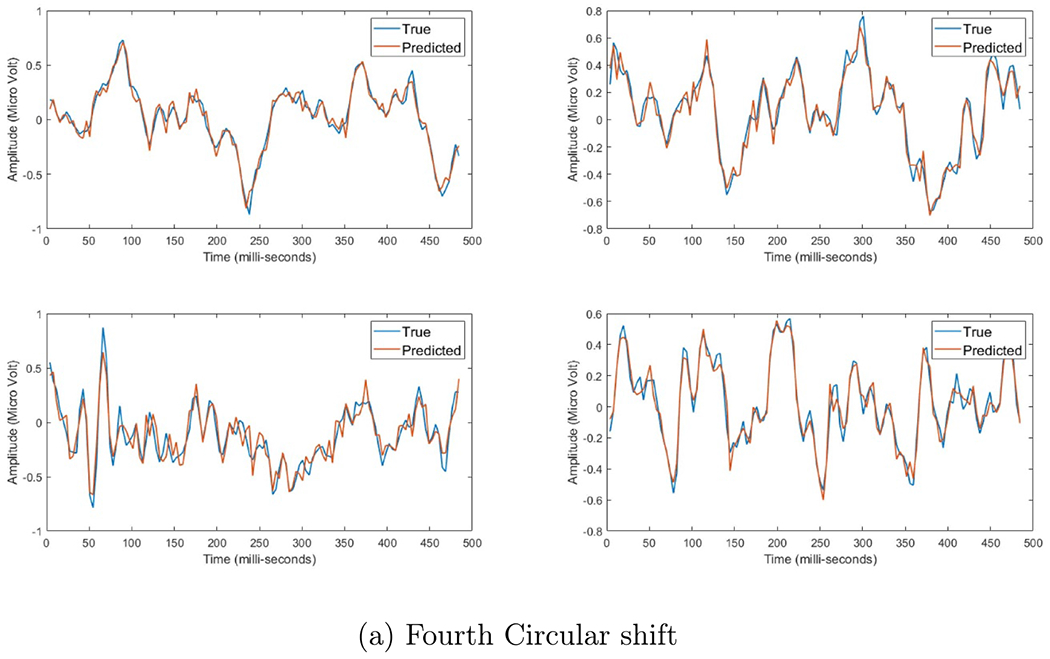
Four EEG responses induced by electrical stimulation after using each set of basis vectors, where the red line represents the estimated data and blue line presents the actual data. the x-axis represent time in milli-second, while the y-axis represent the amplitude in micro-Volt.
Appendix B. Validation and classification results
We calculated the following spectral and temporal features for each trial: the normalized total power and in the theta (3–6 Hz), mu (7–12 Hz), beta (13–30 Hz) and gamma (>30) bands. Also, the average EEG amplitude and P300 response, which is a positive change in the EEG around occipital-parietal recording sites around 300 ms after the stimuli. These features were standardized and concatenated to form a feature vector that was used in classification. We trained two three-class SVM classifiers. The first to classify the EEG generated during the touch experiment from the three surfaces, while the second is to distinguish between the EEG generated from the proposed model corresponding to touching each surface. In other words, the three classes for the first classifier are: (a) EEG generated from touching the smooth surface, (b) EEG generated from touching the medium rough surface, (c) EEG generated from touching the rough surface). While the three classes for the second classifier as follows: (a) EEG generated from the proposed model corresponding to touching the smooth surface, (b) EEG generated from the proposed model corresponding to touching the medium rough surface, (c) EEG generated from the proposed model corresponding to touching the rough surface). Three 2-class SVM classifiers were trained to classify between (a) EEG generated from touching the smooth surface and EEG generated from the proposed model corresponding to touching the smooth surface, (b) EEG generated from touching the medium rough surface and EEG generated from the proposed model corresponding to touching the medium rough surface, (c) EEG generated from touching the rough surface and EEG generated from the proposed model corresponding to touching the rough surface. The results were averaged across participants, and tables B1 and B2 show the mean and standard deviation of the accuracy across participants. It can be seen that the classification accuracy for the three class classifiers is above (80%), which means that these EEG signals are significantly different (chance level around 30%). While for the two class classification problems the average accuracies are around 48% which is around the chance level values. This means that the generated EEG and the actual EEG are similar for each surface condition.
Figure B1.
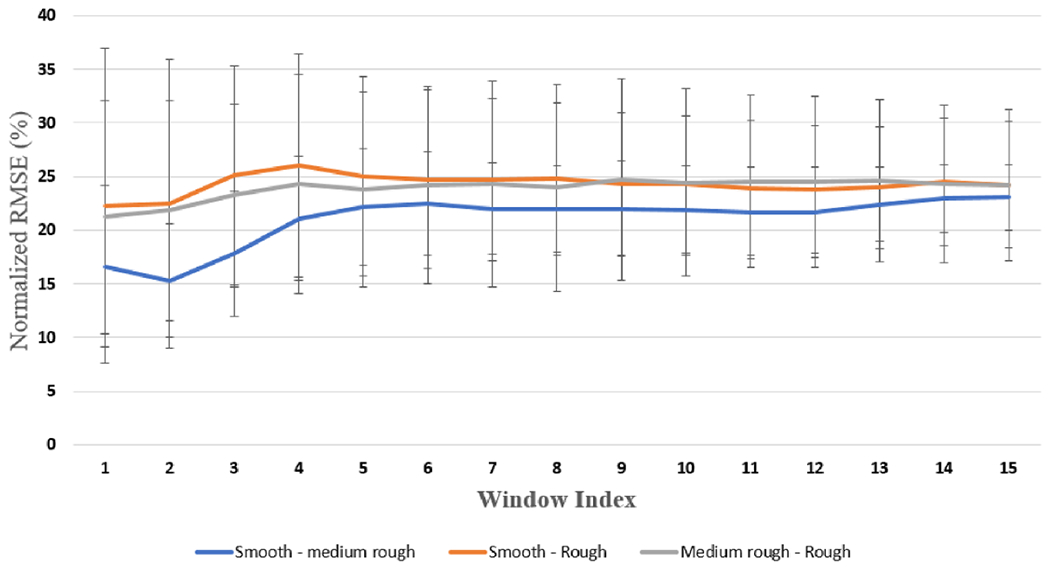
The blue line shows the error between the (smooth and medium rough) EEG responses, the orange line shows the error between the (smooth and rough) EEG responses, while the grey line shows the error between the (rough and medium rough) EEG responses. The x-axis represents the window index, and the y-axis represents the normalized root mean squared error within each window.
Table B1.
The median and standard deviation of the average accuracy across participants (%).
| 3-class classifiers | Class 1 (smooth) | Class 2 (medium rough) | Class 3 (rough) |
|---|---|---|---|
| Classifier 1 (Actual EEG) | 82 ± 5 | 83 ± 4 | 83 ± 2 |
| Classifier 2 (Generated EEG) | 81 ± 3 | 82 ± 3 | 82 ± 3 |
Table B2.
The median and standard deviation of the average accuracy across participants (%).
| EEG (actual smooth) | EEG (actual medium rough) | EEG (actual rough) |
|---|---|---|
| vs | vs | vs |
| EEG (generated smooth) | EEG (generated medium rough) | EEG (generated rough) |
|
| ||
| 48 ± 7 | 47 ± 5 | 49 ± 6 |
Footnotes
Ethics statements
This study was approved by the University of Pittsburgh ethics committee/IRB (IRB \# STUDY19020352). The experimental protocol was in compliance with the approved IRB. All subjects were provided written informed consent.
Data availability statement
The data that support the findings of this study are available upon reasonable request from the authors.
References
- [1].Melchiorri C 2013. Robot teleoperation Encyclopedia of Systems and Control (London: Springer London; ) pp 1–14 [Google Scholar]
- [2].Kremer P, Wimbock T, Artigas J, Schatzle S, Johl K, Schmidt F, Preusche C and Hirzinger G 2009. Multimodal telepresent control of DLR’s Rollin’ JUSTIN 2009 IEEE Int. Conf. on Robotics and Automation pp 1601–2 [Google Scholar]
- [3].Kuchenbecker KJ, Ferguson D, Kutzer M, Moses M and Okamura AM 2008. The touch thimble: providing fingertip contact feedback during point-force haptic interaction 2008 Symp. on Haptic Interfaces for Virtual Environment and Teleoperator Systems pp 239–46 [Google Scholar]
- [4].Pacchierotti C, Meli L, Chinello F, Malvezzi M and Prattichizzo D 2015. Cutaneous haptic feedback to ensure the stability of robotic teleoperation systems Int J. Robot. Res 34 1773–87 [Google Scholar]
- [5].Ikei Y, Wakamatsu K and Fukuda S 1997. Vibratory tactile display of image-based textures IEEE Comput. Graph. Appl 17 53–61 [Google Scholar]
- [6].Tang H and Beebe DJ 2006. An oral tactile interface for blind navigation IEEE Trans. Neural Syst. Rehabil. Eng 14 116–23 [DOI] [PubMed] [Google Scholar]
- [7].Robineau F, Boy F, Orliaguet J-P, Demongeot J and Payan Y 2007. Guiding the surgical gesture using an electro-tactile stimulus array on the tongue: a feasibility study IEEE Trans. Biomed. Eng 54 711–17 [DOI] [PubMed] [Google Scholar]
- [8].Yoshimoto S, Kuroda Y, Kagiyama Y, Kuroda T and Oshiro O 2009. Tactile mapping approach using electrical stimulus pattern RO-MAN 2009-The 18th IEEE Int. Symp. on Robot and Human Interactive Communication (IEEE) pp 460–5 [Google Scholar]
- [9].Kajimoto H, Kawakami N, Tachi S and Inami M 2004. Smarttouch: electric skin to touch the untouchable IEEE Comput. Graph. Appl 24 36–43 [DOI] [PubMed] [Google Scholar]
- [10].Ang Q-Z, Horan B, Najdovski Z and Nahavandi S 2011. Grasping virtual objects with multi-point haptics Proc. 2011 IEEE Virtual Reality Conf. (VR’11) (Washington, DC, USA) (IEEE Computer Society; ) pp 189–90 [Google Scholar]
- [11].Pacchierotti C, Prattichizzo D and Kuchenbecker KJ 2015. Displaying sensed tactile cues with a fingertip haptic device IEEE Trans. Haptics 8 384–96 [DOI] [PubMed] [Google Scholar]
- [12].Schorr SB, Quek ZF, Romano RY, Nisky I, Provancher WR and Okamura AM 2013. Sensory substitution via cutaneous skin stretch feedback 2013 IEEE Int. Conf. on Robotics and Automation pp 2341–6 [Google Scholar]
- [13].Quek ZF, Schorr SB, Nisky I, Okamura AM and Provancher WR 2013. Sensory augmentation of stiffness using fingerpad skin stretch 2013 World Haptics Conf. (WHC) pp 467–72 [Google Scholar]
- [14].Serina ER Mockensturm E Mote C Jr and Rempel D 1998. A structural model of the forced compression of the fingertip pulp J. Biomech 31 639–46 [DOI] [PubMed] [Google Scholar]
- [15].Libouton X, Barbier OC Berger Y Plaghki L and Thonnard J-L 2012. Tactile roughness discrimination of the finger pad relies primarily on vibration sensitive afferents not necessarily located in the hand Behav. Brain Res 229 273–9 [DOI] [PubMed] [Google Scholar]
- [16].Delhaye B Hayward V, Lefèvre P and Thonnard J-L 2012. Texture-induced vibrations in the forearm during tactile exploration Front. Behav. Neurosci 6 37. [DOI] [PMC free article] [PubMed] [Google Scholar]
- [17].Srinivasan MA and LaMotte RH 1996. Tactual discrimination of softness: abilities and mechanisms Somesthesis and the Neurobiology of the Somatosensory Cortex (Basel: Birkhäuser; ) pp 123–35 [Google Scholar]
- [18].Ambrosi G Bicchi A, De Rossi D and Scilingo EP 1999. The role of contact area spread rate in haptic discrimination of softness Proc. 1999 IEEE Int. Conf. on Robotics and Automation (Cat. No. 99CH36288C) vol 1 pp 305–10 [Google Scholar]
- [19].Sylvester ND and Provancher WR 2007. Effects of longitudinal skin stretch on the perception of friction 2nd Joint EuroHaptics Conf. and Symp. on Haptic Interfaces for Virtual Environment and Teleoperator Systems (WHC’07) pp 373–8 [Google Scholar]
- [20].Robles-De-La-Torre G and Hayward V 2001. Force can overcome object geometry in the perception of shape through active touch Nature 412 445. [DOI] [PubMed] [Google Scholar]
- [21].Kaczmarek KA, Webster JG Bach-y-Rita P and Tompkins WJ 1991. Electrotactile and vibrotactile displays for sensory substitution systems IEEE Trans. Biomed. Eng 38 1–16 [DOI] [PubMed] [Google Scholar]
- [22].Kajimoto H, Kawakami N, Maeda T and Tachi S 2004. Electro-tactile display with tactile primary color approach Proc. Int. Conf. on Intelligent Robots and Systems vol 10 pp 1–13 [Google Scholar]
- [23].Kajimoto H, Kawakami N, Maeda T and Tachi S 1999. Tactile feeling display using functional electrical stimulation Proc. 1999 ICAT p 133 [Google Scholar]
- [24].Kaczmarek KA and Haase SJ 2003. Pattern identification and perceived stimulus quality as a function of stimulation waveform on a fingertip-scanned electrotactile display IEEE Trans. Neural Syst. Rehabil. Eng 11 9–16 [DOI] [PubMed] [Google Scholar]
- [25].Yoshimoto S, Kuroda Y, Imura M and Oshiro O 2015. Material roughness modulation via electrotactile augmentation IEEE Trans. Haptics 8 199–208 [DOI] [PubMed] [Google Scholar]
- [26].Yoshimoto S, Kuroda Y, Imura M and Oshiro O 2011. Development of a spatially transparent electrotactile display and its performance in grip force control 2011 Annual Int. Conf. IEEE Engineering in Medicine and Biology Society pp 3463–6 [DOI] [PubMed] [Google Scholar]
- [27].Yamamoto A, Nagasawa S, Yamamoto H and Higuchi T 2006. Electrostatic tactile display with thin film slider and its application to tactile telepresentation systems IEEE Trans. Vis. Comput. Graphics 12 168–77 [DOI] [PubMed] [Google Scholar]
- [28].Olivier B and Ivan P 2012. REVEL: tactile feedback technology for augmented reality ACM Trans. Graph 31 1–11 [Google Scholar]
- [29].Altinsoy ME and Merchel S 2012. Electrotactile feedback for handheld devices with touch screen and simulation of roughness IEEE Trans. Haptics 5 6–13 [DOI] [PubMed] [Google Scholar]
- [30].Peruzzini M, Germani M and Mengoni M 2012. Electro-tactile device for texture simulation Proc. 2012 IEEE/ASME 8th IEEE/ASME Int. Conf. on Mechatronic and Embedded Systems and Applications pp 178–83 [Google Scholar]
- [31].Arakeri TJ, Hasse BA and Fuglevand AJ 2018. Object discrimination using electrotactile feedback J. Neural Eng 15 046007. [DOI] [PMC free article] [PubMed] [Google Scholar]
- [32].Tan DW, Schiefer MA, Keith MW, Anderson JR, Tyler J and Tyler DJ 2014. A neural interface provides long-term stable natural touch perception Sci. Trans. Med 6 257ra138. [DOI] [PMC free article] [PubMed] [Google Scholar]
- [33].Santello M et al. 2016. Hand synergies: integration of robotics and neuroscience for understanding the control of biological and artificial hands Phys. Life Rev 17 1–23 [DOI] [PMC free article] [PubMed] [Google Scholar]
- [34].Culbertson H, Schorr SB and Okamura AM 2018. Haptics: the present and future of artificial touch sensation Annu. Rev. Control Robot. Auton. Syst 1 385–409 [Google Scholar]
- [35].Albani D, Youssef A, Suriani V, Nardi D and Bloisi DD 2016. A deep learning approach for object recognition with NAO soccer robots Robot World Cup (Springer; ) pp 392–403 [Google Scholar]
- [36].Liu H, Wu Y, Sun F and Guo D 2017. Recent progress on tactile object recognition Int. J. Adv. Robot. Syst 14 1729881417717056 [Google Scholar]
- [37].Wen Z, Liu D, Liu X, Zhong L, Lv Y and Jia Y 2019. Deep learning based smart radar vision system for object recognition J. Ambient Intell. Hum. Comput 10 829–39 [Google Scholar]
- [38].Gandarias JM, Gómez-de Gabriel JM and García-Cerezo AJ 2018. Enhancing perception with tactile object recognition in adaptive grippers for human–robot interaction Sensors 18 692. [DOI] [PMC free article] [PubMed] [Google Scholar]
- [39].Danthala S, Rao S, Mannepalli K and Shilpa D 2018. Robotic manipulator control by using machine learning algorithms: a review Int. J. Mech. Prod. Eng. Res. Dev 8 305–10 [Google Scholar]
- [40].Aivaliotis P, Zampetis A, Michalos G and Makris S 2017. A machine learning approach for visual recognition of complex parts in robotic manipulation Proc. Manuf 11 423–30 [Google Scholar]
- [41].Meattini R, Benatti S, Scarcia U, De Gregorio D, Benini L and Melchiorri C 2018. An sEMG-based human–robot interface for robotic hands using machine learning and synergies IEEE Trans. Compon. Packag. Manuf. Technol 8 1149–58 [Google Scholar]
- [42].Ai Q, Ding B, Liu Q and Meng W 2016. A subject-specific EMG-driven musculoskeletal model for applications in lower-limb rehabilitation robotics Int. J. Hum. Robot 13 1650005 [Google Scholar]
- [43].Baumgartner T, Valko L, Esslen M and Jäncke L 2006. Neural correlate of spatial presence in an arousing and noninteractive virtual reality: an EEG and psychophysiology study CyberPsychol. Behav 9 30–45 [DOI] [PubMed] [Google Scholar]
- [44].Kober SE, Kurzmann J and Neuper C 2012. Cortical correlate of spatial presence in 2d and 3d interactive virtual reality: an EEG study Int J. Psychophysiol 83 365–74 [DOI] [PubMed] [Google Scholar]
- [45].Kober SE and Neuper C 2012. Using auditory event-related EEG potentials to assess presence in virtual reality Int. J. Hum.-Comput. Stud 70 577–87 [Google Scholar]
- [46].Rodríguez Ortega A, Rey Solaz B and Alcañiz Raya ML 2013. Evaluating virtual reality mood induction procedures with portable EEG devices Annual Review of Cybertherapy and Telemedicine (Studies in Health Technology and Informatics vol 11) (Amsterdam: IOS Press; ) pp 131–5 [PubMed] [Google Scholar]
- [47].Tremblay L, Bouchard S, Chebbi B, Wei L, Monthuy-Blanc J and Boulanger D 2013. The development of a haptic virtual reality environment to study body image and affect Annual Review of Cybertherapy and Telemedicine (Studies in Health Technology and Informatics vol 191) (Amsterdam: IOS Press; ) pp 80–84 [PubMed] [Google Scholar]
- [48].Wiederhold B and Riva G 2013. Measuring presence during the navigation in a virtual environment using EEG Annual Review of Cybertherapy and Telemedicine (Studies in Health Technology and Informatics) (Amsterdam: IOS Press; ) p 136. [PubMed] [Google Scholar]
- [49].Genna C, Artoni F, Fanciullacci C, Chisari C, Oddo CM and Micera S 2016. Long-latency components of somatosensory evoked potentials during passive tactile perception of gratings 2016 38th Annual Int. Conf. IEEE Engineering in Medicine and Biology Society (EMBC) (IEEE; ) pp 1648–51 [DOI] [PubMed] [Google Scholar]
- [50].Moungou A, Thonnard J-L and Mouraux A 2016. EEG frequency tagging to explore the cortical activity related to the tactile exploration of natural textures Sci. Rep 6 20738. [DOI] [PMC free article] [PubMed] [Google Scholar]
- [51].Genna C, Oddo C, Fanciullacci C, Chisari C, Micera S and Artoni F 2018. Bilateral cortical representation of tactile roughness Brain Res. 1699 79–88 [DOI] [PubMed] [Google Scholar]
- [52].Eldeeb S, Weber D, Ting J, Demir A, Erdogmus D and Akcakaya M 2020. EEG-based trial-by-trial texture classification during active touch Sci. Rep 10 1–13 [DOI] [PMC free article] [PubMed] [Google Scholar]
- [53].Eldeeb S, Ting J, Erdogmus D, Weber D and Akcakaya M 2019. EEG-based texture classification during active touch IEEE 29th Int. Workshop on Machine Learning for Signal Processing (MLSP) pp 1–6 [Google Scholar]
- [54].Genna C, Oddo CM, Fanciullacci C, Chisari C, Jörntell H, Artoni F and Micera S 2017 Spatiotemporal dynamics of the cortical responses induced by a prolonged tactile stimulation of the human fingertips Brain Topogr. 30 473–85 [DOI] [PubMed] [Google Scholar]
- [55].Brainard DH and Vision S 1997. The psychophysics toolbox Spatial Vis. 10 433–6 [PubMed] [Google Scholar]
- [56].Johansson RS and Vallbo A 1979. Tactile sensibility in the human hand: relative and absolute densities of four types of mechanoreceptive units in glabrous skin J. Physiol 286 283–300 [DOI] [PMC free article] [PubMed] [Google Scholar]
- [57].Halmos PR 2017. Finite-Dimensional Vector Spaces (New York: Courier Dover Publications; ) [Google Scholar]
- [58].Althoen SC and Mclaughlin R 1987. Gauss-jordan reduction: a brief history Am. Math. Mon 94 130–42 [Google Scholar]
- [59].Maslov AN 1973. Cyclic shift operation for languages Probl. Inf. Transm 9 81–87 [Google Scholar]
- [60].Altman NS 1992. An introduction to kernel and nearest-neighbor nonparametric regression Am. Stat 46 175–85 [Google Scholar]
- [61].Epanechnikov V 1969. Nonparametric estimates of a multivariate probability density Theory Probab. Appl 14 153–8 [Google Scholar]
- [62].Laarni J, Ravaja N, Saari T Böcking S, Hartmann T and Schramm H 2015. Ways to measure spatial presence: review and future directions Immersed in Media (Immersed in Media Telepresence Theory, Measurement & Technology) (New York: Springer; ) pp 139–85 [Google Scholar]
- [63].McCall R, O’Neil S and Carroll F 2004. Measuring presence in virtual environments CHI’04 Extended Abstracts on Human Factors in Computing Systems pp 783–4 [Google Scholar]
Associated Data
This section collects any data citations, data availability statements, or supplementary materials included in this article.
Data Availability Statement
The data that support the findings of this study are available upon reasonable request from the authors.


