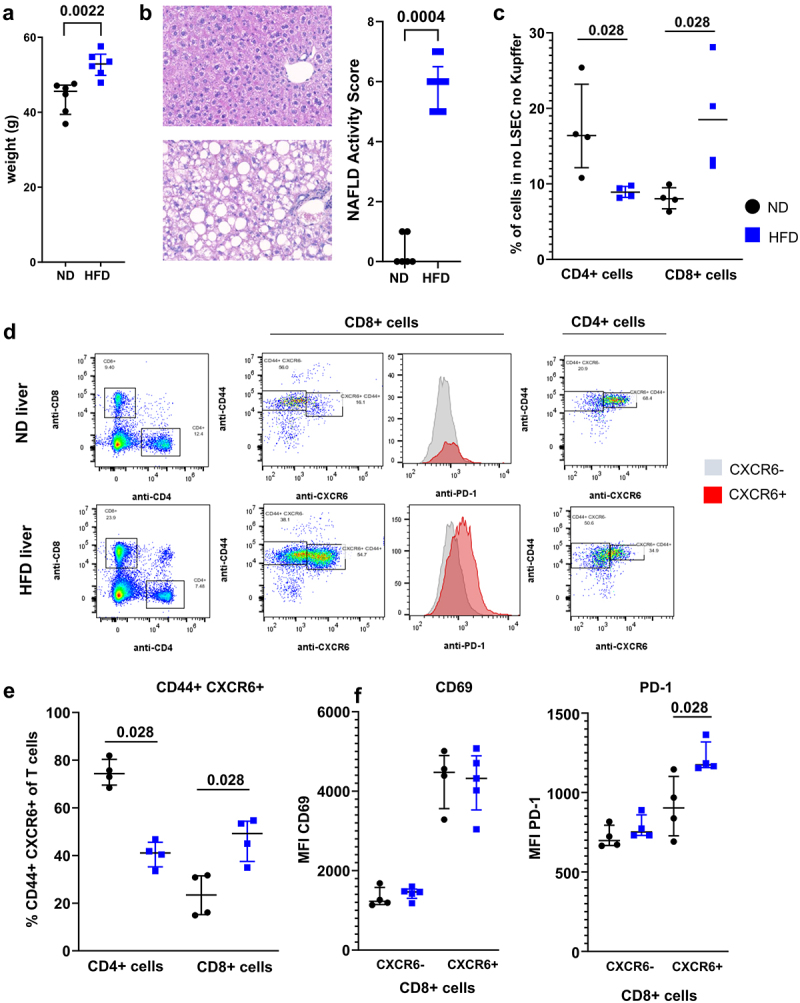
Figure 1.

NASH altered T cells phenotype. A. Weight of C57BL/6 N mice following 30 weeks of HFD. B. Representative histology of liver of ND and HFD-fed mice at 35 weeks and assessment of NAFLD Activity Score. C. Representation of CD4 T cells and CD8 T cells in the liver of ND and HFD-fed mice. D. Phenotype of CD4 T cells and CD8 T cells isolated from livers of ND and HFD-fed mice. CD44+ CXCR6+ cells and their expression of PD-1 were assessed. E. Percentage of CD44+ CXCR6+ cells in the CD4 and CD8 T cell population in ND and HFD-fed mice. F. Expression level of CD69 (left) and CD279 (PD-1) in the CXCR6− and CXCR6+ CD8 T cells subsets. A: n = 6 per group; B: n = 6 (ND) and n = 9 (HFD); C-F: n = 4 per group. Results are expressed as median and IQR.
