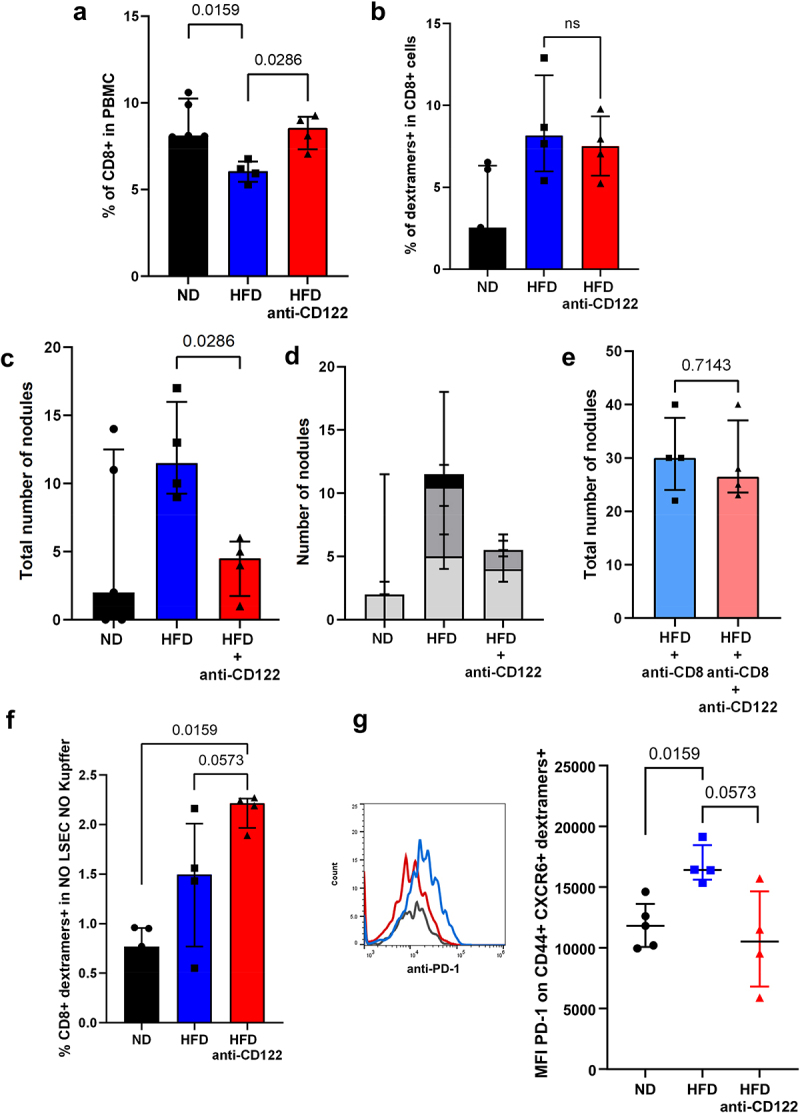
Figure 6.

Anti-CD122 antibodies injection restored tumor-specific T cells phenotype. A. Representation of CD8 T cells in the PBMC of HCC-bearing mice. B. Percentage of SIINFEKL-specific CD8 T cells (dextramers+ cells) in the CD8 T cells from the PBMC of HCC-bearing mice. C. Assessment of the number of HCC nodules on the liver of mice. D. Assessment of the number and the size of the nodules on the liver of mice. Light gray = nodules< 1 mm, dark gray = nodules >1 mm and <3 mm; black = nodules >3 mm. E. Assessment of the number of HCC nodules on the liver of mice. F. Percentage of SIINFEKL-specific CD8 T cells (dextramers+ cells) in PBMC of HCC-bearing mice. G. Expression level of CD279 (PD-1) on SIINFEKL-specific CD8 T cells (dextramers+ cells) in the liver of HCC-bearing mice . A-G: n = 5 (ND), n = 4 (HFD,HFD + anti-CD122, HFD + anti-CD(and HFD + anti-CD8 + anti-CD122). Results are expressed as median and IQR.
