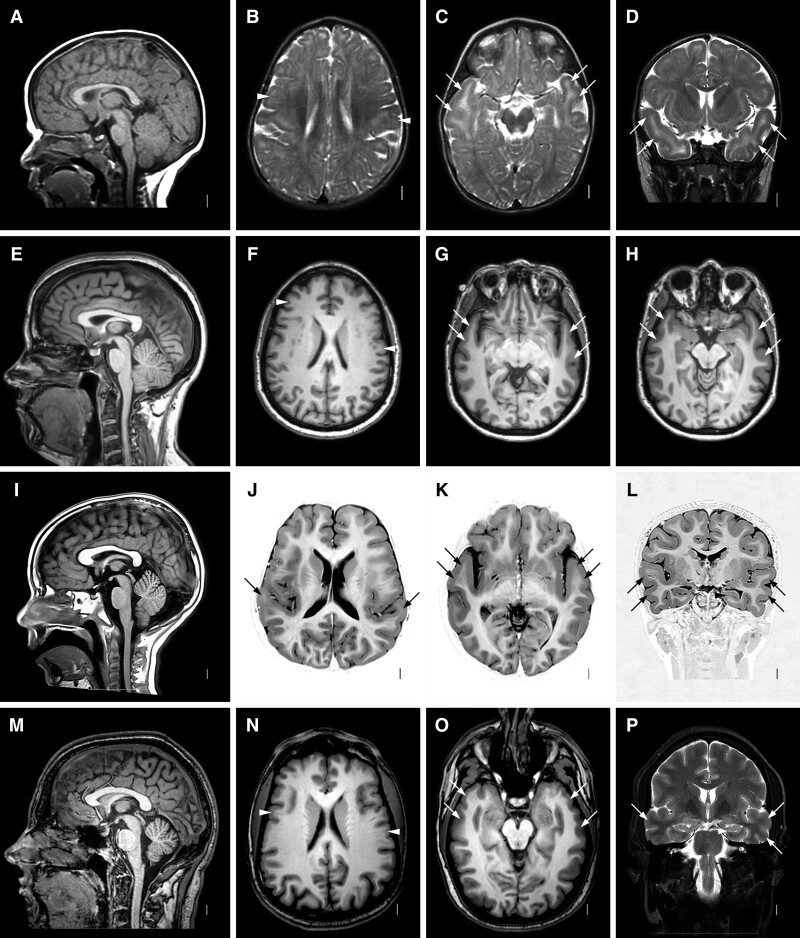
Figure 4.
Brain MRI showing temporal LIS with monoallelic RELN variants. Images show the same pattern of LIS in four subjects from two families including LR02-111a3 (A–D), LR02-111r1 (E–H), LR17-364a2 (I–L) and LR17-364f (M–P). Midline sagittal images (first column) show normal brainstem and cerebellum. Axial images at the level of the lateral ventricles (second column), basal ganglia (third column) and temporal lobes (fourth column) show moderate but definite LIS (also known as mild pachygyria) with moderately thick 5–8 mm cortex over the temporal lobes best seen in the last column (D, H, L, P). Higher images show mild pachygyria in probands from the two families (B and J) and subtle pachygyria (or normal) in their less affected adult relatives (F and N). Arrows point to representative areas of pachygyria, while arrowheads point to areas of subtle undersulcation (F and N) or to normal hippocampi (L and P).

