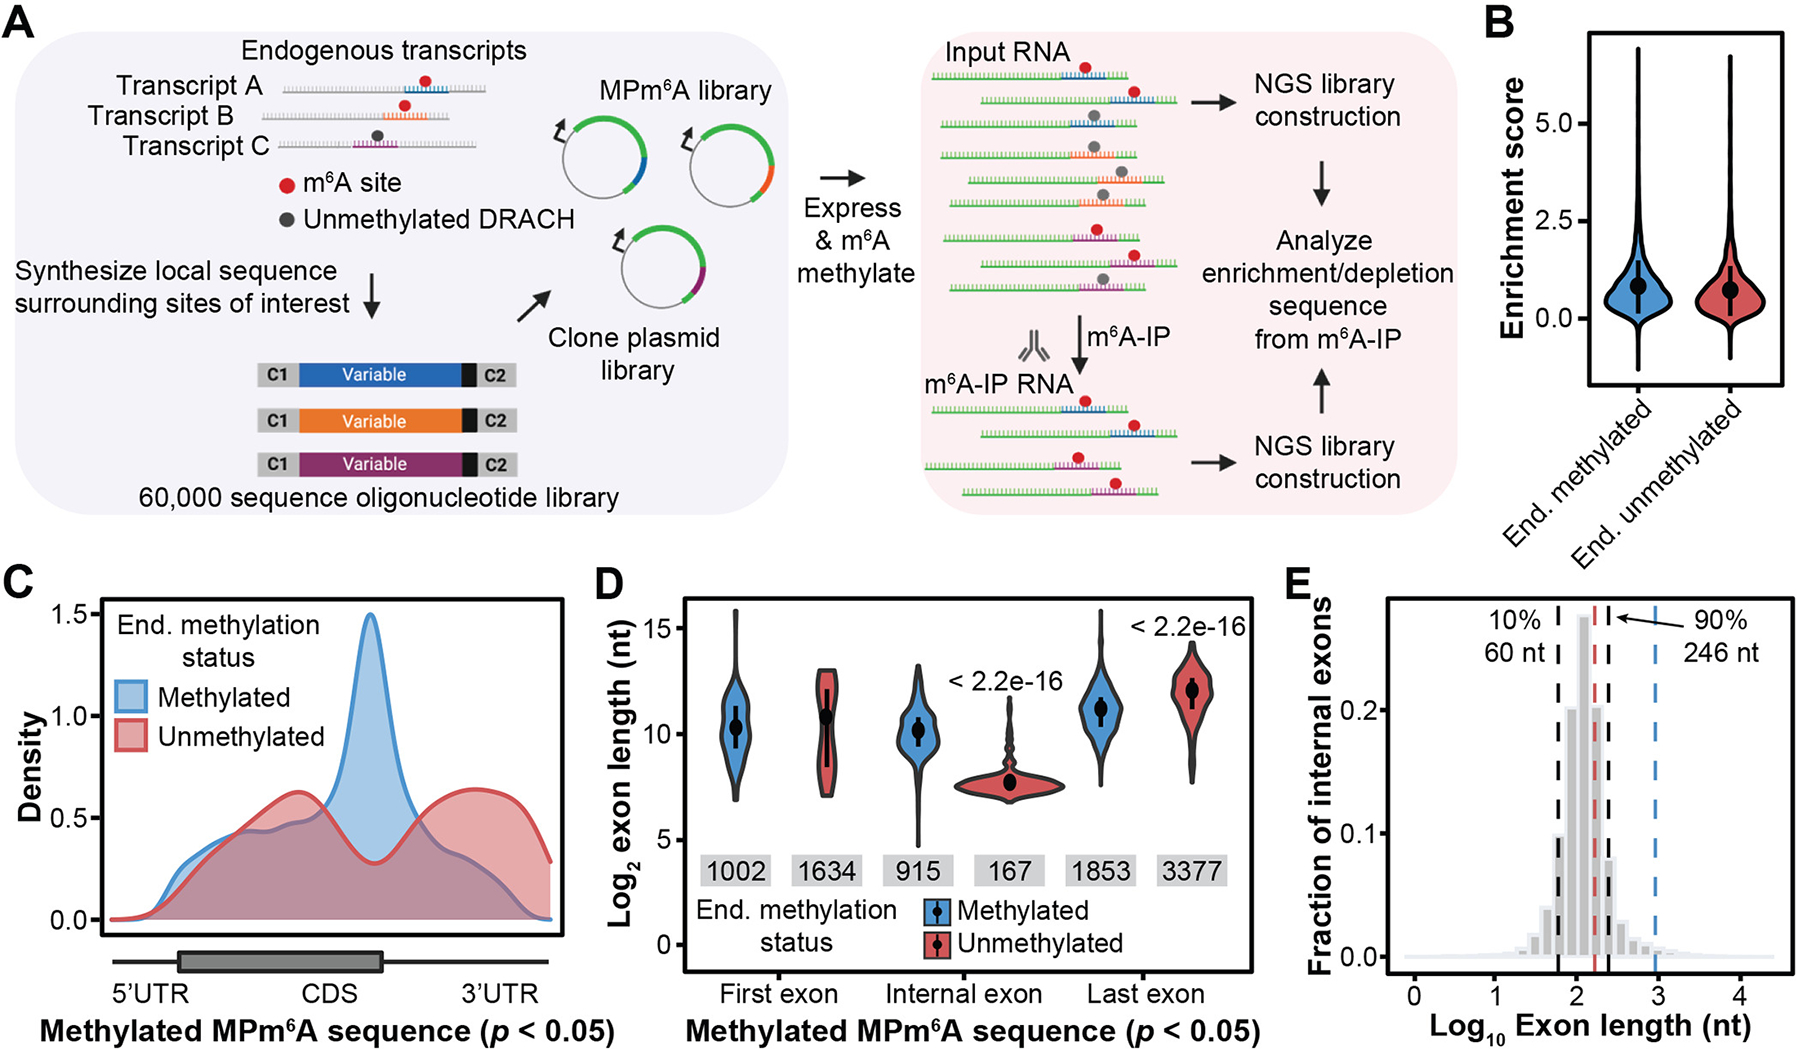
Fig. 1. MPm6A reveals suppression of thousands of m6A sites in unmethylated transcriptome regions.

(A) Schematic of the MPm6A workflow. (B) MPm6A enrichment scores (experimental IP/input – negative control IP/input) for endogenously methylated (n = 6,095) and unmethylated (n = 2,716) sequences, mean ± SD, four biological replicates. (C) Metagenes of endogenously methylated and unmethylated sequences that are significantly methylated in MPm6A. (D) Exon lengths of endogenously methylated and unmethylated sequences that are significantly methylated in MPm6A. Median, and IQR, Wilcoxon rank sum test. Sample size for each violin plot from left to right is: n = 175, n = 22, n = 696, n = 519, n = 3,539, and n = 1,328. (E) Distribution of internal exon lengths in the human genome. Black lines indicate 10th percentile (left, 60 nt) and 90th percentile (right, 246 nt). Blue and red lines indicate median internal exon length for MPm6A endogenously methylated (915 nt) and unmethylated (167 nt) sequences, respectively.
