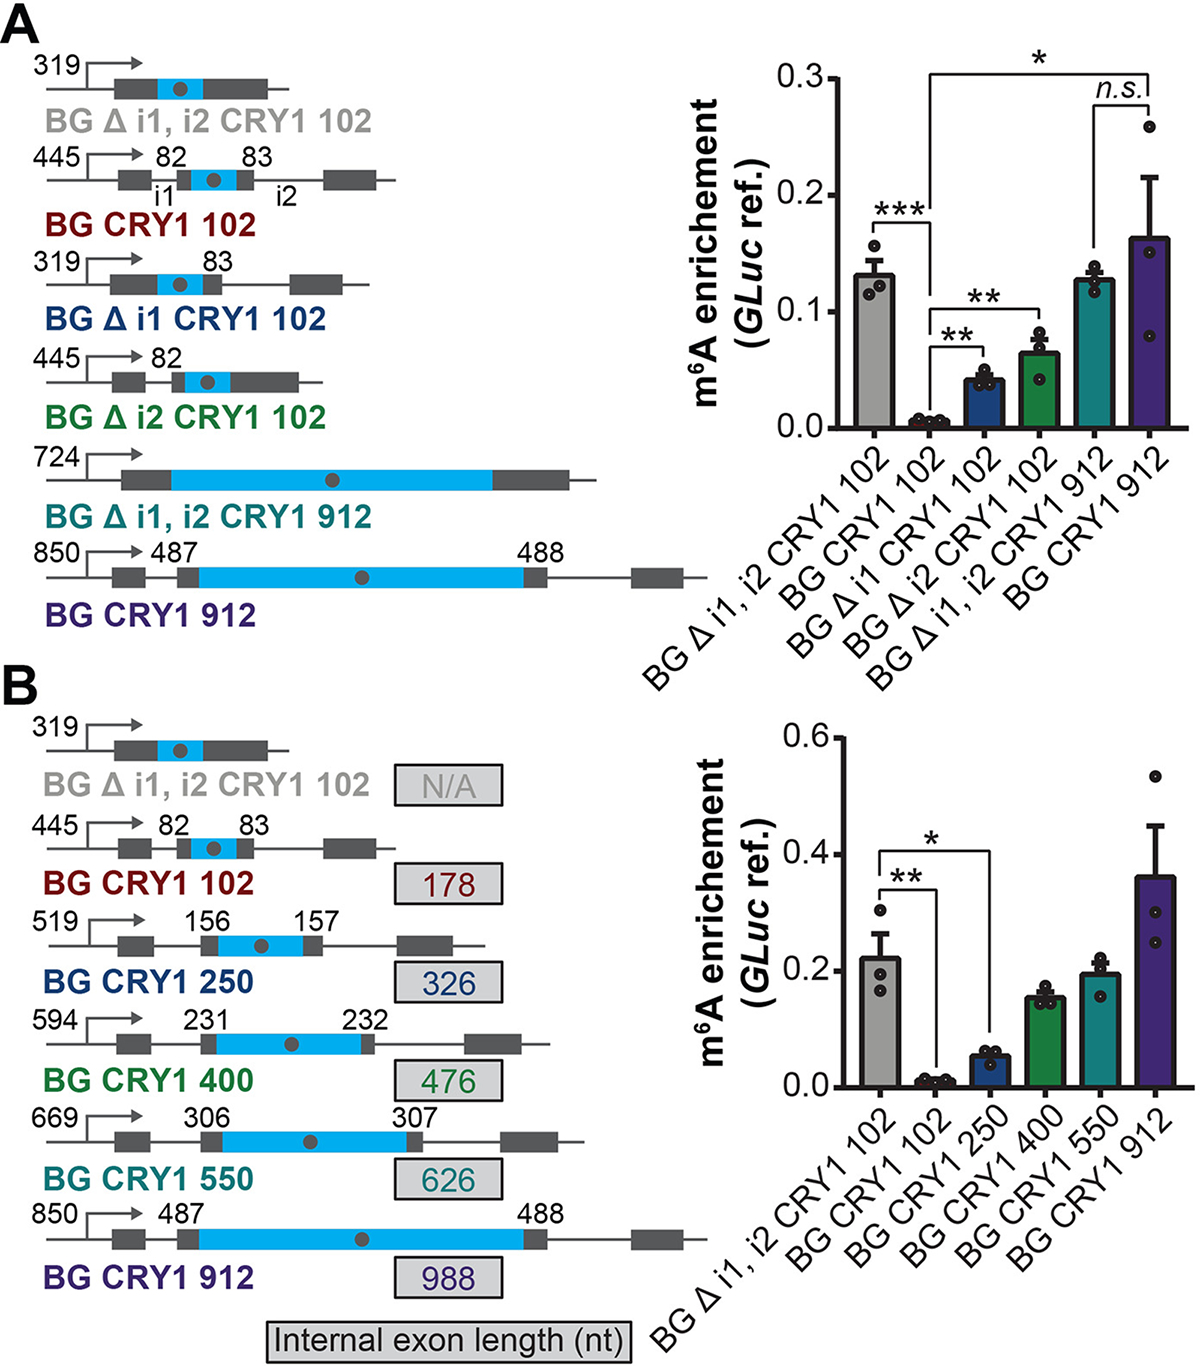
Fig. 2. Pre-mRNA splicing suppresses m6A methylation in average-length exons.

(A and B) Left: schematic of specified BG CRY1 constructs. Blue regions indicate sequences derived from the CRY1 endogenous sequence, gray regions indicate sequences derived from rabbit beta-globin (BG). Number following CRY1 refers to the number of nucleotides of exonic sequence surrounding the CRY1 suppressed m6A site in the CRY1 endogenous mRNA that was cloned into the BG construct. Grey dot in the blue region denotes the suppressed m6A site; the number at the left and right of the m6A site shows the distance (nt) between the m6A site and the 3′ and 5′ splice site, respectively; the number next to the TSS shows the distance (nt) between the m6A site and the promoter. Δ denotes deletion of the specified intron(s). Details of each construct are described in the supplementary method. Right: m6A enrichment at a CRY1 suppressed m6A site. Primers amplifying a 62 nt-fragment containing the CRY1 suppressed m6A site. m6A enrichment was calculated as IP/input normalized to m6A-marked Gaussia luciferase RNA spike-in IP/input. Mean ± SEM, two-tailed t-test, *P < 0.05; **P < 0.01, ***P < 0.001. Three biological replicates.
