

Abstract
Folates (also known as vitamin B9) have a critical role in cellular metabolism as the starting point in the synthesis of nucleic acids, amino acids and the universal methylating agent S-adenylsmethionine1,2. Folate deficiency is associated with a number of developmental, immune and neurological disorders3–5. Mammals cannot synthesize folates de novo; several systems have therefore evolved to take up folates from the diet and distribute them within the body3,6. The proton-coupled folate transporter (PCFT) (also known as SLC46A1) mediates folate uptake across the intestinal brush border membrane and the choroid plexus4,7, and is an important route for the delivery of antifolate drugs in cancer chemotherapy8–10. How PCFT recognizes folates or antifolate agents is currently unclear. Here we present cryo-electron microscopy structures of PCFT in a substrate-free state and in complex with a new-generation antifolate drug (pemetrexed). Our results provide a structural basis for understanding antifolate recognition and provide insights into the pH-regulated mechanism of folate transport mediated by PCFT.
Folates must be acquired from the diet, either through the ingestion of green leafy vegetables, lentils and liver or—more commonly—through food fortification with folic acid (a synthetic folate)11. In 2006, the World Health Organization established targets for folic acid fortification of grain-based food products to increase the level of folic acid in the general population, and thereby reduce the incidence of neural tube defects during pregnancy12. Folates function as coenzymes in the one-carbon transfer reactions that are required for the synthesis of nucleic acids and activated methyl groups that are required for DNA methylation1,2. Three distinct systems for folate transport exist in the human body3,6,13 (Fig. 1a). Folate receptors bind with high affinity and internalize extracellular folates through endocytotis14,15, whereas two major facilitator family (MFS) transporters—the reduced folate carrier (RFC) (also known as SLC19A1) and PCFT—control the transport of folates across cellular membranes6,7,16. However, PCFT is a folate proton symporter7 with a pH optimum of 5.0–5.517, whereas RFC operates at neutral pH as a folate anion antiporter13. Mutations in PCFT (also known as SLC46A1) underpin the molecular basis of hereditary folate malabsorption, which is an autosomal recessive disorder that results in severe folate deficiency that manifests as anaemia, as well as immunological and neurological abnormalities4,7,18. Antifolate drugs, such as methotrexate and pemetrexed, are established treatments for cancer and autoimmune diseases8,10,19–21. Unfortunately, their efficacy is limited because antifolate drugs are rapidly transported by RFC into normal tissues16 where they cause toxicity. By contrast, within the acid microenvironment of cancer cells, transport mediated by PCFT is increased10,22. The selective targeting of PCFT presents a promising route for the development of new antifolate agents9,23. However, the molecular basis by which PCFT or RFC distinguish between folates or antifolate drugs remains unclear, which hampers efforts toward the targeted delivery of cancer drugs.
Fig. 1 |. Cryo-EM structure of apo and pemetrexed-bound PCFT.
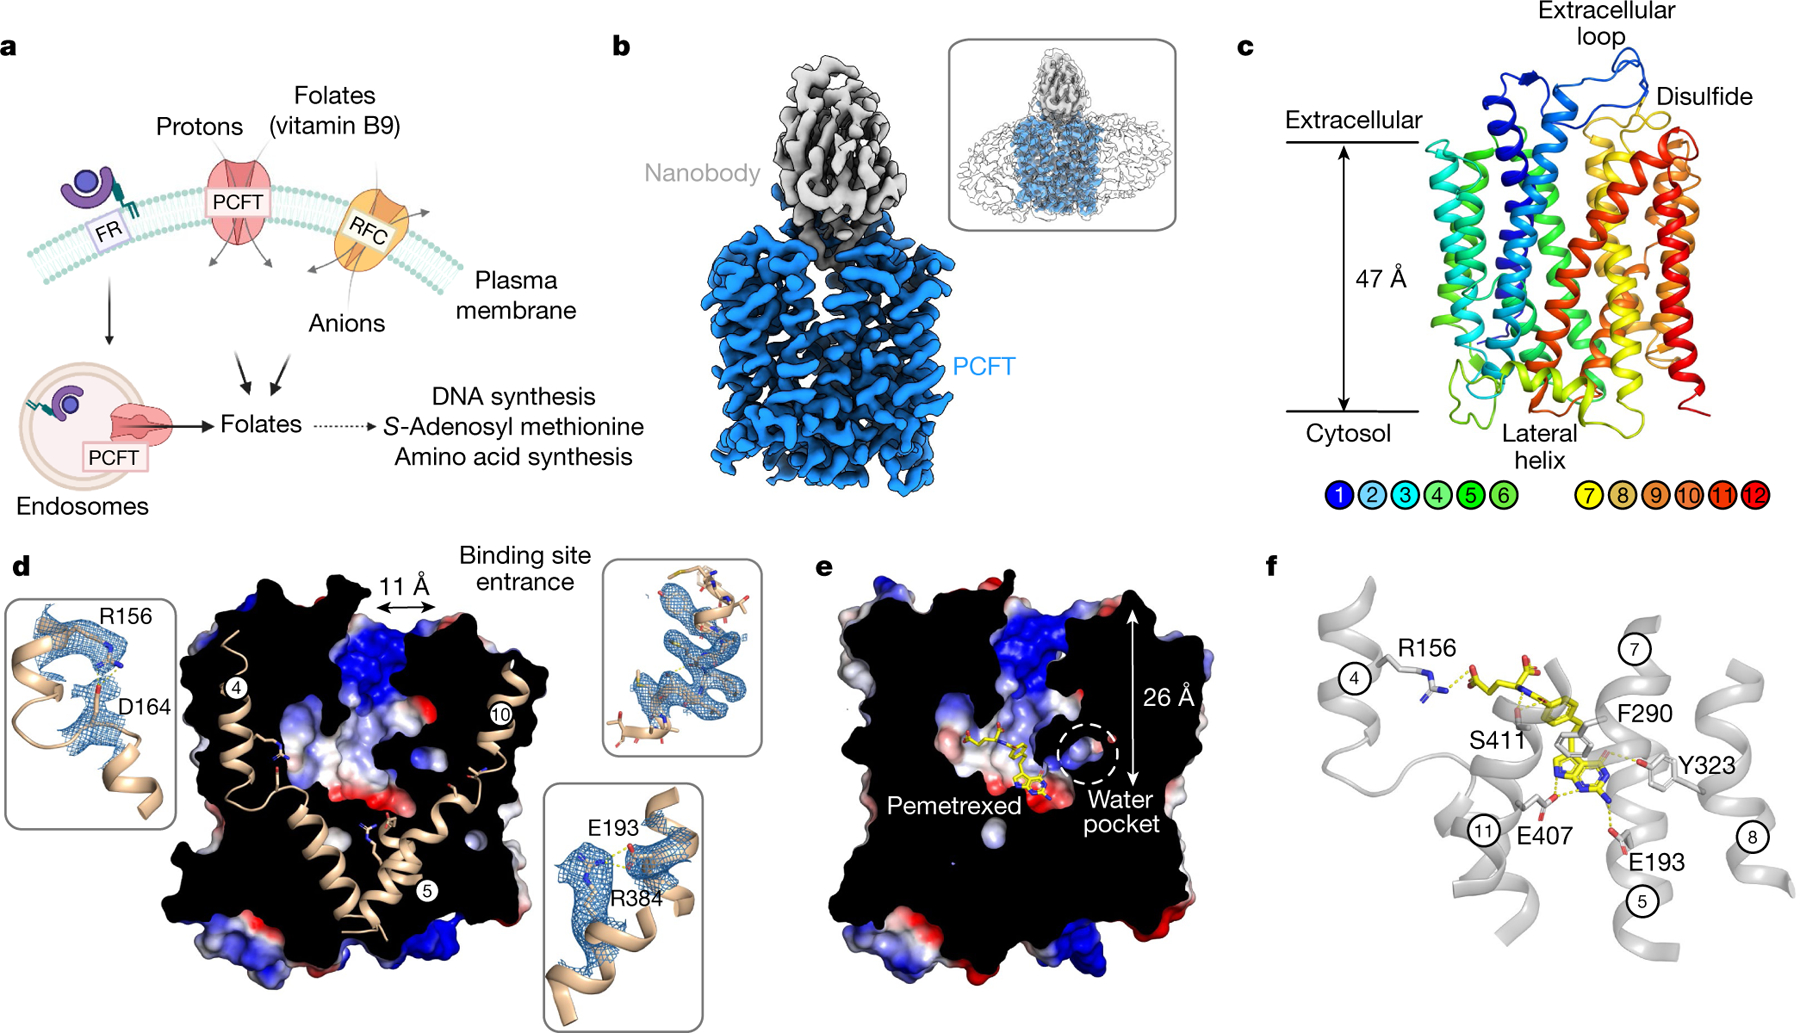
a, Three distinct mechanisms for folate transport exist in mammalian cells. The folate receptor (FR) internalizes extracellular folates within endosomes, whereas PCFT and RFC function to shuttle folates across the plasma membrane. b, Cryo-EM density of the PCFT–nanobody complex contoured at a threshold level of 1.0. Inset, superposition with lower-contoured (threshold level of 0.22) volume to display the detergent micelle. c, Cartoon representation of PCFT. d, Electrostatic surface representation of PCFT, highlighting key structural features. Inset, cryo-EM density for represented side chains (5σ). e, Electrostatic surface representation of PCFT, highlighting the central folate-binding site, enlarged water pocket and narrow vestibule entrance. The bound pemetrexed molecule is shown as sticks. f, Binding site, showing the main polar interactions formed with pemetrexed. Key residues interacting with the drug are shown as sticks and hydrogen bonds are represented as dashed lines.
Cryo-electron microscopy structure of PCFT
We identified the chicken (Gallus gallus) homologue of PCFT as being suitable for structural and biochemical analysis (Extended Data Figs 1, 2). Chicken PCFT displays the characteristic pH-dependent transport of folates and antifolate agents, with a pH optimum of 5.0–5.5 and a KM for folic acid of 2 μM7,17 (Extended Data Fig. 1d, e). We used a naive llama library to isolate a high-affinity inhibitory nanobody with a KD of 8 nM (Extended Data Fig. 2). Although PCFT is only 50 kDa in size, we used single-particle cryo-electron microscopy (cryo-EM) (Fig. 1b, Extended Data Fig. 3) to successfully determine its structure to a resolution of 3.2 Å (Extended Data Table 1). The nanobody–PCFT complex is only 62 kDa in size, which demonstrates that 12-kDa nanobodies can be used in the determination of the structures of small eukaryotic SLC transporters using cryo-EM.
Extended Data Table 1 |. Cryo-EM data collection, refinement and validation statistics.
| PCFT-NB (EMDB-12140) (PDB7BC6) | PCFT-NB + pemetrexed (EMDB-12141) (PDB7BC7) | |
|---|---|---|
| Data collection and processing | ||
| Magnification | 105,000 | 105,000 |
| Voltage (kV) | 300 | 300 |
| Electron exposure (e-/Å2) | 59.1 | 58.5 |
| Defocus range (μm) | 0.8 – 2.5 | 0.8 – 2.5 |
| Pixel size (Ă) | 0.832 | 0.832 |
| Symmetry imposed | C1 | C1 |
| Initial particle images (no.) | 5,538,959 | 9,420,673 |
| Final particle images (no.) | 174,399 | 341,318 |
| Map resolution (Å) | 3.2 | 3.3 |
| FSC threshold | 0.143 | 0.143 |
| Map resolution range (Å) | 3.2–3.6 | 3.2–4.4 |
| Refinement | ||
| Initial model used (PDB code) | None | 7BC6 |
| Model resolution (Å) | 3.2 | 3.3 |
| FSC threshold | 0.143 | 0.143 |
| Model resolution range (Å) | 3.2–3.6 | 3.2–4.4 |
| Map sharpening B factor (Å2) | −95.3 | −81.8 |
| Model composition | ||
| Non-hydrogen atoms | 4178 | 4209 |
| Protein residues | 549 | 549 |
| Ligands | 0 | LYA: 1 |
| B factors (Å2) | ||
| Protein | 39.19 | 55.49 |
| Ligand | N/A | 60.24 |
| R.m.s. deviations | ||
| Bond lengths (Å) | 0.008 | 0.008 |
| Bond angles (°) | 0.893 | 0.870 |
| Validation | ||
| MolProbity score | 1.95 | 2.13 |
| Clashscore | 9.52 | 12.19 |
| Poor rotamers (%) | 0.92 | 0.23 |
| Ramachandran plot | ||
| Favored (%) | 93.03 | 90.46 |
| Allowed (%) | 6.97 | 9.36 |
| Disallowed (%) | 0.00 | 0.18 |
PCFT adopts the canonical MFS fold in an outward open conformation, with the nanobody bound at the entrance to the binding site (Fig. 1b, c). In this conformation, transmembrane helix (TM) 1 and TM2, as well as TM7 and TM8, splay apart to reveal the entrance to a large polar cavity that extends into the interior of the transporter. At the base of this cavity, TM4 and TM5, and TM10 and TM11, pack together to seal the binding site from the cytoplasm. These helices form the extracellular (TM1, TM2, TM7 and TM8) and intracellular gates (TM4, TM5, TM10 and TM11), and alternate between open (splayed apart) and closed (packed together) states during transport within members of the MFS24,25. PCFT contains a large extracellular loop, which extends from TM1 and reaches over the top of the transporter, before contacting the C-terminal bundle through a disulfide bond (Extended Data Fig. 4b–e). There is a discontinuity in TM426 (Fig. 1d) that is stabilized through an intrahelical salt bridge between Arg156 (Arg148; all parenthetical residues refer to the corresponding residue in human PCFT) and Asp164 (Asp156). This discontinuity is mirrored in TM10, which—although less pronounced—functions to create a polar pocket that extends deep within the C-terminal helical bundle and sits close to another conserved side chain, His289 (His281), on TM7 (Extended Data Fig. 5a). Below the water pocket, TM10 packs close to TM5 to seal the binding site from the cytoplasmic side of the membrane, and is stabilized by a conserved salt-bridge interaction between Glu193 (Glu185) and Arg384 (Arg376). The presence of an intrahelical salt bridge in PCFT suggests a previously undescribed mechanism within the MFS fold for coupling transport to pH gradients across the membrane. Consistent with the anionic property of folic acid (which has a −2 charge at physiological pH)11, the entrance to the transporter binding site is positively charged. This feature may serve to attract folates and funnel them into the transporter (Fig. 1d).
PCFT in complex with pemetrexed
To understand the structural basis of the recognition and transport of antifolate agents, we determined the structure of PCFT in complex with pemetrexed to a resolution of 3.3 Å (Fig. 1e, Extended Data Fig. 6, Extended Data Table 1). Pemetrexed is an established drug for the treatment of non-small-cell lung cancer and plural mesothelioma21 and is a favoured substrate of PCFT, with a KM of 0.2–0.8 μM10 and a half-maximal inhibitory concentration of 0.2 μM for the human transporter and 0.9 μM for the chicken homologue (Extended Data Fig. 1c). We determined the pemetrexed complex at pH 6.0 to match the acidic conditions of the tumour microenvironment27. Pemetrexed was well-resolved in the cryo-EM maps and bound in a kinked conformation at the base of the polar cavity (Fig. 1e, Extended Data Fig. 4a). The γ-carboxylate group of the glutamate occupies a positively charged pocket that is located within the N-terminal bundle. This group interacts with Arg156 (Arg148), which is part of the intrahelical salt bridge in TM4, and Asn98 (Asn90) on TM2 (Fig. 1f, Extended Data Fig. 4f, g). The β-carboxylate makes no specific interaction to side chains in the binding site, whereas both the amide and carbonyl groups interact with Ser411 (Met403) on TM11. The benzoyl group makes a π–π stacking interaction with Phe290 (Phe282) on TM7, whereas the pyrimidine group sits in a second polar cavity that is constructed from side chains in the C-terminal bundle. In particular, Tyr323 (Tyr315) on TM8 interacts with the carbonyl and amide groups; the NH2 amine group interacts with Glu193 (Glu185) on TM5 (Extended Data Fig. 4g). The pyrrole amine group of pemetrexed interacts with Glu407 on TM11, which is an asparagine in the human homologue (Asn399) (Extended Data Fig. 7a–e).
Mechanism of proton coupling
Previous studies have identified essential residues, along with missense mutations that cause hereditary folate malabsorption4,7,18 (Extended Data Fig. 1a). The structure of PCFT in complex with pemetrexed allows these mutations to be placed in the context of the binding site and transport mechanism (Extended Data Fig. 7f). Of particular interest are mutations that affect Arg376 in TM10, Asp156 in TM428,29 and Glu185 in TM5 (which correspond to Arg384, Asp164 and Glu193, respectively, in the chicken homologue), which are associated with hereditary folate malabsorption and have previously been reported to have a role in proton coupling30. Our structures reveal that these side chains, together with Arg156 (Arg148), form salt bridge interactions that stabilize the transporter in the outward open state (Fig. 1d). Under acidic pH conditions and in the presence of the ligand, we observe repositioning of both arginine side chains, which resulted in the breaking of these interactions, thus linking ligand binding to the conformational changes needed for transport (Fig. 2a). The γ-carboxylate group of pemetrexed functions to replace the interaction of Arg156 with Asp164 at one end of the binding pocket, which essentially swaps a protein–protein interaction for a protein–ligand salt bridge. At the other end of the binding pocket, the amino group of the pyrimidine ring disrupts the interaction between Glu193 and Arg384.
Fig. 2 |. Mechanism of proton coupling.
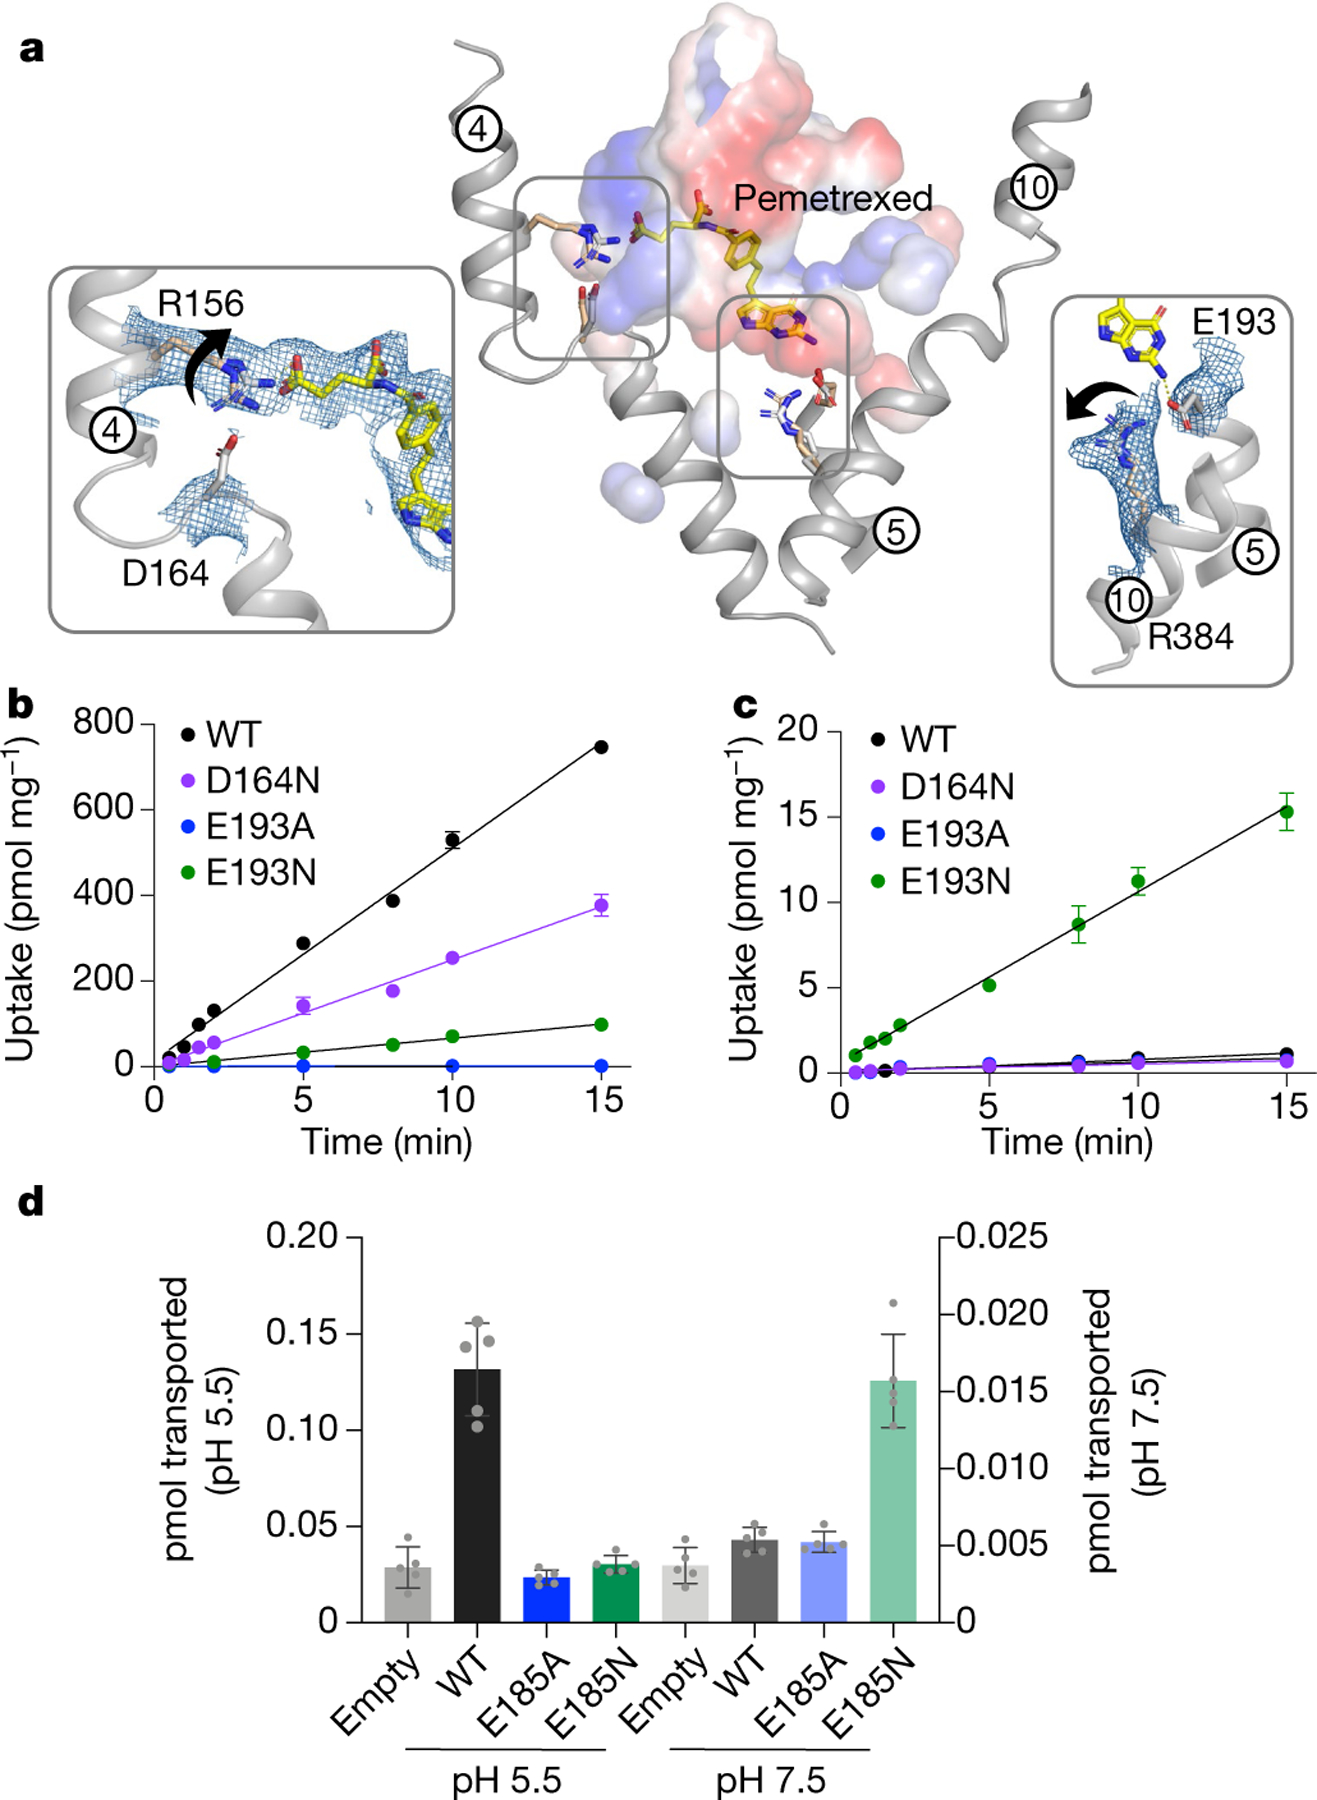
a, Structural comparison of the pemetrexed-bound and apo structure. Key side-chain rearrangements are observed after pemetrexed and proton binding. View is a direct comparison to Fig. 1d. Insets show the cryo-EM density for the two salt-bridge interactions, which are broken in the presence of substrate. Arrows indicate direction of side-chain movement. b, Initial rates of folic acid uptake into liposomes containing wild-type (WT) and variant forms of PCFT at pH 5.5. n = 3 independent experiments. c, As in b, but performed at pH 7.5 and highlighting the role of Glu193 in proton coupling. Internal pH of liposomes was maintained at 7.5. n = 3 independent experiments. d, Cell based transport assays for wild-type and variant human PCFT. n = 5 biologically independent experiments. In b–d, data are mean ± s.d.
To validate the role of Asp164 (Asp156) and Glu193 (Glu185) in proton coupling, we analysed variants using a combination of liposome and cell-based transport assays (Fig. 2b, c, Extended Data Fig. 8a). The Asp164Ala variant could not be purified, which is consistent with this residue having a role in stabilizing the discontinuous region in TM4. The substitution of this side chain with tyrosine—a consequence of a mutation associated with hereditary folate malabsorption—similarly produces unstable protein29. However, the asparagine variant could still transport [H3]folic acid, which identifies Asp164 as a site of proton binding. Molecular dynamics shows that protonation of Asp164 reduces the energy required for breaking the interaction with Arg156 (Extended Data Fig. 8b–e). Pemetrexed binding further weakens this salt bridge through the stabilization of the protonated state of Asp164 by inducing an upward shift of its pKa. Although the Glu193Ala variant could be purified, it nevertheless showed no detectable transport activity at pH 5.5 (Fig. 2b). However, the asparagine variant was functional at pH 7.5 (Fig. 2c), which indicates that Glu193 has an important role in linking proton binding to folate transport. An upward shift of the pKa was also observed for Glu193 in the pemetrexed-bound state (Extended Data Fig. 8b–e), consistent with the assay data. We confirmed these results in a cell-based assay using the human transporter (Fig. 2d, Extended Data Fig. 8f).
Several conserved histidine residues have also previously been implicated in proton binding, although—unlike Glu193 (Glu185)—they are not essential for transport31, which indicates that not all of the protons are thermodynamically coupled. A membrane potential does not influence transport in our liposome assays (Extended Data Fig. 1f), which suggests that transport is coupled to two protons. However, as PCFT moves a positive charge across the membrane7, additional sites must undergo cycles of protonation and deprotonation. His289 (His281) is located adjacent to Phe290 (Phe282) on TM7 and makes a hydrogen-bond interaction with Asn350 (Asn342) on TM9, which stabilizes the extracellular gate in the outward open state (Extended Data Fig. 9). Following pemetrexed binding, His289 rotates away from Asn350 and breaks the interaction with TM9. Given the close interaction between the benzoyl group of pemetrexed and Phe290, it is likely that ligand binding promotes the repositioning of TM7 towards TM1 and initiates the closure of the extracellular gate of the transporter. This movement would be facilitated by the protonation of His289, a role which is consistent with our structural data.
Our data provide a model for proton-coupled folate transport in PCFT. Specifically, in the outward open state at acidic pH, Asp164 (Asp156), His289 (His281) and Glu193 (Glu185) are protonated and the protein is primed for transport (Fig. 3a). Proton binding to Asp164 and Glu193 drives transport, whereas binding to His289 facilitates movement of the gating helices. Binding of the ligand will promote closure of the extracellular gate through the interaction of Phe290 (Phe282) on TM7 and is facilitated by the protonation of His289 and the presence of the water pocket that loosens the packing of the helices of the C-terminal bundle (Extended Data Fig. 5). In support of this model, molecular dynamics analysis reveals the movement of the extracellular gate helices and the closure of the extracellular loop over the binding site entrance in the presence of pemetrexed (Extended Data Fig. 4b, c). At the cytoplasmic gate, the γ-carboxylate breaks the intrahelical salt bridge in TM4, whereas the amine group of the pyrimidine ring disrupts the interhelical salt bridge between Glu193 and Arg384 (Arg376) (which connects TM5 with TM10). The interaction with the amine group would trigger the cytoplasmic half of TM4 and TM5 to open, releasing the folate into the cell. Following exposure to the cytoplasmic side of the membrane, Asp164, Glu193 and His289 should deprotonate to favour the reformation of the salt bridge and hydrogen-bond networks and drive reorientation to the outward-facing state (Fig. 3b). This mechanism explains the pH dependency of PCFT and reveals how protons facilitate folate transport into the cell.
Fig. 3 |. Alternating-access transport mechanism and antifolate-binding model.
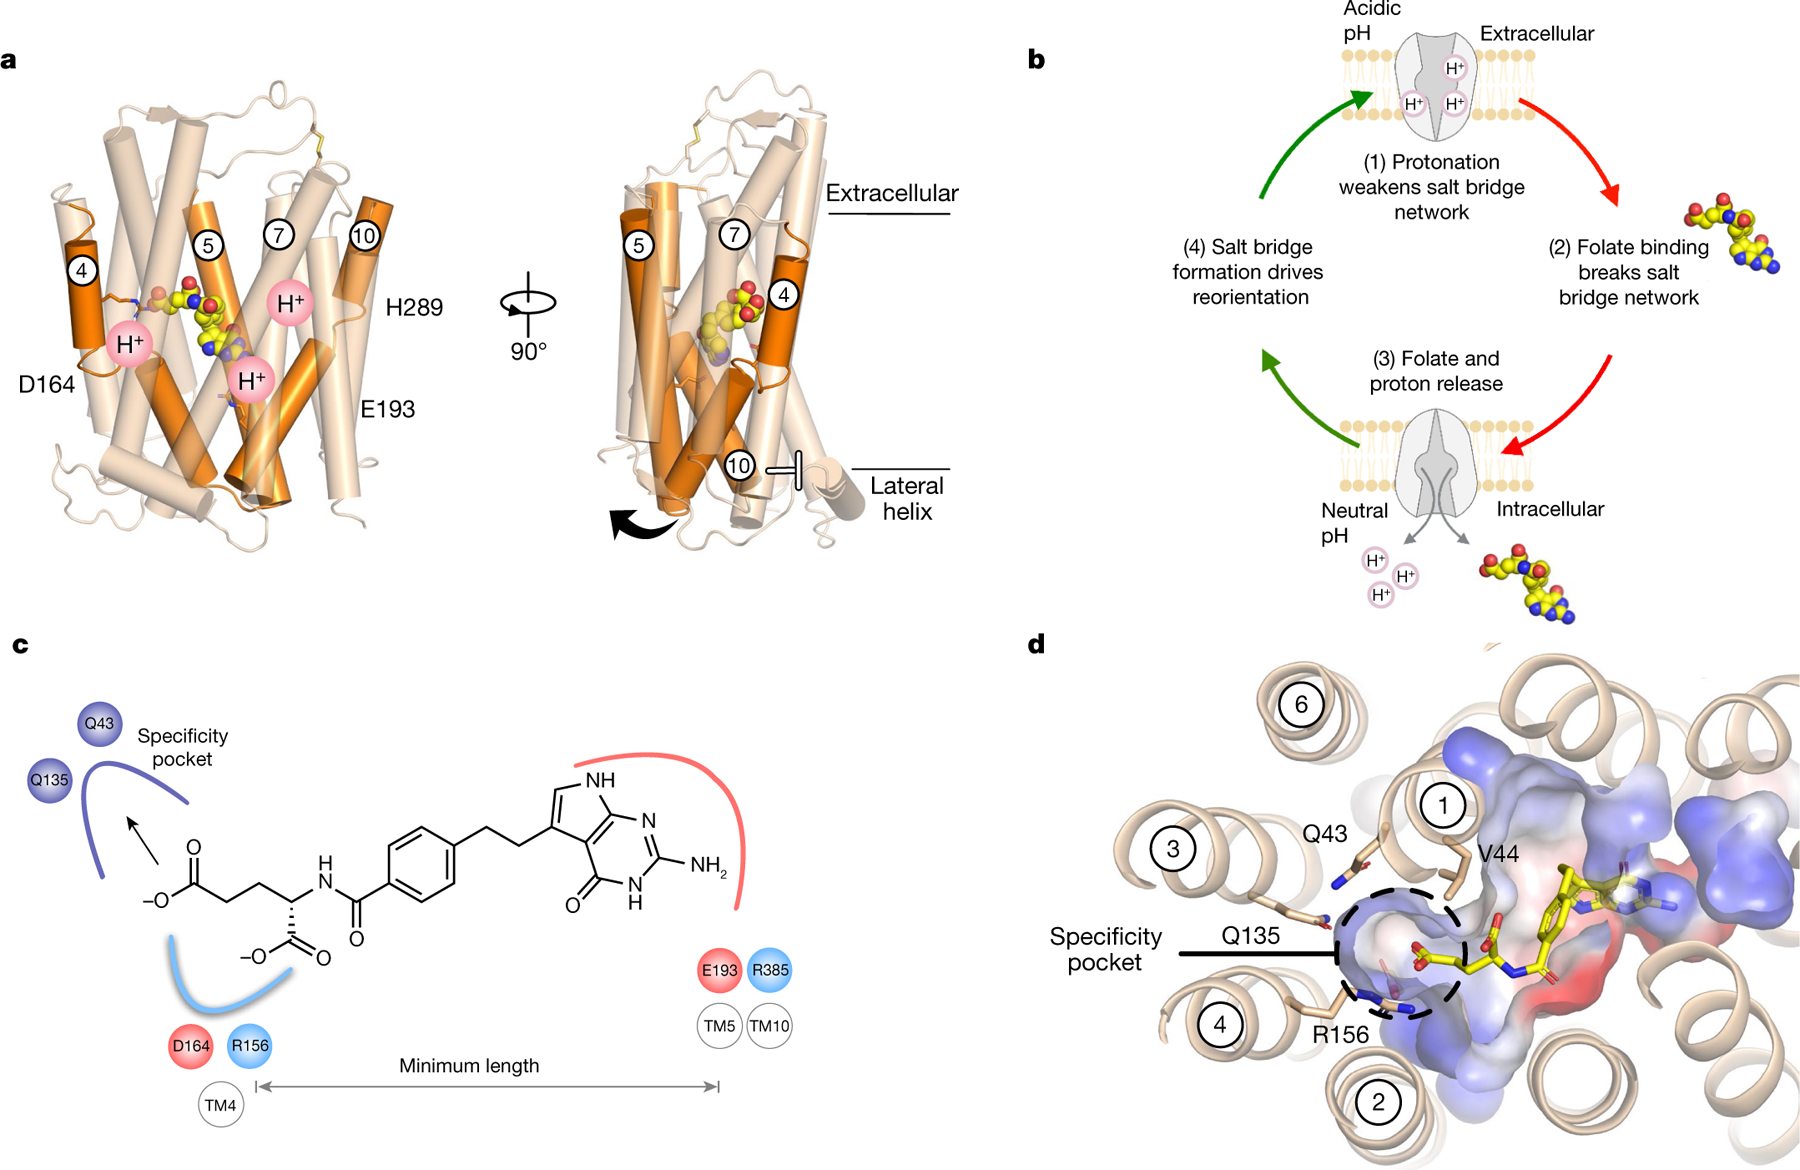
a, Analysis of the gating helices (orange) reveals how proton binding is linked to intracellular gate dynamics. TM4 and TM5 are likely to undergo the largest structural change to release ligand into the cell, whereas proton binding at His289 will facilitate the closure of the extracellular gate mediated by TM7. b, Key steps in the alternating-access model for proton-coupled folate transport. c, Folates or antifolate agents must engage both salt bridges at either end of the binding site to open the intracellular gate, which establishes a minimum length for substrates. d, A polar pocket close to the γ-carboxylate explains how PCFT-specific antifolate drugs are recognized.
Pharmacophore model for antifolate drugs
Finally, our model for folate transport indicates that ligands must coordinate both Arg156 (Arg148) and Glu193 (Glu185) to be transported, which establishes a minimal distance between these two functional groups in the binding site for antifolate drugs (Fig. 3c). The pharmacophore model established by our structures explains previous structure–activity relationship data on antifolate agents9. In particular, structures of novel six-substituted antifolate drugs, in which additional carbon units lengthen the bridge region between the pyrimidine analogue and a thienyl ring (which substituted the benzyl group), exhibit selectivity for PCFT over RFC9,32,33. We can now rationalize these observations: lengthening the bridging region would serve to extend the γ-carboxylate into a conserved polar pocket in the N-terminal bundle, which contains two conserved glutamine side chains (Gln43 (Gln39) on TM1 and Gln135 (Gln127) on TM3) (Fig. 3d). This would allow the β-carboxylate to replace the interaction with Arg156 (Arg148), satisfying the minimal length requirement for ligands to trigger transport. Substantially shortening the bridge region or a lengthening of greater than five carbon units resulted in molecules that were not recognized by PCFT32,33, probably because these molecules no longer engaged both salt-bridge networks correctly. Our structure-based pharmacophore thus establishes a framework for further rational drug design of new antifolate agents with reduced cytotoxicity and enhanced selectivity towards PCFT.
Methods
No statistical methods were used to predetermine sample size. The experiments were not randomized, and investigators were not blinded to allocation during experiments and outcome assessment.
Cloning, expression and purification of PCFT
The gene encoding chicken PCFT was codon-optimized for expression in Saccharomyces cerevisiae and synthesized as a DNA fragment containing homologous recombination sites for insertion into pDDGFP-LEU2d (Addgene 58352)34. Wild-type and mutant forms of PCFT were expressed by growing an overnight culture in medium minus leucine with 2% glucose. This culture was diluted 10-fold in medium minus leucine with 2% lactate in 12 or 24 TunAir flasks and incubated for at least 8 h at 30 °C at 260 rpm. After this time, expression was induced through the addition of 1.5% galactose from a 25% (w/v) stock. The yeast was collected after a further 16 h and membranes were prepared. Wild-type and mutant PCFT were purified to homogeneity using standard immobilized metal-affinity chromatography protocols in n-dodecyl-β-d-maltopyranoside (DDM) (Glycon) detergent with cholesterol hemisuccinate (5:1 ratio DDM:CHS). Following TEV cleavage, the protein was subjected to size-exclusion chromatography (Superdex 200; Cytiva) in a buffer comprising 20 mM Tris pH 7.5, 150 mM NaCl with 0.03% DDM and 0.006% CHS. Biotinylated PCFT was produced by adding a C-terminal Avi-tag before the TEV cleavage site within the vector. The protein was purified as for wild type, following biotinylation by glutathione S-transferase–BirA overnight, the protein was subjected to a further size-exclusion run.
Reconstitution into liposomes
PCFT was reconstituted into liposomes consisting of 3:1 POPE:POPG using biobeads. Chloroform was removed from the lipids (Avanti polar lipids) through the use of a rotary evaporator to obtain a thin film. The lipids were washed twice in pentane and then resuspended at 10 mg ml−1 in lipid buffer (50 mM potassium phosphate at pH 6.5). These lipid vesicles were frozen and thawed twice in liquid nitrogen and stored at −80 °C until required. For reconstitution, the lipids were thawed and then extruded first through a 0.8-μm filter and then through a 0.4-μm filter. Purified PCFT in DDM:CHS (at 0.5 μg μl−1 concentration) was added to the lipids at a final lipid:protein ratio of 80:1 and incubated for 1 h at room temperature, then for a further 1 h on ice; for the no-protein liposome control, the same volume of gel filtration buffer containing 0.03% DDM and 0.006% CHS was added. After this time, biobeads were added in batches over 24 h. Biobeads (BioRad) were removed and the proteoliposomes were collected by centrifugation at 120,000g for 40 min before resuspension in lipid buffer at a final protein concentration of 0.25 μg μl−1. The proteoliposomes were subjected to three rounds of freeze–thawing in liquid nitrogen before storage at −80 °C. The amount of protein (both wild type and mutant variants) reconstituted into the lipids was quantified by SDS–PAGE and densitometry after solubilizing the liposomes with 1% DDM:CHS. The amount of protein was calculated as everything that could be resolubilized (both monomer and dimer bands shown in Extended Data Fig. 8a). For immunization into llamas to raise nanobodies, 0.6 mg of PCFT was reconstituted into POPE:POPG (3:1) ratio at a lipid:protein ratio of 40:1 and resuspended at a final protein concentration of 1 mg ml−1.
Transport assays
To analyse transport activity, 3H-folic acid (Moravek) was used to monitor uptake and the folic acid was used within six months of the activity date (owing to the instability observed of the product over time). Proteoliposomes were thawed and the required amount of proteoliposomes were collected through centrifugation before resuspending in inside buffer (120 mM NaCl, 2 mM MgSO4 and 20 mM HEPES pH 7.5). The liposomes were subjected to four rounds of freeze–thawing in liquid nitrogen to fully distribute the buffer and then extruded through a 0.4-μm filter. To initiate transport, the proteoliposomes were diluted into the desired external buffer containing folic acid and trace amounts of 3H-folic acid. The reaction was incubated at 30 °C and stopped by rapidly filtering onto 0.22-μm filters, which were then washed with 2 × 2-ml cold buffer. The amount of folic acid transported inside the liposomes was calculated by scintillation counting in Ultima Gold (Perkin Elmer) with comparison to a standard curve for the substrate. Experiments were performed a minimal of three times to generate an overall mean and s.d. For the pH optimum experiments, 0.5 μg of protein was used per time points and a final concentration of 2.0 μM folic acid. The internal buffers for these experiments consisted of 120 mM NaCl, 2 mM MgSO4 and 10 mM each of cacodylate, MES and HEPES at the desired pH (6.0, 6.5, 7.0, 7.5 and 8.0). The external buffers used consisted of 120 mM NaCl, 2 mM MgSO4 and 10 mM each of cacodylate, MES and HEPES, at one pH unit below the internal for each condition (5.0, 5.5, 6.0, 6.5 and 7.0). The data shown in Extended Data Fig. 1e shows the per cent of folic acid transported after 5 min as a percentage of the amount at pH 5.0. The kinetic analysis was performed at pH 5.5 using MES buffer owing to the toxicity of cacodylate, and also to be able to compare to the literature. The assays used 0.2 μg protein per time point; to allow for the increasing concentration of folic acid and its slight stickiness to the liposomes, for each time point a background value was removed (corresponding to liposomes reconstituted with buffer only). The rate at each concentration was plotted from the linear range of the data and the whole experiment was repeated in triplicate to obtain the KM ± s.d. To analyse the effect of a membrane potential, the internal buffer used consisted of 120 mM KCl, 2 mM MgSO4 and 20 mM HEPES pH 7.5 and the external buffer was 120 mM NaCl, 2 mM MgSO4 and 20 mM pH 5.5 with or without 1 μM valinomycin. To test the effect on transport of the nanobody, a 3× molar excess of nanobody was added to the PCFT liposomes before the freeze–thaw steps and the liposomes were subjected to 5 rounds of freeze–thawing in liquid nitrogen. To act as a nanobody-negative control, a nanobody raised against a different protein was used that showed no affinity for PCFT.
Cell-based folic acid transport assays
HeLa-derived R1–11 cells (which lack endogenous PCFT and RFC expression35,36) were maintained in RPMI 1640 medium supplemented with 10% fetal bovine serum and 2 mM L-glutamine under 5% CO2 at 37 °C. The cell line was not authenticated and not tested for mycoplasma contamination. For transport assays, 2 × 10⁵ cells per well were seeded into 12-well plates and 24 h later were transfected using lipofectamine 2000 with PCFT constructs containing a C-terminal Flag tag in the vector pCDNA3.1 for 36 h. Cells were washed twice with PBS before application of 0.5 ml assay buffer containing folic acid with trace amounts of 3H-folic acid (2.0 μM). The buffer comprised 120 mM NaCl with either 20 mM MES pH 5.5 or HEPES pH 7.5. After the desired time the assay buffer was removed, and the cells quickly washed twice with 0.5 ml assay buffer with no folic acid. Cells were removed using trypsin, placed in a scintillation vial containing 100 μl 1 M NaOH and lysed for 5 min before the addition of scintillation fluid. The amount of folic acid taken up by the cells was calculated by scintillation counting in Ultima Gold (Perkin Elmer) with comparison to a standard curve for the substrate. Experiments were performed a minimum of three times to generate an overall mean and s.d. To assess expression of the mutant variants within the cells, a western blot was performed using an anti-Flag antibody for PCFT and anti-β-actin as a loading control. Samples consisted of DDM:CHS-solubilized cells.
Identification and screening of nanobodies
To identify PCFT-specific nanobodies, we used both a naive llama library (Abcore) and a library raised from immunization of a llama with reconstituted PCFT and screened using C-terminally biotinylated protein as previously described37,38. ELISA-positive clones were sequenced and unique nanobodies identified. These were further characterized using biolayer interferometry using an Octet Red385 (Sartorius) and streptavidin biosensors loaded with biotinylated PCFT at 100 nM in 20 mM Tris pH 7.5, 150 mM NaCl, 0,03% DDM, 0.006% CHS to compare kon and koff. To calculate KD, a serial dilution of the nanobody from 125 nM to 3.9 nM was made and, following a 60-s baseline step, the nanobody was allowed to associate for 300 s followed by a dissociation step of 300 s. Data were analysed in the Octet v.9.0 software package and fit to a single binding-site model in Prism. All raw data were baseline- and reference-subtracted, in-step corrected, y-axis aligned and filtered with a Savitzky–Golay filter. The nanobodies exhibiting the slowest off rate were analysed for co-elution with PCFT via size-exclusion chromatography on a Superdex 200 column at pH 7.5 at 4 °C.
Thermal stability measurements
Thermal stability in the presence and absence of 0.1 mM ligand was analysed using a Prometheus NT.48 (NanoTemper Technologies). The proteins were diluted to a final concentration of 0.3 mg ml−1 into buffer containing 20 mM Mes pH 5.5 or 20 mM Hepes pH 7.5, 150 mM NaCl and 0.03% DDM and 0.006% CHS before the addition of ligand and incubated on ice for 15 min. Thermal measurements were carried out in a range from 20 to 90 °C with 1-°C per min steps. The resulting melting curves were generated by plotting the first derivative of the fluorescence ratio at 330 nm/350 nm against temperature.
Secondary structure analysis
Circular dichroism was used to assess secondary structure of the purified PCFT. Concentrated (20 mg ml−1) protein was diluted to 0.2 mg ml−1 into buffer consisting of 10 mM potassium phosphate pH 6.5, 50 mM sodium sulfate and 0.03% DDM:CHS (5:1 ratio). The circular dichroism spectrum was obtained using a JASCO 815 spectrophotometer (JASCO).
Cryo‐EM sample preparation and data acquisition
After size exclusion, PCFT was mixed with a 1.2 molar excess of the PCFT–nanobody and incubated on ice for at least 30 min and the complex was separated via size-exclusion chromatography as described in ‘Cloning, expression and purification of PCFT’. For the pemetrexed–PCFT–nanobody complex, PCFT was buffer-exchanged into 20 mM MES pH 6.0, 150 mM NaCl with 0.03% DDM and 0.006% CHS via size-exclusion chromatography. The peak fraction was incubated with 0.1 mM pemetrexed for 1 h on ice before the incubation with a 1.2 molar excess of nanobody, before separation by size-exclusion chromatography at pH 6.0.
PCFT with nanobody (6 mg ml−1) or pemetrexed-bound PCFT with nanobody (5.8 mg ml−1) were adsorbed to glow-discharged holey carbon-coated grids (Quantifoil 300 mesh, Au R1.2/1.3) for 10 s. Grids were then blotted for 2 s at 100% humidity at 8 °C and frozen in liquid ethane using a Vitrobot Mark IV (Thermo Fisher Scientific). Data were collected in counted super-resolution mode on a Titan Krios G3 (FEI) operating at 300 kV with a BioQuantum imaging filter (Gatan) and K3 direct detection camera (Gatan) at 105,000× magnification, physical pixel size of 0.832 Å. We collected 12,384 movies for PCFT–nanobody complex at a dose rate of 22.2 e− per Å2 per s, exposure time of 2.66 s, corresponding to a total dose of 59.1 e− per Å2 over 40 fractions. We collected 13,039 movies for pemetrexed-bound PCFT–nanobody complex at a dose rate of 20.9 e− per Å2 per s, exposure time of 2.80 s, corresponding to a total dose of 58.5 e− per Å2 over 40 fractions.
Cryo-EM data processing
Initial micrograph processing was performed in real time using the SIMPLE pipeline39, using SIMPLE-unblur for patched (15 × 10) motion correction, SIMPLE-CTFFIND for patched CTF estimation and SIMPLE-picker for particle picking. After initial 2D classification in SIMPLE to remove junk particles, all subsequent processing was performed in either cryoSPARC40 or RELION-3.141 using the csparc2star.py script within UCSF pyem42 to convert between formats. Resolution estimates were derived from gold-standard Fourier shell correlations (FSCs) using the 0.143 criterion as calculated within RELION, cryoSPARC or the remote 3DFSC43 processing server. Local resolution estimations were calculated within RELION.
For PCFT–nanobody (Extended Data Fig. 3), 3,454,154 particles were re-extracted in 256 × 256 boxes following initial 2D classification in SIMPLE and subjected to reference-free 2D classification in RELION (200 classes). Selected particles (2,167,350) were used for non-uniform refinement in cryoSPARC against an 8 Å low-pass-filtered ab initio model generated from a 110,000-particle subset within cryoSPARC, using an initial low-pass filter of 35 Å, to yield a 4.1 Å map. The corresponding orientation file was imported into RELION using csparc2star.py and focused local refinement was performed using a soft ‘protein’ mask encompassing the transmembrane helices and nanobody, which generated a 3.8 Å volume. Non-uniform refinement in cryoSPARC after Bayesian polishing in RELION (320 × 320 box) improved map quality and resolution to 3.7 Å. A class consisting of 286,258 particles was recovered after focused 3D classification without alignment in RELION using a protein mask; subsequent non-uniform refinement of this particle set in cryoSPARC generated a 3.2 Å map with enhanced side-chain density. Following another focused 3D classification without alignment in RELION, particles from three high-resolution classes (174,399 particles in total) were subjected to non-uniform refinement within cryoSPARC to generate a 3.2 Å map. B-factors were further improved by per-particle defocus refinement and another round of non-uniform refinement to generate a final map with global resolution of 3.2 Å.
For pemetrexed-bound PCFT–nanobody (Extended Data Fig. 6), 5,623,744 particles in 256 × 256 boxes were recovered following initial 2D classification in SIMPLE and subjected to 2 rounds of reference-free 2D classification in cryoSPARC (300 classes each round). Selected particles (2,658,181) were used for non-uniform refinement in cryoSPARC against an 8 Å low-pass-filtered PCFT–nanobody map to yield a 4.3 Å volume. These particles were further Bayesian-polished in RELION (320 × 320 box) and subjected to a multi-class heterorefinement in cryoSPARC using four 8 Å low-pass-filtered ab initio models generated from the non-polished particle dataset (starting initial low-pass filter of 35 Å) as input. Particles (982,582) from the only sensible PCFT–nanobody class were subjected to two rounds of cryoSPARC non-uniform refinement to yield an improved 3.5 Å volume. This particle set was subjected to another round of multi-class heterorefinement using 8 Å lowpass-filtered maps generated from the previous multi-class heterorefinement as references. A class containing 636,596 particles was subjected to one round of non-uniform refinement yielding a 3.4 Å volume with clear density within the transporter cavity. Focused 3D classification without alignment was performed in RELION using a soft mask encompassing the transporter cavity from which two similar, but highly occupied, classes (totalling 341,318 particles) were selected. This particle set was subjected to non-uniform refinement to generate a 3.5 Å volume with strong pemetrexed density. This density was further improved to 3.3 Å by local non-uniform refinement in cryoSPARC using prior orientations, an 8 Å low-pass-filtered reference and a soft mask encompassing only protein.
Model building and refinement
The atomic model of PCFT–nanobody (Extended Data Table 1) was built de novo from the globally sharpened 3.2 Å map following several rounds of manual building using Coot v.0.944 and real-space refinement in PHENIX v.1.18.2–387445 using secondary structure, rotamer and Ramachandran restraints.
The atomic model of pemetrexed-bound PCFT–nanobody (Extended Data Table 1) was generated first by rigid-body fitting the PCFT–nanobody model into the globally sharpened pemetrexed-bound PCFT–nanobody 3.3 Å map followed by several rounds of real-space refinement in Coot and PHENIX. Pemetrexed ligand (‘LYA’ monomer) was imported into COOT46 and rigid-body fit into map density. Hydrogens were removed from pemetrexed in COOT and corresponding ligand restraint file was generated by eLBOW47 within the ReadySet! module of PHENIX followed by several rounds of real-space refinement in PHENIX and COOT. Both PCFT–nanobody and PCFT–nanobody + pemetrexed models were validated using MolProbity48 within PHENIX. Figures were prepared using UCSF ChimeraX v.1.149, PyMOL v.2.4.0 and BioRender.com.
Molecular dynamics
The coordinates of PCFT were obtained and the associated nanobody was removed. PCFT was embedded into a pure 1-palmitoyl-2-oleoyl-sn-glycero-3-phosphocholine (POPC) membrane via the self-assembly protocol at the coarse-grain level with the Martini 3 beta (3.0.b.3.2) forcefield50 as previously described51. The system was then trimmed to include 90 lipids on both leaflets.
The head group of some of the lipid molecules were then edited to give 1-palmitoyl-2-oleoyl-sn-glycero-3-phospho-ethanolamine (POPE) lipids resulting in an overall ratio of POPE:POPC = 3:1 across the entire lipid bilayer system. This was equilibrated for 10 μs before converting to an atomistic representation with cg2at52. The protein was represented with Amber14SB53 and the lipid was represented with the Slipid forcefield54. Hydrogen atoms were added to pemetrexed according to a previous publication55. Pemetrexed was represented with the GAFF force field56 and the charge was derived using RESP57. The system was then solvated with TIP3P water58 and neutralized to an ionic concentration of 0.15 M with NaCl.
The molecular dynamics engine was Gromacs 2020.459. The electrostatic interactions were computed using particle mesh Ewald with a short-range cut-off of 1 nm, which was also used for the Lennard–Jones interactions cut-off. After energy minimization, the system was equilibrated with 1,000 kJ mol−1 nm−1 positional restraint on the heavy atoms for 200 ps with a V-rescale thermostat60 at 310 K in the NVT ensemble. The system was further equilibrated with the same positional restraint in the NPT ensemble with a semi-isotropic Berendsen barostat61 at 1 atm and a Nose–Hoover thermostat at 310 K. The first equilibration run after the construction of the system was conducted for 25 ns at NPT ensemble until the potential energy of the system, box volume and the area-per-lipid converged. The resulting frame was used as the starting frame of the subsequent calculations, in which the NPT equilibration was run for 1 ns. Production runs were performed for 100 ns with the Parrinello–Rahman barostat62. Five independent repeats were performed and trajectories were clustered via the linkage method from gmx cluster based on the Cα atoms of the protein. The centre of a cluster was extracted with MDAnalysis63 and was allowed to run for a further 1,250 ns. The centre of a cluster was also used as the starting frame of the following calculations.
Protonation free-energy calculation
The free energy of protonating D164 and E193 were calculated for both apo and the pemetrexed-bound state. The topology for the protonation free-energy calculation was prepared with pmx64. The alchemical transformation was performed via 11 equally spaced lambda windows, in which coulombic, van der Waals and bonded interactions were changed at the same time with no soft core. The stochastic dynamics integrator65 was used for integration and an alchemical chloride ion was positionally restrained to the edge of the box to balance the charge. Each lambda window was equilibrated in the NVT ensemble for 200 ps and in the NPT ensemble for 1 ns followed by a 30-ns production run with replica exchange performed at 1-ps intervals. The production runs continued until the results converged (simulation time ranging from 30 ns to 120 ns), which is defined as the maximum difference between forward and reverse being smaller than 1 kcal mol−1 for the last 5 points (Extended Data Fig. 8d). The equilibration time (the initial part of the simulation to discard) is defined as the time (rounded up to the nearest 10 ns) that minimizes the s.d. of the reverse energy estimate. Three independent repeats were performed and the data were analysed with alchemical analysis66.
The estimated pKa was computed based on the protonation free energy in the protein (ΔGprot) and the protonation free energy of capped amino acid in the solution (ΔGsolv):
pKa0 is the model pKa of amino acid in solution (4.25 for glutamate and 3.65 for aspartate); RT is the product of molar gas constant and temperature; 2.303 is the natural log of 10. Convergence was assessed via analysis of the time evolution of the three repeats (Extended Data Fig. 8d).
Alchemical-transformation free-energy calculation
The free energy of Glu407Asn mutation was calculated for both apo and the pemetrexed-bound state. The topology for the alchemical transformation was prepared with pmx64 and then processed by alchemicalitp67 such that the transformation was done in three stages: (1) turning off the partial charges on the atoms that are dummy at state B, (2) transformation of the van der Waals and bonded potential and (3) turning on the partial charge on the new atoms in state B. The turning on and off of the partial charge was performed via 10 equally spaced lambda windows, while van der Waals and bonded interactions were transformed via 20 equally spaced lambda windows. The stochastic dynamics integrator was used for integration and an alchemical chloride ion was positionally restrained to the edge of the box to balance the charge. Each lambda window was equilibrated in the NVT ensemble for 200 ps and then in the NPT ensemble for 1 ns followed by a 30-ns production run with replica exchange performed at 1-ps intervals. Three independent repeats were performed and the data were analysed with alchemical analysis66.
Umbrella sampling calculations
The collective variable was defined as the distance between the CZ atom of R156 and CG atom of D164. Fifteen equally spaced windows were used to separate the collective variable from 0.3 nm to 1 nm and the CV was restrained at 1,000 kJ mol−1 nm−1. The initial frames were generated using metadynamics with plumed 2.6.268. Each window underwent 200 ps NVT equilibrium and 1 ns NPT equilibrium before a production run between 150 ns and 250 ns with replica exchange of 1 ps until the results converged. Three independent repeats were performed and the free-energy profile was recovered using WHAM69. Convergence was assessed via analysis of the time evolution of three repeats (Extended Data Fig. 8d, e).
Supplementary Material
Extended Data
Extended Data Fig. 1 |. Comparison of human and chicken PCFT homologues.
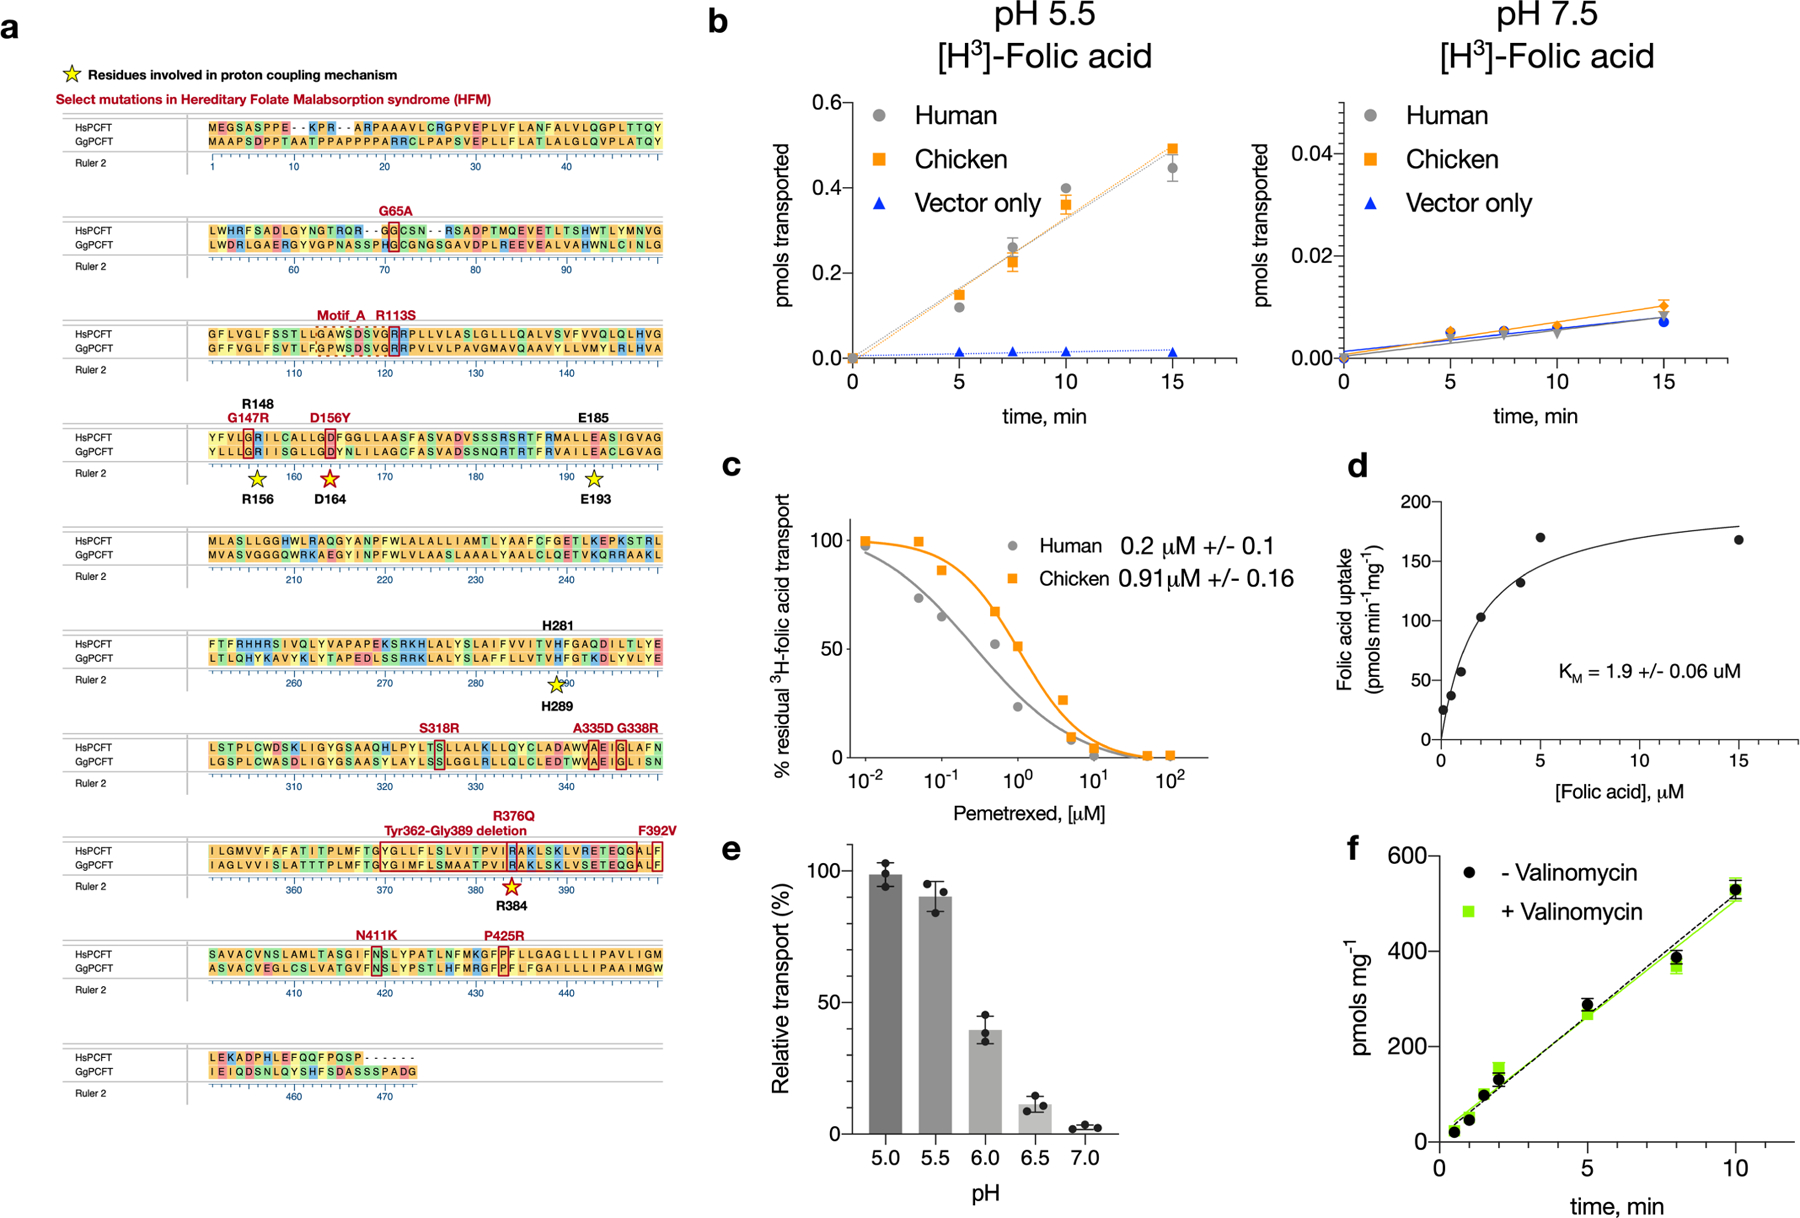
a, Sequence alignment of PCFT from human (Hs) (Uniprot Q96NT5) and chicken (Gg) (E6Y8U5) coloured via amino acid chemistry. Human and chicken PCFT homologues share an overall 58% identity and 87% similarity. Functionally relevant residues are highlighted with yellow stars, and mutations found to cause hereditary folate malabsorption disorder are in red. b, Cell-based uptake assay comparing the transport of 3H folic acid via human and chicken PCFT at both pH 5.5 and 7.5. The human and chicken homologues transport similar amounts of folic acid to each other and do so only at acidic pH (5.5). n = 4 independent experiments, mean and s.d. are shown. c, Pemetrexed competition of 3H folic acid uptake into cells, overexpressing either human or chicken PCFT. The calculated mean (from 4 independent experiments) half-maximal inhibitory concentration values are indicated ± s.d. d, Calculated KM for folic acid uptake at pH 5.5 by chicken PCFT in a liposome-based uptake assay. n = 3 independent experiments, calculated mean and s.d. values are shown e, Effect of pH on PCFT uptake in a liposome-based assay. n = 3 independent experiments, with the mean and s.d. shown. f, Membrane potential induced through potassium diffusion gradient (plus valinomycin) does not affect transport, an observation that has also been seen for human PCFT in cells34, suggesting that transport is thermodynamically coupled to two protons (assuming a −2 charge on folic acid). n = 4 independent experiments, data are mean and s.d.
Extended Data Fig. 2 |. Characterization of high-affinity nanobody to PCFT.
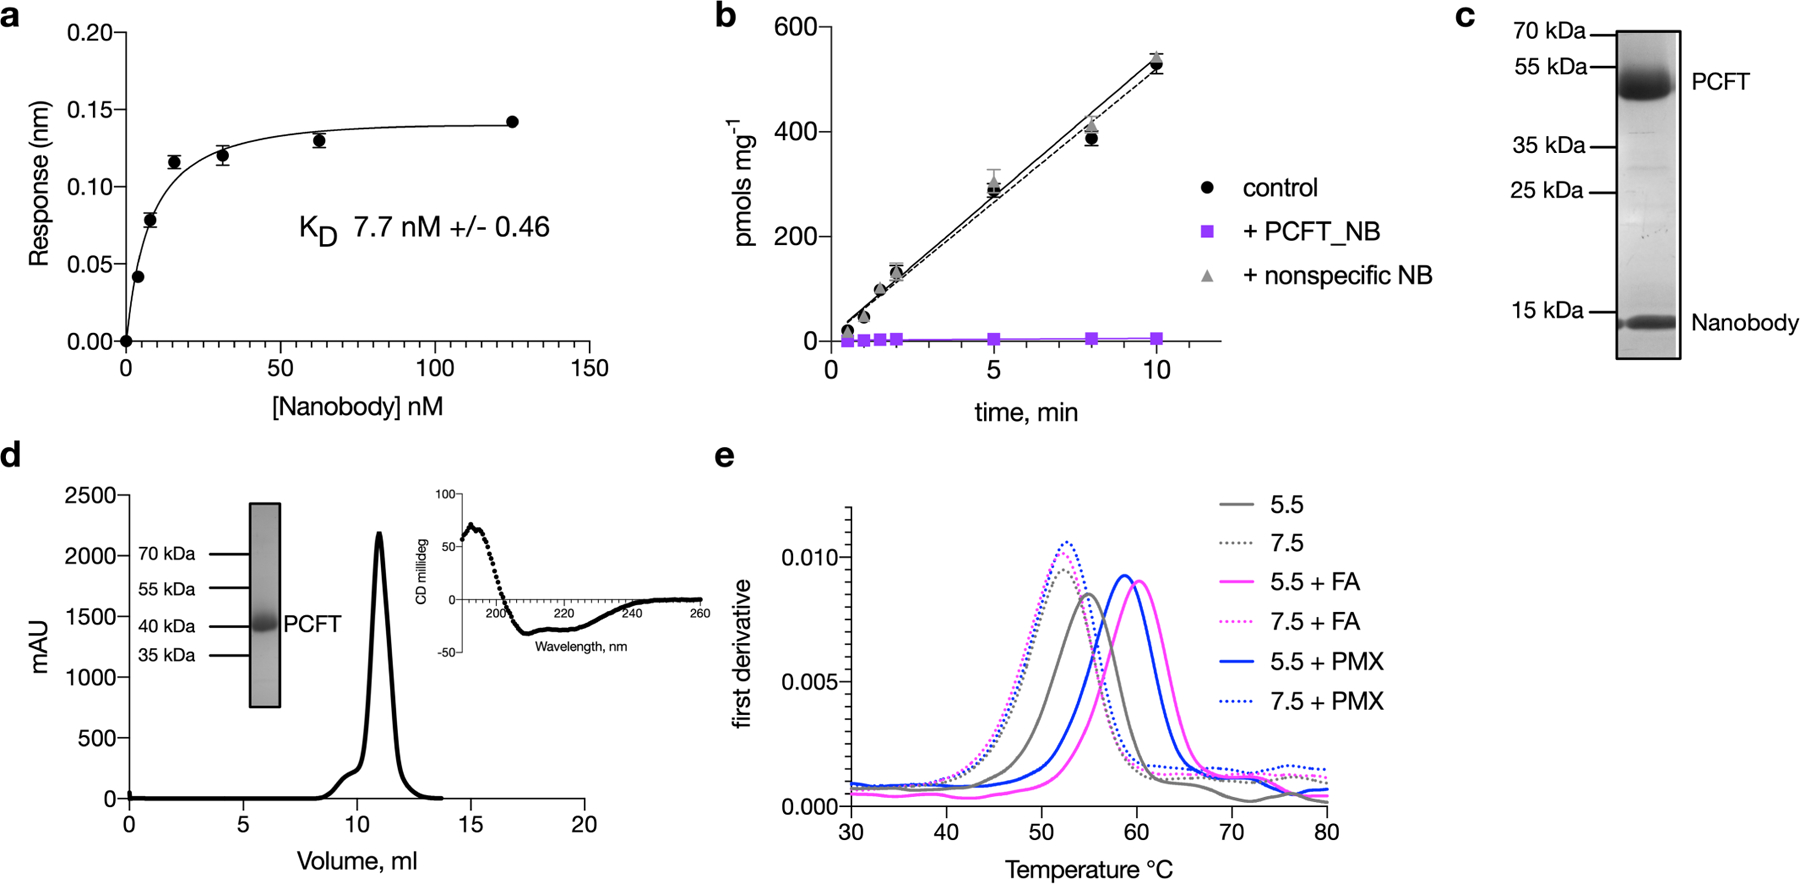
a, The nanobody identified from a naive llama library has a KD of about 8 nM for PCFT binding. n = 3 independent experiments, calculated mean ± s.d. shown. b, The nanobody blocks uptake of folic acid into liposomes containing PCFT, whereas a non-specific nanobody has no effect. n = 3 independent experiments, mean and s.d. shown. c, SDS–PAGE analysis of the PCFT–nanobody complex after size exclusion. Experiment was performed four times with similar results. d, Representative gel filtration trace of chicken PCFT in DDM:CHS detergent at pH 6.5. The protein elutes as a monomer of about 50 kDa. Insets show Coomassie-stained SDS–PAGE gel of the purified PCFT protein and circular dichroism analysis. Experiment was repeated eight times with similar results. e, Analysis of the thermostability of PCFT under different pH conditions (7.5 and 5.5) indicates that acidic pH stabilizes the protein. The presence of both folic acid (FA) or pemetrexed (PMX) further stabilize the protein, but only at acidic pH. Experiments were repeated three times with similar results.
Extended Data Fig. 3 |. Cryo-EM processing workflow, showing local and global map quality for the PCFT–nanobody complex.
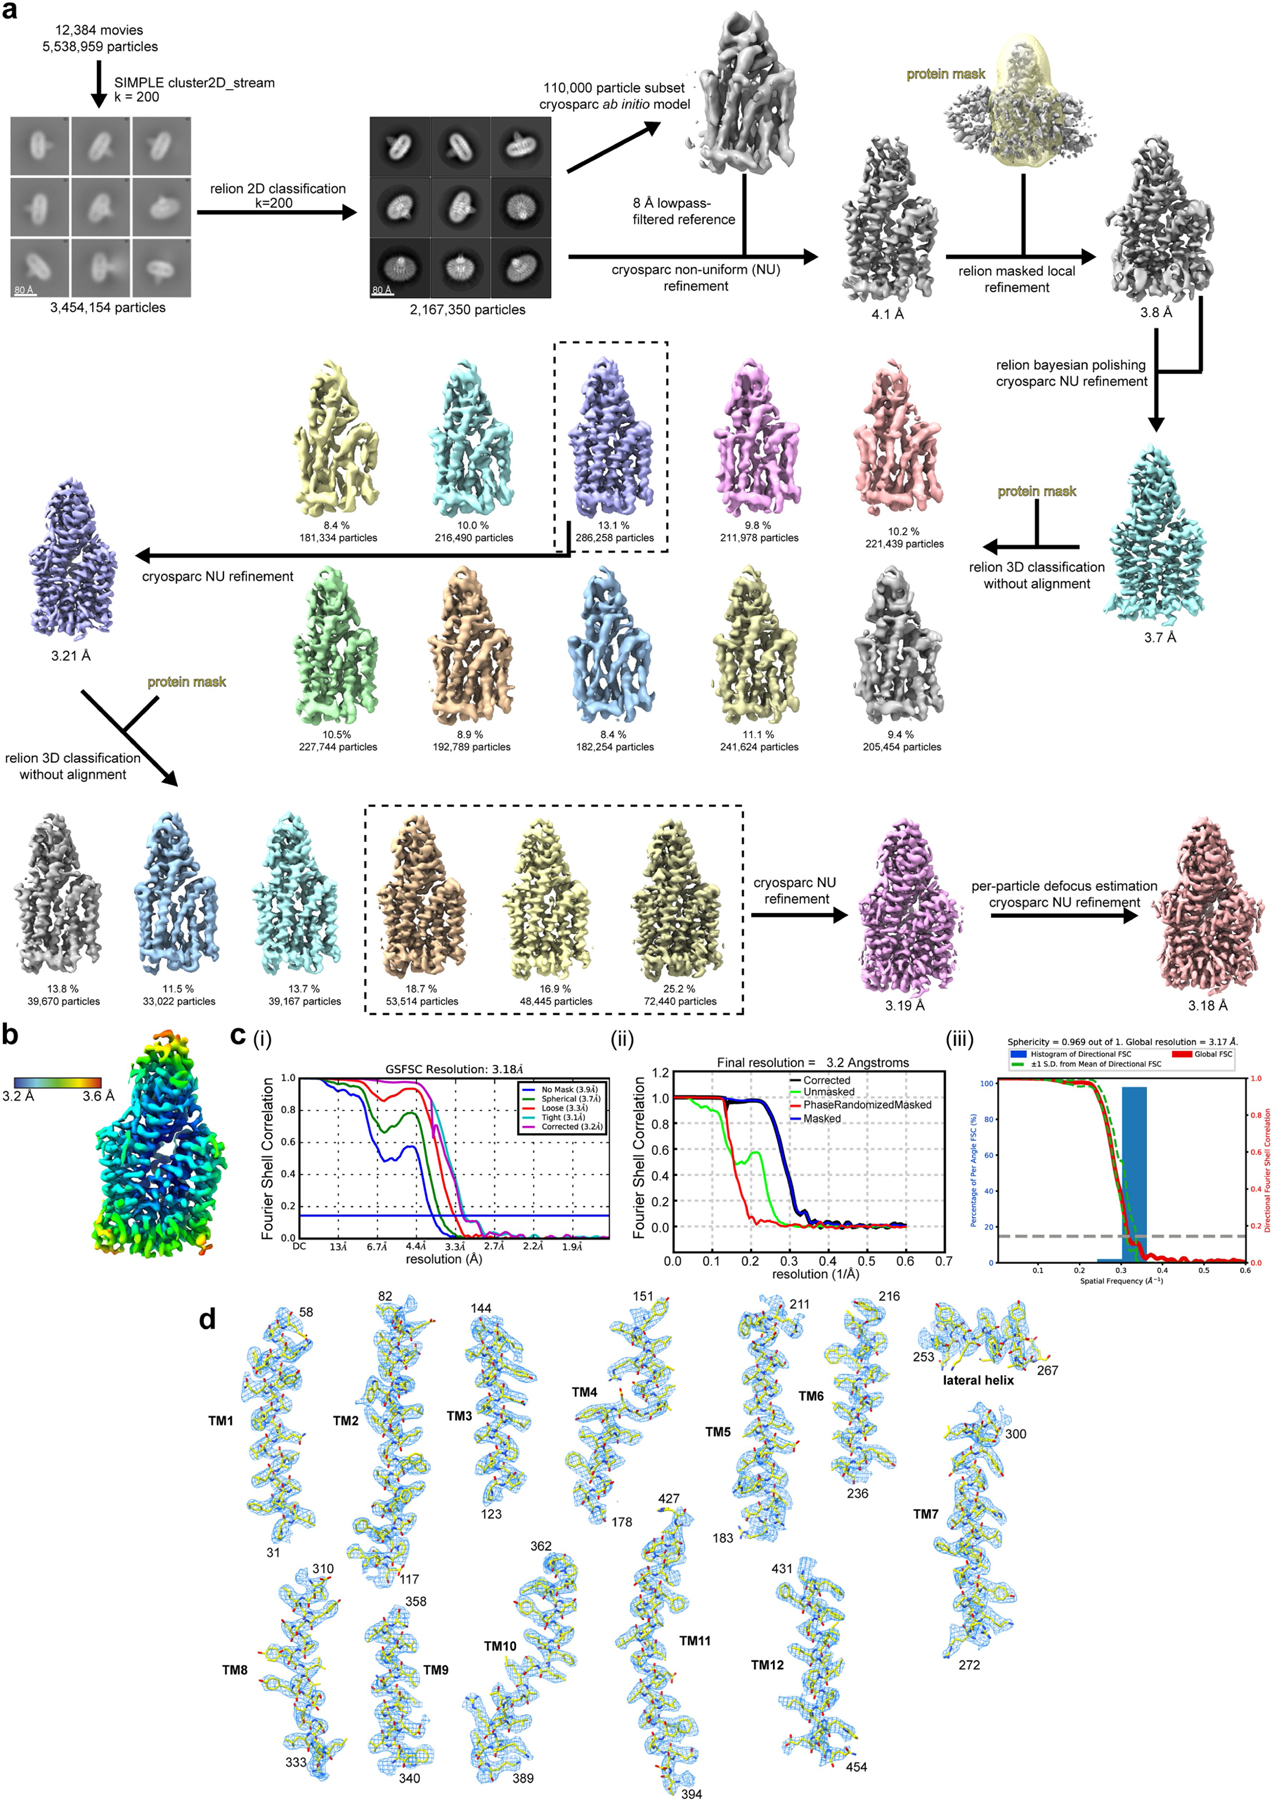
a, Image processing workflow for PCFT–nanobody. b, Local-resolution estimation of reconstructed map as determined within RELION. Detergent density omitted for clarity. c, Gold-standard FSC curves used for global-resolution estimates within (i) cryoSPARC, (ii) RELION, or (iii) 3DFSC. d, Close-up view of map and side-chain density for transmembrane helices and lateral helix. Volume contoured at threshold level of 0.805.
Extended Data Fig. 4 |. Analysis of PCFT–pemetrexed complex.
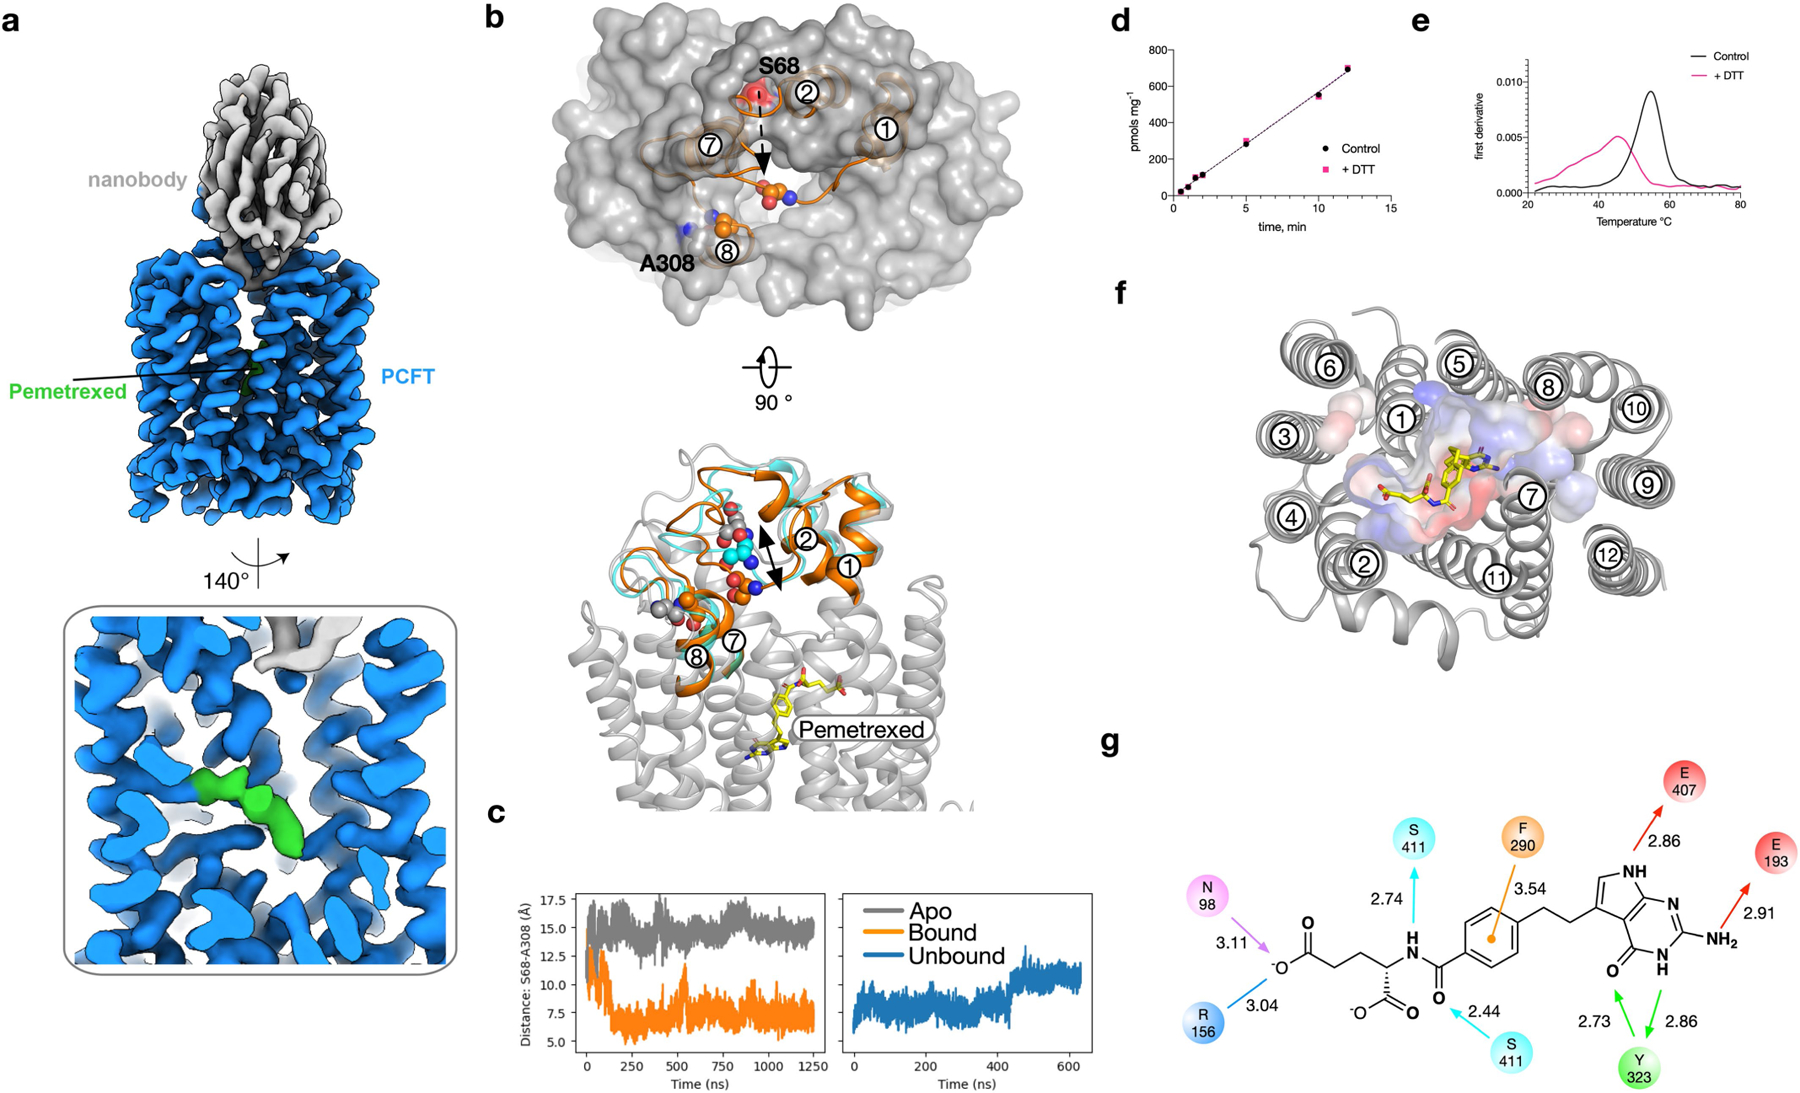
a, Cryo-EM density of PCFT in complex with pemetrexed and nanobody. b, In molecular dynamics simulations of the apo structure (grey), the TM1–TM2 loop is positioned such that the entrance to the binding pocket is accessible. In simulations with pemetrexed bound (orange), the loop closes quickly (within 250 ns) as measured by the relative position of Ser68 on the TM1–TM2 loop and Ala308 on the TM7–TM8 loop. c, Time course of the distance between the Cα atoms of Ser68 and Ala308 for both apo (grey) and pemetrexed-bound (orange) simulations. The closure event observed with pemetrexed bound occurs around 250 ns, and this closed conformation remains stable for the remainder of the simulation. On removal of pemetrexed from the end of the simulation shown in this panel (orange), the TM1–TM2 moves away from the TM7–TM8 loop (blue). The movement is shown in b (cyan). d, The presence of 2 mM DTT does not alter the uptake of folic acid into liposomes by PCFT, consistent with previous studies on the human transporter35. e, The presence of 2 mM DTT does lead to a destabilization of the protein as determined by differential scanning fluorimetry. f, View of pemetrexed within the binding cavity, with surface charge highlighted. g, Schematic of the binding pose observed for pemetrexed. Hydrogen-bond donors and acceptors are highlighted by directional arrows, the sole charge–charge interaction by a solid line and the π–π interaction in orange. Values indicate distance in Å.
Extended Data Fig. 5 |. Structural relationship between the observed water pocket and the gating helices in PCFT.
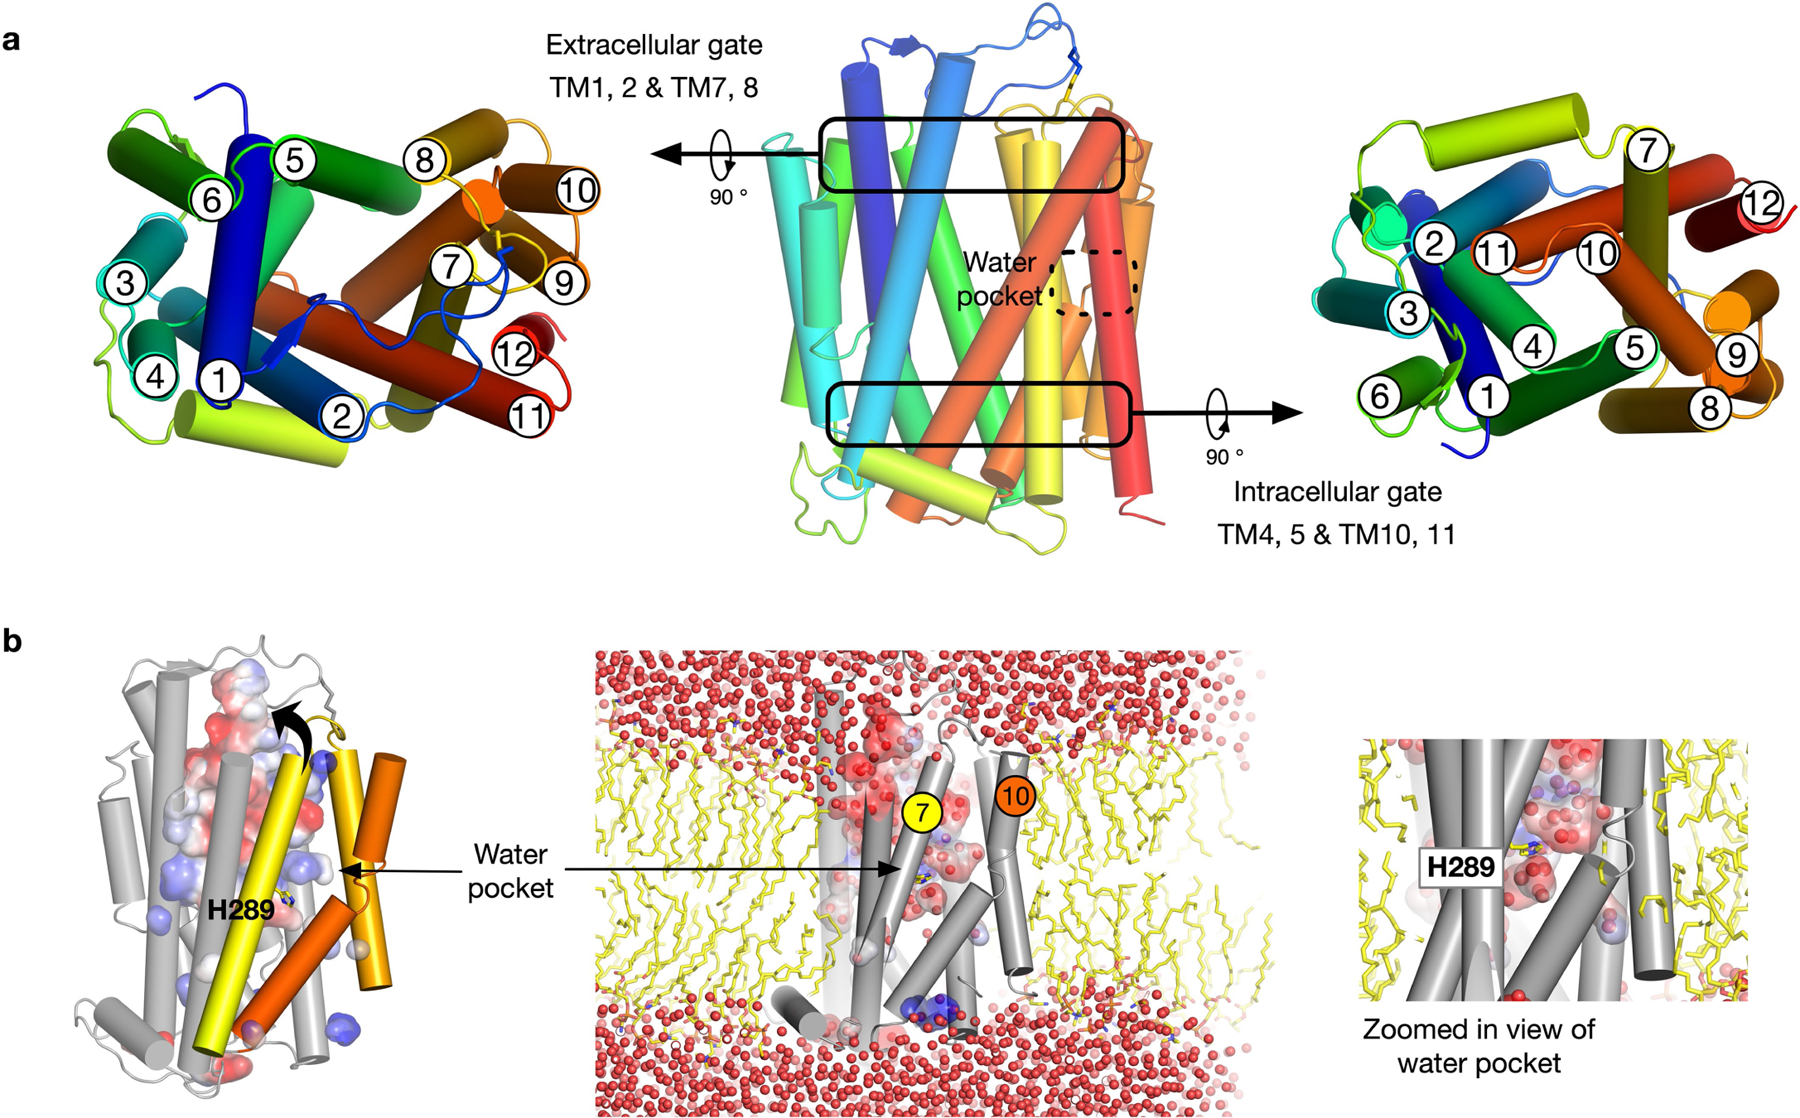
a, Cartoon of PCFT, showing the open and closed states of the extracellular and intracellular gates, respectively. b, Molecular dynamic simulations demonstrate the water pocket is both stable and accessible to bulk solvent via the substrate-binding cavity. The space occupied by the polar pocket results in fewer interactions between TM7 and TM10, which is likely to facilitate the movement of the helices against one another during transport.
Extended Data Fig. 6 |. Cryo-EM processing workflow, showing local and global map quality for the PCFT–nanobody complex bound to pemetrexed.
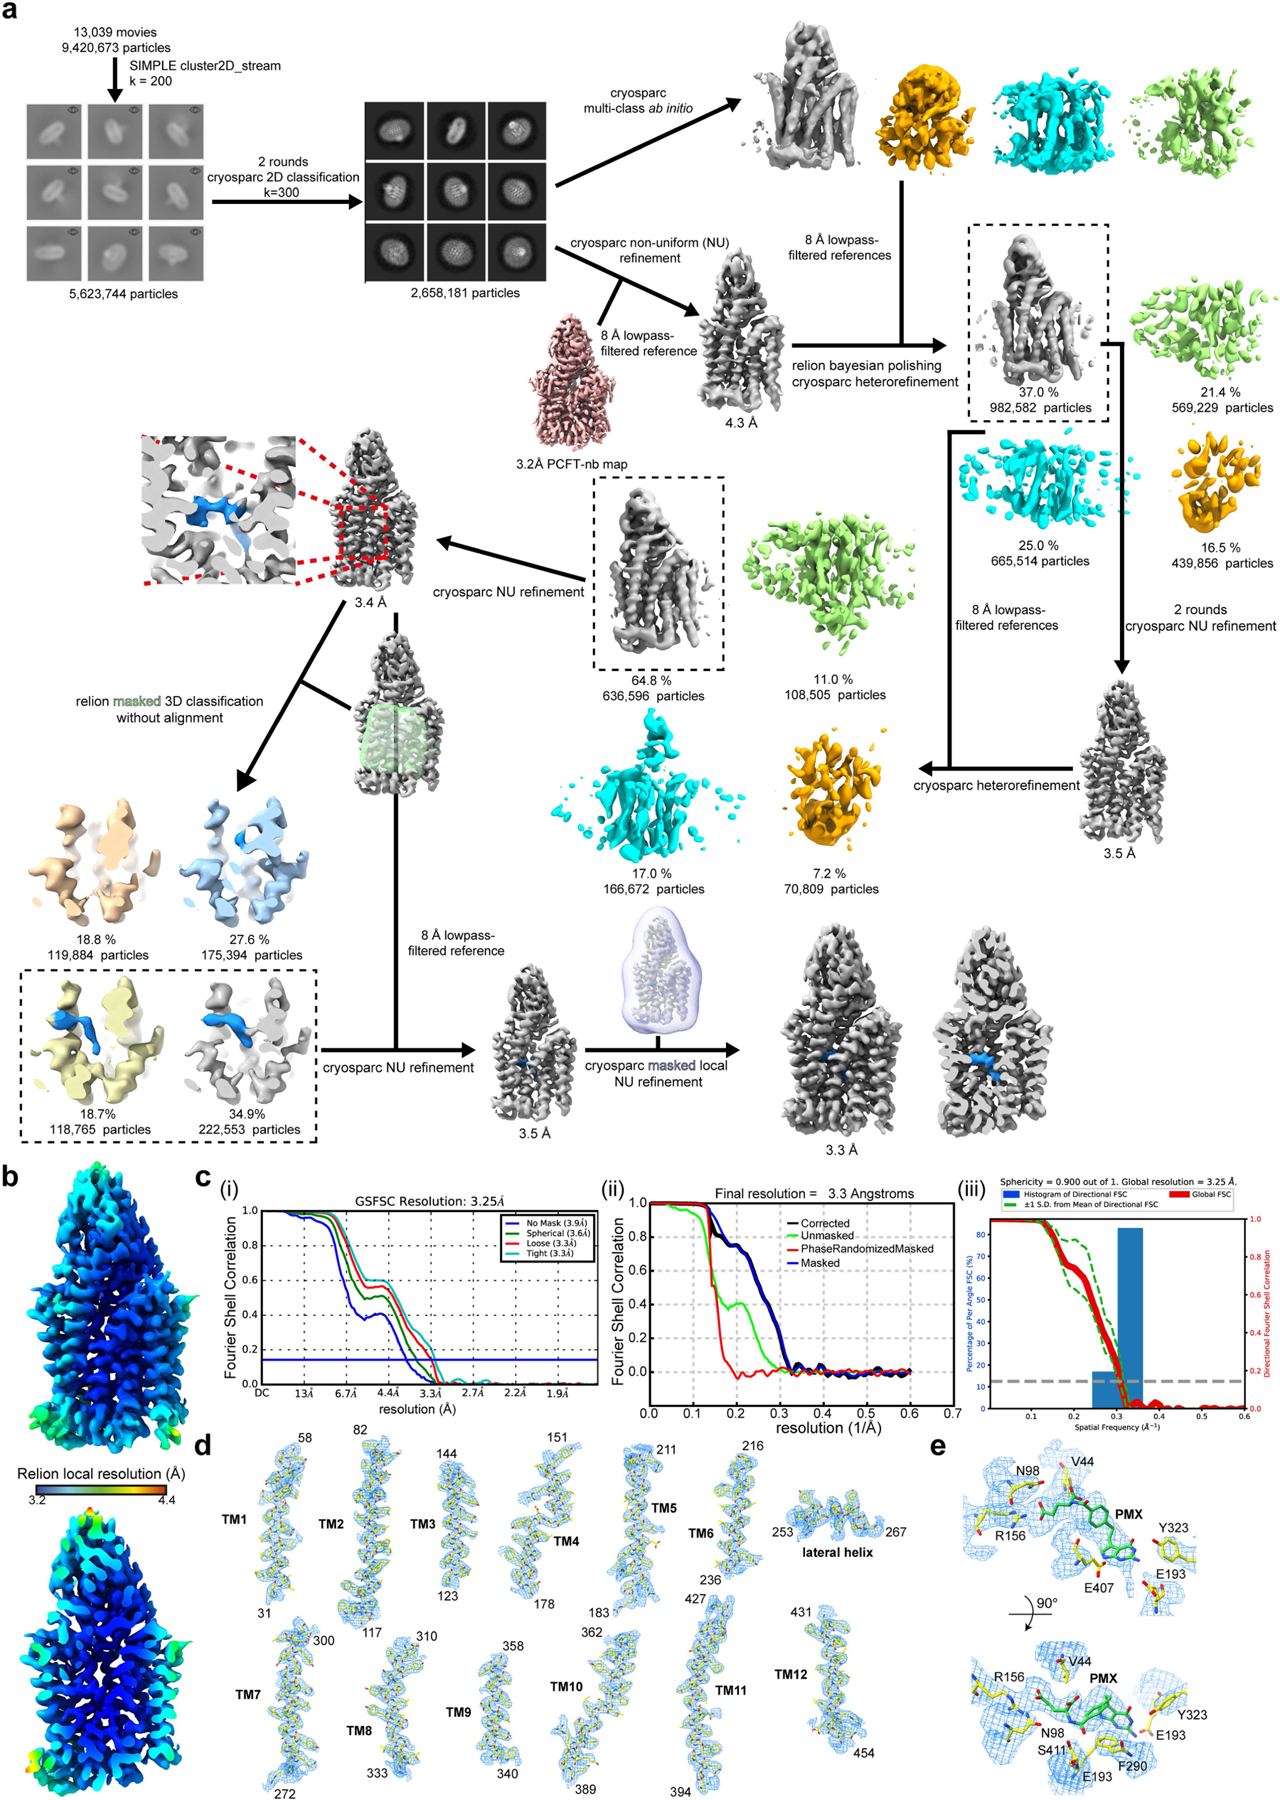
a, Image processing workflow for pemetrexed-bound PCFT–nanobody. b, Local-resolution estimation of reconstructed map as determined within RELION. Detergent density omitted for clarity. Top, full map; bottom, central slab through map. c, Gold-standard FSC curves used for global resolution estimates within (i) cryoSPARC, (ii) RELION or (iii) 3DFSC. d, Close-up of side-chain density for all transmembrane helices. Volume contoured at threshold level of 0.3. e, Density for pemetrexed (PMX) and side chains surrounding PCFT. Volume contoured at threshold level of 0.4.
Extended Data Fig. 7 |. The effect of Glu407Asn on apo and pemetrexed-bound PCFT and hereditary folate malabsorption mutations in the context of the chicken PCFT structure.
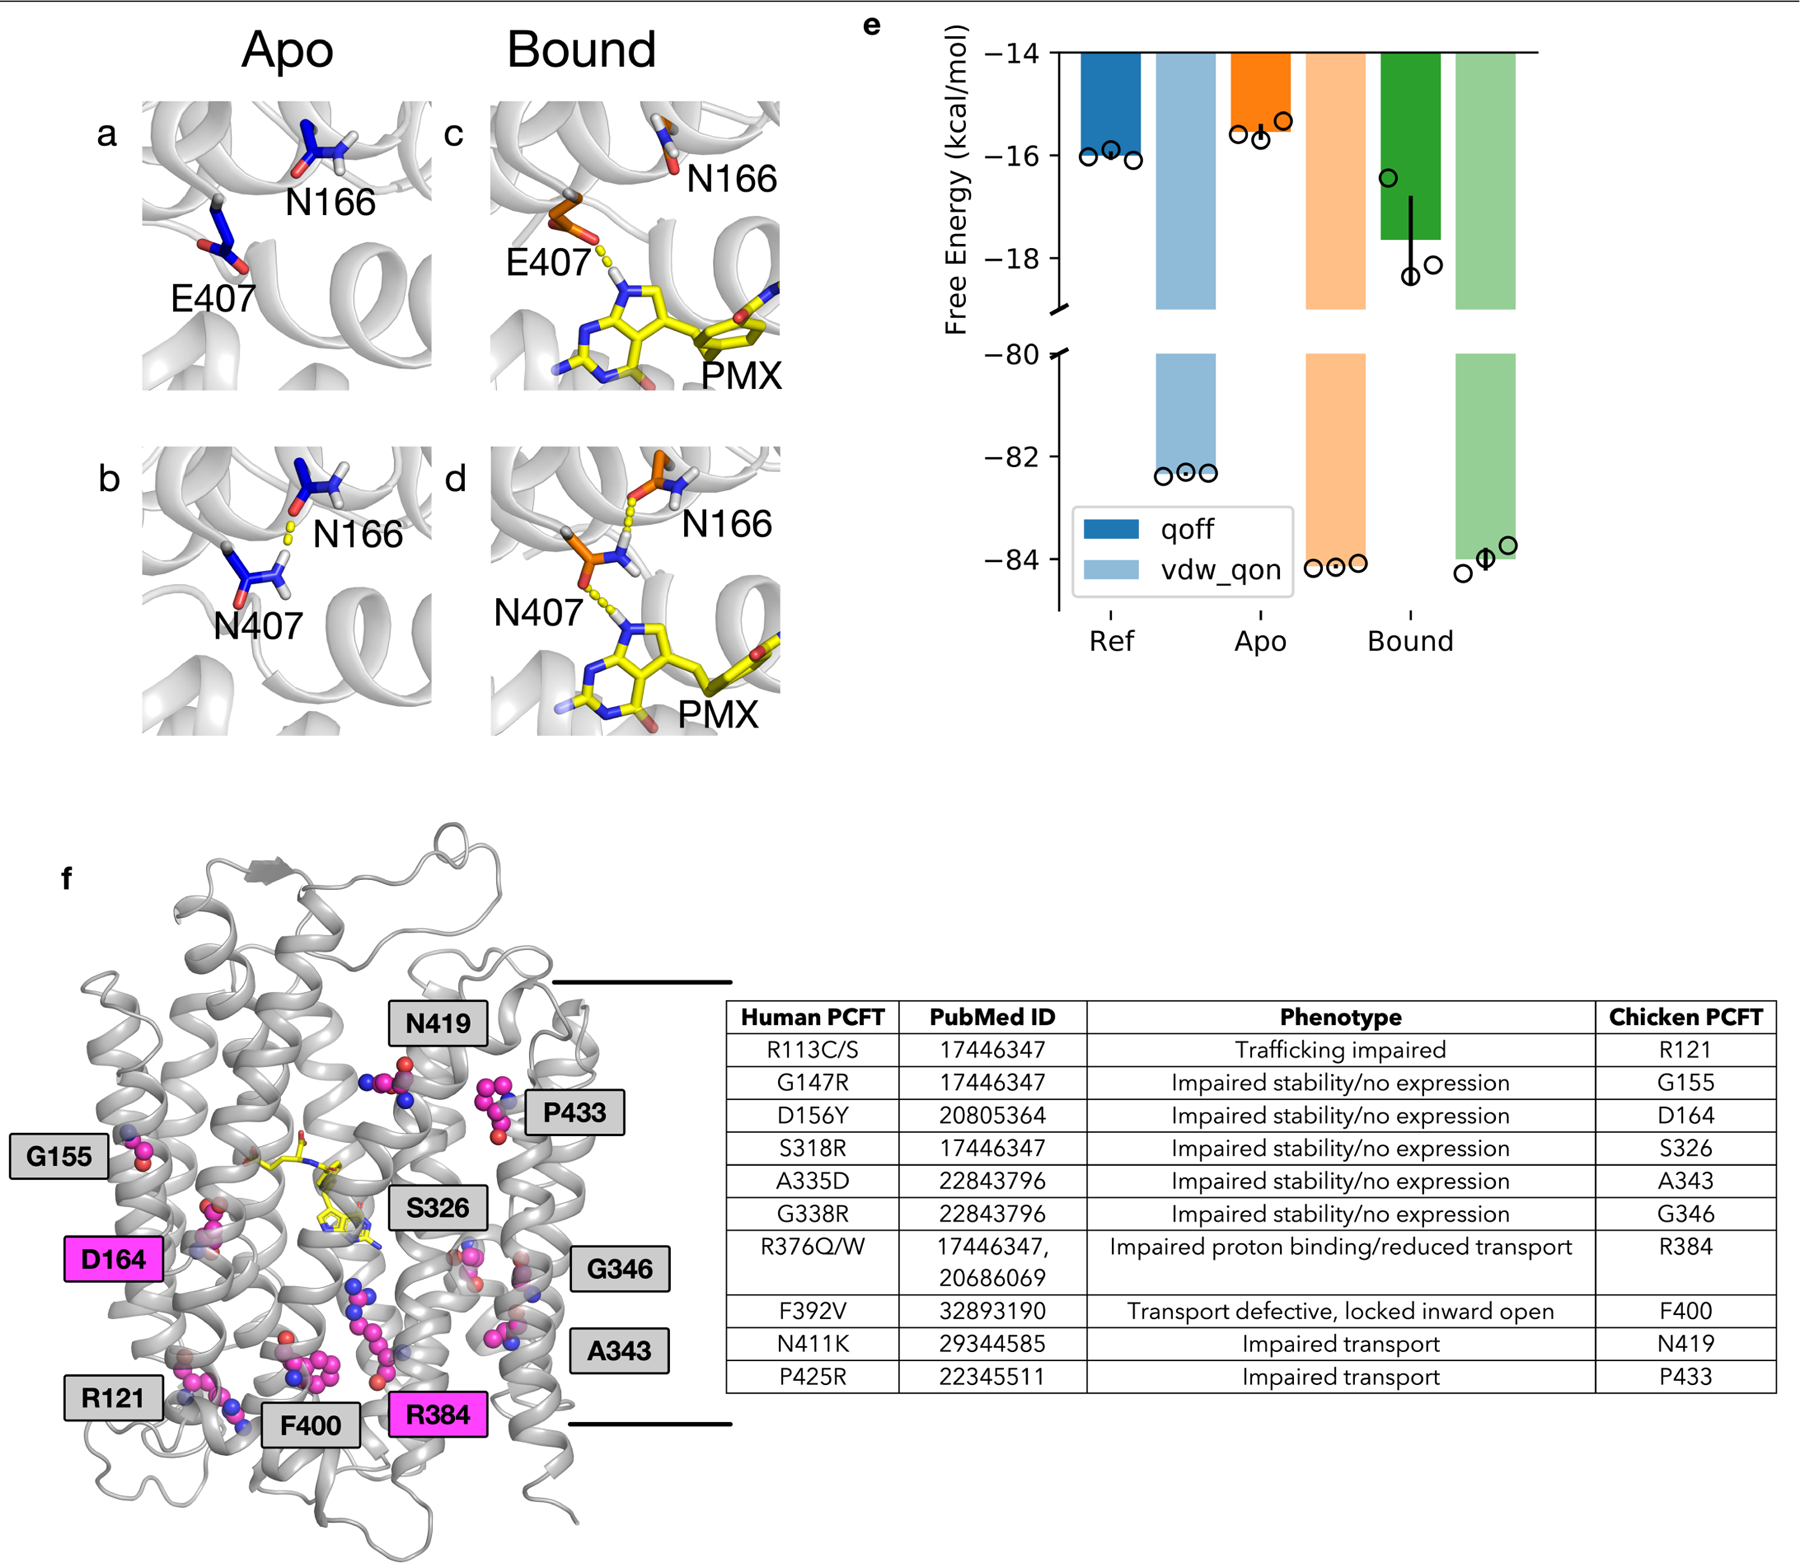
a–e, Alchemical transformations show that a Glu407Asn mutation would stabilize the protein by forming hydrogen bonds with Asn166, while remaining capable of preserving the interaction with the pyrrole amine of pemetrexed. a, In the wild-type apo state Glu407 does not interact with Asn166. The Glu407Asn variant, however, can readily hydrogen-bond with Asn166 (b), resulting in the Glu407Asn variant being 1.5 kcal mol−1 more stable (e) (blue). In the pemetrexed-bound state, Glu407 makes a hydrogen bond with the pyrrole amine group of pemetrexed (PMX) (c), which is also preserved in the Glu407Asn variant (d). The coordinated hydrogen-bond network among Asn166, Glu407Asn and pemetrexed further stabilizes the protein-bound state by 2 kcal mol−1 compared to the apo state (e) (orange). n = 3 independent repeats with mean and s.d. plotted. f, Cartoon of chicken PCFT structure with residues involved in hereditary folate malabsorption shown as spheres. Asp164 (Asp156) and Arg384 (Arg376) are highlighted as these residues have an important role in the transport mechanism. The table shows the corresponding human residue number and the associated phenotype. PubMed identifiers for the respective studies that describe mutations associated with hereditary folate malabsorption are included.
Extended Data Fig. 8 |. Analysis of residues involved in proton binding in PCFT.
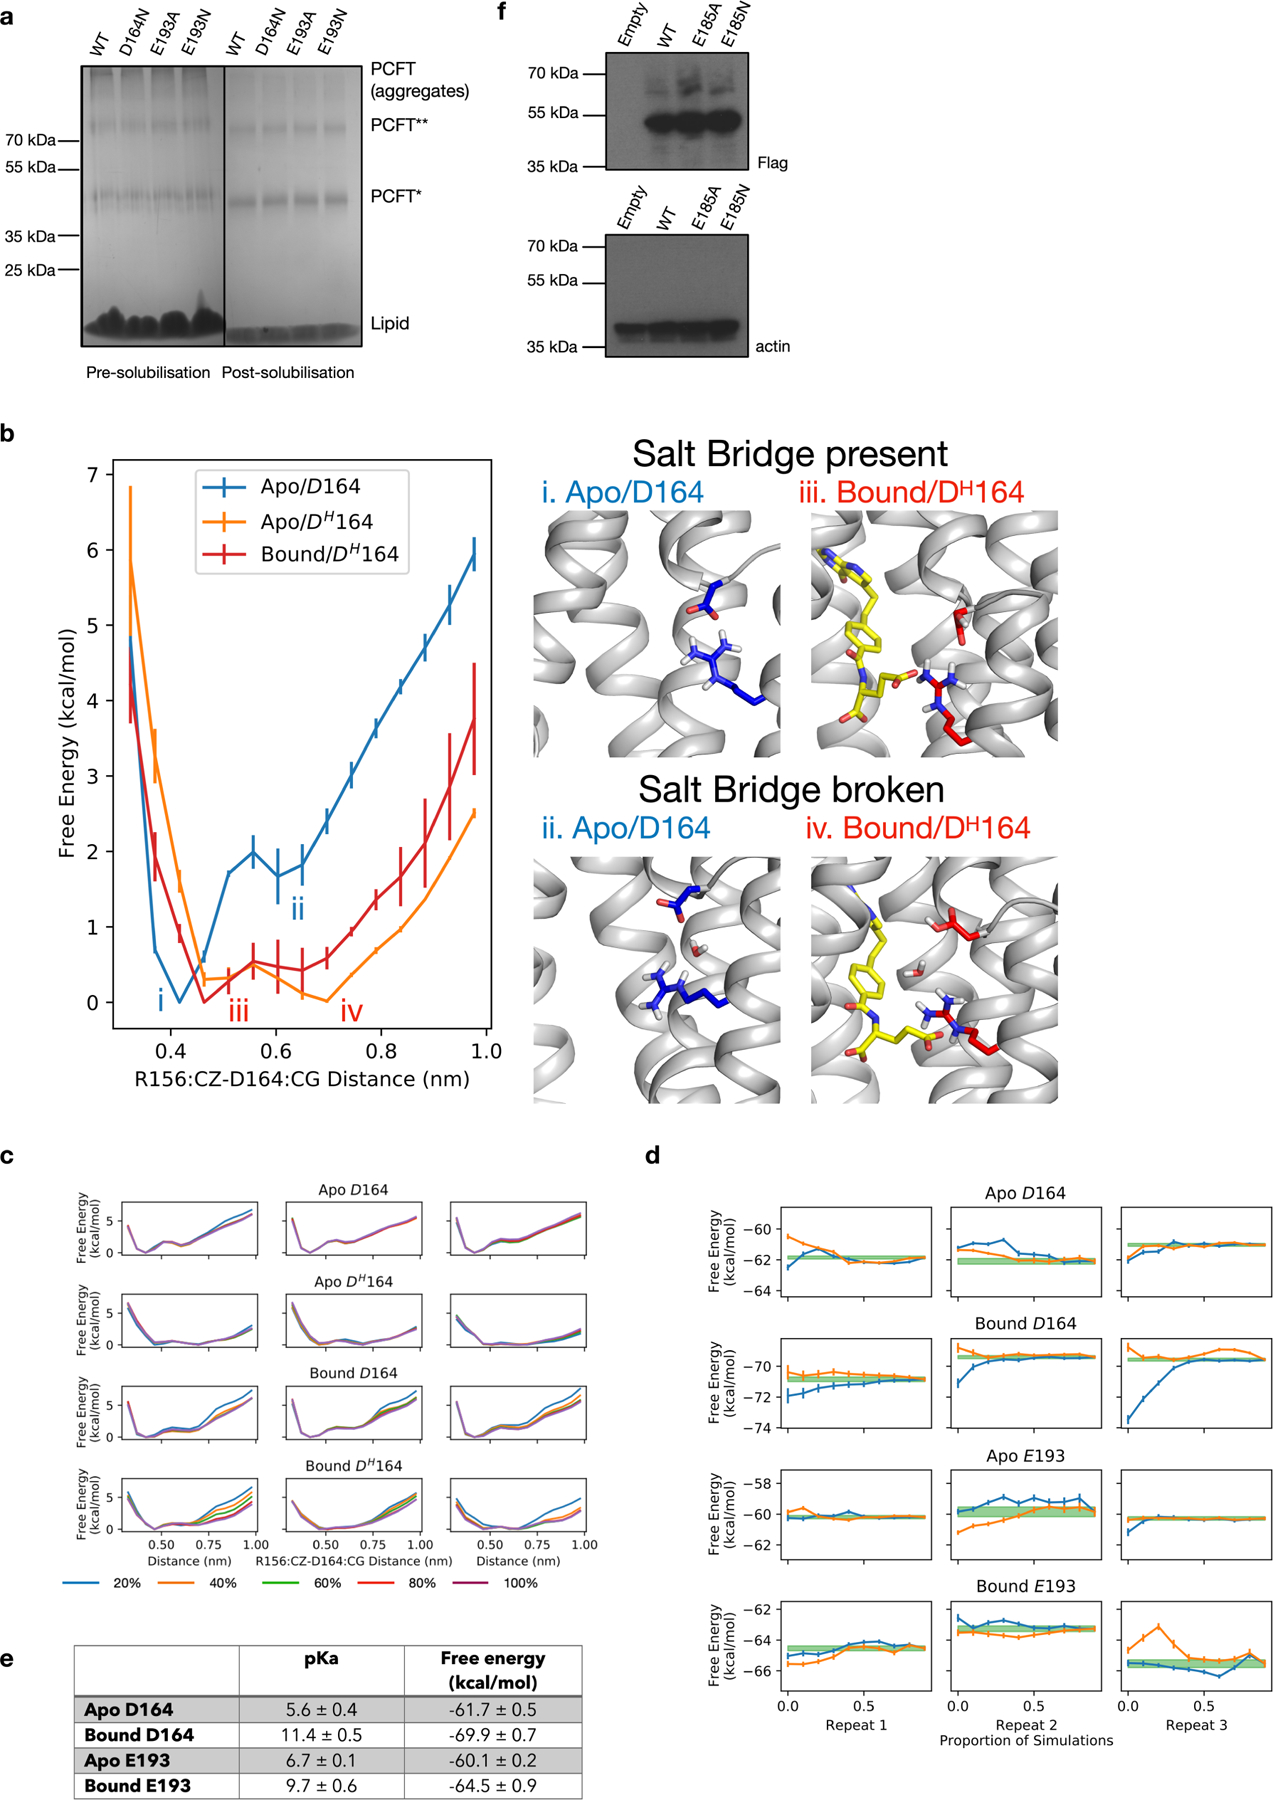
a, Analysis of wild type and variants of chicken PCFT studied in liposome assays. SDS–PAGE gel showing pre- and post-solubilization of proteoliposomes with 1% DDM:CHS. A proportion of purified PCFT is not folded correctly in the liposome and runs as aggregates on the pre-solubilized samples in the SDS–PAGE gel. Experiments were repeated three times with similar results. b, Protonation of D164 results in easier breakage of the salt bridge interaction to R156. There is a free energy barrier of 2 kcal mol−1 associated with the breakage of the R156–D164 salt bridge in the apo state (i and ii). The protonation of the D164 (DH164) would lower this free energy barrier to a level lower than 0.5 kcal mol−1 (iii and iv) and thus bring it under the level of thermal fluctuation. The presence of pemetrexed does not affect this process. Rather, it controls the likelihood that D164 is protonated in the first place and thus effects the salt bridge stability indirectly. c, Convergence of the PMF profile shown in b. The PMF profile is computed for the first 20% (blue), 40% (orange), 60% (green), 80% (red) and 100% (purple) of the data. The columns are three repeats of the calculations. d, Convergence plots of the protonation free energy. The forward plot (orange lines) is the protonation free energy computed from the first 10% up to 100% of data, in 10% increments. The backward plot (blue lines) is the protonation free energy computed from the final 10% up to 100% of the data, in 10% increments. The columns are three repeats of the calculations. The green line is the final estimate of the free energy for each simulation and the width shows the uncertainty in the multistate Bennet acceptance ratio calculation. e, Table showing calculated pKa and free energy values (mean ± s.d.). f, Western blot analysis of the cell-based assay using an anti-Flag antibody for the PCFT variants and a loading control of anti-β-actin. Experiments were repeated twice with similar results.
Extended Data Fig. 9 |. Model for ligand-induced closure of the extracellular gate.
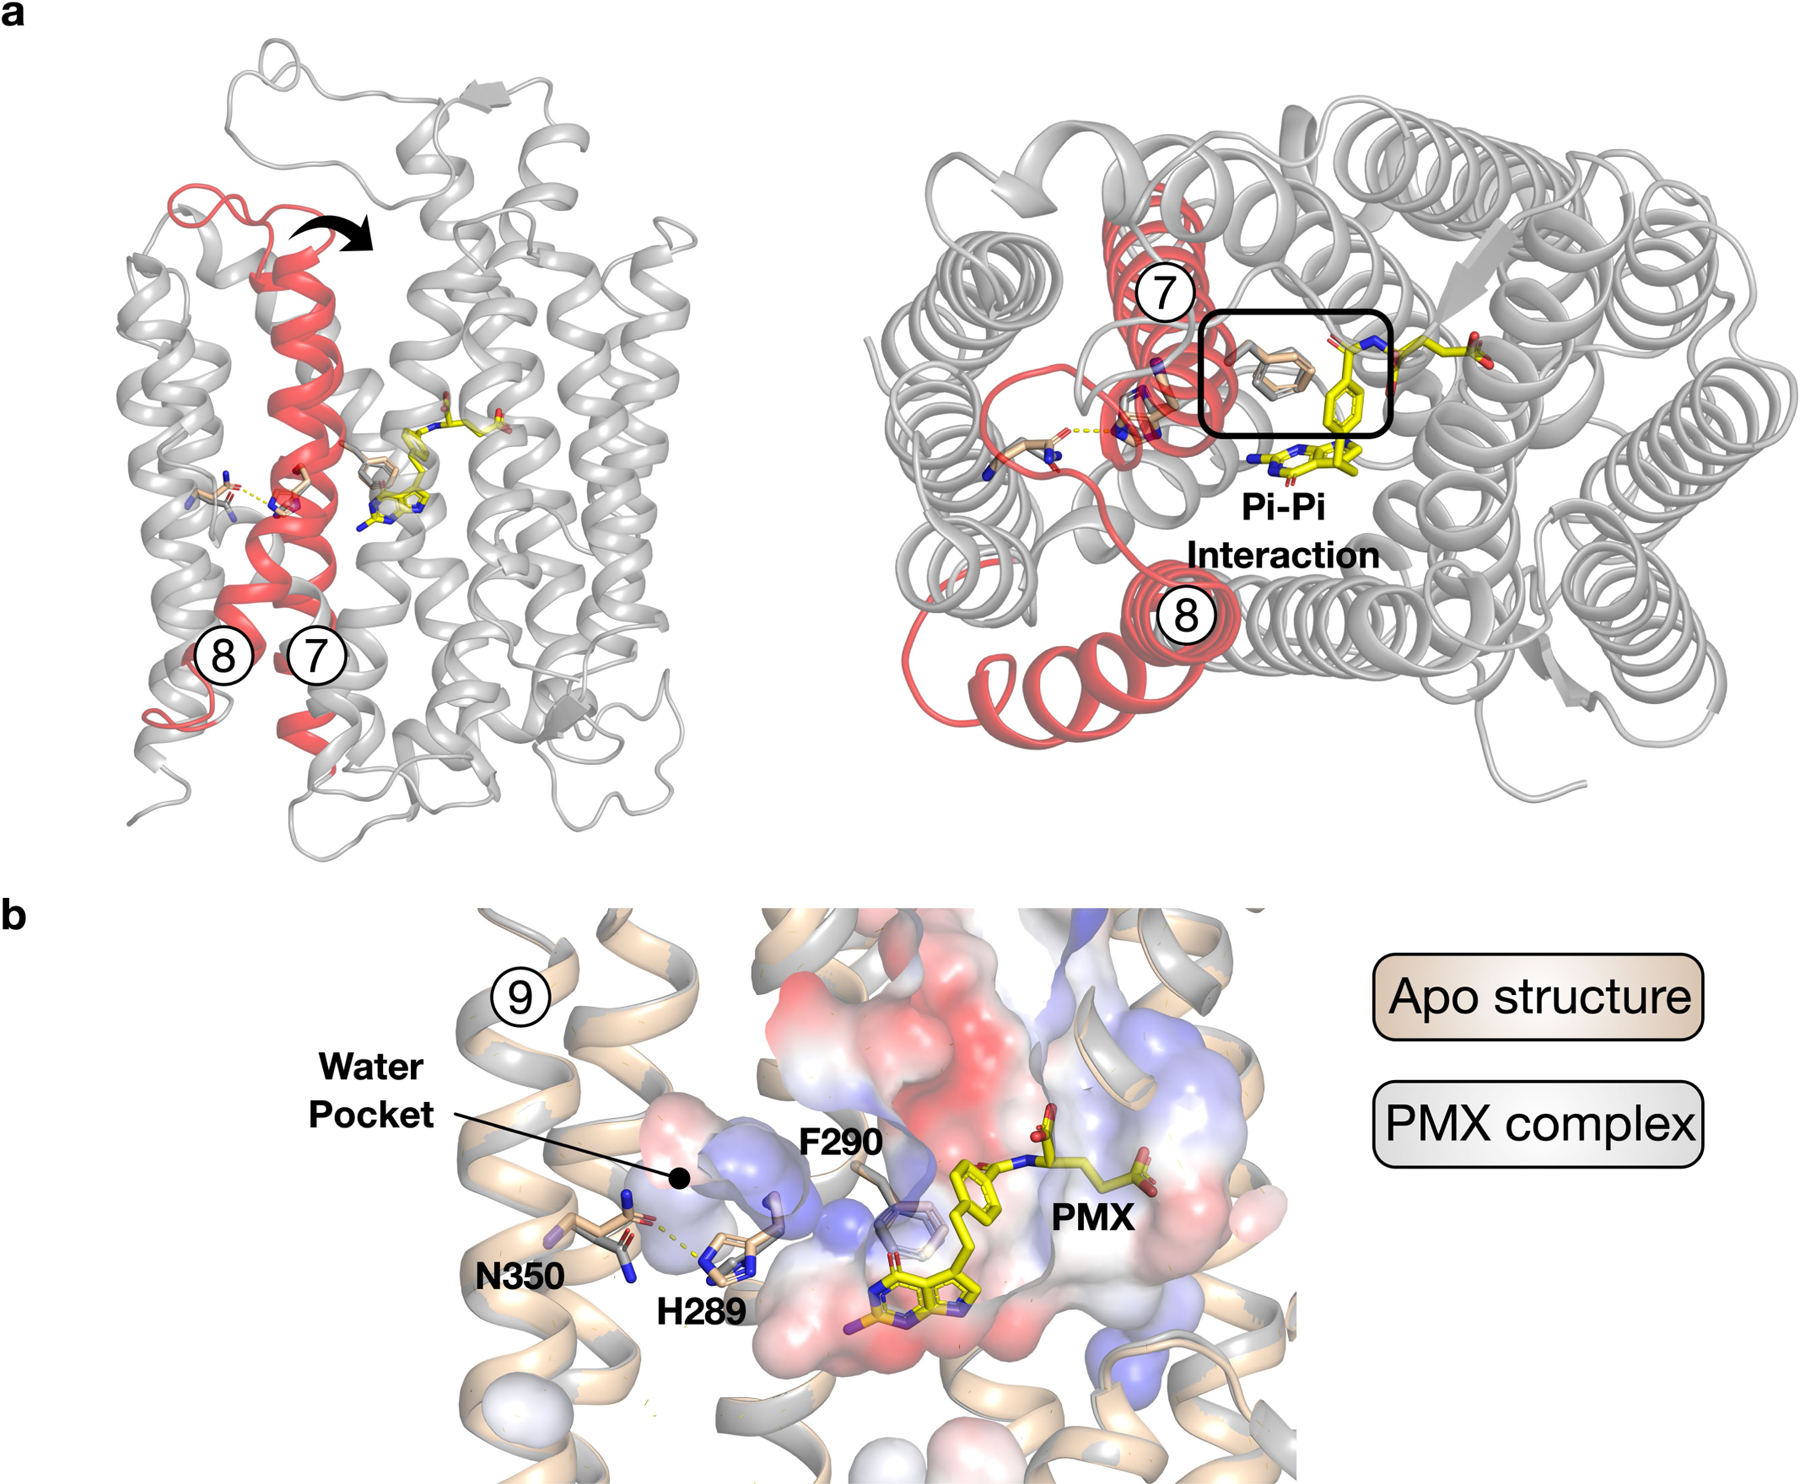
a, Structure of PCFT highlighting the extracellular gate helices, TM7 and TM8 (red) and their relationship to the bound pemetrexed molecule (yellow). The arrow indicates the movement required to seal the binding site from the extracellular side of the membrane. The interaction of Phe290 with the benzyl group of pemetrexed is likely to have an important role in triggering gate closure. b, Structural comparison between the apo and pemetrexed-bound states reveals repositioning of His289, resulting in the breakage of its interaction with Asn350 and facilitating the movement of TM7. The water pocket substantially enlarges in the pemetrexed-bound state, consistent with greater flexibility in the C-terminal bundle under acidic conditions.
Acknowledgements
The Central Oxford Structural Microscopy and Imaging Centre is support by the Wellcome Trust (201536), the EPA Cephalosporin Trust and a Royal Society/Wolfson Foundation Laboratory Refurbishment Grant (WL160052). Computing was supported via the Advanced Research Computing facility (Oxford), the ARCHER UK National Supercomputing Service and JADE (EP/P020275/1) granted via the High-End Computing Consortium for Biomolecular Simulation, (HECBioSim (http://www.hecbiosim.ac.uk)), supported by EPSRC (EP/L000253/1). This research was supported by Wellcome awards to S.M.L. (209194;100298), P.C.B. (219531) and S.N. (215519;219531) and through MRC grants to S.M.L. (MR/M011984/1) and J.L.P. (MR/S021043/1). Z.W. is a Wellcome Trust PhD student (203741). Figures were created using BioRender.com, PyMol and ChimeraX.
Footnotes
Online content
Any methods, additional references, Nature Research reporting summaries, source data, extended data, supplementary information, acknowledgements, peer review information; details of author contributions and competing interests; and statements of data and code availability are available at https://doi.org/10.1038/s41586-021-03579-z.
Reporting summary
Further information on research design is available in the Nature Research Reporting Summary linked to this paper.
Competing interests The authors declare no competing interests.
Additional information
Supplementary information The online version contains supplementary material available at https://doi.org/10.1038/s41586-021-03579-z.
Peer review information Nature thanks Larry H. Matherley, D. J. Slotboom and the other, anonymous, reviewer(s) for their contribution to the peer review of this work. Peer reviewer reports are available.
Data availability
The plasmid encoding the chicken PCFT transporter cloned into the pDDGFP-LEU2d expression vector is available from Addgene (165414). The plasmid encoding the nanobody used in this study is available from Addgene (165415). Coordinates for the structures have been deposited in the Protein Data Bank under accession codes PDB 7BC6 (PCFT–nanobody) and 7BC7 (PCFT–nanobody + pemetrexed). The electron microscopy volumes have been deposited in the Electron Microscopy Data Bank under accession codes EMD-12140 (PCFT–nanobody) and EMD-12141 (PCFT–nanobody + pemetrexed). Any other relevant data are available from the corresponding authors upon reasonable request.
References
- 1.Zheng Y & Cantley LC Toward a better understanding of folate metabolism in health and disease. J. Exp. Med 216, 253–266 (2019). [DOI] [PMC free article] [PubMed] [Google Scholar]
- 2.Ducker GS & Rabinowitz JD One-carbon metabolism in health and disease. Cell Metab 25, 27–42 (2017). [DOI] [PMC free article] [PubMed] [Google Scholar]
- 3.Zhao R, Matherly LH & Goldman ID Membrane transporters and folate homeostasis: intestinal absorption and transport into systemic compartments and tissues. Expert Rev. Mol. Med 11, e4 (2009). [DOI] [PMC free article] [PubMed] [Google Scholar]
- 4.Zhao R, Aluri S & Goldman ID The proton-coupled folate transporter (PCFT-SLC46A1) and the syndrome of systemic and cerebral folate deficiency of infancy: Hereditary folate malabsorption. Mol. Aspects Med 53, 57–72 (2017). [DOI] [PMC free article] [PubMed] [Google Scholar]
- 5.Lucock M Folic acid: nutritional biochemistry, molecular biology, and role in disease processes. Mol. Genet. Metab 71, 121–138 (2000). [DOI] [PubMed] [Google Scholar]
- 6.Zhao R & Goldman ID Folate and thiamine transporters mediated by facilitative carriers (SLC19A1–3 and SLC46A1) and folate receptors. Mol. Aspects Med 34, 373–385 (2013). [DOI] [PMC free article] [PubMed] [Google Scholar]
- 7.Qiu A et al. Identification of an intestinal folate transporter and the molecular basis for hereditary folate malabsorption. Cell 127, 917–928 (2006). [DOI] [PubMed] [Google Scholar]
- 8.Goldman ID, Chattopadhyay S, Zhao R & Moran R The antifolates: evolution, new agents in the clinic, and how targeting delivery via specific membrane transporters is driving the development of a next generation of folate analogs. Curr. Opin. Investig. Drugs 11, 1409–1423 (2010). [PubMed] [Google Scholar]
- 9.Matherly LH, Hou Z & Gangjee A The promise and challenges of exploiting the proton-coupled folate transporter for selective therapeutic targeting of cancer. Cancer Chemother. Pharmacol 81, 1–15 (2018). [DOI] [PMC free article] [PubMed] [Google Scholar]
- 10.Zhao R et al. The proton-coupled folate transporter: impact on pemetrexed transport and on antifolates activities compared with the reduced folate carrier. Mol. Pharmacol 74, 854–862 (2008). [DOI] [PMC free article] [PubMed] [Google Scholar]
- 11.Bailey LB Folate in Health and Disease, 2nd edn (Taylor & Francis, 2010). [Google Scholar]
- 12.Crider KS, Bailey LB & Berry RJ Folic acid food fortification-its history, effect, concerns, and future directions. Nutrients 3, 370–384 (2011). [DOI] [PMC free article] [PubMed] [Google Scholar]
- 13.Visentin M, Diop-Bove N, Zhao R & Goldman ID The intestinal absorption of folates. Annu. Rev. Physiol 76, 251–274 (2014). [DOI] [PMC free article] [PubMed] [Google Scholar]
- 14.Kamen BA & Smith AK A review of folate receptor alpha cycling and 5-methyltetrahydrofolate accumulation with an emphasis on cell models in vitro. Adv. Drug Deliv. Rev 56, 1085–1097 (2004). [DOI] [PubMed] [Google Scholar]
- 15.Zhao R et al. A role for the proton-coupled folate transporter (PCFT-SLC46A1) in folate receptor-mediated endocytosis. J. Biol. Chem 284, 4267–4274 (2009). [DOI] [PMC free article] [PubMed] [Google Scholar]
- 16.Matherly LH, Wilson MR & Hou Z The major facilitative folate transporters solute carrier 19A1 and solute carrier 46A1: biology and role in antifolate chemotherapy of cancer. Drug Metab. Dispos 42, 632–649 (2014). [DOI] [PMC free article] [PubMed] [Google Scholar]
- 17.Qiu A et al. Rodent intestinal folate transporters (SLC46A1): secondary structure, functional properties, and response to dietary folate restriction. Am. J. Physiol. Cell Physiol 293, C1669–C1678 (2007). [DOI] [PubMed] [Google Scholar]
- 18.Kronn D & Goldman ID in GeneReviews (eds Adam MP . et al.) https://www.ncbi.nlm.nih.gov/books/NBK1673/ (1993). [Google Scholar]
- 19.Furst DE The rational use of methotrexate in rheumatoid arthritis and other rheumatic diseases. Br. J. Rheumatol 36, 1196–1204 (1997). [DOI] [PubMed] [Google Scholar]
- 20.Giovannetti E et al. Role of proton-coupled folate transporter in pemetrexed resistance of mesothelioma: clinical evidence and new pharmacological tools. Ann. Oncol 28, 2725–2732 (2017). [DOI] [PMC free article] [PubMed] [Google Scholar]
- 21.Chattopadhyay S, Moran RG & Goldman ID Pemetrexed: biochemical and cellular pharmacology, mechanisms, and clinical applications. Mol. Cancer Ther 6, 404–417 (2007). [DOI] [PubMed] [Google Scholar]
- 22.Pascale RM, Calvisi DF, Simile MM, Feo CF & Feo F The Warburg effect 97 years after its discovery. Cancers 12, E2819 (2020). [DOI] [PMC free article] [PubMed] [Google Scholar]
- 23.Desmoulin SK, Hou Z, Gangjee A & Matherly LH The human proton-coupled folate transporter: biology and therapeutic applications to cancer. Cancer Biol. Ther 13, 1355–1373 (2012). [DOI] [PMC free article] [PubMed] [Google Scholar]
- 24.Drew D & Boudker O Shared molecular mechanisms of membrane transporters. Annu. Rev. Biochem 85, 543–572 (2016). [DOI] [PubMed] [Google Scholar]
- 25.Huang Y, Lemieux MJ, Song J, Auer M & Wang D-N Structure and mechanism of the glycerol-3-phosphate transporter from Escherichia coli. Science 301, 616–620 (2003). [DOI] [PubMed] [Google Scholar]
- 26.Shin DS, Zhao R, Fiser A & Goldman ID Role of the fourth transmembrane domain in proton-coupled folate transporter function as assessed by the substituted cysteine accessibility method. Am. J. Physiol. Cell Physiol 304, C1159–C1167 (2013). [DOI] [PMC free article] [PubMed] [Google Scholar]
- 27.Chen LQ & Pagel MD Evaluating pH in the extracellular tumor microenvironment using CEST MRI and other imaging methods. Adv. Radiol 2015, 206405 (2015). [DOI] [PMC free article] [PubMed] [Google Scholar]
- 28.Mahadeo K et al. Properties of the Arg376 residue of the proton-coupled folate transporter (PCFT–SLC46A1) and a glutamine mutant causing hereditary folate malabsorption. Am, J. Physiol. Cell Physiol 299, C1153–C1161 (2010). [DOI] [PMC free article] [PubMed] [Google Scholar]
- 29.Shin DS et al. Functional roles of aspartate residues of the proton-coupled folate transporter (PCFT-SLC46A1); a D156Y mutation causing hereditary folate malabsorption. Blood 116, 5162–5169 (2010). [DOI] [PMC free article] [PubMed] [Google Scholar]
- 30.Unal ES, Zhao R & Goldman ID Role of the glutamate 185 residue in proton translocation mediated by the proton-coupled folate transporter SLC46A1. Am. J. Physiol. Cell Physiol 297, C66–C74 (2009). [DOI] [PMC free article] [PubMed] [Google Scholar]
- 31.Unal ES et al. The functional roles of the His247 and His281 residues in folate and proton translocation mediated by the human proton-coupled folate transporter SLC46A1. J. Biol. Chem 284, 17846–17857 (2009). [DOI] [PMC free article] [PubMed] [Google Scholar]
- 32.Desmoulin SK et al. Targeting the proton-coupled folate transporter for selective delivery of 6-substituted pyrrolo[2,3-d]pyrimidine antifolate inhibitors of de novo purine biosynthesis in the chemotherapy of solid tumors. Mol. Pharmacol 78, 577–587 (2010). [DOI] [PMC free article] [PubMed] [Google Scholar]
- 33.Wang L et al. Synthesis and antitumor activity of a novel series of 6-substituted pyrrolo[2,3-d]pyrimidine thienoyl antifolate inhibitors of purine biosynthesis with selectivity for high affinity folate receptors and the proton-coupled folate transporter over the reduced folate carrier for cellular entry. J. Med. Chem 53, 1306–1318 (2010). [DOI] [PMC free article] [PubMed] [Google Scholar]
- 34.Parker JL & Newstead S Method to increase the yield of eukaryotic membrane protein expression in Saccharomyces cerevisiae for structural and functional studies. Protein Sci 23, 1309–1314 (2014). [DOI] [PMC free article] [PubMed] [Google Scholar]
- 35.Diop-Bove NK, Wu J, Zhao R, Locker J & Goldman ID Hypermethylation of the human proton-coupled folate transporter (SLC46A1) minimal transcriptional regulatory region in an antifolate-resistant HeLa cell line. Mol. Cancer Ther 8, 2424–2431 (2009). [DOI] [PMC free article] [PubMed] [Google Scholar]
- 36.Zhao R, Gao F, Hanscom M & Goldman ID A prominent low-pH methotrexate transport activity in human solid tumors: contribution to the preservation of methotrexate pharmacologic activity in HeLa cells lacking the reduced folate carrier. Clin. Cancer Res 10, 718–727 (2004). [DOI] [PubMed] [Google Scholar]
- 37.Huo J et al. Neutralizing nanobodies bind SARS-CoV-2 spike RBD and block interaction with ACE2. Nat. Struct. Mol. Biol 27, 846–854 (2020). [DOI] [PubMed] [Google Scholar]
- 38.Pardon E et al. A general protocol for the generation of nanobodies for structural biology. Nat. Protocols 9, 674–693 (2014). [DOI] [PMC free article] [PubMed] [Google Scholar]
- 39.Caesar J et al. SIMPLE 3.0. Stream single-particle cryo-EM analysis in real time. J. Struct. Biol X 4, 100040 (2020). [DOI] [PMC free article] [PubMed] [Google Scholar]
- 40.Punjani A, Rubinstein JL, Fleet DJ & Brubaker MA cryoSPARC: algorithms for rapid unsupervised cryo-EM structure determination. Nat. Methods 14, 290–296 (2017). [DOI] [PubMed] [Google Scholar]
- 41.Zivanov J et al. New tools for automated high-resolution cryo-EM structure determination in RELION-3. eLife 7, e42166 (2018). [DOI] [PMC free article] [PubMed] [Google Scholar]
- 42.Asarnow D, Palovcak E & Cheng Y UCSF pyem v.0.5, 10.5281/zenodo.3576630 (2019). [DOI]
- 43.Tan YZ et al. Addressing preferred specimen orientation in single-particle cryo-EM through tilting. Nat. Methods 14, 793–796 (2017). [DOI] [PMC free article] [PubMed] [Google Scholar]
- 44.Brown A et al. Tools for macromolecular model building and refinement into electron cryo-microscopy reconstructions. Acta Crystallogr. D 71, 136–153 (2015). [DOI] [PMC free article] [PubMed] [Google Scholar]
- 45.Afonine PV et al. Real-space refinement in PHENIX for cryo-EM and crystallography. Acta Crystallogr. D 74, 531–544 (2018). [DOI] [PMC free article] [PubMed] [Google Scholar]
- 46.Emsley P Tools for ligand validation in Coot. Acta Crystallogr. D 73, 203–210 (2017). [DOI] [PMC free article] [PubMed] [Google Scholar]
- 47.Moriarty NW, Grosse-Kunstleve RW & Adams PD Electronic Ligand Builder and Optimization Workbench (eLBOW): a tool for ligand coordinate and restraint generation. Acta Crystallogr. D 65, 1074–1080 (2009). [DOI] [PMC free article] [PubMed] [Google Scholar]
- 48.Prisant MG, Williams CJ, Chen VB, Richardson JS & Richardson DC New tools in MolProbity validation: CaBLAM for cryoEM backbone, UnDowser to rethink “waters,” and NGL viewer to recapture online 3D graphics. Protein Sci 29, 315–329 (2020). [DOI] [PMC free article] [PubMed] [Google Scholar]
- 49.Pettersen EF et al. UCSF ChimeraX: structure visualization for researchers, educators, and developers. Protein Sci 30, 70–82 (2021). [DOI] [PMC free article] [PubMed] [Google Scholar]
- 50.Marrink SJ, Risselada HJ, Yefimov S, Tieleman DP & de Vries AH The MARTINI force field: coarse grained model for biomolecular simulations. J. Phys. Chem. B 111, 7812–7824 (2007). [DOI] [PubMed] [Google Scholar]
- 51.Wu Z, Alibay I, Newstead S & Biggin PC Proton control of transitions in an amino acid transporter. Biophys. J 117, 1342–1351 (2019). [DOI] [PMC free article] [PubMed] [Google Scholar]
- 52.Vickery O & Corey R owenvickery/cg2at: CG2AT2 a fragment based conversion version 0.2, 10.5281/zenodo.3994618 (2020). [DOI]
- 53.Maier JA et al. ff14SB: improving the accuracy of protein side chain and backbone parameters from ff99SB. J. Chem. Theory Comput 11, 3696–3713 (2015). [DOI] [PMC free article] [PubMed] [Google Scholar]
- 54.Jämbeck JPM & Lyubartsev AP An extension and further validation of an all-atomistic force field for biological membranes. J. Chem. Theory Comput 8, 2938–2948 (2012). [DOI] [PubMed] [Google Scholar]
- 55.Petrova J et al. Molecular simulation of the structure of folate and antifolates at physiological conditions. J. Mol. Graph. Model 87, 172–184 (2019). [DOI] [PubMed] [Google Scholar]
- 56.Wang J, Wolf RM, Caldwell JW, Kollman PA & Case DA Development and testing of a general amber force field. J. Comput. Chem 25, 1157–1174 (2004). [DOI] [PubMed] [Google Scholar]
- 57.Bayly CI, Cieplak P, Cornell W & Kollman PA A well-behaved electrostatic potential based method using charge restraints for deriving atomic charges: the RESP model. J. Phys. Chem 97, 10269–10280 (1993). [Google Scholar]
- 58.Jorgensen WL, Chandrasekhar J, Madura JD, Impey RW & Klein ML Comparison of simple potential functions for simulating liquid water. J. Chem. Phys 79, 926–935 (1983). [Google Scholar]
- 59.Abraham MJ et al. GROMACS: high performance molecular simulations through multi-level parallelism from laptops to supercomputers. SoftwareX 1–2, 19–25 (2015).
- 60.Bussi G, Donadio D & Parrinello M Canonical sampling through velocity rescaling. J. Chem. Phys 126, 014101 (2007). [DOI] [PubMed] [Google Scholar]
- 61.Berendsen HJ, Postma JPM, van Gunsteren WF, DiNola A & Haak JR Molecular dynamics with coupling to an external bath. J. Chem. Phys 81, 3684–3690 (1984). [Google Scholar]
- 62.Parrinello M & Rahman A Polymorphic transitions in single crystals: a new molecular dynamics method. J. Appl. Phys 52, 7182–7190 (1981). [Google Scholar]
- 63.Michaud-Agrawal N, Denning EJ, Woolf TB & Beckstein O MDAnalysis: a toolkit for the analysis of molecular dynamics simulations. J. Comput. Chem 32, 2319–2327 (2011). [DOI] [PMC free article] [PubMed] [Google Scholar]
- 64.Gapsys V, Michielssens S, Seeliger D & de Groot BL pmx: automated protein structure and topology generation for alchemical perturbations. J. Comput. Chem 36, 348–354 (2015). [DOI] [PMC free article] [PubMed] [Google Scholar]
- 65.Goga N, Rzepiela AJ, de Vries AH, Marrink SJ & Berendsen HJ Efficient algorithms for Langevin and DPD dynamics. J. Chem. Theory Comput 8, 3637–3649 (2012). [DOI] [PubMed] [Google Scholar]
- 66.Klimovich PV, Shirts MR & Mobley DL Guidelines for the analysis of free energy calculations. J. Comput. Aided Mol. Des 29, 397–411 (2015). [DOI] [PMC free article] [PubMed] [Google Scholar]
- 67.Wu Z Alchemicalitp: a Gromacs parser for alchemical transformation version 0.1, https://github.com/xiki-tempula/alchemicalitp (2020).
- 68.The PLUMED consortium. Promoting transparency and reproducibility in enhanced molecular simulations. Nat. Methods 16, 670–673 (2019). [DOI] [PubMed] [Google Scholar]
- 69.Grossfield A WHAM: the weighted histogram analysis method version 2.0.10.2, http://membrane.urmc.rochester.edu/wordpress/?page_id=126 (accessed 2020).
Associated Data
This section collects any data citations, data availability statements, or supplementary materials included in this article.
Supplementary Materials
Data Availability Statement
The plasmid encoding the chicken PCFT transporter cloned into the pDDGFP-LEU2d expression vector is available from Addgene (165414). The plasmid encoding the nanobody used in this study is available from Addgene (165415). Coordinates for the structures have been deposited in the Protein Data Bank under accession codes PDB 7BC6 (PCFT–nanobody) and 7BC7 (PCFT–nanobody + pemetrexed). The electron microscopy volumes have been deposited in the Electron Microscopy Data Bank under accession codes EMD-12140 (PCFT–nanobody) and EMD-12141 (PCFT–nanobody + pemetrexed). Any other relevant data are available from the corresponding authors upon reasonable request.