
Extended Data Fig. 8 |. Analysis of residues involved in proton binding in PCFT.
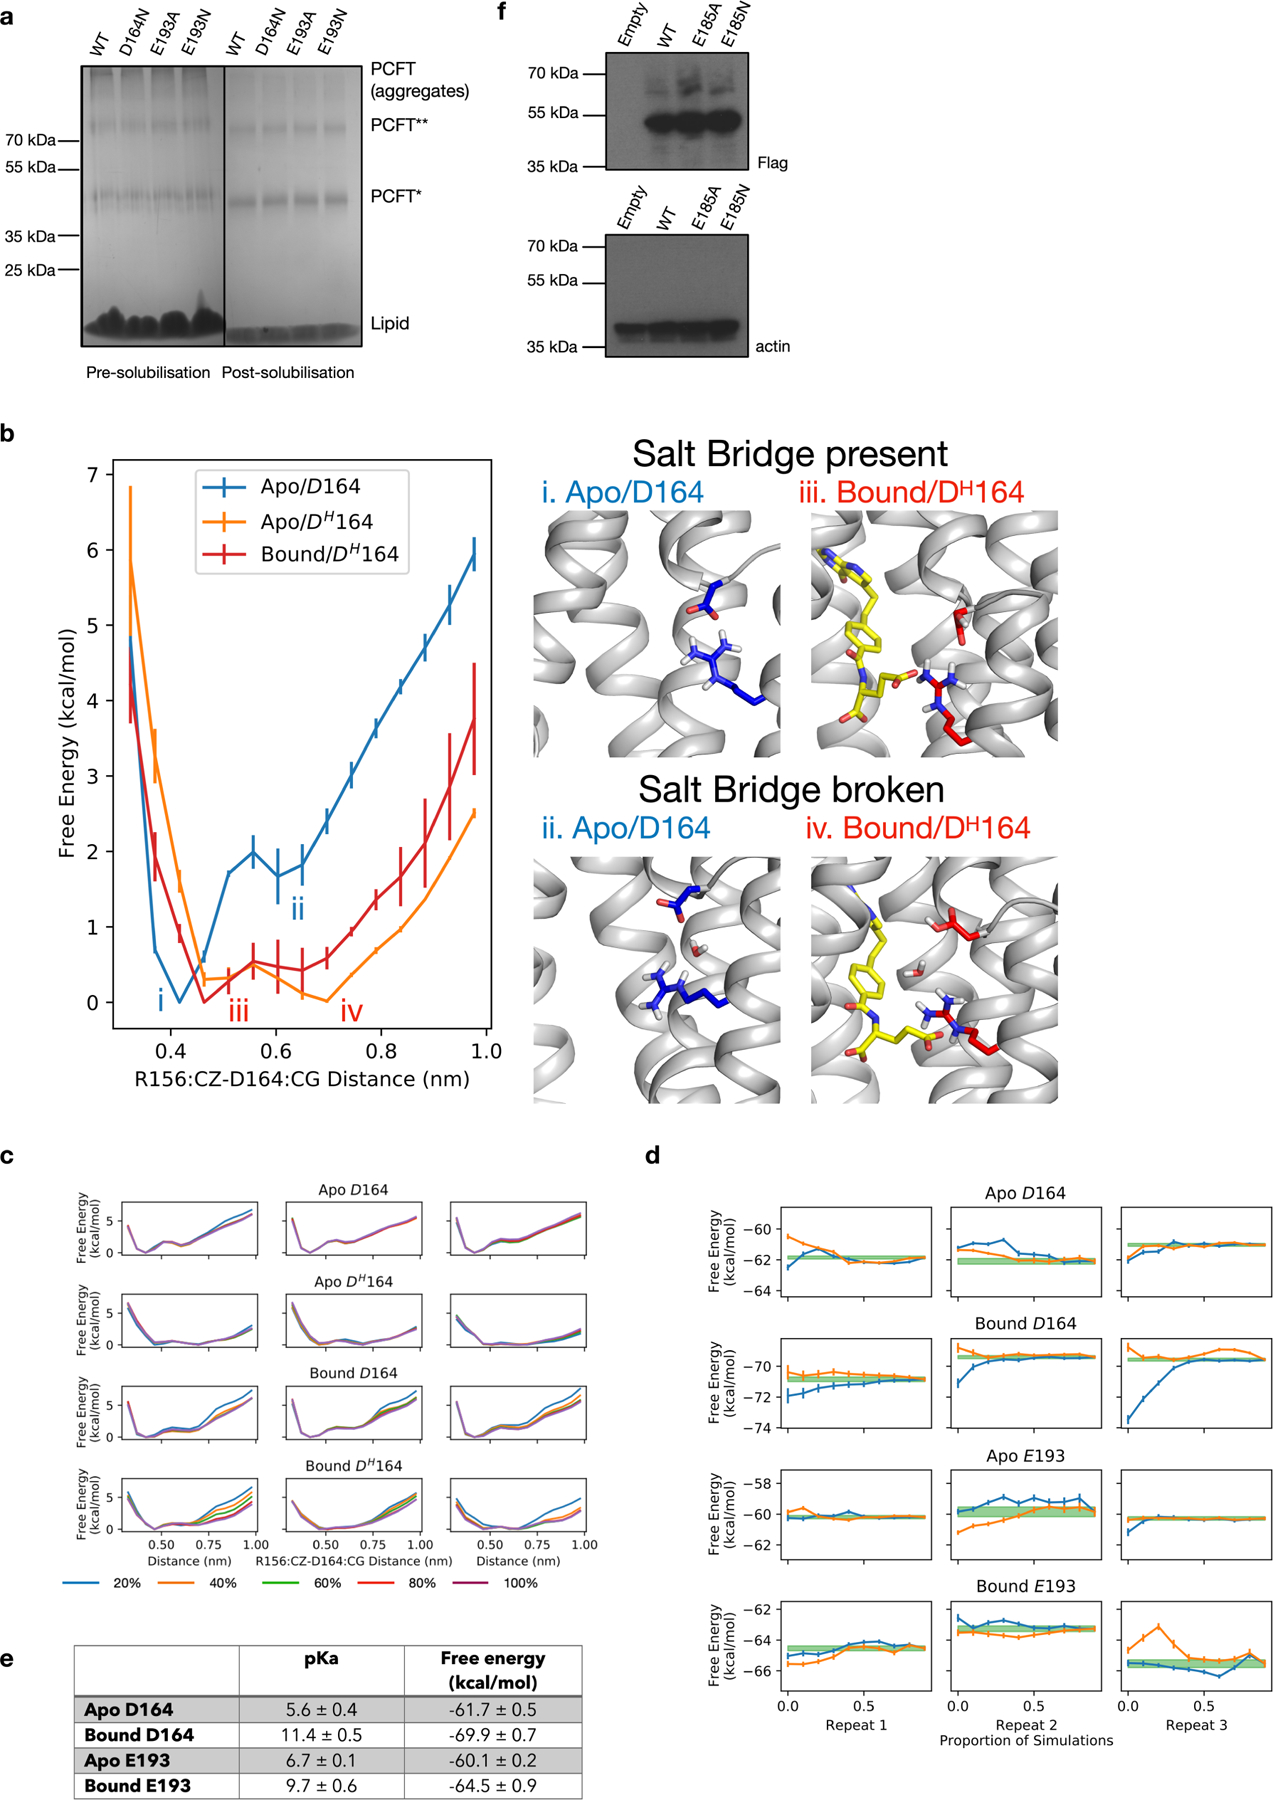
a, Analysis of wild type and variants of chicken PCFT studied in liposome assays. SDS–PAGE gel showing pre- and post-solubilization of proteoliposomes with 1% DDM:CHS. A proportion of purified PCFT is not folded correctly in the liposome and runs as aggregates on the pre-solubilized samples in the SDS–PAGE gel. Experiments were repeated three times with similar results. b, Protonation of D164 results in easier breakage of the salt bridge interaction to R156. There is a free energy barrier of 2 kcal mol−1 associated with the breakage of the R156–D164 salt bridge in the apo state (i and ii). The protonation of the D164 (DH164) would lower this free energy barrier to a level lower than 0.5 kcal mol−1 (iii and iv) and thus bring it under the level of thermal fluctuation. The presence of pemetrexed does not affect this process. Rather, it controls the likelihood that D164 is protonated in the first place and thus effects the salt bridge stability indirectly. c, Convergence of the PMF profile shown in b. The PMF profile is computed for the first 20% (blue), 40% (orange), 60% (green), 80% (red) and 100% (purple) of the data. The columns are three repeats of the calculations. d, Convergence plots of the protonation free energy. The forward plot (orange lines) is the protonation free energy computed from the first 10% up to 100% of data, in 10% increments. The backward plot (blue lines) is the protonation free energy computed from the final 10% up to 100% of the data, in 10% increments. The columns are three repeats of the calculations. The green line is the final estimate of the free energy for each simulation and the width shows the uncertainty in the multistate Bennet acceptance ratio calculation. e, Table showing calculated pKa and free energy values (mean ± s.d.). f, Western blot analysis of the cell-based assay using an anti-Flag antibody for the PCFT variants and a loading control of anti-β-actin. Experiments were repeated twice with similar results.