

Abstract
Autophagy is an essential degradative pathway that maintains neuronal homeostasis and prevents axon degeneration. However, the mechanisms of autophagy in neurons are only beginning to be understood. To address this fundamental gap in knowledge, we have established several key methodologies for live-cell imaging and quantitative analysis of autophagy in primary hippocampal neurons. Using these methods, we have defined compartment-specific dynamics of autophagy in real-time under basal versus stress conditions. For example, we have characterized autophagosome biogenesis in the distal axon and subsequent retrograde transport to the soma for degradation. Autophagosomes are also generated locally within the soma. In contrast to the axon, the majority of autophagosomes in dendrites are stationary, while some exhibit bidirectional movement. These studies establish an initial road map for autophagosome dynamics in each compartment of the neuron and set the stage for a more detailed understanding of neuronal autophagy in stress and disease.
Keywords: Autophagy, Hippocampal neurons, Autophagosome, Transport, Biogenesis, Axon, Dendrite
1. Introduction
Autophagy is a lysosomal degradation pathway that eliminates damaged or aged cellular components from the cytoplasm [1–8]. In this process, proteotoxins are packaged into an autophagosome and targeted for destruction by fusion with degradative lysosomes. Post-mitotic cells such as neurons are particularly dependent on autophagy to maintain cellular homeostasis [ 1–3 ]. Most neurons in the brain are born during embryogenesis and must survive a lifetime [9]. Consequently, to support their long-term viability and functionality, neurons require robust quality-control mechanisms. In fact, loss of autophagy is sufficient to induce axon degeneration and neuron death in mice [10–13]. Further, mutations in autophagy genes have been linked to the progression of neurodegenerative disorders in humans [1, 14]. Despite evidence that autophagy is a key regulator of neuronal homeostasis, very little is known about the mechanisms driving this process in neurons.
Here we describe a protocol for live-cell imaging and quantitative analysis of autophagy in primary hippocampal neurons. Autophagy is readily followed using GFP-tagged LC3. LC3 is a well-characterized marker for the autophagosome [15, 16]. LC3 has a cytosolic and lipidated population, and the lipidated form is associated with autophagosomes, appearing as discrete puncta in the neuron (Fig. 1). Our live-cell analyses of GFP-LC3-positive autophagosomes have revealed striking features of autophagosome dynamics in each compartment of the neuron [4–6]. Axonal autophagosomes are preferentially generated in the distal end of the axon and undergo robust retrograde transport toward the soma [4–6]. Autophagosomes in dendrites, however, are predominantly stationary or undergo bidirectional movement [5, 6], likely owing to the mixed polarity of the underlying microtubule network [17, 18]. Once in the soma, autophagosomes are confined within the somatodendritic domain [6], which likely facilitates cargo degradation by promoting fusion with proteolytically active lysosomes that are enriched in this region [19, 20]. Thus, live-cell imaging has revealed that constitutive autophagy is a highly compartmentalized pathway in neurons.
Fig. 1.
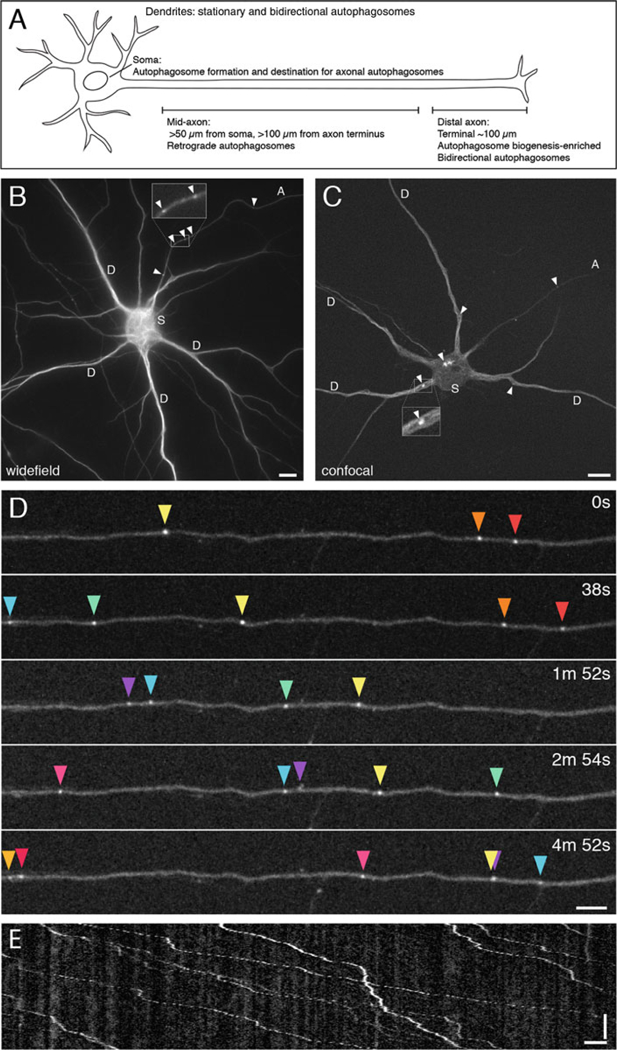
GFP-LC3 distribution and dynamics in primary hippocampal neurons. (a) Schematic of compartment-specific autophagosome dynamics in primary neurons. (b) Widefield image of GFP-LC3 in a hippocampal neuron grown 8 DIV in glial-conditioned maintenance media. Image was taken with a 63× objective. Arrowheads denote autophagosomes in the axon (A). Inset, magnified view of axonal autophagosomes. D, dendrite, S, soma. Bar, 10 μm. (c) Confocal image of GFP-LC3 in a hippocampal neuron grown 9 DIV in glial-conditioned maintenance media. Image was taken with a spinning disk confocal microscope using a 100 × objective. Arrowheads denote autophagosomes in the axon (A), dendrites (D), and soma (S). Inset, magnified view of an autophagosome in a dendrite. Bar, 10 μm. (d) Time series of GFP-LC3-positive autophagosomes in the axon undergoing retrograde transport; retrograde direction is toward the right. Each colored arrowhead represents an individual autophagosome. Images were acquired using a spinning disk microscope and 63 × objective on a hippocampal neuron grown 8 DIV in glial-conditioned maintenance media. Bar, 5 μm. (e) Corresponding kymograph to the movie in (d) showing autophagosome retrograde transport in the axon; retrograde direction is toward the right. Each diagonal line represents a single autophagosome moving toward the soma. Vertical bar, 1 min. Horizontal bar, 5 μm
To measure autophagosome dynamics in neurons, we isolate hippocampal neurons from GFP-LC3 transgenic mouse embryos at embryonic day 15.5 [16]. The embryos are separated by genotype based on GFP fluorescence (GFP-LC3 transgenic vs. non-transgenic littermates), and hippocampal neurons are prepared independently from each genotype. At the final stage of plating, GFP-LC3 transgenic neurons are combined with non-transgenic neurons at a 1:20 dilution. This dilution of GFP-LC3 transgenic neurons enables resolution of single-cell dynamics and directionality of axonal processes, while maintaining a dense environment that is conducive for the neurons to form synaptic connections. Neurons are imaged at 8–10 DIV, at a developmental time point when axon-dendrite polarity is established. For older neurons (>2 weeks), neurons are cultured in glial-conditioned maintenance media to promote long-term viability. Imaging of GFP-LC3 can be performed on a widefield fluorescence microscope or a spinning disk confocal microscope; imaging conditions for both microscopes are described. The spinning disk confocal microscope provides enhanced resolution of autophagosome dynamics within regions of greater depth, such as the soma and dendrites (Figure 1b, c), and also facilitates the tracking of autophagosome biogenesis events. The protocols described here can be used to quantitate autophagy levels and dynamics in primary neurons in real time in response to various modalities of stimuli and stress, thus enabling a more detailed understanding of the mechanisms and regulation of neuronal autophagy in health and disease.
2. Materials
2.1. Primary Mouse Hippocampal Culture
GFP-LC3 transgenic mice, strain name B6.Cg-Tg (CAG-EGFP/LC3)53Nmi/NmiRbrc, obtained from RIKEN BioResource Center [16] (see Note 1).
Neuronal Maintenance Media: Neurobasal media supplemented with 2% B-27, 37.5 mM NaCl, 33 mM glucose, 2 mM GlutaMAX, 100 U/mL penicillin, and 100 μg/mL streptomycin. Do not filter the B-27. Add the B-27 after the media have been filtered through an 0.2 μm filter unit.
Neuronal Attachment Media: Minimal Essential Media supplemented with 10% heat inactivated horse serum, 33 mM glucose, 1 mM pyruvic acid, and 37.5 mM NaCl.
Trypsin solution: 2.5% (w/v) trypsin.
Hanks’ Balanced Salt Solution (HBSS): 1× HBSS buffered with 10 mM HEPES, pH 7.0.
Borate Buffer: 0.1 M borate buffer, pH 8.5 (prepared from boric acid and sodium tetraborate).
Poly-l-Lysine solution: 2 mg/mL poly-l-lysine in borate buffer (prepared from poly-l-lysine, molecular weight 30,000–70,000 kDa, Sigma cat. no. P2636).
Cytosine-d-arabinofuranoside hydrochloride (Ara-C): 1 mM Ara-C.
Acid-washed glass coverslips: 25 mm Deckgläser coverslips (Carolina Biosciences cat. no. 633037).
2.2. Primary Mouse Glial Culture
Glial Media: DMEM supplemented with 10% heat inactivated Fetal Bovine Serum, 2 mM GlutaMAX, 100 U/mL penicillin, and 100 μg/mL streptomycin.
Trypsin solution: 2.5% (w/v) trypsin.
Hanks’ Balanced Salt Solution (HBSS): 1× HBSS buffered with 10 mM HEPES, pH 7.0.
Cell strainer, 40 μm pores (Falcon, cat. no. 352340).
Dulbecco’s phosphate buffered saline (DPBS), pH 7.1.
Trypsin-EDTA solution: 0.05% trypsin-EDTA (1×) in DPBS.
2.3. Live-Cell Imaging of GFP-LC3 in Primary Hippocampal Neurons
Imaging chamber: Chamlide CMB magnetic chamber for imaging 25 mm round coverslips (Live Cell Instrument, cat. no. CM-B25–1).
Neuronal imaging media: Hibernate E (BrainBits) supplemented with 2% B-27 and 2 mM GlutaMAX.
Inverted widefield fluorescence microscope: Leica DMi8 inverted fluorescence microscope equipped with an sCMOS camera (Hamamatsu Orca Flash 4.0 V2+). GFP-LC3 is imaged with 63×/1.40 NA or 100×/1.40 NA Plan-Apochromat oil immersion objectives and FITC filter cube. For live-cell imaging, the microscope has Leica Adaptive Focus Control to maintain the focal plane during image acquisition, a climate-controlled chamber to maintain 37 °C, and is mounted on an air table to buffer against vibration. Images are acquired with Leica LAS-AF software.
Spinning disk confocal microscope: Leica DMi8 inverted widefield microscope with motorized stage equipped with a Yokogawa W1 spinning disk confocal scanning head, VisiScope Homogenizer for uniform laser illumination, and Photometrics Prime 95B sCMOS camera with 95% quantum efficiency. Imaging GFP-LC3 is performed with 63×/1.40 NA or 100 × /1.40 NA Plan-Apochromat oil immersion objectives, 488 nm/200 mW solid-state laser line, and 525/50 nm emission filter. For live-cell imaging, the microscope has Leica Adaptive Focus Control to maintain the focal plane during image acquisition, a climate-controlled chamber to maintain 37 °C, and is mounted on an air table to buffer against vibration. Images are acquired with VisiView software.
2.4. Analysis of Autophagosome Dynamics
FIJI with Multiple Kymograph Plugin.
Ilastik.
Microsoft Excel.
GraphPad Prism.
3. Methods
3.1. Primary Mouse Hippocampal Culture
- Prepare acid-washed glass coverslips:
-
(a)Wash glass coverslips in 0.25% (v/v) acetic acid overnight at room temperature, rocking.
-
(b)Rinse the coverslips 3 times in 100% EtOH.
-
(c)Store coverslips in 100% EtOH at 4 °C until needed.
-
(a)
- The day before neuron plating, coat the coverslips with poly-l-lysine (PLL):
-
(a)Dilute 2 mg/mL PLL to 0.5 mg/mL in borate buffer.
-
(b)Add 200 μL 0.5 mg/mL PLL to each 25 mm glass coverslip, and spread evenly over the coverslip surface.
-
(c)Incubate overnight at 37 °C.
-
(d)Remove the PLL and rinse twice with sterile water.
-
(e)Remove the water and add attachment media and incubate in 37 °C tissue culture incubator during the dissection (typically ~1–2 h).
-
(a)
- Dissect and plate hippocampal neurons:
-
(a)Timed pregnancies are set up in advance between a GFP-LC3 transgenic mouse and C57BL6 mouse. We typically use male mice to supply the GFP-LC3 transgene since they do not get sacrificed for the neuronal dissection.
-
(b)Euthanize the pregnant dam on gestation day 15.5, dissect out the uterus and place in a sterile 10 cm cell culture dish with cold HBSS.
-
(c)Remove the embryos from the uterus, decapitate, and remove the brains. Collect the brains in a sterile 35 mm cell culture dish with cold HBSS and store on ice.
-
(d)Using a fluorescence dissecting microscope, separate the GFP-LC3 transgenic brains from the non-transgenic littermate brains and collect each genotype in a 35 mm cell culture dish with HBSS and store on ice. On average, we obtain ~4 GFP-LC3 transgenic embryos and ~4 non-transgenic embryos.
-
(e)Remove the meninges from the cerebral hemispheres.
-
(f)Dissect out the hippocampus and collect the hippocampi of each genotype in separate 35 mm cell culture dishes containing cold HBSS and store on ice. The neurons from each genotype will be prepared separately and combined in the final step of plating.
-
(g)In a biological safety cabinet for tissue culture, transfer the hippocampi to 4.5 mL HBSS pre-warmed to 37 °C. Add 0.5 mL 2.5% (w/v) trypsin solution and incubate 10 min at 37 °C.
-
(h)After the incubation, the hippocampi will have settled to the bottom of the tube. Carefully remove the trypsin solution without disturbing the tissue.
-
(i)Add 10 mL attachment media and incubate at room temperature long enough for the hippocampi to settle to the bottom of the tube. Remove the attachment media and wash twice more with attachment media.
-
(j)Add 1 mL attachment media and dissociate the hippocampi by triturating (pipetting up and down) through a Pasteur pipette. First, using a Pasteur pipet fire-polished to round the edges, triturate five times round trip to break up large pieces of tissue. Second, using a Pasteur pipet fire-polished to decrease the bore size by 1/3, triturate 8–10 times round-trip to achieve a homogeneous cell suspension. Minimize bubbles during the trituration.
-
(k)Allow any remaining undissolved tissue fragments to settle and transfer the supernatant (hippocampal cell suspension) to a new tube.
-
(l)Determine the cell density using a hemocytometer.
-
(m)For plating neurons onto coverslips, 8 coverslips are placed into a 10 cm cell culture dish and a total of 750,000 cells are plated per 10 cm (~12,000 cells/ cm2). To resolve single-cell dynamics of autophagosomes, GFP-LC3 transgenic neurons are diluted with non-transgenic neurons at 1:20 (see Note 2).
-
(n)Incubate neurons at 37 °C in a 5% CO2 incubator.
-
(o)After the cells attach to the coverslip (typically within ~4 h of plating), transfer coverslips to 6-well plates containing pre-equilibrated maintenance media and return to the 37 °C, 5% CO2 incubator.
-
(p)Every 3–4 days, replace ~25% of the media with pre-equilibrated maintenance media. The first feed is supplemented with Ara-C (1 μM final concentration). No differences have been noted in autophagy with Ara-C addition.
-
(q)For studies performed within 8–10 DIV, neurons are cultured in neuronal maintenance media. If studies require neurons >2 weeks in culture, neurons are grown in glial-conditioned neuronal maintenance media (as described below).
-
(a)
3.2. Primary Mouse Glial Culture
- Dissect and plate mouse glia (see Note 3):
-
(a)Euthanize 4–5 wild-type mouse pups at P0–P1 and remove the brains. Collect the brains in a 10 cm cell culture dish with cold HBSS and store on ice.
-
(b)Using a dissecting microscope, remove the meninges from the cerebral hemispheres.
-
(c)Dissect out the cortex and collect the cortices in a 35 mm cell culture dish containing cold HBSS and store on ice.
-
(d)In a biological safety cabinet for tissue culture, transfer the cortices to 4.5 mL HBSS pre-warmed to 37 °C. Add 0. 5 mL 2.5% (w/v) trypsin solution and incubate 10 min at 37 ° C.
-
(e)After the incubation, the cortices will have settled to the bottom of the tube. Carefully remove the trypsin solution without disturbing the tissue.
-
(f)Add 10 mL glial media and incubate at room temperature long enough for the cortices to settle to the bottom of the tube. Remove the glial media and wash twice more with glial media.
-
(g)Add 1 mL glial media and dissociate the cortices by trituration. First, triturate through a 5 mL pipet to break up large pieces of tissue. Then triturate with a p1000 pipet until you achieve a homogenous cell suspension.
-
(h)Add 4 mL glial media, pass cells through a cell strainer, and collect in a 50 mL conical tube. Add an additional 5 mL glial media to strained cells.
-
(i)Determine the cell density using a hemocytometer.
-
(j)Plate approximately three million glia per 10 cm dish in glial media and incubate in a 37 °C, 5% CO2 incubator.
-
(k)The next day, replace media with fresh glial media and return to 37 °C, 5% CO2 incubator.
-
(l)Cells will appear sparse for the first few days in culture. The glia will be 80–90% confluent within approximately 10 days in culture. Every 3–4 days, perform a full media change.
-
(a)
- When the glia are approximately 80% confluent, passage the glia into new 10 cm cell culture dishes:
-
(a)Aspirate and discard the glial media.
-
(b)Wash cells once with DPBS.
-
(c)Add 3 mL trypsin-EDTA solution.
-
(d)Incubate at 37 °C, 5% CO2 until cells are detached (~5 min).
-
(e)Add 7 mL glial media to cells to deactivate the trypsin.
-
(f)Spin 2000 rpms (644 × ) for 2 min in a swing-out rotor.
-
(g)Discard the supernatant.
-
(h)Resuspend the cell pellet in 10 mL glial media.
-
(i)Determine the cell density using a hemocytometer.
-
(j)Plate 2–three million cells per 10 cm cell culture dish in glial media and incubate at 37 ° C, 5% CO2.
-
(a)
- Generate glial-conditioned neuronal maintenance media for neuronal culture:
-
(a)The day before neuron plating, replace glial media on glia with neuronal maintenance media.
-
(b)The day of neuron plating, transfer coverslips with neurons from attachment media to 6 well trays containing glial-conditioned neuronal maintenance media. Replace maintenance media on glia.
-
(c)Use glial-conditioned neuronal maintenance media as a source of media for subsequent feedings of the neurons. After feeding neurons, replace neuronal maintenance media on glia for the next round of feeding.
-
(a)
3.3. Live-Cell Imaging of GFP-LC3 in Primary Hippocampal Neurons
Equilibrate environmental chamber on the microscope to 37 ° C for at least 1 h prior to imaging.
Place coverslip in Chamlide chamber and add 1 mL neuronal imaging media, pre-warmed to 37 °C.
Select a GFP-LC3-positive neuron that has a well-defined cell soma, axon, and dendrites, following criteria from Kaech and Banker [21]. At 8–10 DIV, dendrites should be ~100–300 μm in length, tapered, and branched. The neuron should have a single axon that extends well beyond the field of view, with a uniformly thin width along its length. Avoid neurons that are not well developed or axons that appear to have distensions.
Note the location of the movie within the neuron. We have observed very different patterns of motility in different regions of the neuron (Fig. 1a). Autophagosome biogenesis is enriched in the distal axon (defined as the terminal 100 μm of the axon) [4, 5] and in the soma [6]. Autophagosomes exhibit bidirectional motility in the distal axon and transition to robust retrograde transport in the mid-axon (defined as >50 μm from the soma and >100 μm from the axon terminus) (Fig. 1a, d, e) [4, 5]. In dendrites, autophagosomes are primarily stationary, while some exhibit bidirectional movement [5, 6].
Note the distribution of LC3 in the neuron. LC3 exists in a cytosolic form, microtubule-bound form, and lipidated form; the lipidated form associates with autophagosomes and appears as discrete puncta within the neuron (Fig. 1b–e). Autophagosomes are identified by GFP-LC3-positive punctate structures. As these structures become larger (~800 nm), they appear as ring-shaped structures.
- Using a 63 × or 100 × objective, image GFP-LC3 dynamics over time using the following guidelines.
-
(a)Acquire images at a rate of 1–2 s per frame for at least 5 min. Longer imaging durations are required to measure events of autophagosome biogenesis [4, 5]. Faster frame rates may be required to track the dynamics of bidirectional autophagosomes in dendrites. For movies within the axon, it is important to note the direction of the cell body by obtaining tiled still images from the location of the axon movie back to the soma to document direction.
-
(b)Adjust exposure time and light intensity to minimize bleaching of the GFP-LC3 signal. Typically, we are using the following conditions:
- Widefield microscope: 100 ms exposure, 10% fluorescence intensity manager (intensity of LED lamp).
- Spinning Disk Confocal microscope: 200 ms exposure, 50–80% laser power.
-
(c)If available, use the Adaptive Focus Control to maintain the focal plane throughout image acquisition.
-
(d)If available, use an air table to minimize vibrations that contribute to image drift.
-
(a)
Due to the increased depth of the soma, total GFP-LC3 in the soma is quantitated with a Z-stack of the entire cell body, acquired at 0.1 μm sections using a confocal spinning disk microscope. Z-stacks can also be obtained with a widefield microscope and processed with deconvolution.
Coverslips are imaged for a maximum of ~2 h. Beyond this point, cell health will decline.
3.4. Analysis of Autophagosome Dynamics (See Note 4)
- Open microscope image files in FIJI using the Bio-Formats Importer and quantify the following metrics in the axon:
-
(a)Autophagosome density:
- In the first frame of the image series, count the number of GFP-LC3-positive puncta (autophagosomes) along the axon. Play the movie to determine the number of puncta, as autophagosomes often collide during transport and may appear as a single larger structure in one frame but actually consist of several individual puncta that resolve as they move.
- Determine the length of the axon by tracing the axon of interest with a line and measuring the length (in μm).
- Normalize the number of autophagosomes by the axon length and present as No. of Autophagosomes/100 μm.
-
(b)Autophagosome flux through a midpoint:
- Draw a line bisecting the axon.
- Count the number of GFP-LC3-positive puncta that cross the midpoint during the movie.
- Normalize the number of crossing autophagosomes by the duration of the movie and present as No. of Autophagosomes/min.
-
(c)Direction of motility (percent retrograde vs. anterograde vs. stationary/bidirectional):
- Using the Multiple Kymograph Plugin, generate a kymograph of the axon using a line width of 3 (Fig. 1e). Note the retrograde and anterograde direction of the kymograph.
- Referencing the movie and kymograph together, bin autophagosomes into the following categories: retrograde (autophagosomes that move a net distance of ≥5 μm in the retrograde direction within the 5 min imaging window), (b) anterograde (autophagosomes that move a net distance of ≥5 μm in the anterograde direction within the 5 min imaging window), and (c) stationary/bidirectional (autophagosomes that do not undergo processive motility and are confined within a net distance of <5 μm within the 5 min imaging window). Eliminate edge effects due to processive autophagosomes that enter the field of view at the end of the movie and would need to be binned as stationary. In this case, truncate the region of the axon used for quantitation to eliminate these edges.
- Determine the percentage that each category represents based on the total number of autophagosomes recorded.
-
(d)Each of these metrics is determined for a single axon from a single neuron. Obtain measurements from at least 25–30 individual neurons from 3 independent experiments.
-
(e)Process data using excel. Graph data and perform statistical analyses in Prism.
-
(a)
Similar metrics can be obtained in dendrites, although individual autophagosomes are more difficult to track persistently for an entire 5 min due to the higher background of GFP-LC3 signal in dendrites. Further, the bidirectional nature of autophagosomes in dendrites requires higher time resolution to facilitate tracking and quantification of individual autophagosome dynamics. In dendrites, the populations of stationary versus bidirectional autophagosomes can be distinguished using the following criteria: stationary autophagosomes exhibit a displacement of <5 μm in 5 minutes, and bidirectional autophagosomes exhibit sustained movement of 5 μm in both anterograde and retrograde directions, irrespective of displacement, during the imaging window [5].
- Quantitate GFP-LC3 area in the soma:
-
(a)Using FIJI, generate a maximum projection of the Z-stack generated from the soma.
-
(b)Identify and segment GFP-LC3-positive autophagosomes using ilastik. Since GFP-LC3 has a cytosolic and microtubule-bound component, it can be challenging to reliably segment GFP-LC3-positive autophagosomes away from these other signals using global thresholding techniques based on fluorescence intensity or size. Ilastik uses a machine learning-based approach using multiple criteria defined by the user to successfully identify and distinguish autophagosomes from other GFP-LC3-positive signals in the cell.
-
(c)Import the segmented images generated in ilastik into FIJI and measure the area occupied by GFP-LC3-positive structures using the “analyze particles function”.
-
(d)Normalize the total area of GFP-LC3-positive autophagosomes for a given cell body by the total area of the corresponding cell body.
-
(a)
4. Notes
The use of the GFP-LC3 transgenic mice to observe autophagosome dynamics in neurons is preferred over transient transfection of GFP-LC3, as the transgenic mice provide less variation in expression level. In addition, transfection of GFP-LC3 can also result in high GFP-LC3 concentration which can make individual autophagic events difficult to resolve. If transient transfection methods are used, optimize transfection conditions to minimize high expression of GFP-LC3.
For experiments requiring higher neuronal densities or longer time in culture, we recommend diluting GFP-LC3 transgenic neurons more than 1:20, such as 1:30–1:40, to resolve singlecell dynamics and axon direction.
The procedure for isolation and culture of glia enriches primarily for astrocytes and not oligodendrocytes or microglia.
Events of autophagosome biogenesis or formation can be measured in the terminal 100 μm of the axon or in the soma. These events are marked by the appearance of GFP-LC3-positive puncta that grow progressively into ring-shaped structures ~800 nm in diameter. Rates of autophagosome formation can be measured as the number of growth events occurring within a unit of time. To measure the kinetics of individual autophagosome development, Fluorescence Recovery after Photobleaching (FRAP) can be used [4].
Other autophagy markers that label nascent autophagosomes, such as mCherry-tagged Atg5 or Atg13, can be expressed in hippocampal neurons using Lipofectamine 2000 [5]. Expression of organelle markers for maturation state (e.g., mCherry-LAMP1 or mCherry-GFP-LC3 in non-transgenic neurons) can distinguish immature versus mature and degradative autophagic compartments [4, 6]. Fluorescently-labeled proteins should be validated and expressed at low levels for live-cell imaging.
To measure specific characteristics of autophagosome motility such as instantaneous velocities, time paused, and frequency or duration of directional reversals, tracking programs in Metamorph [4] or FIJI can be applied.
The GFP-LC3 imaging protocol described here can be performed in other neuronal cell types (e.g., dorsal root ganglion neurons, cortical neurons, motor neurons) isolated from GFP-LC3 transgenic mice. We have observed similar autophagosome dynamics across the aforementioned neuronal subtypes [5]. We have found that mechanistic studies of autophagosome biogenesis are facilitated in dorsal root ganglion neurons that have more flat, fan-like growth cones [4].
Acknowledgments
This work was funded by NIH grants K99NS082619 and R00NS082619, the McCabe Fund Fellow Award, the University of Pennsylvania Alzheimer’s Disease Core Center, the Intellectual and Developmental Disabilities Research Center at the Children’s Hospital of Philadelphia and the University of Pennsylvania, and The Philadelphia Foundation to S.M.
References
- 1.Maday S (2016) Mechanisms of neuronal homeostasis: autophagy in the axon. Brain Res 1649(Pt B):143–150. 10.1016/j.brainres.2016.03.047 [DOI] [PMC free article] [PubMed] [Google Scholar]
- 2.Yamamoto A, Yue Z (2014) Autophagy and its normal and pathogenic states in the brain. Annu Rev Neurosci 37:55–78. 10.1146/annurev-neuro-071013-014149 [DOI] [PubMed] [Google Scholar]
- 3.Ariosa AR, Klionsky DJ (2016) Autophagy core machinery: overcoming spatial barriers in neurons. J Mol Med (Berl) 94(11):1217–1227. 10.1007/s00109-016-1461-9 [DOI] [PMC free article] [PubMed] [Google Scholar]
- 4.Maday S, Wallace KE, Holzbaur EL (2012) Autophagosomes initiate distally and mature during transport toward the cell soma in primary neurons. J Cell Biol 196(4):407–417. 10.1083/jcb.201106120 [DOI] [PMC free article] [PubMed] [Google Scholar]
- 5.Maday S, Holzbaur EL (2014) Autophagosome biogenesis in primary neurons follows an ordered and spatially regulated pathway. Dev Cell 30(1):71–85. 10.1016/j.devcel.2014.06.001 [DOI] [PMC free article] [PubMed] [Google Scholar]
- 6.Maday S, Holzbaur EL (2016) Compartment-specific regulation of autophagy in primary neurons. J Neurosci 36(22):5933–5945. 10.1523/JNEUR0SCI.4401-15.2016 [DOI] [PMC free article] [PubMed] [Google Scholar]
- 7.Weidberg H, Shvets E, Elazar Z (2011) Biogenesis and cargo selectivity of autophagosomes. Annu Rev Biochem 80:125–156. 10.1146/annurev-biochem-052709-094552 [DOI] [PubMed] [Google Scholar]
- 8.Mizushima N, Yoshimori T, Ohsumi Y (2011) The role of Atg proteins in autophagosome formation. Annu Rev Cell Dev Biol 27:107–132. 10.1146/annurev-cellbio-092910-154005 [DOI] [PubMed] [Google Scholar]
- 9.Spalding KL, Bhardwaj RD, Buchholz BA, Druid H, Frisen J (2005) Retrospective birth dating of cells in humans. Cell 122 (1):133–143. 10.1016/j.cell.2005.04.028 [DOI] [PubMed] [Google Scholar]
- 10.Hara T, Nakamura K, Matsui M, Yamamoto A, Nakahara Y, Suzuki-Migishima R, Yokoyama M, Mishima K, Saito I, Okano H, Mizushima N (2006) Suppression of basal autophagy in neural cells causes neurodegenerative disease in mice. Nature 441 (7095):885–889. 10.1038/nature04724 [DOI] [PubMed] [Google Scholar]
- 11.Komatsu M, Waguri S, Chiba T, Murata S, Iwata J, Tanida I, Ueno T, Koike M, Uchiyama Y, Kominami E, Tanaka K (2006) Loss of autophagy in the central nervous system causes neurodegeneration in mice. Nature 441(7095):880–884. 10.1038/nature04723 [DOI] [PubMed] [Google Scholar]
- 12.Komatsu M, Wang QJ, Holstein GR, Friedrich VL Jr, Iwata J, Kominami E, Chait BT, Tanaka K, Yue Z (2007) Essential role for autophagy protein Atg7 in the maintenance of axonal homeostasis and the prevention of axonal degeneration. Proc Natl Acad Sci U S A 104 (36):14489–14494. 10.1073/pnas.0701311104 [DOI] [PMC free article] [PubMed] [Google Scholar]
- 13.Nishiyama J, Miura E, Mizushima N, Watanabe M, Yuzaki M (2007) Aberrant membranes and double-membrane structures accumulate in the axons of Atg5-null Purkinje cells before neuronal death. Autophagy 3 (6):591–596 [DOI] [PubMed] [Google Scholar]
- 14.Kim M, Sandford E, Gatica D, Qiu Y, Liu X, Zheng Y, Schulman BA, Xu J, Semple I, Ro SH, Kim B, Mavioglu RN, Tolun A, Jipa A, Takats S, Karpati M, Li JZ, Yapici Z, Juhasz G, Lee JH, Klionsky Dj, Burmeister M (2016) Mutation in ATG5 reduces autophagy and leads to ataxia with developmental delay Elife 5. 10.7554/eLife.12245 [DOI] [PMC free article] [PubMed]
- 15.Kabeya Y, Mizushima N, Ueno T, Yamamoto A, Kirisako T, Noda T, Kominami E, Ohsumi Y, Yoshimori T (2000) LC3, a mammalian homologue of yeast Apg8p, is localized in autophagosome membranes after processing. EMBO J 19(21):5720–5728. 10.1093/emboj/19.21.5720 [DOI] [PMC free article] [PubMed] [Google Scholar]
- 16.Mizushima N, Yamamoto A, Matsui M, Yoshimori T, Ohsumi Y (2004) In vivo analysis of autophagy in response to nutrient starvation using transgenic mice expressing a fluorescent autophagosome marker. Mol Biol Cell 15 (3):1101–1111. 10.1091/mbc.E03-09-0704 [DOI] [PMC free article] [PubMed] [Google Scholar]
- 17.Baas PW, Deitch JS, Black MM, Banker GA (1988) Polarity orientation of microtubules in hippocampal neurons: uniformity in the axon and nonuniformity in the dendrite. Proc Natl Acad Sci U S A 85(21):8335–8339 [DOI] [PMC free article] [PubMed] [Google Scholar]
- 18.Kleele T, Marinkovic P, Williams PR, Stern S, Weigand EE, Engerer P, Naumann R, Hartmann J, Karl RM, Bradke F, Bishop D, Herms J, Konnerth A, Kerschensteiner M, Godinho L, Misgeld T (2014) An assay to image neuronal microtubule dynamics in mice. Nat Commun 5:4827. 10.1038/ncomms5827 [DOI] [PMC free article] [PubMed] [Google Scholar]
- 19.Gowrishankar S, Yuan P, Wu Y, Schrag M, Paradise S, Grutzendler J, De Camilli P, Ferguson SM (2015) Massive accumulation of luminal protease-deficient axonal lysosomes at Alzheimer’s disease amyloid plaques. Proc Natl Acad Sci U S A 112(28):E3699–E3708. 10.1073/pnas.1510329112 [DOI] [PMC free article] [PubMed] [Google Scholar]
- 20.Lee S, Sato Y, Nixon RA (2011) Lysosomal proteolysis inhibition selectively disrupts axonal transport of degradative organelles and causes an Alzheimer’s-like axonal dystrophy. J Neurosci 31(21):7817–7830. 10.1523/JNEUR0SCI.6412-10.2011 [DOI] [PMC free article] [PubMed] [Google Scholar]
- 21.Kaech S, Banker G (2006) Culturing hippocampal neurons. Nat Protoc 1(5):2406–2415. 10.1038/nprot.2006.356 [DOI] [PubMed] [Google Scholar]