

Abstract
During conversation, people take turns speaking by rapidly responding to their partners while simultaneously avoiding interruption1, 2. Such interactions display a remarkable degree of coordination, as typical gaps between turns are ~200 ms3, 4 – approximately the duration of an eyeblink5. These response times are considerably shorter than those observed in simple word production tasks6, indicating that speakers often plan their responses while listening to their partners2. Although a distributed network of brain regions has been implicated in speech planning7–14, the neural dynamics underlying the specific preparatory processes enabling rapid turn-taking are poorly understood. Here we use intracranial electrocorticography to precisely measure neural activity as participants perform interactive tasks, and we observe a distinct class of cortical dynamics associated with speech planning. We localize these preparatory responses to a frontotemporal circuit that is anatomically segregated from regions involved in speech perception and production, and we find the core of this network to be comprised of language-critical caudal inferior frontal cortex15, 16 (i.e., ‘Broca’s region’) and caudal middle frontal gyrus – a region not normally implicated in speech planning17–20. Using a series of motor tasks, we then show that this planning network is selectively active when preparing speech but significantly less recruited when planning nonlinguistic orofacial and manual actions. Finally, we uncover planning-related circuitry in natural conversation that is nearly identical to the network mapped with our interactive tasks, and we find this circuit to be most active prior to participant speech during unconstrained turn-taking. Therefore, we have identified a speech planning network central to natural language generation during social interaction.
Turn-taking during typical conversation can be divided into three major cognitive processes: perception of the opposing speaker’s turn, planning of one’s own turn, and production of the speech comprising that turn2, 21 (Fig. 1a,b). While each of these steps are comprised of several subcomponents12 (Extended Data Fig. 1a), speech planning is an especially multifaceted operation which encompasses various functions ranging from abstract conceptual and semantic processes to lower-level articulatory programming and motor initiation8, 12, 22–26. Accordingly, many cortical regions have been linked to aspects of planning, including inferior frontal gyrus7, 11, 13, 27, premotor cortex12, insula14, superior temporal gyrus9, supplemental motor area8, 28, and inferior parietal cortex10. However, because non-interactive language tasks – such as picture naming27, 29, 30, repetition7, 9, 11, 28, and reading7, 13 – have typically been used to identify such candidate regions, their relevance to speech preparation during interaction is unknown. In this study, we delineate the neural substrates underlying the planning processes relevant for rapid turn-taking by measuring cortical activity while participants engage in structured interactive tasks as well as unconstrained conversation.
Fig. 1 |.
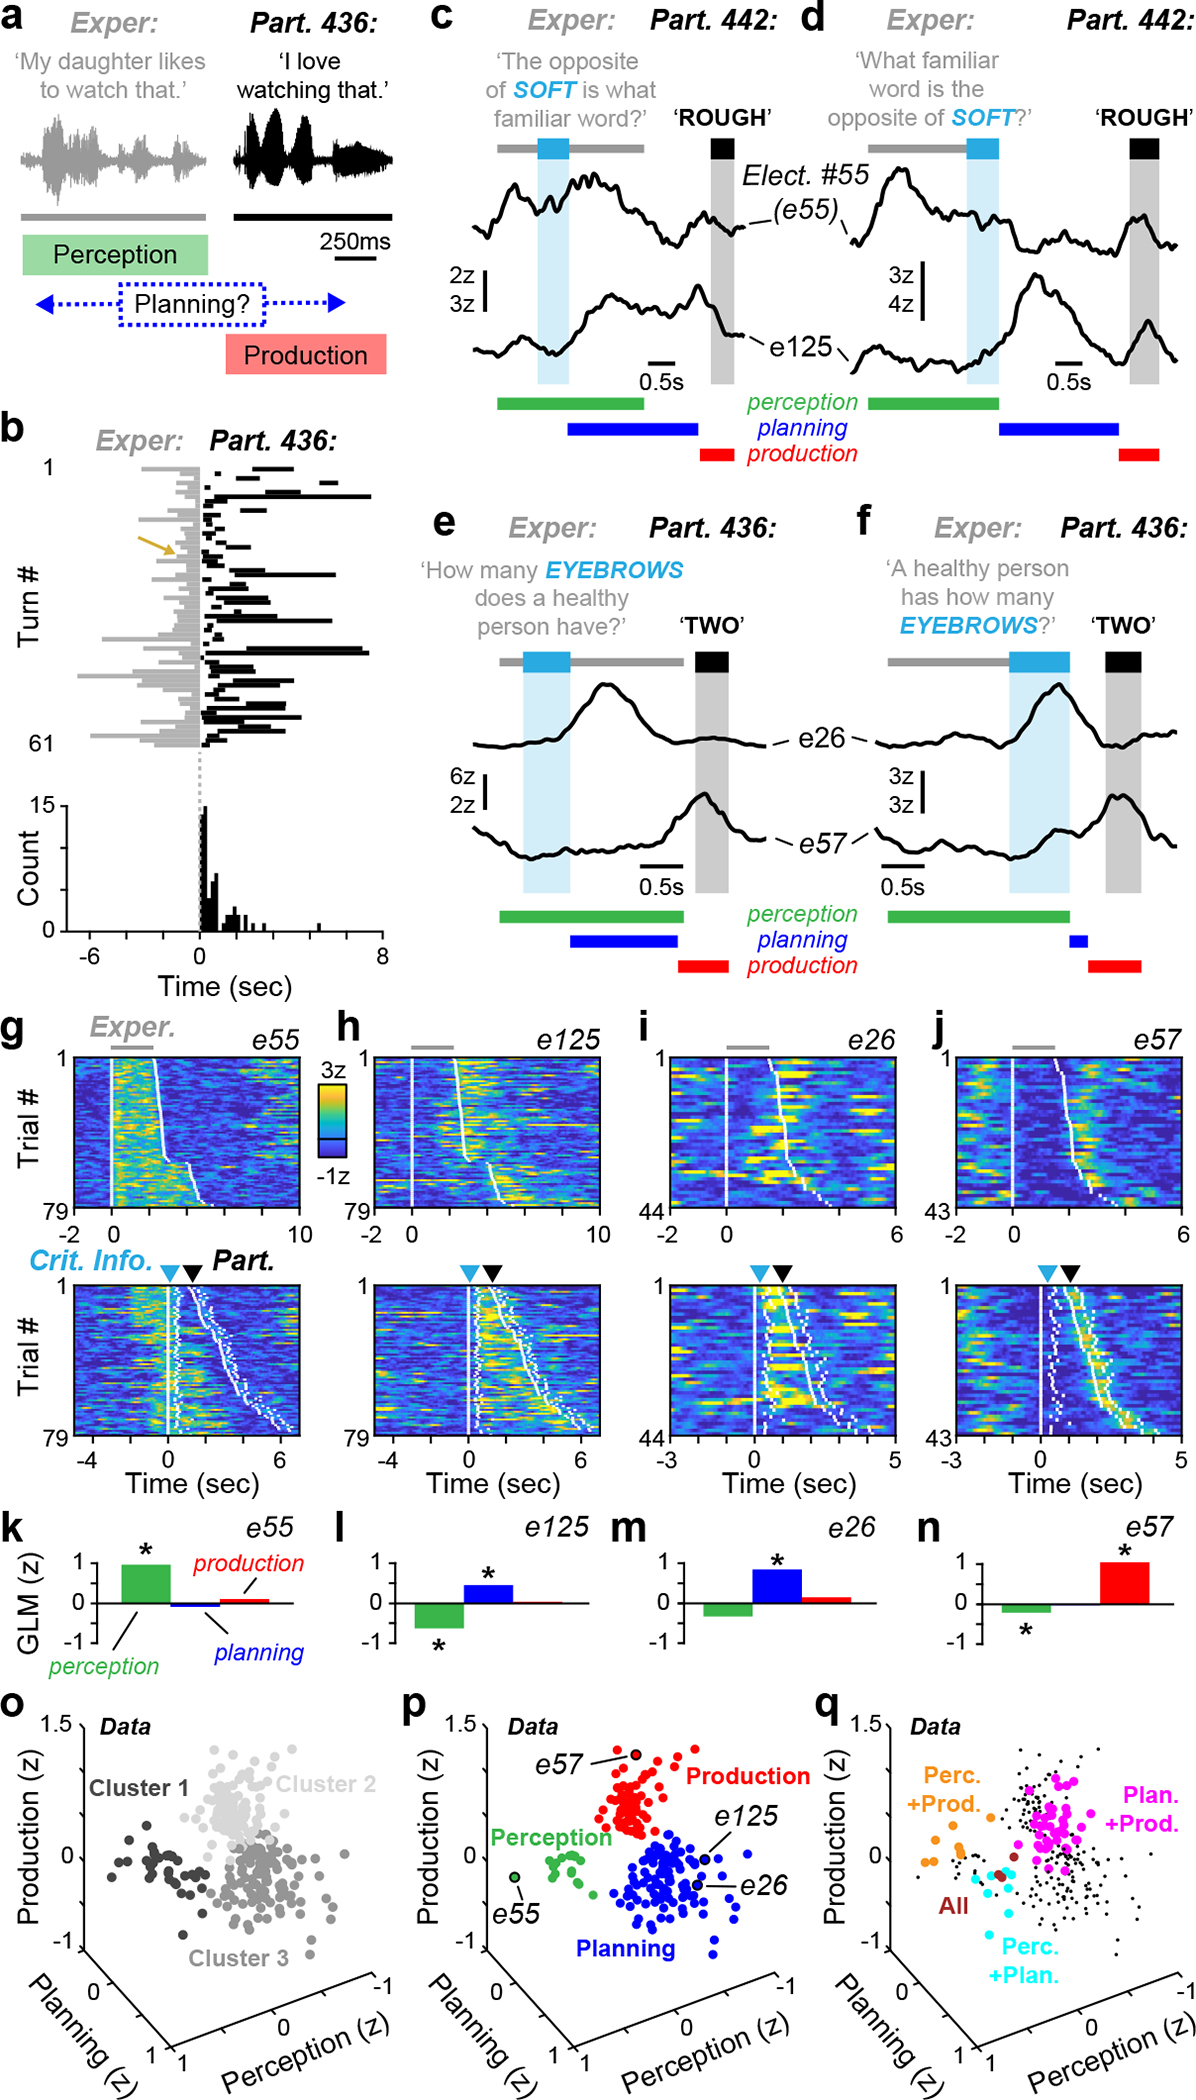
Cortical responses during interactive speech. a, Example interaction between the experimenter and participant 436 during conversation (top) with a diagram depicting the three behavioural phases of turn-taking (bottom). b, A schematic of all turn-taking interactions with participant 436 (top) and the associated distribution of inter-turn gaps (bottom). The gold arrow indicates an example interaction from a. c–f, Example early (c, e) and late (d, f) CI trials with high gamma activity from participants 442 (c, d) and 436 (e, f). The timing of the experimenter question, the CI and the participant answer are indicated with grey, light blue and black bars, respectively (coloured bars denote GLM regressor timing). g–j, Activity of the four example electrodes in c–f across all trials aligned to question (top) or CI (bottom): e55 (g), e125 (h), e26 (i) and e57 ( j). The white ticks denote the onset and offset of the task epochs indicated with coloured arrows in c–j. In c–j, the waveforms are smoothed for display (500-ms mean boxcar filter). k–n, Perception, planning and production GLM weights for the example electrodes in g–j, respectively. Significant weights are indicated with asterisks. o, The distribution of all task-responsive electrodes in GLM weight space. The cluster membership is indicated by the greyscale colour. p, q, The distribution of electrodes displaying responses in one window of the CI task (p) or multiple windows (q). The response class is indicated by colour. In q, unmixed electrodes from p are denoted by small black points.
Behavioral isolation of planning activity
A major barrier to the study of speech planning is that it is an internal process with little or no behavioral correlate31, 32 which often overlaps with speech perception and production during natural conversation2, 33–35. Therefore, we first sought to experimentally isolate the neural activity related to planning during turn-taking. To do so, we employed an established question-answer paradigm in which a single word (i.e., the ‘critical information’ or CI) initializes speech planning by providing the information necessary for a correct response33, 36 (Fig. 1c–f). An experimenter posed a battery of 39 to 94 CI questions (55.1 ± 20.5, mean ± SD; Extended Data Table 1) to 8 participants (i.e., neurosurgical patient-volunteers; Extended Data Table 2), in which the CI was presented either near the middle of the question (‘early’) or at its end (‘late’). If speech planning is initiated by CI, then late trials should display longer response latencies than early trials as they provide relatively less planning time2, 33. We observed that median reaction times were 64.6 ± 31.5% longer in late trials compared to early trials (median: 495 ms vs. 782 ms; p < 0.05 [n = 8 participants], signed-rank test; Extended Data Fig. 1b,c), indicating that the CI paradigm effectively isolates the core set of prearticulatory planning processes relevant to rapid turn-taking in our neurosurgical cohort.
We next examined cortical responses while participants answered CI questions. Previous work using this task reported widespread CI-related activity at the scalp using EEG33, 36, and we sought to leverage the temporal (> 10 ms) and spatial (> 5 mm) precision37, 38 of intracranial electrocorticography (ECoG) to measure planning activity at distinct cortical sites. We implanted a total of 874 ECoG electrodes across the left, language-dominant hemispheres of 8 participants (64 to 224 electrodes in each participant; Extended Data Table 3) and found 790 electrodes (90.4%) to be suitable for further analysis (for details related to exclusion criteria, see Methods). We assayed neural activity by examining the high gamma frequency band (~ 70–150 Hz) of the local field potential. Using this method, we observed many individual electrodes whose activity profiles were temporally locked to specific phases of these interactions (Fig. 1c–f). For example, perception-related activity remained sustained throughout the duration of the experimenter’s question (Fig. 1c,d), and production-related activity was largely restricted to the period comprising the participant’s spoken answers (Fig. 1e,f). In contrast, planning-related activity was observed immediately following CI presentation and generally returned to baseline prior to participant response (Fig. 1c–f). This profile was consistent across trials (Fig. 1g–j) regardless of CI position (i.e., early or late) or question type (Extended Data Fig. 1d,e).
Previous work has demonstrated that cortical language circuitry is highly multimodal39–41 and that processing for interactive behaviors may be widely distributed rather than organized into discrete modules42. Therefore, it is possible that the dynamics exhibited by our electrodes may be heterogeneous and form a continuum at the population level. Instead, neural activity may cluster into distinct categories, indicating that individual sites are specialized for specific phases of spoken interactions. To differentiate these alternatives, we designed a general linear model (GLM) to quantify activity levels during the perception, planning, and production windows of the CI task (colored bars in Fig. 1c–f; Extended Data Figs. 1f and 2). We focused our analyses on significant increases in high gamma amplitude – a correlate of local neuronal activity43–45 – and detected a total of 253 electrodes (32.0%) that were responsive during at least one of the defined task epochs (Fig. 1k–n, Extended Data Table 3). We then examined the organization of all task-responsive electrodes in three-dimensional space according to their perception, planning, and production GLM weights (Fig. 1o). If task-related activity represented a continuum, electrodes would be evenly distributed throughout this volume; however, we found that electrodes appeared to form three distinct clusters.
To test whether these putative clusters could have arisen from a continuum of neural activity as opposed to discrete response categories, we compared the recorded data to a ‘continuum model’ where activity related to perception, planning, and production (i.e., GLM weights) was randomly selected from independent unimodal distributions (see Methods) (Fig. 1p). In both observed and simulated data sets, we used an unsupervised approach (k-medoids) to define three activity clusters in GLM weight space (Fig. 1o,p). Electrodes exhibiting significant positive responses within the perception, planning, or production windows were invariably confined to separate clusters (Fig. 1q), while the same analysis using our simulated ‘continuum model’ always resulted in clusters containing multiple response types (interquartile range [IQR] of misclustered sites: 20.1–40.9%) (Fig. 1r, Extended Data Fig. 3a). Additionally, we found that only 61 electrodes (24.1% of responsive sites) in our recorded data displayed ‘mixed’ selectivity (i.e., positive responses within more than one task window, Fig. 1s), significantly fewer than expected under the continuum model (IQR: 44.3–48.6%) (Fig. 1t, Extended Data Fig. 3b). Taken together, these results indicate that neural activity recorded with our ECoG electrodes is organized into discrete categories related to speech perception, planning, and production during turn-taking.
We next examined the relative frequency of neural responses (i.e., significant positive GLM weights) related to each window of the CI task. We found responses related to planning and production were most common, with 20.3% and 15.3% of electrodes displaying significant increases in activity during the planning and perception windows, respectively. These planning and production electrodes often exhibited significant negative perception-related GLM weights (Fig. 1k–n, Extended Data Fig. 4a, Extended Data Table 3), reflecting a decrease in high gamma activity during the perception window of the CI task (Extended Data Fig. 4b). Meanwhile, only 4.6% of electrodes were responsive during the perception window, most likely resulting from sparse electrode coverage over auditory-related regions in temporal lobe46–49 (Extended Data Fig. 5a–c). However, we performed additional analyses to ensure that the temporal overlap of the perception and planning windows in early CI trials (~50% of trials; Fig. 1c,e) did not bias our analysis against detecting perception responses. We reanalyzed our data set with a reduced GLM lacking a planning component and found no net increase of perception-related electrodes (Extended Data Fig. 3c–e). These results demonstrate that our statistical approach and behavioral paradigm effectively delineated the cortical dynamics related to speech perception, planning, and production.
Spatial organization of planning responses
While ECoG has been previously used to map cortical regions related to speech perception46–49 and production12, 50, 51 with high spatial precision, the circuitry involved in speech planning remains poorly defined. For example, it is possible that planning-related sites are segregated to distinct cortical areas7–14, 27, 28; conversely, planning sites may instead be widely distributed across the cortical surface52 and share extensive territory with perception and/or production related sites39–41. To resolve this issue, we first examined the activity recorded in arrays of ECoG electrodes within individual participants. We observed that electrodes which were responsive for the same windows of the CI task (i.e., same GLM class) appeared to be spatially clustered (Fig. 2a,b; Extended Data Fig. 5a).
Fig. 2 |.
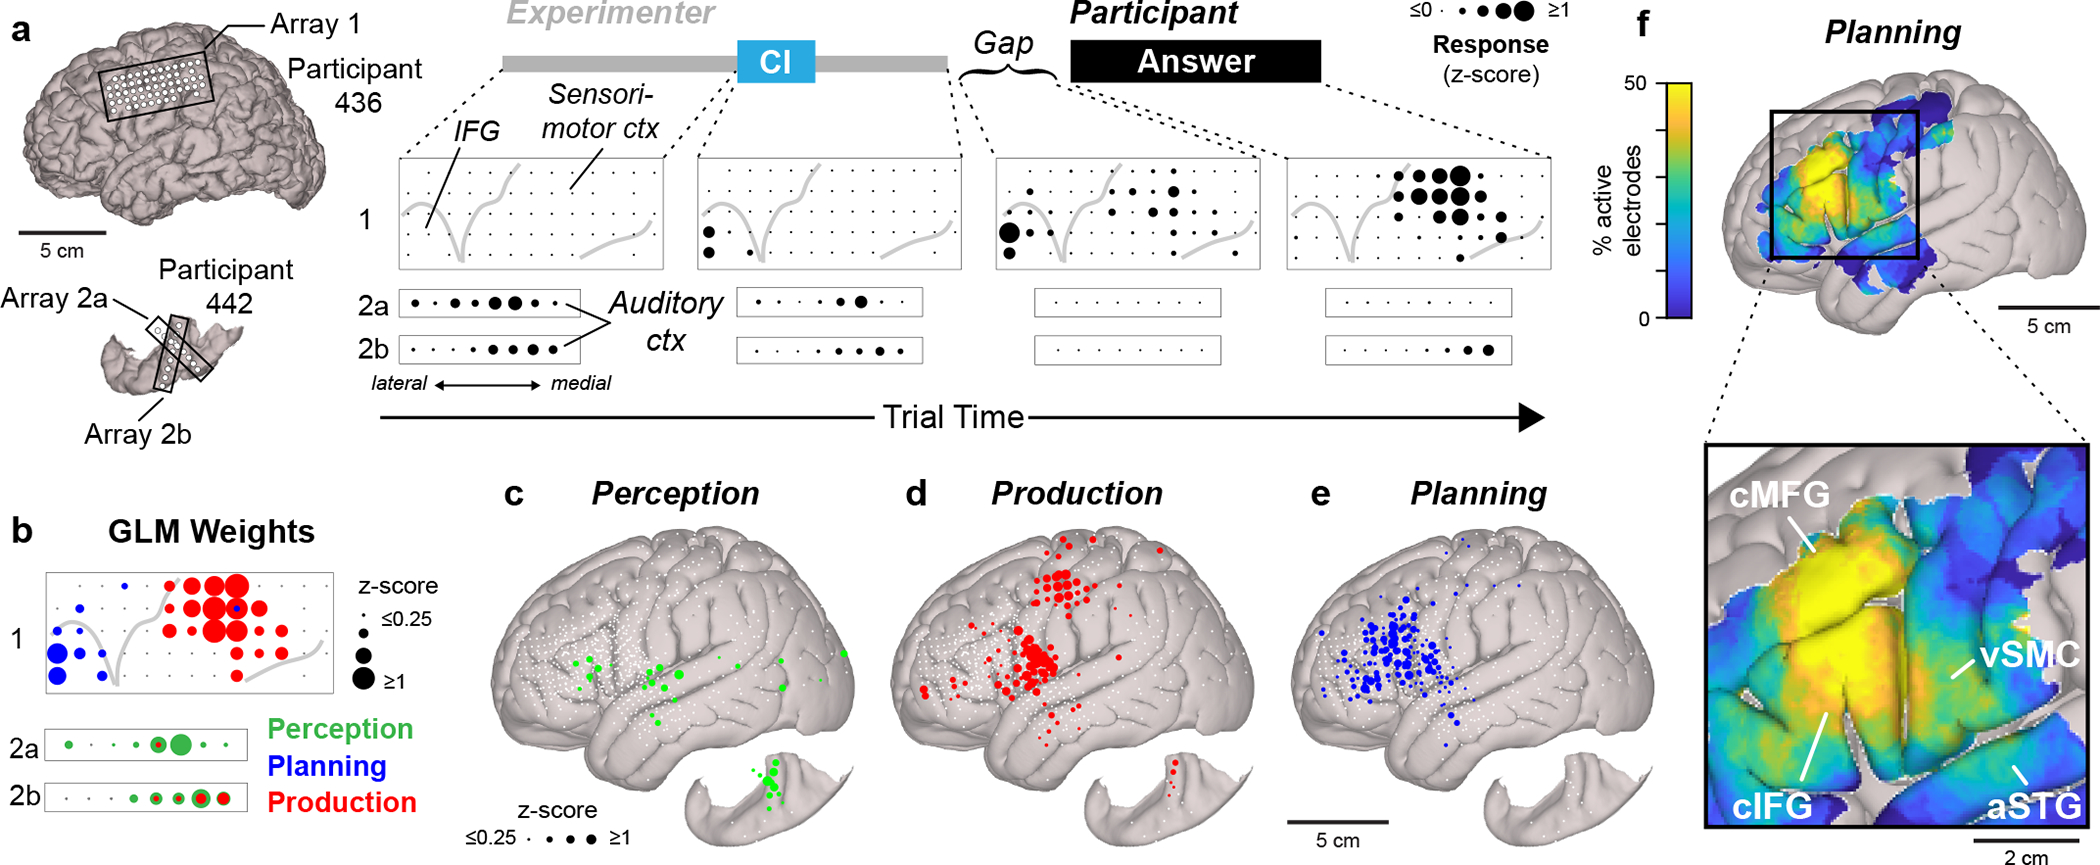
Spatial organization of speech planning responses. a, The average median high gamma activity across trials from electrodes on the left lateral cortical surface and superior temporal plane at different phases of the CI task. The electrode locations are shown on the left. Median values from time windows <50 ms were not included for analysis. b, GLM classification of the responses depicted in a. c–e, Canonical cortical surfaces displaying electrodes with responses related to speech perception (c), production (d) and planning (e) across all participants. Electrodes that did not display a significant response for a given process are indicated with small white circles. f, The proportion of electrodes displaying planning responses (1-cm-diameter spatial smoothing) (top) and regions displaying consistent planning responses in the CI task labelled on a magnified cortical surface (bottom).
We then determined the cortical location of all electrodes using precise anatomical reconstructions for each participant (Extended Data Table 3; see Methods) and observed spatially segregated cortical networks related to speech perception, planning, and production during the interactive CI task (Fig. 2c–e). Electrodes responsive during speech perception (Fig. 2c) and production (Fig. 2d) were largely restricted to well-characterized sensory and motor structures, respectively. Meanwhile, 95% of planning-related electrodes were grouped in a spatially segregated anterior frontotemporal region (Fig. 2e, Extended Data Table 3). Specifically, the highest densities of planning electrodes were clustered in caudal inferior frontal gyrus (cIFG) and caudal middle frontal gyrus (cMFG) with a small number of planning sites located in ventral speech motor and premotor cortices (vSMC) as well as anterior superior temporal gyrus (aSTG) (Fig. 2f). In contrast, the highest densities of production-related electrodes were tightly restricted to vSMC and dorsal SMC (Extended Data Fig. 5d). To ensure that these anatomical findings were not biased by the clinical condition of the participants, we generated separate coregistrations for tumor and epilepsy patients. This analysis revealed similar spatial patterns across groups (Extended Data Fig. 5e), indicating that the observed neuroanatomical organization is a robust feature of the human brain.
We found that many electrodes within vSMC, IFG, and cMFG exhibited significant negative perception-related GLM weights (Extended Data Fig. 4c–e), suggesting these planning and production-related structures are likely to be significantly less active during speech perception. However, some electrodes within IFG displayed perception-related responses (Fig. 2c), potentially reflecting a previously established role for IFG in language comprehension53.
Speech selectivity of cortical planning sites
To initiate speech planning in the CI task, one must first perceive and comprehend the spoken word comprising the CI. Therefore, a potential limitation of the task is that it does not completely disambiguate between the onset of speech planning and the cognitive processes involved in understanding the CI. We addressed this issue by designing a command-response (CR) task in which participants were instructed to perform a range of actions varying in their linguistic relevance (Extended Data Table 1), including: hand movements (i.e., button pressing) (‘CR1’, Fig. 3a), nonspeech orofacial behaviors (‘CR2’, Fig. 3b), repetition of words and pseudowords (‘CR3’, Fig. 3c), and performing linguistic operations (i.e., noun pluralization) (‘CR4’, Fig. 3d). Crucially, the structure of each CR task mirrors the CI task – a critical word or phrase is presented either early or late, and its comprehension is required to generate a motor response.
Fig. 3 |.
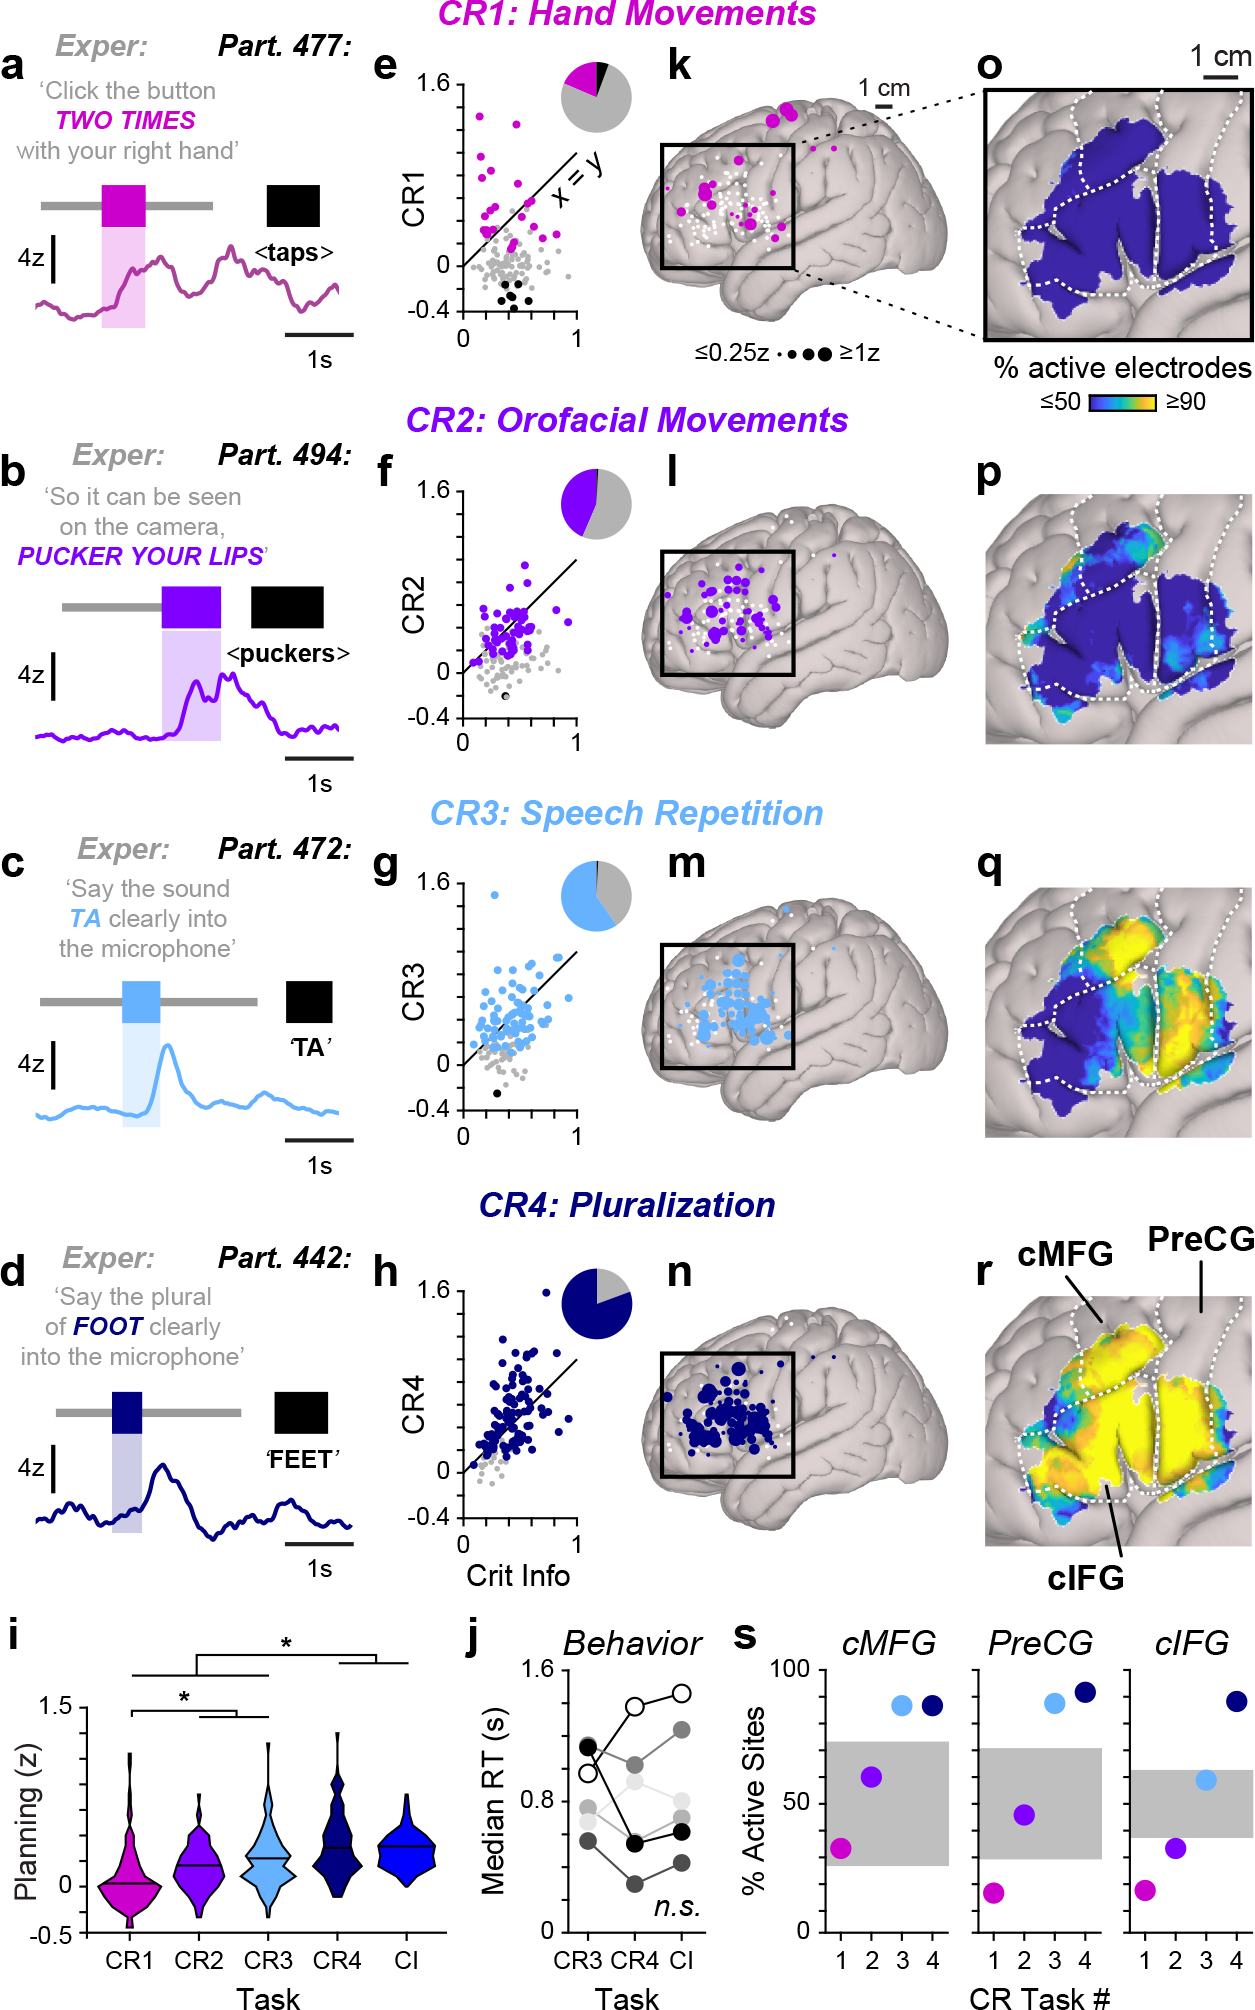
Linguistic selectivity of planning responses. a–d, High gamma activity in single trials of each CR task: nonspeech hand (CR1; a) and orofacial (CR2; b) movements, speech repetition (CR3; c) and pluralization (CR4; d). The timing of experimenter question, CI and participant response are indicated with grey, coloured and black bars, respectively. The waveforms are smoothed for display (250-ms mean boxcar filter). e–h, The planning weights for each CR task plotted against planning weights from the CI task. The inset pie charts indicate the proportion of planning electrodes that were significantly responsive (coloured), not active (grey) or suppressed (black) for each CR task. i, The distribution of planning weights for all planning-related electrodes in the CR and CI tasks. The asterisks indicate significant differences between tasks (P < 0.005, Friedman test with Dunn–Šidák post hoc tests). j, Median reaction times (RT) in late trials of the CR3, CR4 and CI tasks did not differ significantly (P = 0.34, Friedman test; NS, not significant). k–n, Canonical cortical surfaces indicating electrodes with planning responses for each CR task. Electrodes that did not produce a significant response for a given task are denoted by small white circles. o–r, The proportion of planning electrodes showing significantly elevated responses in each CR task (1-cm-diameter spatial smoothing). The dashed lines indicate approximate boundaries of the cMFG, the PreCG and the cIFG. s, The percentage of electrodes located within each structure that displayed planning responses for each CR task. The distribution of percentages generated with shuffled data is indicated in grey.
Using this behavioral approach, we further characterized electrodes that had displayed significant planning-related responses in the CI task (n = 124 electrodes from 6 participants; see Methods and Extended Data Table 2). Although we observed individual planning electrodes which responded maximally in each of the CR tasks (Fig. 3a–d), we found that only a subset of electrodes displayed significant increases in preparatory activity for hand (18.6%) and nonspeech orofacial movements (43.6%), while the majority were responsive for speech repetition (59.7%) and pluralization (80.7%) (Fig. 3e–h). At the population level, planning activity levels were lower for manual movements than for all other behaviors and higher while preparing plural nouns compared to all other actions (p < 0.005 [n = 124 electrodes], Friedman Test with Dunn–Šidák correction); however, planning activity in the pluralization task did not differ in magnitude from the CI task (p > 0.99 [n = 124 electrodes], Friedman Test with Dunn–Šidák correction) (Fig. 3i). To test whether our results could have arisen due to task difficulty, we compared participant reaction times for late CI trials of the repetition task, pluralization task, and CI questions and found no significant difference (p = 0.3114 [n = 6 participants], Friedman Test; Fig. 3j). These results indicate that activity within the identified planning network is more likely to reflect speech preparation rather than other processes related to task engagement.
The CR tasks also allow us to assess the degree to which planning network dynamics are specific for preparing speech as opposed to representing more generic premotor processes supporting a wide range of behaviors9, 54–56. While electrode sites within network were generally more active while planning speech as opposed to nonspeech tasks (Fig. 3e–i), we hypothesized that subregions within the circuit may display variable degrees of speech selectivity. We explicitly tested this notion by first examining planning activity levels in relation to cortical location, and we observed higher levels of preparatory activity broadly within the planning network as linguistic relevance increased (Fig. 3k–n). However, upon further inspection, we found that planning electrodes within cIFG were more linguistically selective than electrodes located in the precentral gyrus (preCG) and cMFG (Fig. 3o–r). While most preCG and cMFG electrodes displayed significant planning responses in both speech tasks, electrodes in cIFG were generally responsive only for the pluralization task (Fig. 3q–s). This result demonstrates that our planning circuit may be further divided into subnetworks which are likely related to distinct speech planning processes.
Speech planning during natural conversation
We next aimed to compare the neural activity observed during task-based interaction to that generated during natural language use. To do so, we used the same electrode arrays from our structured tasks to record neural activity in participants engaging in unconstrained conversation with the experimenter for 2.8 to 16.3 minutes (7.5 ± 4.0 minutes; Extended Data Fig 6a) following task completion. In this unstructured context, we found that our neurosurgical cohort exhibited grossly normal turn-taking behavior; all participants were capable of rapid responses (i.e., gap durations < 250 ms) while 6 of 8 participants displayed modal gap values of 200 ms or less (Extended Data Fig. 6b), which is comparable to conversational response times observed in the general population2–4. Thus, these rapid interactions provide an important opportunity to investigate the neural mechanisms enabling naturalistic turn-taking.
During conversation, we observed that individual electrodes displaying significant planning responses in the CI task were often active prior to the onset of a participant’s turn (Fig. 4a), suggesting these sites are engaged in speech preparation during both behaviors. However, unlike our interactive tasks – where perception of a single word (i.e., the CI) is necessary to initiate planning – a speaker is free to begin response preparation and to update their response plans at any time during conversation. Furthermore, behavior during conversation is also highly flexible, with factors such as turn duration and complexity (i.e., syntactic structure, semantic content, etc.), inter-turn gap duration, and planning strategy varying widely both within and across speakers3, 35, 36, 57–59. Due to this behavioral variability, a supervised analysis of language-related neural activity during natural turn-taking is unfeasible as the content and timing of planning is uncontrolled.
Fig. 4 |.
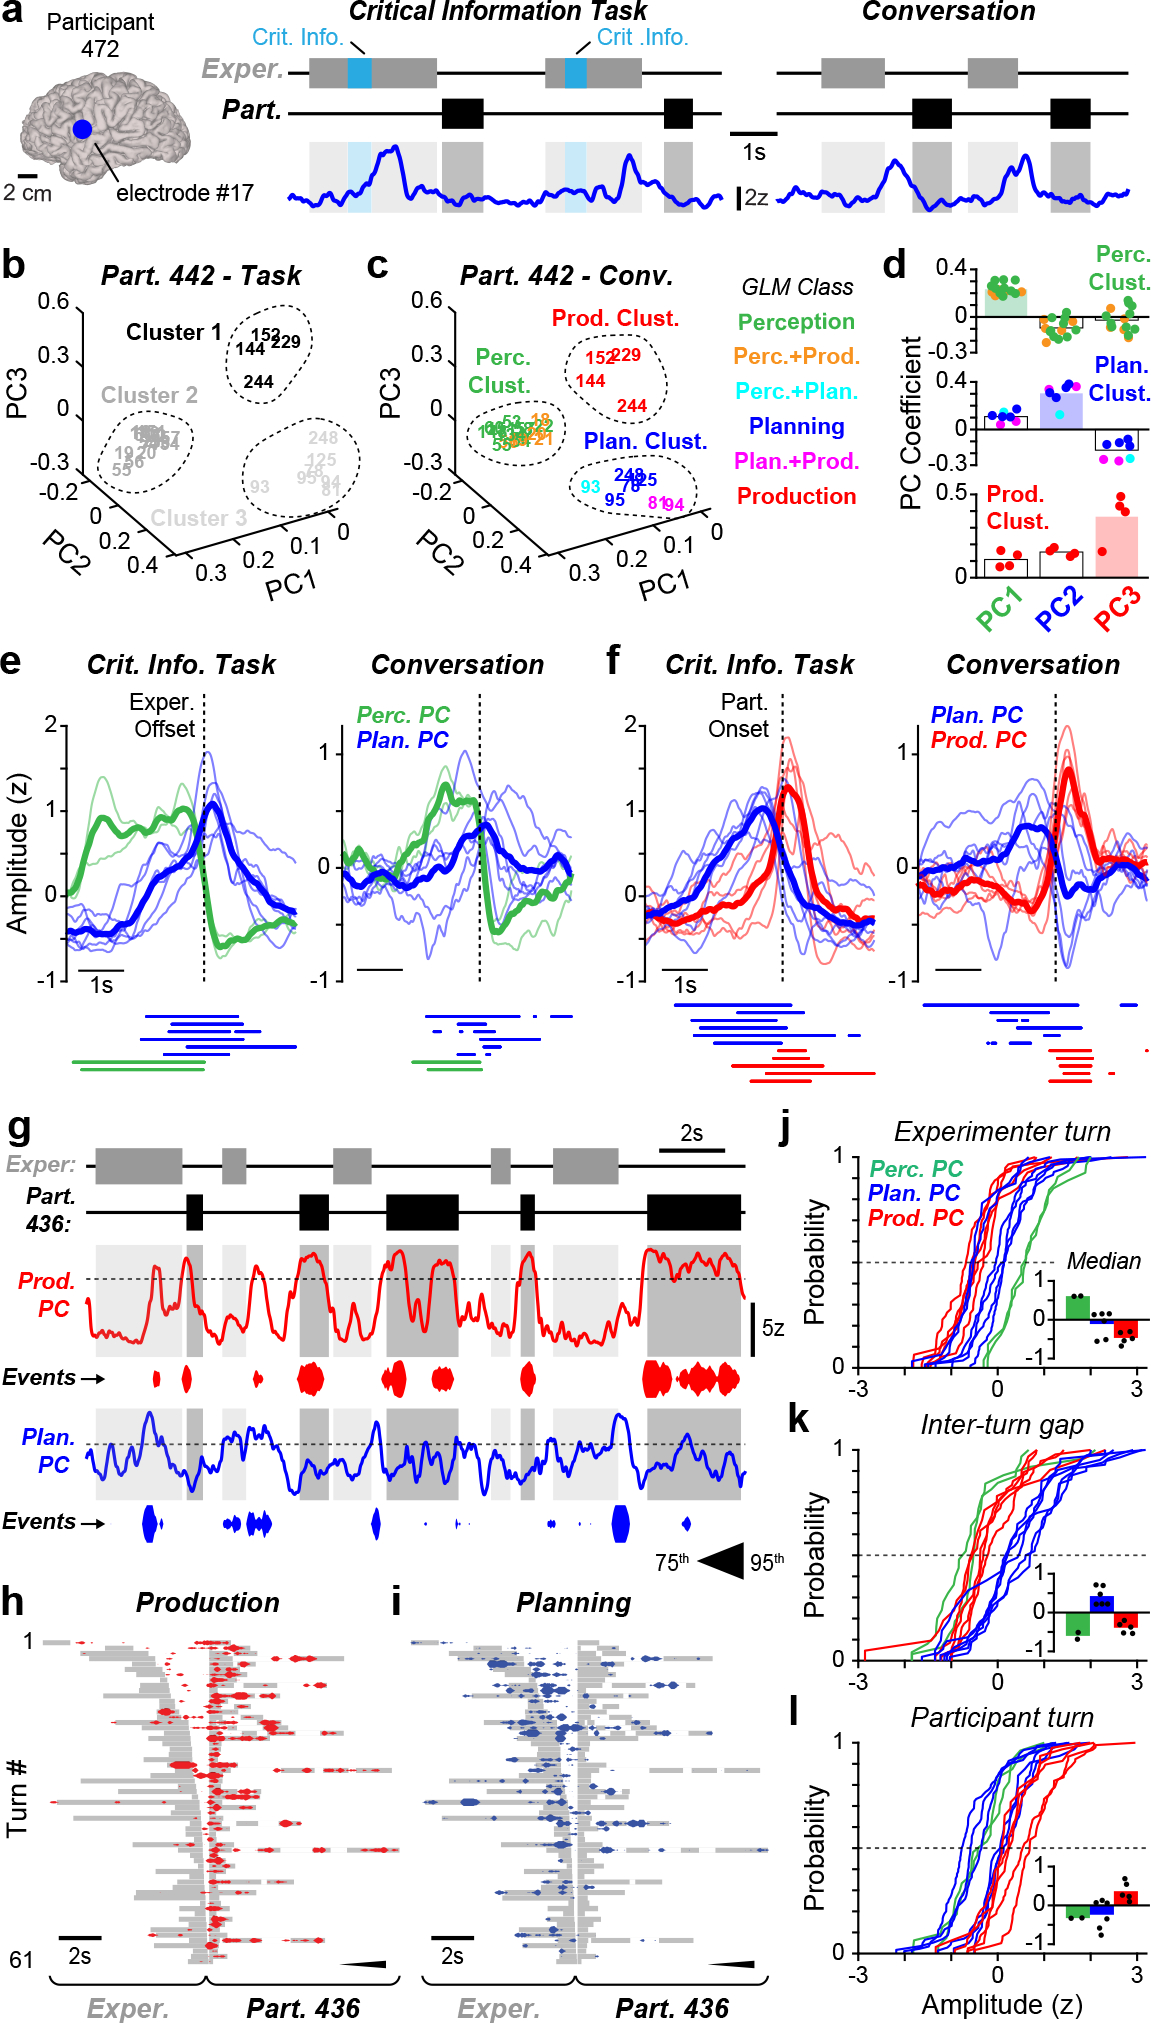
Planning activity during natural conversation. a, High gamma activity from an example planning electrode in participant 472 (left) during the CI task (middle) and unconstrained conversation (right). The waveforms are smoothed for display (250-ms mean boxcar filter). b, c, For all CI task-responsive sites in participant 442, the electrode activity distribution in PC coefficient space during the CI task (b) and conversation (c). The dashed outlines indicate clusters and the numbers denote electrode identity. d, The PC coefficients for electrodes in each cluster from c. The individual electrode coefficients are depicted as points, the averages are indicated with bars and functional PC categorization is designated by bar colour. e, f, The average activity of perception and planning PCs aligned to the offset of experimenter speech (e) and planning and production PCs aligned to the onset of participant speech (f) in the CI task (left) and conversation (right). The thin and thick lines indicate responses from individual participants and the average across participants, respectively. Periods of significantly elevated activity for each participant are denoted with bars under plots (P < 0.05, permutation test). g, Example production and planning PC activity during conversation with participant 436. The activity is displayed both as a waveform and by events whose thickness is scaled to PC amplitude (75th to 95th percentile). h, i, Timing of production (h) and planning (i) events for all interactions during conversation with participant 436. The events aligned to participant turn onset and ordered by gap duration. The grey boxes represent experimenter and participant turn timing and unfilled pauses during participant turns left as whitespace. j–l, Empirical cumulative distribution functions of median perception, planning and production PC activity in experimenter turns ( j), inter-turn gaps (k) and participant turns (l). Each line represents data from an individual participant. The inset plots depict the median value for each distribution as dots and the average median value across PCs as bars.
To overcome this issue, we performed Principal Component Analysis (PCA) on continuous electrode signals (~ 10 minutes) recorded while participants engaged either in the interactive tasks or natural conversation. This approach allowed us to identify sets of electrodes displaying correlated signals during task performance and conversation independently and to assess whether network organization remains stable between these two contexts. When participants were engaged in the structured tasks, we found that electrode signals formed three main clusters in three-dimensional PC coefficient space (n = 6 participants; Fig. 4b, Extended Data Fig. 7a–f), indicating that neural activity during task-based interactions is organized into distinct classes. We then asked whether this organization is preserved in unstructured turn-taking (Fig. 4c) and found that electrode signals formed nearly identical clusters during conversation (Fig. 4d, Extended Data Fig. 7a–f). Only 5 of 200 electrodes were differently clustered between the two behaviors, significantly less than would be expected by chance (IQR: 120–128; p < 0.0001, permutation test; Extended Data Fig. 6d). Therefore, these results demonstrate that the cortical network active during language generation in task-based interactions is similarly organized during natural turn-taking.
Our next goal was to determine whether the PCA activity clusters observed during natural conversation corresponded to neural responses related to speech perception, planning, and production. These functional classifications were originally made using a GLM (e.g., Fig. 1), which detected elevated neural activity within predefined time windows of the CI task (Fig. 4e). Importantly, we found that electrode clusters in PC coefficient space were overwhelmingly comprised of electrodes exhibiting a single class of response in the CI task (Fig. 4f, Extended Data Fig. 7a–f). We were consequently able to functionally categorize each PCA cluster as ‘perception’, ‘planning’, or ‘production’ in 17 out of 18 cases across participants (Fig. 4f, Extended Data Fig. 7a–f). We observed a high degree of correspondence between cluster categorization and GLM-derived activity classes, such that 93.8%, 94.7% and 96.1% of electrodes in perception, planning, and production clusters displayed significant perception, planning, and production responses, respectively (p < 0.0001, permutation test; Extended Data Fig. 6e). Therefore, using our unsupervised PCA analysis method, we uncovered categories of neural activity during natural conversation which correspond to the distinct response classes and circuits isolated with the CI task (Extended Data Fig. 6f).
We next examined the functional properties of electrodes within perception, planning, and production clusters in relation to task-based and natural turn-taking by assaying time-varying PC activity (i.e., PC scores). Specifically, we found that each category of cluster was highly weighted for an individual PC (Fig. 4g). We employed these maximally weighted PCs as an aggregate signal reflecting the overall activity of each cluster and further analyzed 2 perception-related PCs, 6 planning-related PCs, and 5 production-related PCs, excluding 4 clusters which primarily contained electrodes displaying mixed responses (Extended Data Fig. 7; see Methods). Across participants, we observed that planning PCs displayed a significant peak in average activity near the offset of experimenter speech which continued into the inter-turn gap during both the task and conversation; conversely, perception PCs were active during the experimenter turn but sharply decreased in activity at the offset of experimenter speech (p < 0.05, permutation test; Fig. 4h). Planning PCs likewise exhibited a peak in activity prior to participant turn onset for both the task and conversation, while production PC activity occurred later and typically during participant speech in both contexts (p < 0.05, permutation test; Fig. 4i). These results demonstrate that the functional properties of PCs related to speech perception, planning, and production during unconstrained turn-taking are congruent with the responses observed during the structured CI task.
Finally, we examined planning PC activity in individual turn-taking interactions to provide a first description of speech planning-related dynamics during natural conversation. Consistent with the average response profiles discussed above, we observed planning-related PCs to be most active during the experimenter turns and the silent gaps prior to participant turns; these responses differed dramatically from production-related PCs, whose activity was largely restricted to periods of articulation (Fig. 4j–l). Across participants, we likewise found that planning PCs displayed maximal activity levels during inter-turn gaps while the perception and production PCs were most active during the experimenter and participant turns, respectively (Fig. 4m–o; Extended Data Fig. 6g). Taken together, the functional properties displayed by the planning-related PCs are consistent with speech preparation during conversation, indicating that these signals represent the neural correlates of the speech planning processes enabling rapid turn-taking during natural language use.
DISCUSSION
Conversational turn-taking requires a complex interplay of simultaneous speech perception and planning coupled with finely timed speech production. We used high-precision ECoG recordings to isolate planning-related dynamics and found planning responses to be functionally and anatomically distinct from dynamics underlying speech perception and production. We further observe that these distinct classes of neural activity exist during both structured interactions as well as unconstrained conversation, thus paving the way for future studies of naturalistic speech generation by providing the first explicit description of neural dynamics arising in natural language use. Although previous work has suggested that the neural circuitry related to human language is highly multimodal39–41 and distributed12, 52, 60, our findings indicate that separate cortical modules perform distinct functions within the language network during ethologically-relevant interactive speech production12, 22. This conclusion is consistent with perturbation studies of human language circuitry61–64 as well as investigations of cortically-dependent vocalizations in animals demonstrating the existence of anatomically-distinct subcircuits within larger vocal production systems65–67.
Our findings demonstrate that planning-related responses during interaction are largely restricted to a frontotemporal circuit centered on cIFG and cMFG which is located within the broader peri-Sylvian language network. The caudal portion of IFG (pars opercularis and pars triangularis) is thought to represent Broca’s region68, which is classically considered to be crucial for speech production15, 16. However, more recent work has demonstrated that this region is active prior to – rather than during – articulation7, 27, 30. Using our interactive paradigm, we also observe that responses in cIFG occur primarily prior to speech initiation, and we show that this activity is specifically associated with planning speech. Unlike cIFG, cMFG had not previously been considered to be important for speech planning or production17–20, 69, although a case of pure apraxia of speech following its focal resection has been recently reported17. Here we show for the first time that cMFG is involved in speech-selective planning during interaction. This region displays robust anatomical connectivity with cIFG70, as well as other language-related regions17, 71 and therefore represents an important cortical site for future study as its role in language generation has been largely overlooked.
It is likely that cIFG and cMFG perform distinct functions related to speech planning, as evidenced by differing levels of speech selectivity exhibited during the command-response tasks. However, future work is necessary to elucidate the specific planning subprocesses encoded by these and other nodes within the identified planning network and how these subprocesses unfold on a moment-to-moment level during turn-taking. Nevertheless, the isolation of this planning circuitry represents an important advance towards understanding how the human brain generates language in naturalistic contexts and complements parallel efforts in the wider field of neuroscience aimed at quantifying natural behavior broadly72. Furthermore, this work helps lay a foundation for future studies investigating the biological basis of communication disorders – such as stuttering and apraxia of speech – which disrupt social language use as a result of abnormalities in speech planning73–75.
METHODS
Participants
Participants were patient-volunteers undergoing surgical treatment at the University of Iowa Hospitals and Clinics for medically intractable epilepsy or brain tumors who consented to participate in research. Patient participants were undergoing treatment with implanted ECoG electrodes for seizure focus determination or for required awake craniotomy. All procedures were approved by the University of Iowa Institutional Review Board. Patients were confirmed to be left-lateralized for language production with Wada testing and/or were confirmed to be right-handed or ambidextrous (Extended Data Table 2).
Behavioral Tasks
Three behavioral tasks were included in this experiment:
(1). Critical information (CI) task
CI questions were adapted from an established Dutch stimulus set33, 36. We developed 120 similarly structured English questions which were divided among three categories (animals, body parts, and antonyms). Each category features pairs of questions with the same CI in which the CI was presented either early or late (e.g., Fig. 1c–f). The full list of CI questions is provided in Extended Data Table 1.
CI questions were read to the participant by an experimenter, who instructed the participant to respond as quickly as possible. Questions were presented in random order and varied slightly in exact wording from experiment to experiment. All CI questions could be answered with a single word, although participants occasionally responded with a short phrase.
(2). Command-response (CR) tasks
The four CR tasks were performed in a randomized order interleaved with CI task trials in all cases except one, where it was completed as a separate block (Extended Data Table 2). A full list of all CR stimuli is presented below in Extended Data Table 1. In CR1 (hand movements), participants performed movements that engage muscles unrelated to speech production. Specifically, participants pressed a spring-loaded button using their right hand a variable number of times, ranging from 1 to 4. In CR2 (orofacial movements), participants were instructed to carry out nonspeech orofacial tasks, specifically smiling, mouth opening, tongue protrusion, and lip puckering. The movements were recorded with a video camera and time-stamped with a common time scale to the ECoG recordings. In CR3 (speech repetition), participants repeated monosyllabic real words and/or monosyllabic or disyllabic pseudowords. In CR4 (pluralization), participants were instructed to produce the irregular and/or regular plural form of common monosyllabic nouns (e.g., ‘goose’ → ‘geese’). See Extended Data Table 2 for the specific tasks completed by each participant.
(3). Unconstrained conversation
Following completion of the CI and CR tasks, the experimenter engaged the participant in unconstrained conversation. Participants were given no specific instructions during this portion of the experiment other than to speak naturally.
Data Acquisition
For awake craniotomy patients, local field potentials were recorded with either a custom 64 channel grid engineered at the University of Iowa or with commercially available subdural grids manufactured by Ad-Tech Medical or PMT. Signals were amplified, bandpass filtered (0.7–800 Hz) and sampled at 2034.5 Hz using a multichannel amplifier and digital acquisition system (PZ2 preamplifier and RZ2 processer; Tucker-Davis Technologies). For chronically implanted epilepsy patients, electrophysiological signals from subdural electrode grids and strips (AdTech) were bandpass filtered (0.1–500 Hz) and recorded at 2000 Hz with a multichannel amplifier and digital acquisition system (Atlas system, Neuralynx). Analog input channels synchronized with the neural recordings additionally marked the timing of participant button presses and the output of a microphone which captured the speech acoustics of the experimenter and participant. Input channels were sampled at 48,828 Hz by the TDT system and 16,000 Hz by the Neuralynx system and downsampled offline to 12,000 Hz. In addition to the electrical signals, a video of the participant was also acquired at 24 fps during all experiments. The video was synced to the electrophysiological data after the experiment and provided a secondary high-quality audio recording channel of the experiment, which was sampled at 48 kHz.
Behavioral Analysis
The audio acquired with the electrophysiological acquisition system and/or camera was then annotated by a trained phonetician (G.A.C.) to determine the onsets and offsets of all experimenter questions/commands, CI, and participant responses for the CI and CR tasks. Trials where the participant failed to respond, requested additional information (e.g., asking for the question to be repeated), or produced a filled pause or disfluency (e.g., saying ‘um’ or stuttering) prior to responding were excluded from further analysis. Trials in the CR task where a participant failed to accurately complete the command (e.g., repeating a word when instructed to say the plural form of the word) were deemed incorrect and excluded from analysis. In the CR task, the onset and offset of hand movements were determined using the electrical signal from the button which was acquired simultaneously with the local field potentials and were defined as the onset of the first press and offset of the last press of the trial, respectively. For the CR trials requiring orofacial movement responses, the onset and offset of movements were estimated as the timing of the first and last frames of the video where movements were clearly observed.
The audio of the unconstrained conversation was also annotated to provide timestamps for the onsets and offsets of all experimenter and participant turns. Turns were considered continuous segments of speech that were uninterrupted by the other speaker. However, experimenter turns were occasionally truncated at silent pauses (i.e., unfilled pauses) if the experimenter spoke continuously for periods in excess of 10 seconds. Silent pauses produced by the participant were annotated within the participant’s turns. Additionally, during the participant’s speech, the experimenter sometimes produced backchannels (e.g., ‘okay’, ‘yes’, to display interest) that would not result in termination of the participant’s turn. In such cases, we did not consider these events turn-taking on behalf of the participant as they did not yield the floor. Interactions where the participant responded with a backchannel were noted (e.g., Extended Data Fig. 6a) but were defined as turn-taking events on behalf of the participant. Finally, interactions where speaker overlap rendered reliable annotation impossible were not considered for analysis.
Anatomical Reconstructions
Electrode localization in intraoperative patients
In intraoperative cases, electrode localization and coregistration was performed using intraoperative photographs and perioperative T1-weighted MRIs obtained over the course of the clinical workup. Magnetic resonance images were processed using the ‘recon-all’ pipeline in FreeSurfer to generate cortical surface meshes and to obtain surface-based coregistration to an anatomical template space76. Intraoperative photographs of the craniotomy and electrode arrangement were then aligned to renderings of the surface meshes according to a visual comparison of gyral anatomy. Image-based localization was carried out by two raters (G.A.C. and C.K.K.) and, when discrepant, reconciled by an additional rater (J.D.W.G.). Finally, a subset of electrode locations was identified in image RAS coordinate space by selecting the vertex within the surface mesh nearest the electrode location, as observed in the aligned intraoperative photograph. Remaining locations were determined through thin-plate spline (TPS) interpolation, according to the geometry of the electrode grid.
Electrode localization in chronically implanted patients
Patients with chronically implanted electrodes underwent CT and MR imaging before and immediately after implantation. Electrode locations were identified in post-implantation images based on characteristic metallic artifacts: localized magnetic susceptibility-related voids in MR images and punctate radiodensities in CT images. Electrode coordinates were transformed to the pre-implantation image through an initial linear image coregistration followed by a manually guided TPS warping. Coordinates aligned to corresponding anatomical landmarks in pre- and post-implantation imaging, identified through visual comparison of the linearly coregistered images, served as control points in the TPS warping
Electrode coregistration
For all patients, anatomical categorization of electrode sites was guided by surface-based coregistration and segmentation implemented in Freesurfer77 using the DKT atlas78, 79. Following automatic parcellation, the location of each electrode according to the DKT atlas labels was confirmed by three raters (G.A.C., C.K.K., J.D.W.G.) and corrected if necessary. Electrode locations were then transformed into MNI space using symmetric diffeomorphic registration implemented in the ANTs toolbox80 to obtain a nonlinear coregistration between the patient’s pre-operative T1 image and an MNI-aligned template brain (CIT168 template)81.
For analyses where electrodes from individual participants were rendered a canonical cortical surface (e.g., Fig. 2c), electrodes were plotted on the gyral surface of the MNI152 brain. For analyses of electrode response density (e.g., Fig. 2f), the proportions of electrodes displaying a given response profiles in 1 cm diameter regions of the canonical cortical surface were calculated for areas with electrode coverage from at least 3 participants.
ECoG Signal Preprocessing
Prior to preprocessing each participant’s electrophysiological data, nonresponsive channels were first identified and excluded (Extended Data Table 3). Such channels were clearly identifiable as they displayed signal variances markedly lower than active channels. Next, artifactual periods were identified in the active channels by iteratively thresholding at an absolute z-score threshold of 9 (calculated across the entire recording) and blanking all signals within 2 seconds of the suprathreshold period. Z-scores were then recomputed, and the procedure was repeated with undiscarded samples until all samples fell below the threshold. Any CI or CR trials occurring within one second of a blanked period were not considered for analysis.
Next, the electrophysiological data were preprocessed by filtering stationary and non-stationary line noise using adaptive thresholding applied to coefficients of the demodulated band transform82 with a bandwidth parameter of 0.25 Hz. The data were then high-pass filtered at 5 Hz with a FIR filter and re-referenced to the common average signal on a per-grid basis83. Finally, high gamma band amplitude was calculated for each channel by averaging the analytical envelope across 8 frequency bands of logarithmically increasing center frequency (73–144 Hz) and standard deviations (4.68–6.62 Hz)50 and resampled at 500 Hz. As artifacts were commonly observed at the beginning and end of recordings, these periods (the first and last ~5 seconds) were blanked in both the raw and high gamma signals. Finally, the high gamma signals for each channel were z-scored across the entire recording duration. Only electrodes located on the cortical surface were included in the analyses described in this paper. Any sites within white matter, not contacting the brain, or deep within cortical or subcortical structures were not considered, and any electrodes determined to have been located on seizure foci or tissue included in the subsequent resection were excluded from further analysis.
Active Site Detection using Generalized Linear Modelling
To identify electrodes displaying signals significantly correlated to speech perception, planning, and production in the CI task, we used mass univariate generalized linear modelling (GLM) in an approach similar to the statistical parameter mapping procedure used in functional MRI84 and ECoG85 studies. For each participant, we first constructed four block regressors using the temporal structure of each CI trial (depicted in Extended Data Fig. 1f): 1) a regressor which was active from experimenter question onset to participant answer offset, which was included to regress out any activity that was globally correlated with trial engagement but not with any specific feature of the task (e.g., attention); 2) a regressor which was active from question onset to question offset to identify activity correlated with speech perception; 3) a regressor which was active from CI offset to 200 ms prior to answer onset (as articulatory movements not immediately resulting in an acoustic consequence can occur hundreds of milliseconds prior to the acoustic onset of speech31, 32) to identify activity correlated with planning; and 4) a regressor which was active from 200 ms prior to answer onset until answer offset to identify activity correlated with participant speech production. A 250 ms buffer where no regressors were active was included prior to trial onset and after trial offset. The regressors for each trial along with the associated high gamma signals (downsampled to 100 Hz for computational efficiency) were then concatenated and GLM fitting was performed. This analysis was carried out using the ‘glmfit’ function in MATLAB (Natick, MA, USA) with a normal distribution and identity link function specified (therefore, general linear modelling was specifically performed).
To assess significance, we used a resampling method where the GLM was iteratively performed on a randomly selected subset of 80% of trials over 100 repetitions with replacement. This resampling technique was then repeated to apply the trial structure to random epochs of high gamma data whose duration matched the actual data. This allowed us to generate empirical distributions of actual regressor weights, weight p-values, and full-model correlation coefficients as well as null distributions for analogous values generated with shuffled signals. For an electrode’s individual regressor weights to be considered significant, two criteria must have been met: 1) the two-tailed 95% confidence interval obtained from the empirical distribution of individual regressor weights could not include 0 or the mean shuffled weight for that regressor and 2) the logscale distribution of the weight p-values could not include the Bonferroni-corrected alpha value of 0.05 at the 95th percentile.
To confirm that the responses of individual electrodes were well-fit by the specific temporal structure of the CI questions, we used a jittering analysis. Specifically, we performed the resampling technique described above on high gamma signals that were incrementally shifted in uniform 500 ms steps from zero lag to an absolute maximum jitter of 10 seconds, and the mean full model R value over 100 repetitions was recorded at each step for all electrodes (Extended Data Fig. 2a). We then collected random subsets (with replacement) of R values from the jittered models such that all participants contributed data from an equal number of electrodes (n = 44, 75% of the count from the participant with the fewest electrodes). To quantify the temporal precision of each electrode’s fit to the CI task data, we subtracted the median value of large jitters (−10 to −4 seconds) from the maximum R value of small jitters (−2 to 2 seconds), a value we refer to as delta (D). We included only large negative jitters in the calculation of D to avoid inadvertently fitting activity related to the subsequent trial at high positive jitters with the short duration regressor corresponding to the participant’s answer (~0.5 s). We observed that the pooled distribution of D values across participants was bimodal, with electrodes whose activity was fit poorly to the temporal structure of the CI task forming a cluster that was distinct from electrodes whose activity fit the task structure well. To isolate these two distributions, we then fit the D distribution with a mixture of two Gaussians after excluding values above the 95th percentile to reject outliers (Extended Data Fig. 2b). We then used the Gaussian representing the distribution of poorly fit electrodes to empirically define a D threshold by calculating the value at which 95% would be excluded (1.96 standard deviations from the mean) (Extended Data Fig. 2b). This procedure was repeated 1000 times and the median D threshold was calculated across iterations. Any electrode whose D value was below this threshold value (0.126) was excluded from further analysis. After thresholding, we found that the number of rejected sites within DKT-defined regions was significantly anti-correlated with the number of responsive electrodes within each region (Spearman R = −0.8311, p < 0.0001; Extended Data Fig. 2c–e). Therefore, electrodes whose response profiles were not specifically matched to CI task structure were not evenly distributed across the brain, but were more prevalent in regions outside of the language-related circuitry identified with this task.
Electrodes which met all significance testing criteria were then classified based on their mean regressor weights. Electrodes possessing a single positive significant perception, planning, and production weights were deemed unmixed perception, planning, and production sites, respectively. Electrodes possessing a combination of significant positive perception, planning, and production weights were categorized as ‘mixed’. Significantly negative regressor weights did not affect electrode classification.
Reduced GLM Analyses
Because we observed far fewer perception electrodes than planning electrodes, we performed two additional GLM analyses to assess whether the overlapping structure of the perception and planning periods during early CI questions biased the GLM to detect planning-related activity at the expense of perception-related activity. To do so, we first performed the GLM analysis described above but omitted the planning regressor. For this reduced model, we held the D threshold and individual electrode D values constant in order to maintain consistent exclusion criteria with respect to the full model. We then compared the number of perception-related electrodes detected with the reduced model to that detected with the full model (Extended Data Fig. 3c). We then performed a parallel analysis with a reduced GLM which omitted the perception regressor. With these reduced models, we assessed 1) the number of planning electrodes (as detected with the full model) that gained a significant perception response when the planning regressor was omitted (Extended Data Fig. 3d), and 2) the number of perception electrodes (as detected with the full model) that gained a significant planning response when the perception regressor was omitted (Extended Data Fig. 3e). This analysis allowed us to assess whether the planning regressor also possessed explanatory value for perception-related activity and vice versa.
Analysis of CI Question Types
To assess whether planning-related electrodes displayed significantly elevated activity following CI in both ‘early’ and ‘late’ CI trials (Extended Data Fig. 1d) as well as in each of the three question categories (Extended Data Fig. 1e), we averaged high gamma signals aligned to CI for each of these categories. We then calculated peak-to-trough amplitude of each mean response by subtracting the 25th percentile value of the z-scored high gamma activity during the 2 seconds prior to CI onset from the 75th percentile value of the z-scored high gamma activity during the 2 seconds following CI onset. We then performed the same procedure using random timepoints rather than CI onset times to generate parallel shuffled measures of peak-to-trough response amplitudes for each condition. Data from all mixed and unmixed planning electrodes were pooled across participants to generate distributions of actual and shuffled response amplitudes for each condition, and differences between these distributions were assessed using a signed-rank test.
CI Clustering Analyses in GLM Weight Space
To assess whether functionally-relevant classes of electrodes (i.e., perception, planning, and production) formed distinct clusters in GLM weight space, k-medoids clustering was performed on all responsive electrodes pooled across all participants with the ‘kmedoids’ function in MATLAB. Clustering was specifically performed in three dimensional GLM weight space (i.e., perception, planning, and production weights), and three clusters were assumed.
Using a simulation, we then assessed whether the observed clustering of functional electrode classes in GLM weight space could have resulted from subdividing continuously varying patterns of neural activity. To do this, we generated 253 simulated electrodes (i.e., the number of observed responsive electrodes in our data set) which were randomly assigned a perception weight, planning weight, and production weight. The simulated weights for each regressor were generated from independent unimodal normal distributions whose means and standard deviations matched the observed values across responsive electrodes (perception: −0.119 ± 0.313z; planning: 0.245 ± 0.238z; production: 0.220 ± 0.377z). Simulated weights that surpassed the 5th percentile of observed significant weights for each regressor (perception: 0.229z; planning: 0.164z; production: 0.205z) were considered “responsive” in the model and subjected to further analysis. This method allowed us to match the range of regressor weights of our simulated responsive electrodes to that observed in the actual data while assuming that regressor weights reflect underlying non-categorical, unimodal continua of neural activity as opposed to the discrete response profiles we hypothesized. Next, simulated responsive electrodes were classified as unmixed and mixed perception, planning, and production sites in the same manner as was performed for the actual data, and we quantified 1) the proportion of mixed electrodes, and 2) the proportion of “misclustered” unmixed electrodes. To identify misclustered electrodes, each simulated cluster first received an assignment as perception, planning, or production; this assignment was determined such that the maximal number of simulated unmixed perception, planning, and production electrodes fell the perception, planning, and production cluster, respectively, and each cluster contained at least 1 unmixed electrode whose type matched its assignment (i.e., the planning cluster must contain at least one unmixed planning electrode). The proportion of misclustered unmixed sites was then calculated by summing the number of simulated unmixed perception, planning, and production electrodes falling outside of the perception, planning, and production clusters, respectively, and dividing by the total number of simulated unmixed electrodes. This analysis was repeated over 100,000 iterations to generate empirical distributions of mixed and misclustered unmixed electrode proportions under the unimodal regime to compare against the observed results. Data from all iterations was considered unless the model failed to generate at least one unmixed electrode of each class.
Assessing the Speech-Selectivity of Planning Sites
To quantify the specificity of planning responses, another GLM analysis was performed on the CR task data. This analysis was identical to the GLM performed for the CI task, except four planning regressors (CR1-CR4) and three production regressors (CR1 [hand movements], CR2 [nonspeech orofacial movements], CR3&4 [speech]) were employed. As the temporal precision of each site was quantified with the CI task, no jittering analysis was performed. Also, as the CI in this task were longer in duration (e.g., “open your mouth” vs. a single word), CI onset was defined as the onset of the planning regressor. This GLM analysis was performed on all unmixed planning and mixed planning-production electrodes (referred to as “planning electrodes” in the context of the CR task). Mixed planning sites possessing a significant positive perception GLM weight were not included in order to avoid biasing the analysis with unintended acoustic differences between the four CR trial types. The mean planning regressor weight was then used as a metric for selectivity for each of the four CR response types.
We assessed the speech-selectivity of planning electrodes within individual regions by calculating the proportion of planning electrodes in 1) caudal IFG (i.e., pars triangularis and pars opercularis), 2) caudal MFG, and 3) precentral gyrus which displayed a significant positive planning weight in each of the four CR tasks; the boundaries these regions were defined according to the DKT atlas78, 79 (Extended Data Table 3). To assess the significance of these proportions, we performed a resampling analysis where the planning weights observed across all planning electrodes for each CR task were shuffled and randomly assigned to the electrodes in each of these three regions. The proportion of shuffled significant positive responses were then calculated within each region and the process was repeated 100,000 times in order to determine the distribution of proportions that would be expected by chance; due to differences in electrode coverage, this null distribution varied between regions. Any proportions greater than the 97.5th percentile and lower than the 2.5th percentile of each region’s null distribution were therefore considered significantly different than chance.
Principal Component Analysis
Calculation of Task-Derived and Conversation-Derived Principal Components
To reduce the dimensionality of neural activity, principal component analysis (PCA) using singular value decomposition was performed on the unaveraged high gamma signals from all CI-task responsive electrodes (i.e., each electrode is a variable with timepoints as observations). Specifically, we divided the task and conversation epochs of each participant’s data set – which occurred sequentially during the experiments – and performed PCA (implemented with the ‘pca’ function in MATLAB) on the data from each period independently for all participants. The task period was defined as the epoch beginning 5 seconds prior to the onset of the first CI or CR trial and ending 5 seconds after the last CI or CR trial. In participants where the task began prior to the start of the electrophysiological recording or during a blanked artifactual period, the task period was defined to begin at the first unblanked sample. The conversation period was defined as the period beginning 5 seconds prior to the first experimenter turn onset and ending 5 seconds after the last participant turn offset. In cases where conversation was still ongoing when the recording was terminated or during a final artifactual period, the conversation period was defined to end at the last unblanked sample. Finally, prior to performing PCA, each electrode’s high gamma signal was smoothed with a 250 ms mean boxcar filter and z-scored within the task and conversation epochs independently.
Clustering of Task-Responsive Electrodes in PC Coefficient Space
To assess network organization in an unsupervised manner, we mathematically identified clusters of task-responsive electrodes for each participant possessing at least 2 unmixed electrodes of different classes (n = 6; see Extended Data Table 2) using k-medoids clustering (implemented with the ‘kmedoids’ function in MATLAB). To standardize this analysis across participants, clustering was specifically performed in three-dimensional PC coefficient space using the scalar coefficients (i.e., loadings) of the first three PCs while assuming three clusters, as visual inspection revealed at least three main electrode clusters in all cases (Extended Data Fig. 7a–f). The coefficients of the first three PCs were used because 1) these PCs individually explained at least 5% of the variance for the task data in all participants and for the conversation data in 7/8 participants while also cumulatively explaining at least 1/3 of the variance in all participants for both behaviors, 2) these PCs fell significantly above the linear decay phase in the scree plots for the task and conversation data sets in 7/8 and 6/8 participants, respectively, and 3) when all participant data were pooled, the first three PCs individually explained at least 5% of the variance and cumulatively explained at least 1/3 of the variance on average for both the task and conversation while also falling significantly above the linear decay phase (Extended Data Fig. 6c). Note that the linear decay phase was estimated for each participant using the 95% confidence interval of a line fit to the center of the scree plot (i.e., data from the middle 50% of PCs centered at the half maximum PC) via the ‘fitlm’ function in MATLAB – thus allowing for the “elbow” of the scree plot to be empirically defined. This process was performed across participants by similarly fitting the pooled data from the middle 50% of the first 13 PCs (the number possessed by the participant with the fewest task-response electrodes, and consequently, PCs) from all participants (Extended Data Fig. 6c).
To assess whether the correlational structure among electrodes was stable between the task-based behavior and natural conversation, we then identified electrode clusters in the conversation time period which were analogous to those observed during the task period. Specifically, analogous clusters were defined as the task cluster and conversation cluster who possessed the highest number of common electrodes. For all six participants, each task-related electrode cluster was analogous to a single, unique cluster in the conversation data such that 18 pairs of analogous clusters were identified (Extended Data Fig. 7). We then calculated the number of electrodes which ‘switched’ clusters between the task and conversation data sets (i.e., electrodes not remaining within a pair of analogous clusters), and we determined whether observed number of electrode switches for each participant and the total across participants were significantly less than expected by chance using a permutation test where the conversation cluster membership was shuffled for each participant over 1,000 iterations (Extended Data Fig. 6d).
Functional Categorization of Electrode Clusters
To determine whether electrode clusters in PC coefficient space corresponded to the perception, planning, and production electrode classes defined using the CI task and GLM, we examined the GLM-defined classification of electrodes within each cluster. To do this, we tallied the number of unmixed perception, planning, and production electrodes (i.e., electrodes with a single significant positive GLM weight) in each cluster and functionally categorized clusters according to which electrode class was most numerous. Across the six participants, 17/18 analogous cluster pairs were thus defined as either a perception, planning, or production cluster using this method (analogous clusters always received the same designation); one cluster pair received two categorizations (Extended Data Fig. 7d) and was not included in further analyses.
We next assessed whether the unsupervised clustering analysis successfully recovered the functional classes of neural activity identified with the GLM by assessing the degree to which electrodes within a cluster in PC coefficient space exhibited GLM-defined neural activity congruent with the functional categorization of that cluster. Specifically, we calculated the percentage of electrodes across participants in conversation-related perception, planning, and production clusters that displayed significant GLM-defined perception, planning, or production activity, respectively. To determine whether the observed values across participants were higher than expected by chance, we assessed significance using a permutation test where the GLM activity classes of each electrode were shuffled over 1,000 iterations (Extended Data Fig. 6e).
Functional Categorization of Principal Components
To examine neural activity related to speech perception, planning, and production during conversation, we assessed time-varying PC scores (i.e., the linear combination of electrodes summed in time according to their PC coefficients) as a proxy for the aggregate activity of electrodes within perception, planning, and production-related clusters. To first determine which PCs corresponded to each electrodes class, we examined the distribution of PC coefficients displayed by electrodes within each cluster category for each participant. Specifically, we determined which of the first three PCs displayed the highest average coefficient value for electrodes in perception clusters, planning clusters, and production clusters, and defined these PCs as perception, planning, and production PCs, respectively. In two participants where the vast majority of task-related responses were defined as planning (472, 100%; 510, 97.5%), we considered the PC with the highest average coefficient across all planning-related electrodes as the planning PC (Extended Data Fig. 7g,h). Finally, to avoid assessing PCs representing mixed response profiles, we did not include any clusters containing ≥50% mixed response electrodes (e.g., a planning cluster containing 5 unmixed planning and 5 mixed planning-production electrodes) in this analysis (n = 3/17 clusters; see Extended Data Table 2 and Extended Data Fig. 7a–f). Using this approach, we isolated 2 perception PCs, 6 planning PCs, and 5 production PCs across 8 participants in both the task and conversation data sets (Extended Data Fig. 7).
We then assessed the average response profiles of the perception, planning, and production PCs by calculating 1) the mean planning and perception PC scores aligned to experimenter speech offset in the CI task and conversation, and 2) the average planning and production PC scores aligned to participant speech onset in the CI task and conversation. Periods of significantly elevated average PC activity (i.e., PC scores) were identified using a permutation test where average responses for each PC were calculated when aligned to trial number-matched random timepoints over 1,000 iterations; any time bins of the average response which fell above the 95th percentile value of the shuffled average responses were considered significant.
Lastly, we quantified PC activity with respect to unconstrained turn-taking behavior in natural conversation by calculating the median z-scored PC score amplitude during all 1) experimenter turns, 2) intra-turn gaps, and 3) participant turns. Consistent with the previous analyses, participant turn onset was defined as 200 ms prior to the acoustic onset of participant speech to account for silent articulatory movements. Due to this correction, any gaps less than 200 ms in duration were not considered for analysis. Finally, for all participants possessing multiple functionally categorized PCs (n = 4), the difference in median amplitude between PCs was assessed for significance using a signed-rank test (Extended Data Fig. 6g).
Extended Data
Extended Data Fig. 1 |. Behavior during the CI task.
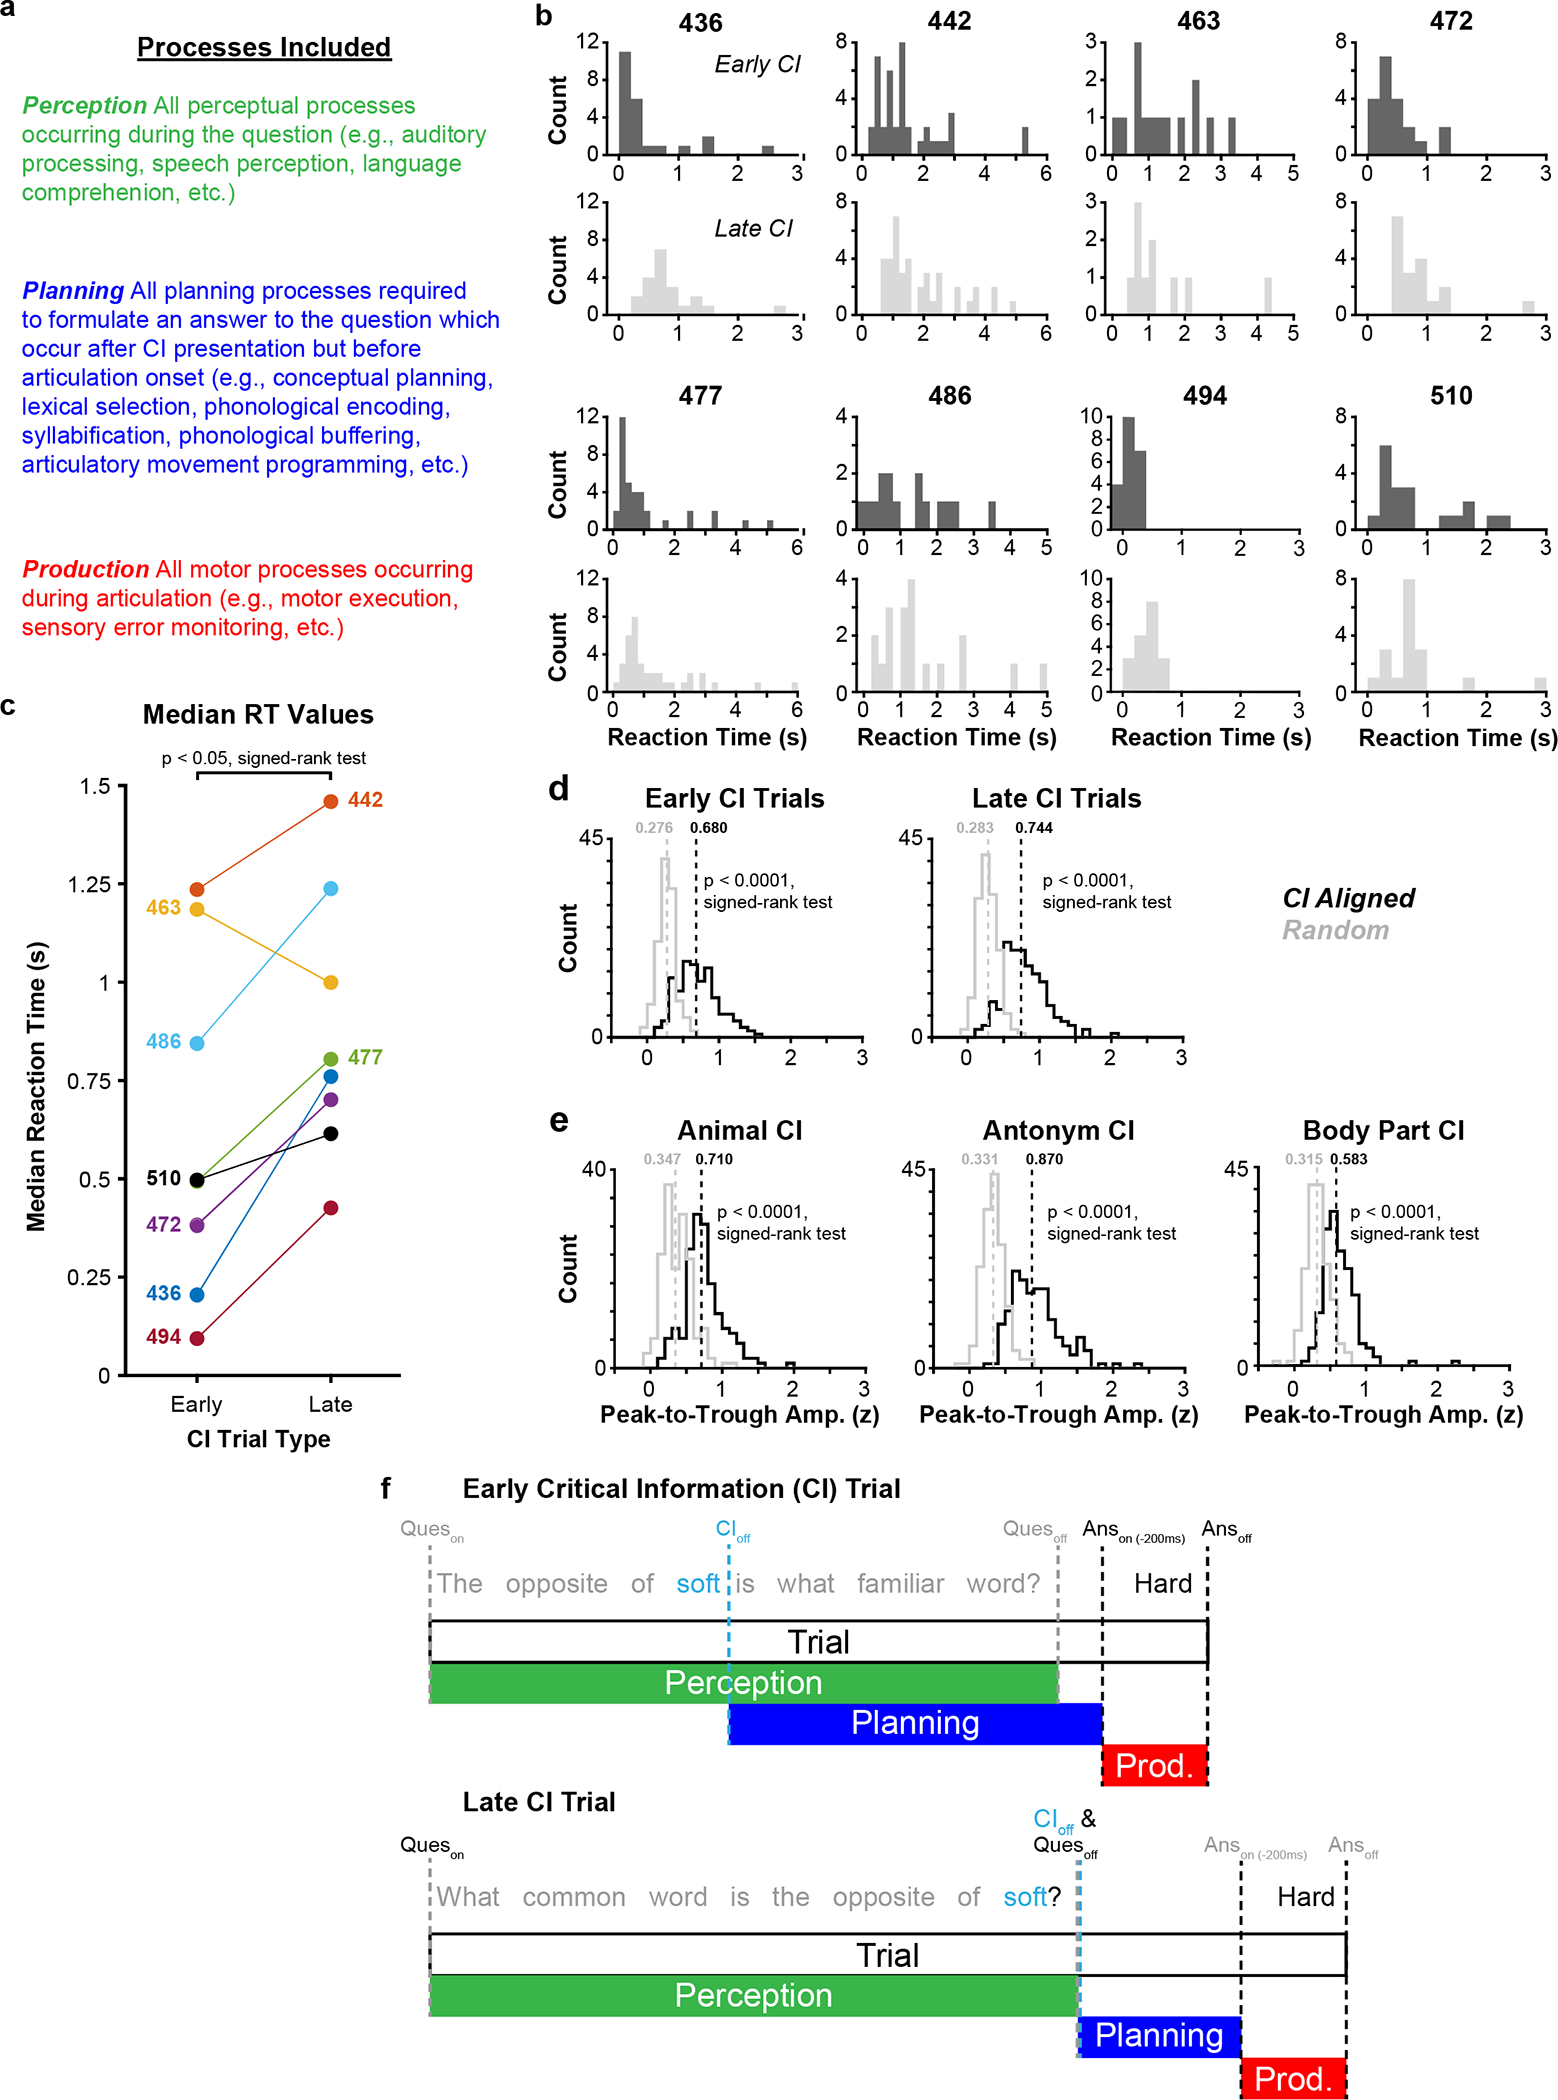
a, Description of subprocesses assumed to occur during the perception, planning, and production windows of the CI task. b, Histograms of reaction times (RT) in early and late CI trials for all participants. c, Median RT values for early and late CI trials for all participants. d,e, Histograms depicting the distribution of average peak-to-trough response amplitudes for all electrodes displaying planning-related responses when aligned to CI onset in early and late trials (d) and different CI question types (e); median values for each distribution are indicated. Observed data (in black) are compared with a null distribution (in grey) consisting of randomly chosen timepoints (see Methods). f, Schematics displaying GLM regressor structure for early (top) and late (bottom) trials of the CI task.
Extended Data Fig. 2 |. GLM temporal jittering analysis.
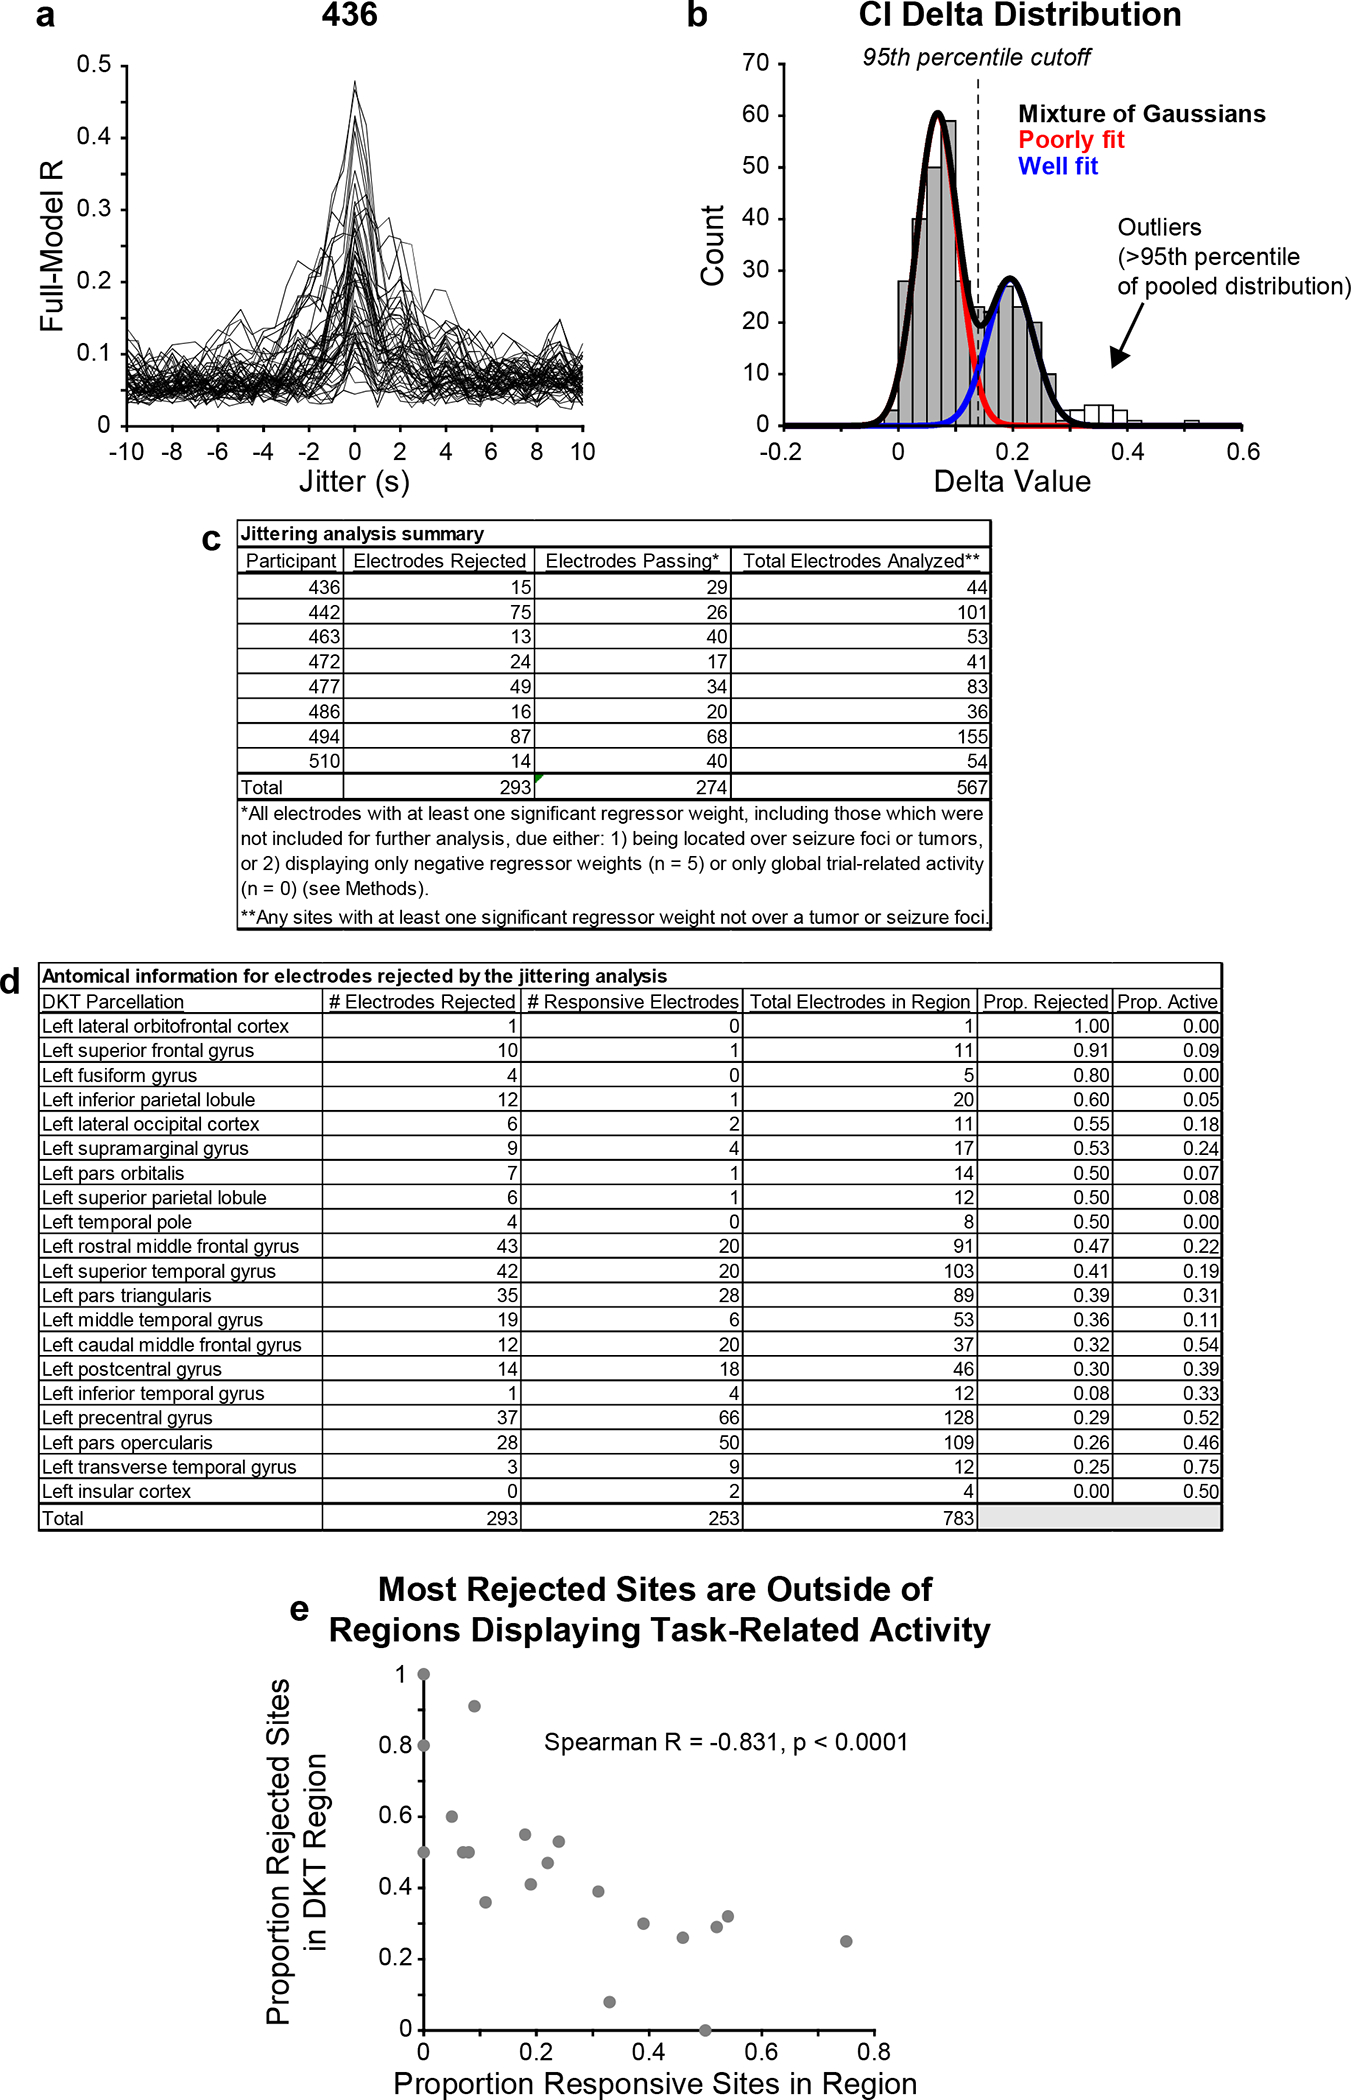
a, Full model R values for GLM fits of jittered high gamma activity from participant 436; each line represents data from an individual electrode. b, Example distribution of pooled D values with the fit of two Gaussians overlaid (black). The Gaussian distributions corresponding to well-fit electrodes (blue) and poorly fit electrodes (red) as well as the 95th percentile of the D distribution for poorly fit electrodes (dashed line) are indicated. D values above the 95th percentile of the pooled distribution were deemed outliers (white bars) and not fitted. c, Table summarizing the number of electrodes rejected by the jittering analysis in each participant. d, Table reporting the anatomical locations of electrodes rejected by the jittering analysis and electrodes displaying significant activity in the CI task. e, Scatterplot depicting the proportion of rejected electrodes within a region as a function of the proportion of responsive electrodes in a region.
Extended Data Fig. 3 |. Analysis of neural activity in the CI task.
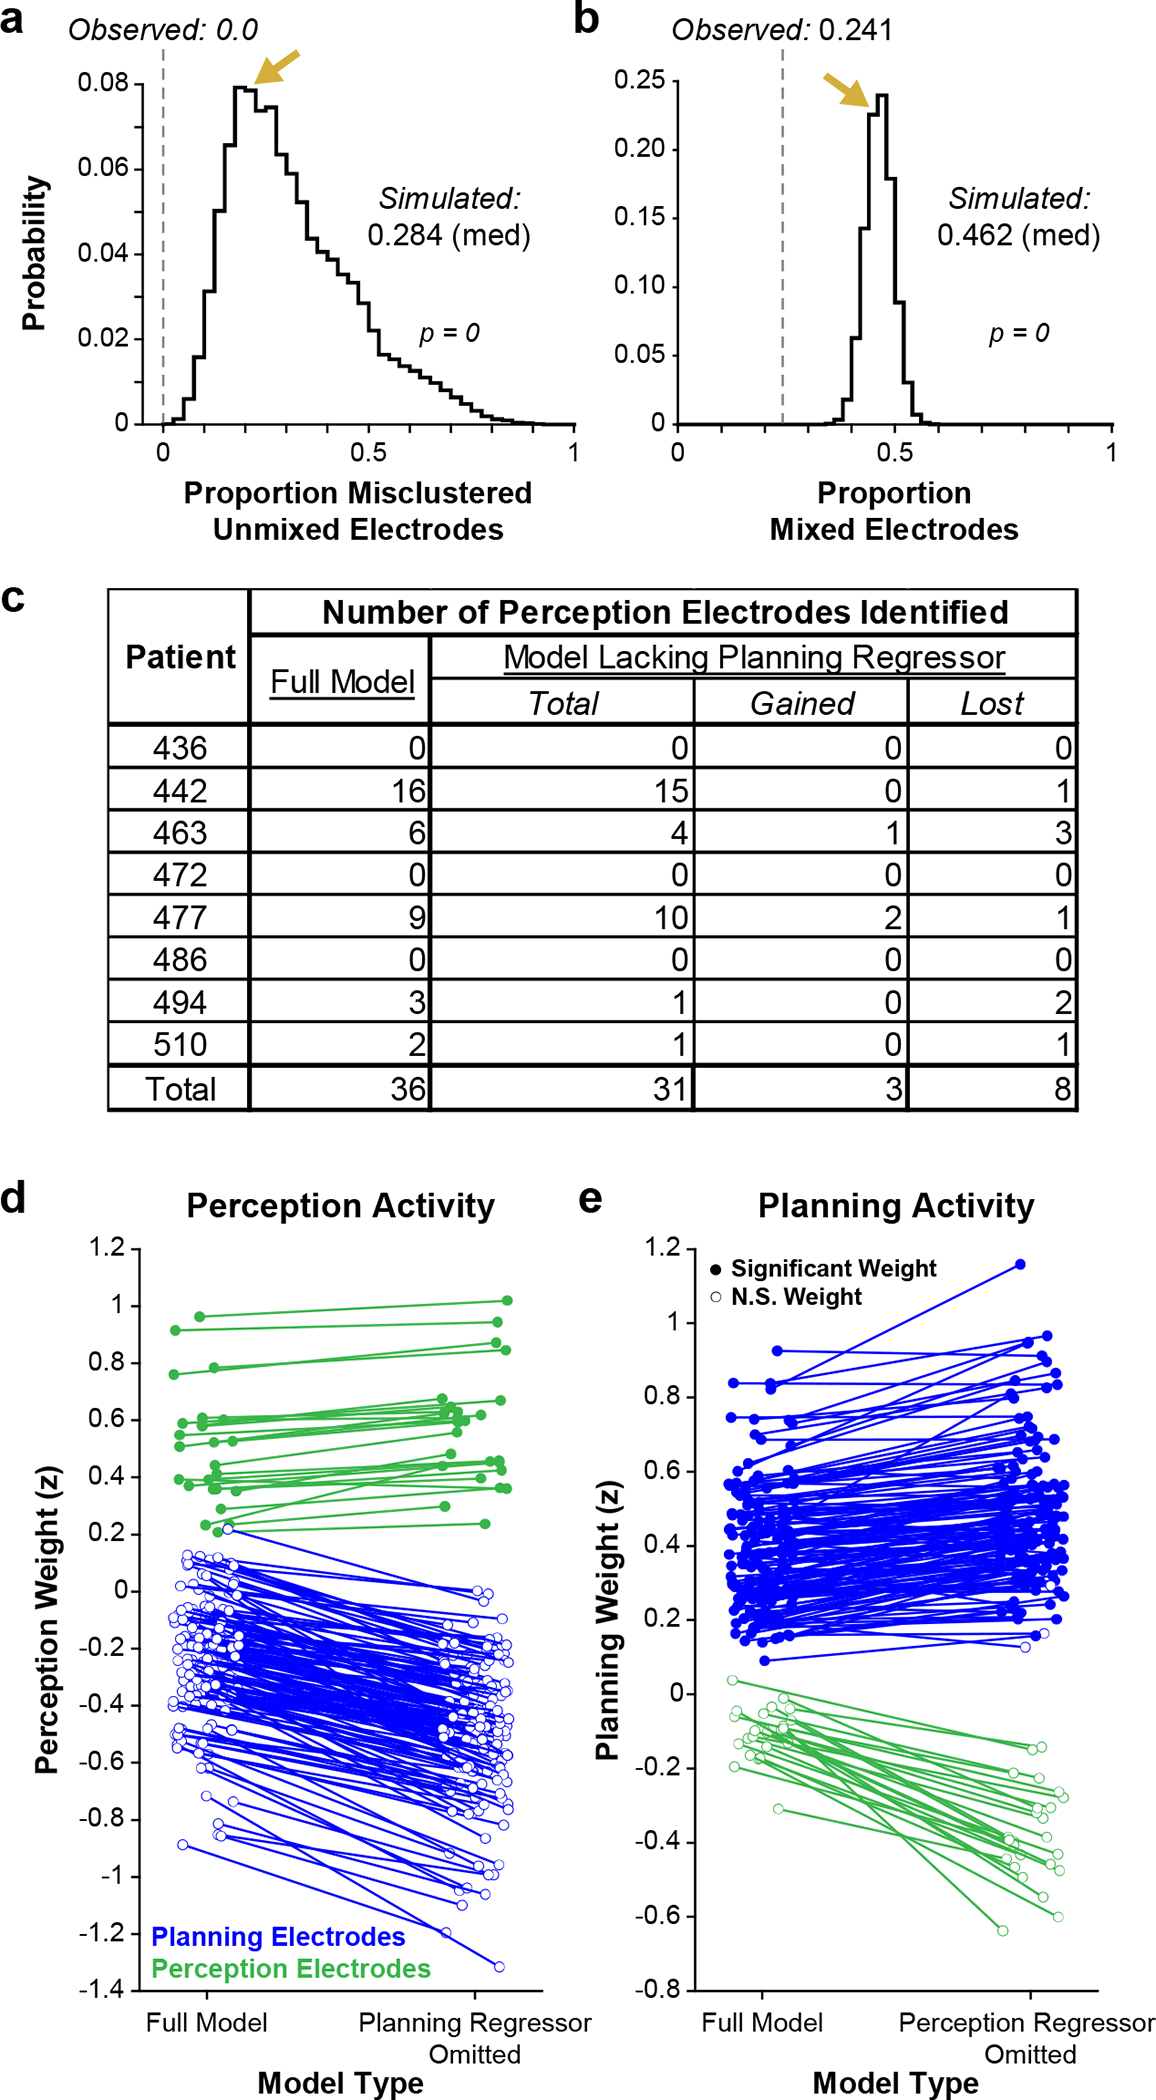
a,b, Histograms depicting the distribution of the proportion of misclustered electrodes responsive during a single task window (i.e., unmixed electrodes) (a), and the proportion of electrodes displaying more than one significant positive weight (i.e., mixed electrodes) (b) across 100,000 iterations of the continuum model simulation. The median of each distribution as well as the values observed in the actual data (dashed line) are indicated. Gold arrows indicate the bin of each distribution containing the measurements corresponding to the example iteration depicted in panels p, r, and t of Figure 1. c, Table reporting the number of electrodes displaying perception-related responses using either the full model or the reduced GLM lacking a planning regressor. d,e, Scatterplots depicting perception (d) and planning (e) GLM weights in the full model and reduced models lacking a planning regressor or perception regressor, respectively. Significant positive weights are denoted with filled points and nonsignificant or significant negative weights are denoted with unfilled points; the x-coordinates of each point are randomly jittered by 25% to better visualize filled versus unfilled status. No planning electrodes displayed significant perception responses in the reduced GLM lacking a planning regressor, and no perception electrodes displayed significant planning responses in the reduced GLM lacking a perception regressor.
Extended Data Fig. 4 |. Additional analyses of task-related activity changes.
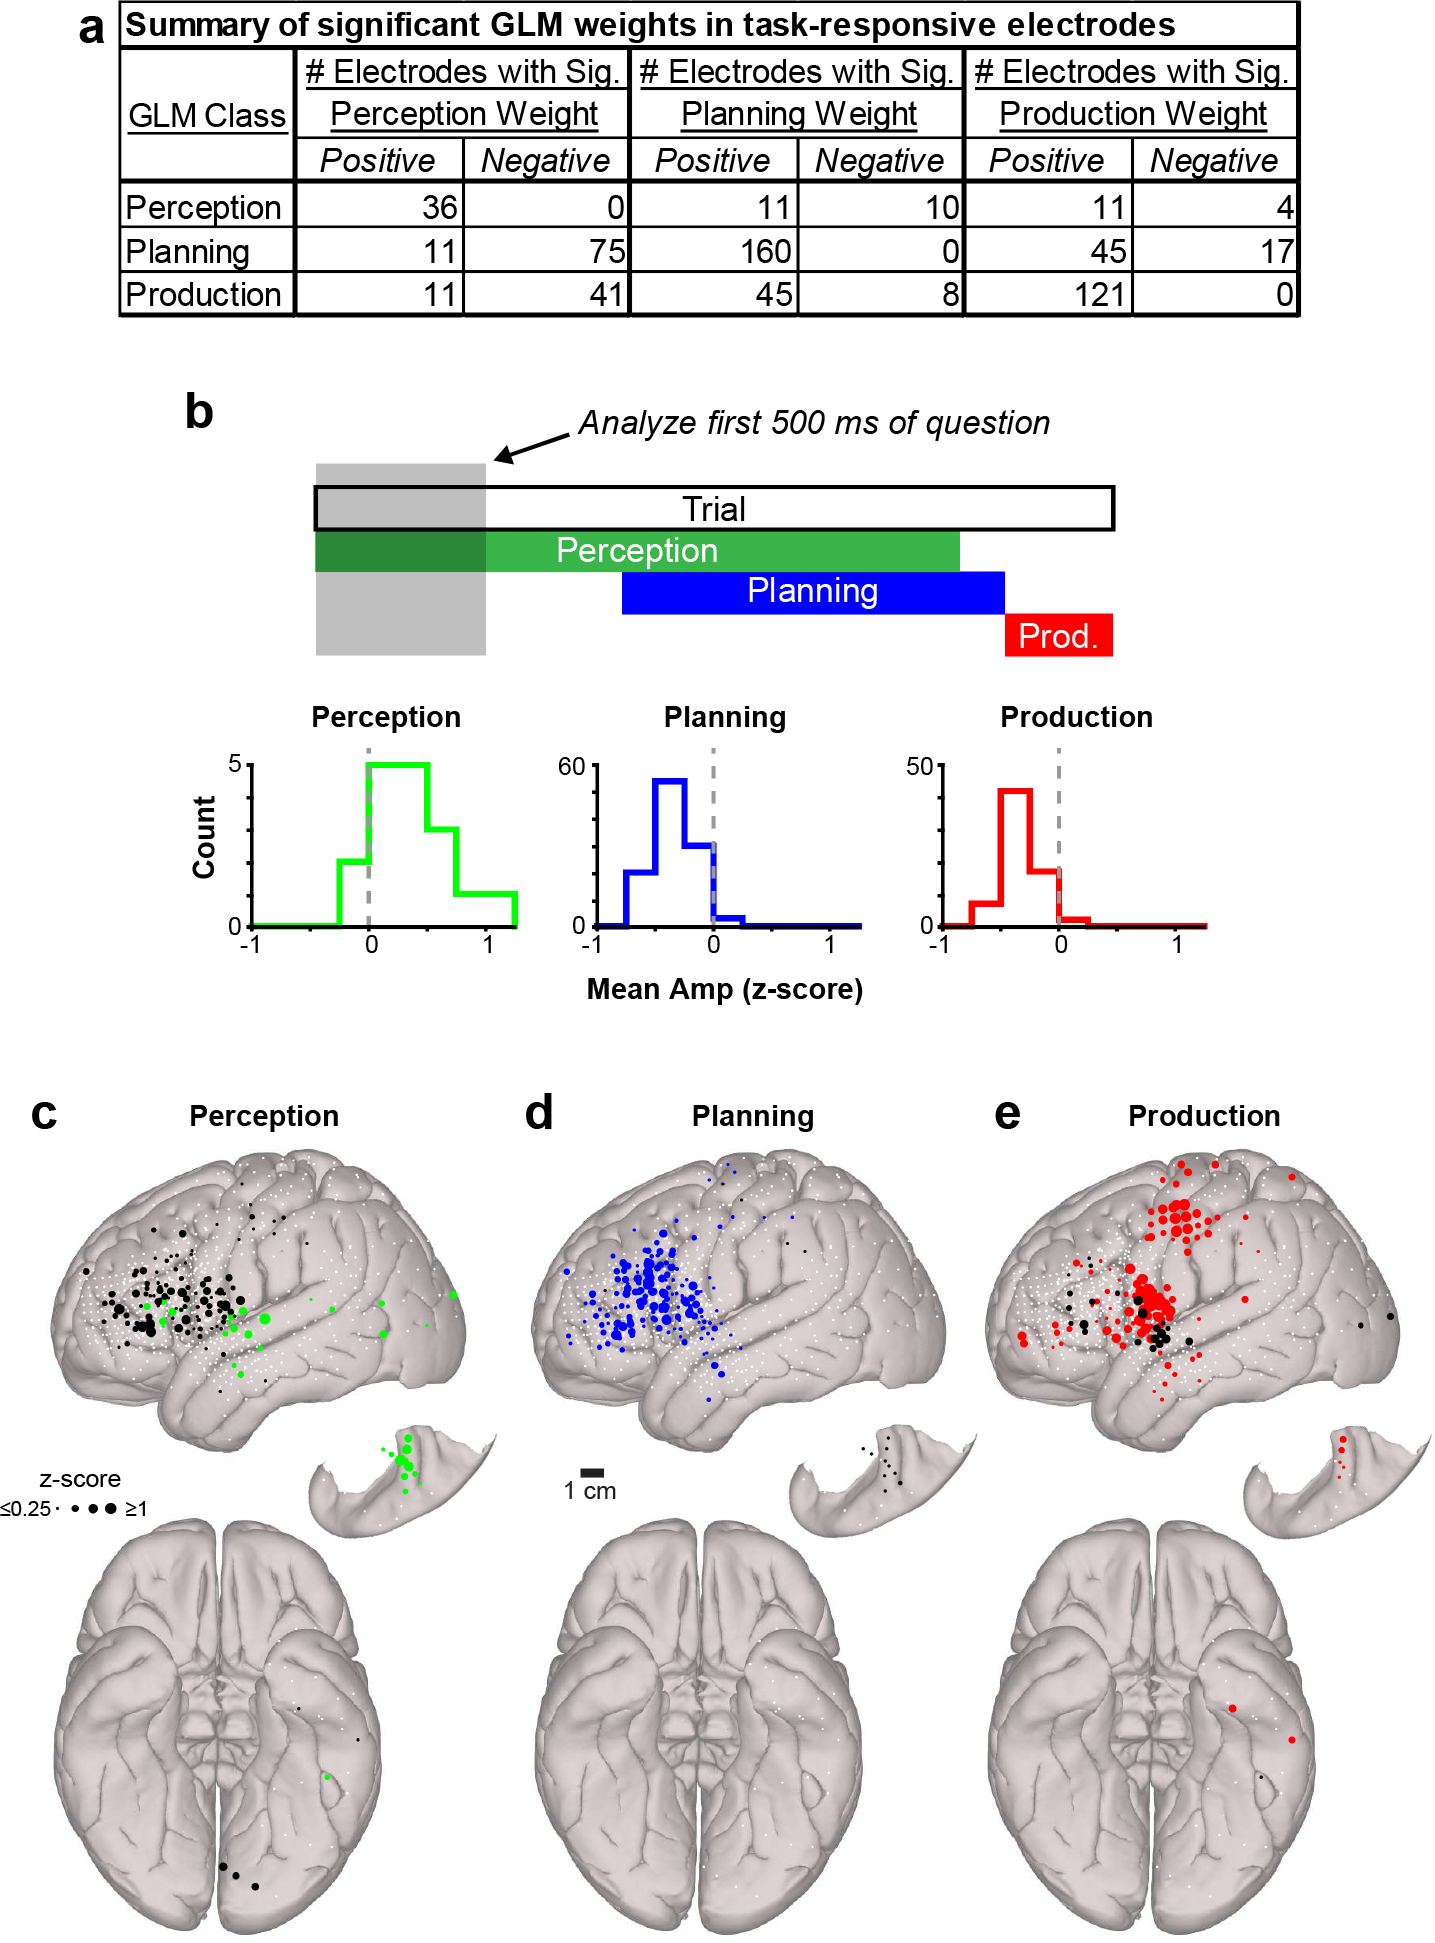
a, Table reporting the number of perception, planning, and production-related electrodes displaying significant positive and negative weights for each GLM regressor. b, Histogram depicting mean high gamma amplitude in the first 500 ms of CI questions for all unmixed perception, planning, and production electrodes. c-d, Canonical cortical surfaces displaying electrodes with significant positive (colored) or negative (black) GLM weights in the perception (c), production (d), and planning (e) windows of the CI task across all participants. Electrode diameter is scaled to the absolute magnitude of the GLM weight, and electrodes not displaying a significant weight for a given regressor are indicated with small white circles.
Extended Data Fig. 5 |. Anatomical analysis of responses.
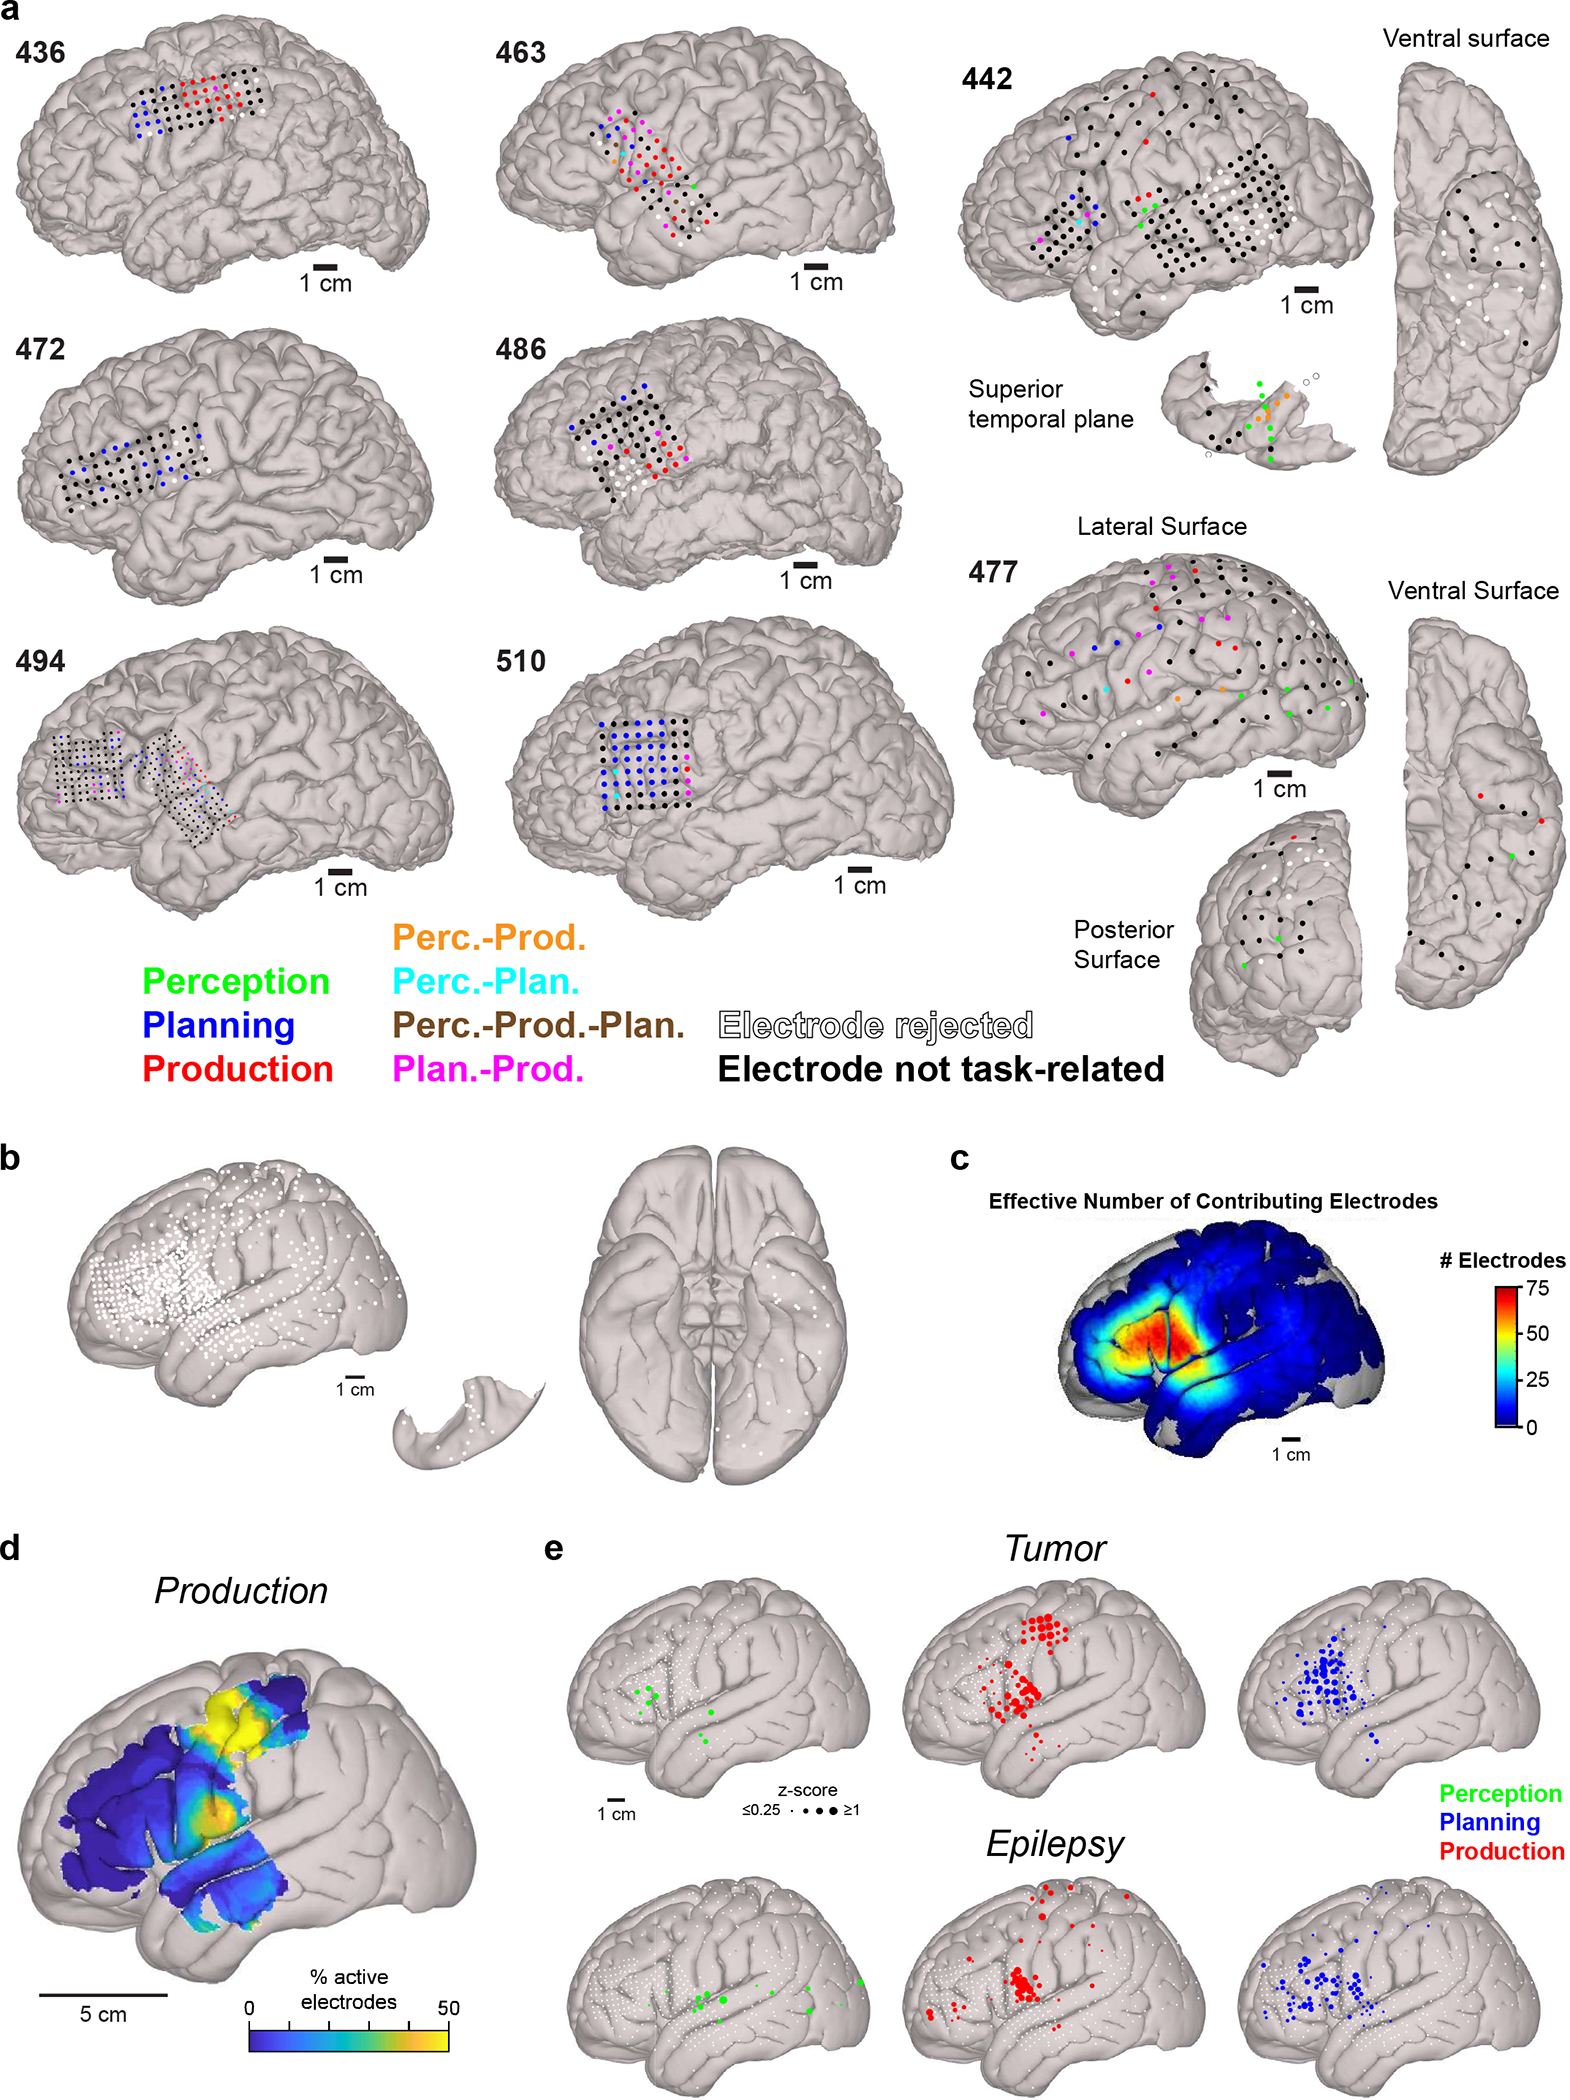
a, Cortical reconstructions for all participants displaying the location of all electrodes; the size of each electrode depicts the actual size of its recording area on the cortical surface. GLM classification is indicated by electrode color. b, Canonical cortical surfaces showing electrode locations from all participants as standard-sized white circles. c, Number of electrodes sampling each area of the canonical cortical surface (1 cm diameter spatial smoothing) after pooling electrodes from all participants. d, Proportion of electrodes displaying significant production-related responses in the CI task (1 cm diameter spatial smoothing). e, Canonical cortical surfaces displaying electrodes with significant responses related to speech perception, production, and planning in tumor (top) and epilepsy (bottom) patients separately. Electrodes not displaying a significant response for a process are depicted as small white circles. Electrode diameter is scaled to GLM regressor weight.
Extended Data Fig. 6 |. Additional conversation-related analyses.
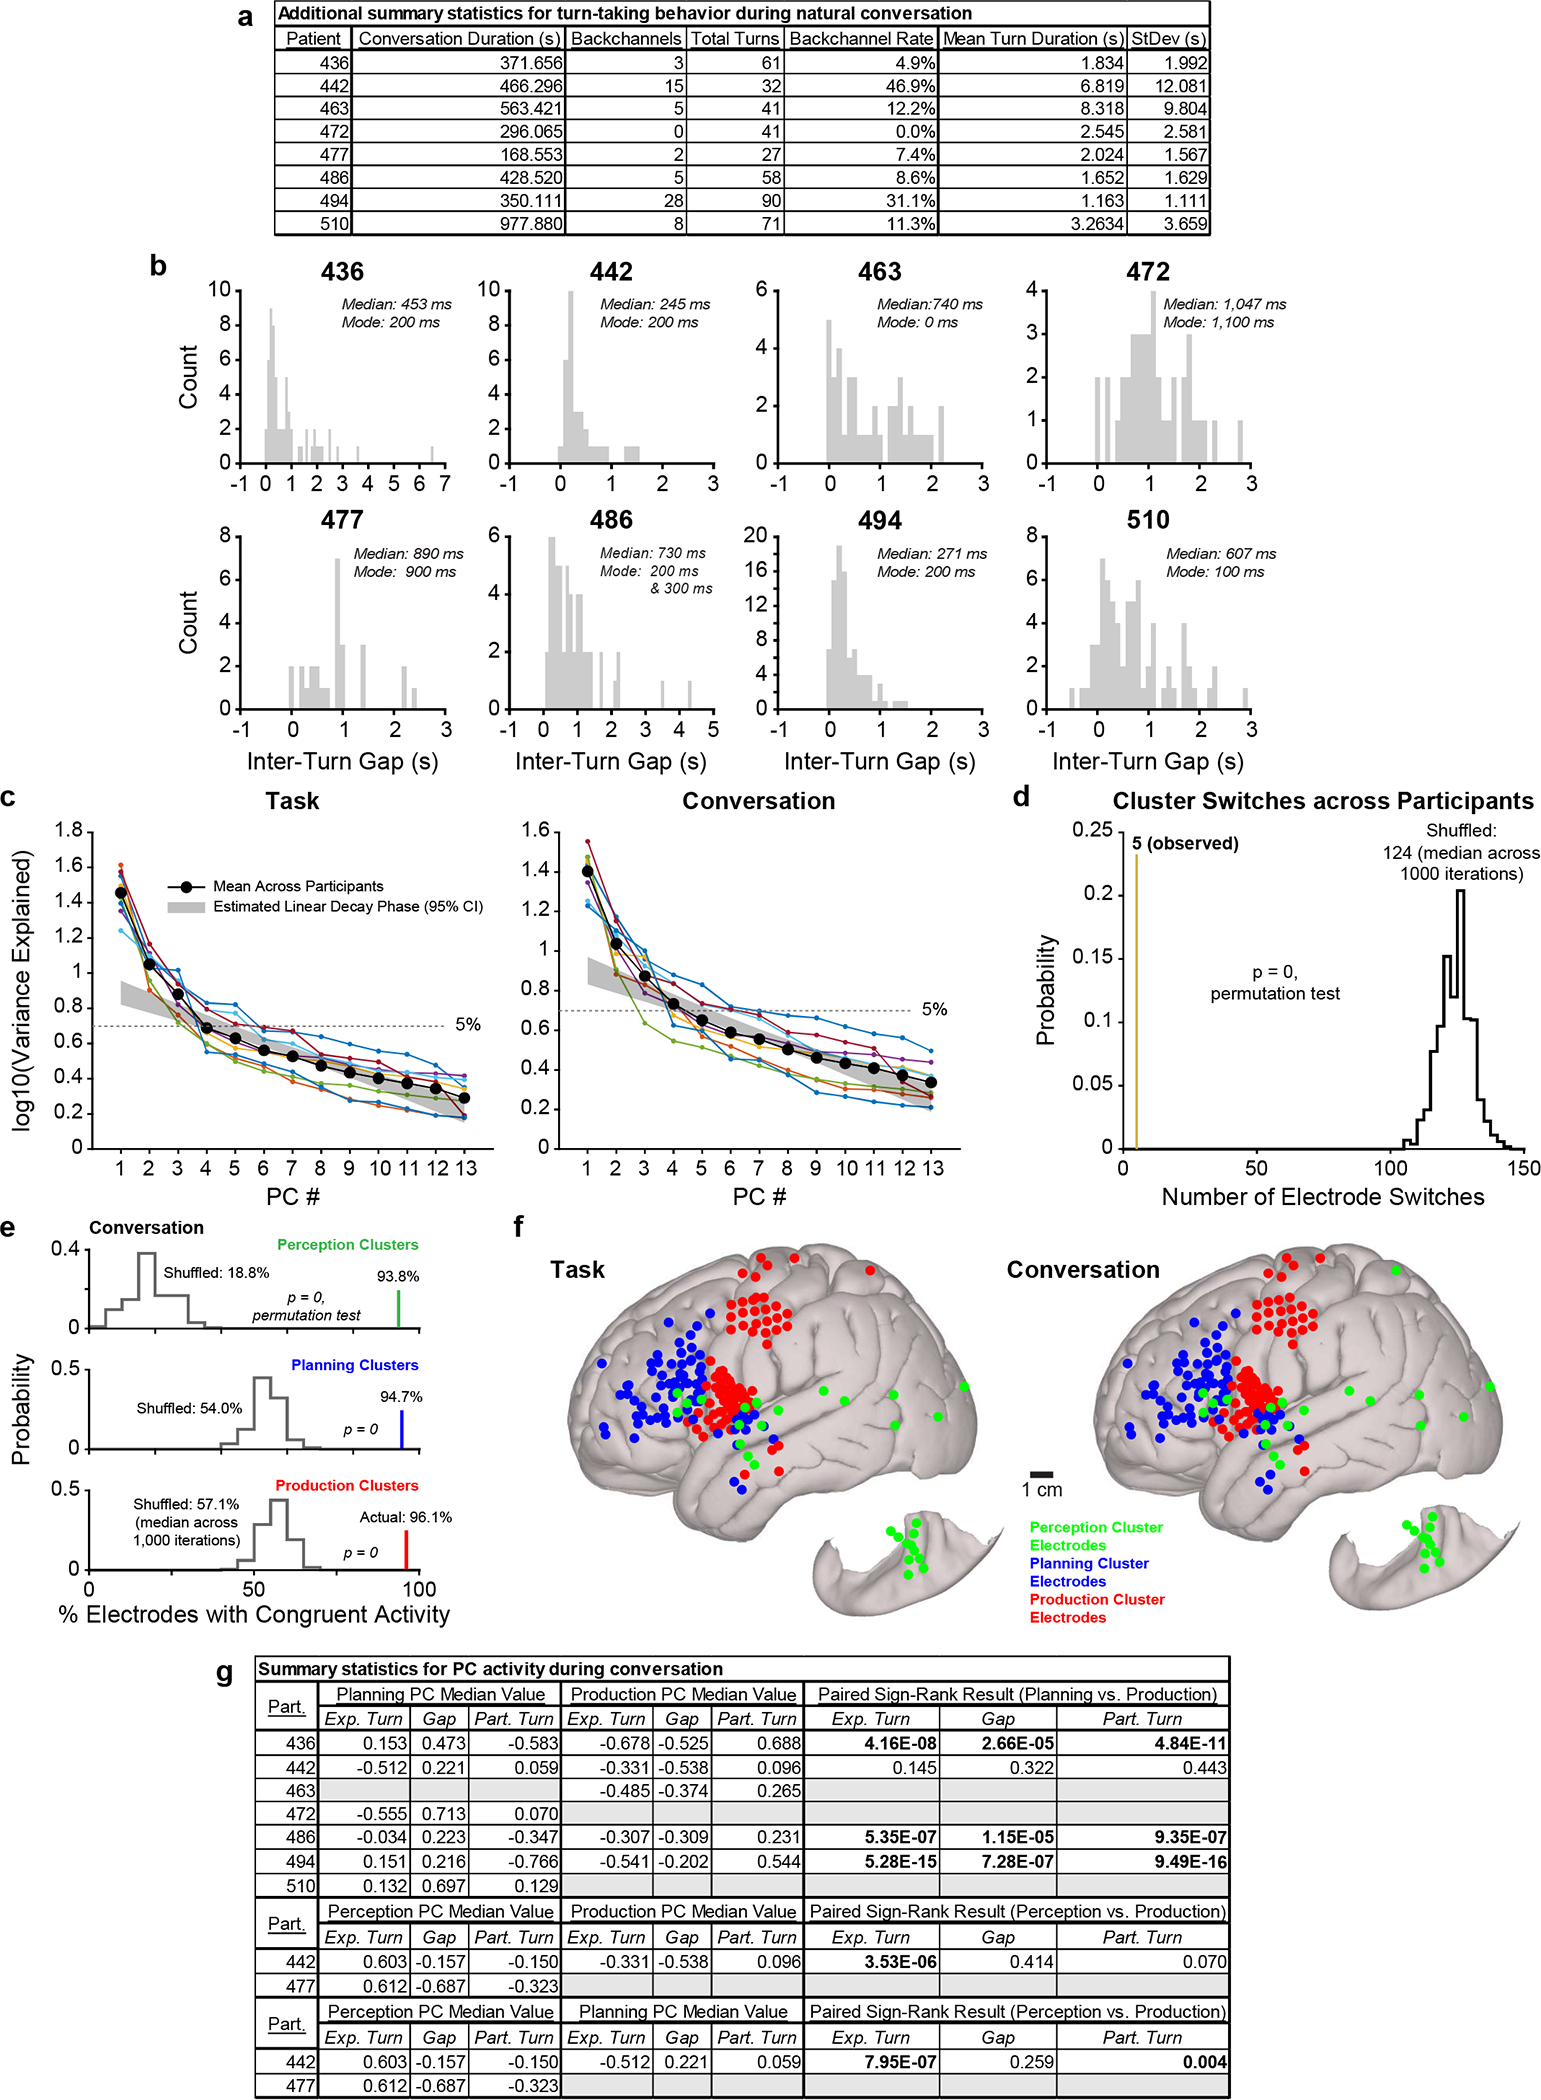
a, Table reporting additional turn-taking behavioral measures for each participant. b, Histograms of gap durations (time between experimenter turn offset and participant turn onset) during unconstrained conversation for each participant; bins are centered on 100 ms increments with a width of 100 ms. c, Scree plots for the PCA analysis of high gamma signals in the task (left) and conversation (right) periods of the recordings; data from each participant are represented by thin lines and the average across participants is denoted with a thick black line. The 95% confidence interval of the linear decay phase across participants (see Methods) is also indicated. d, The observed number of electrodes whose cluster membership was not stable (i.e., switched clusters) between the task and conversation with a histogram depicting the distribution of electrode cluster switches expected by chance. e, The observed percentage of electrodes in perception, planning, and production clusters (in conversation-derived PC coefficient space) displaying significant perception, planning, and production responses (per the GLM), respectively, with histograms depicting the percentages expected by chance for each cluster type. f, Canonical cortical surfaces displaying the locations of all electrodes in perception, planning, and production clusters across participants (n = 6) in the task (left) and conversation (right). g, Table reporting summary statistics for PC activity (i.e., time-varying PC score) during unconstrained conversation for each participant.
Extended Data Fig. 7 |. PCA results for individual participants.
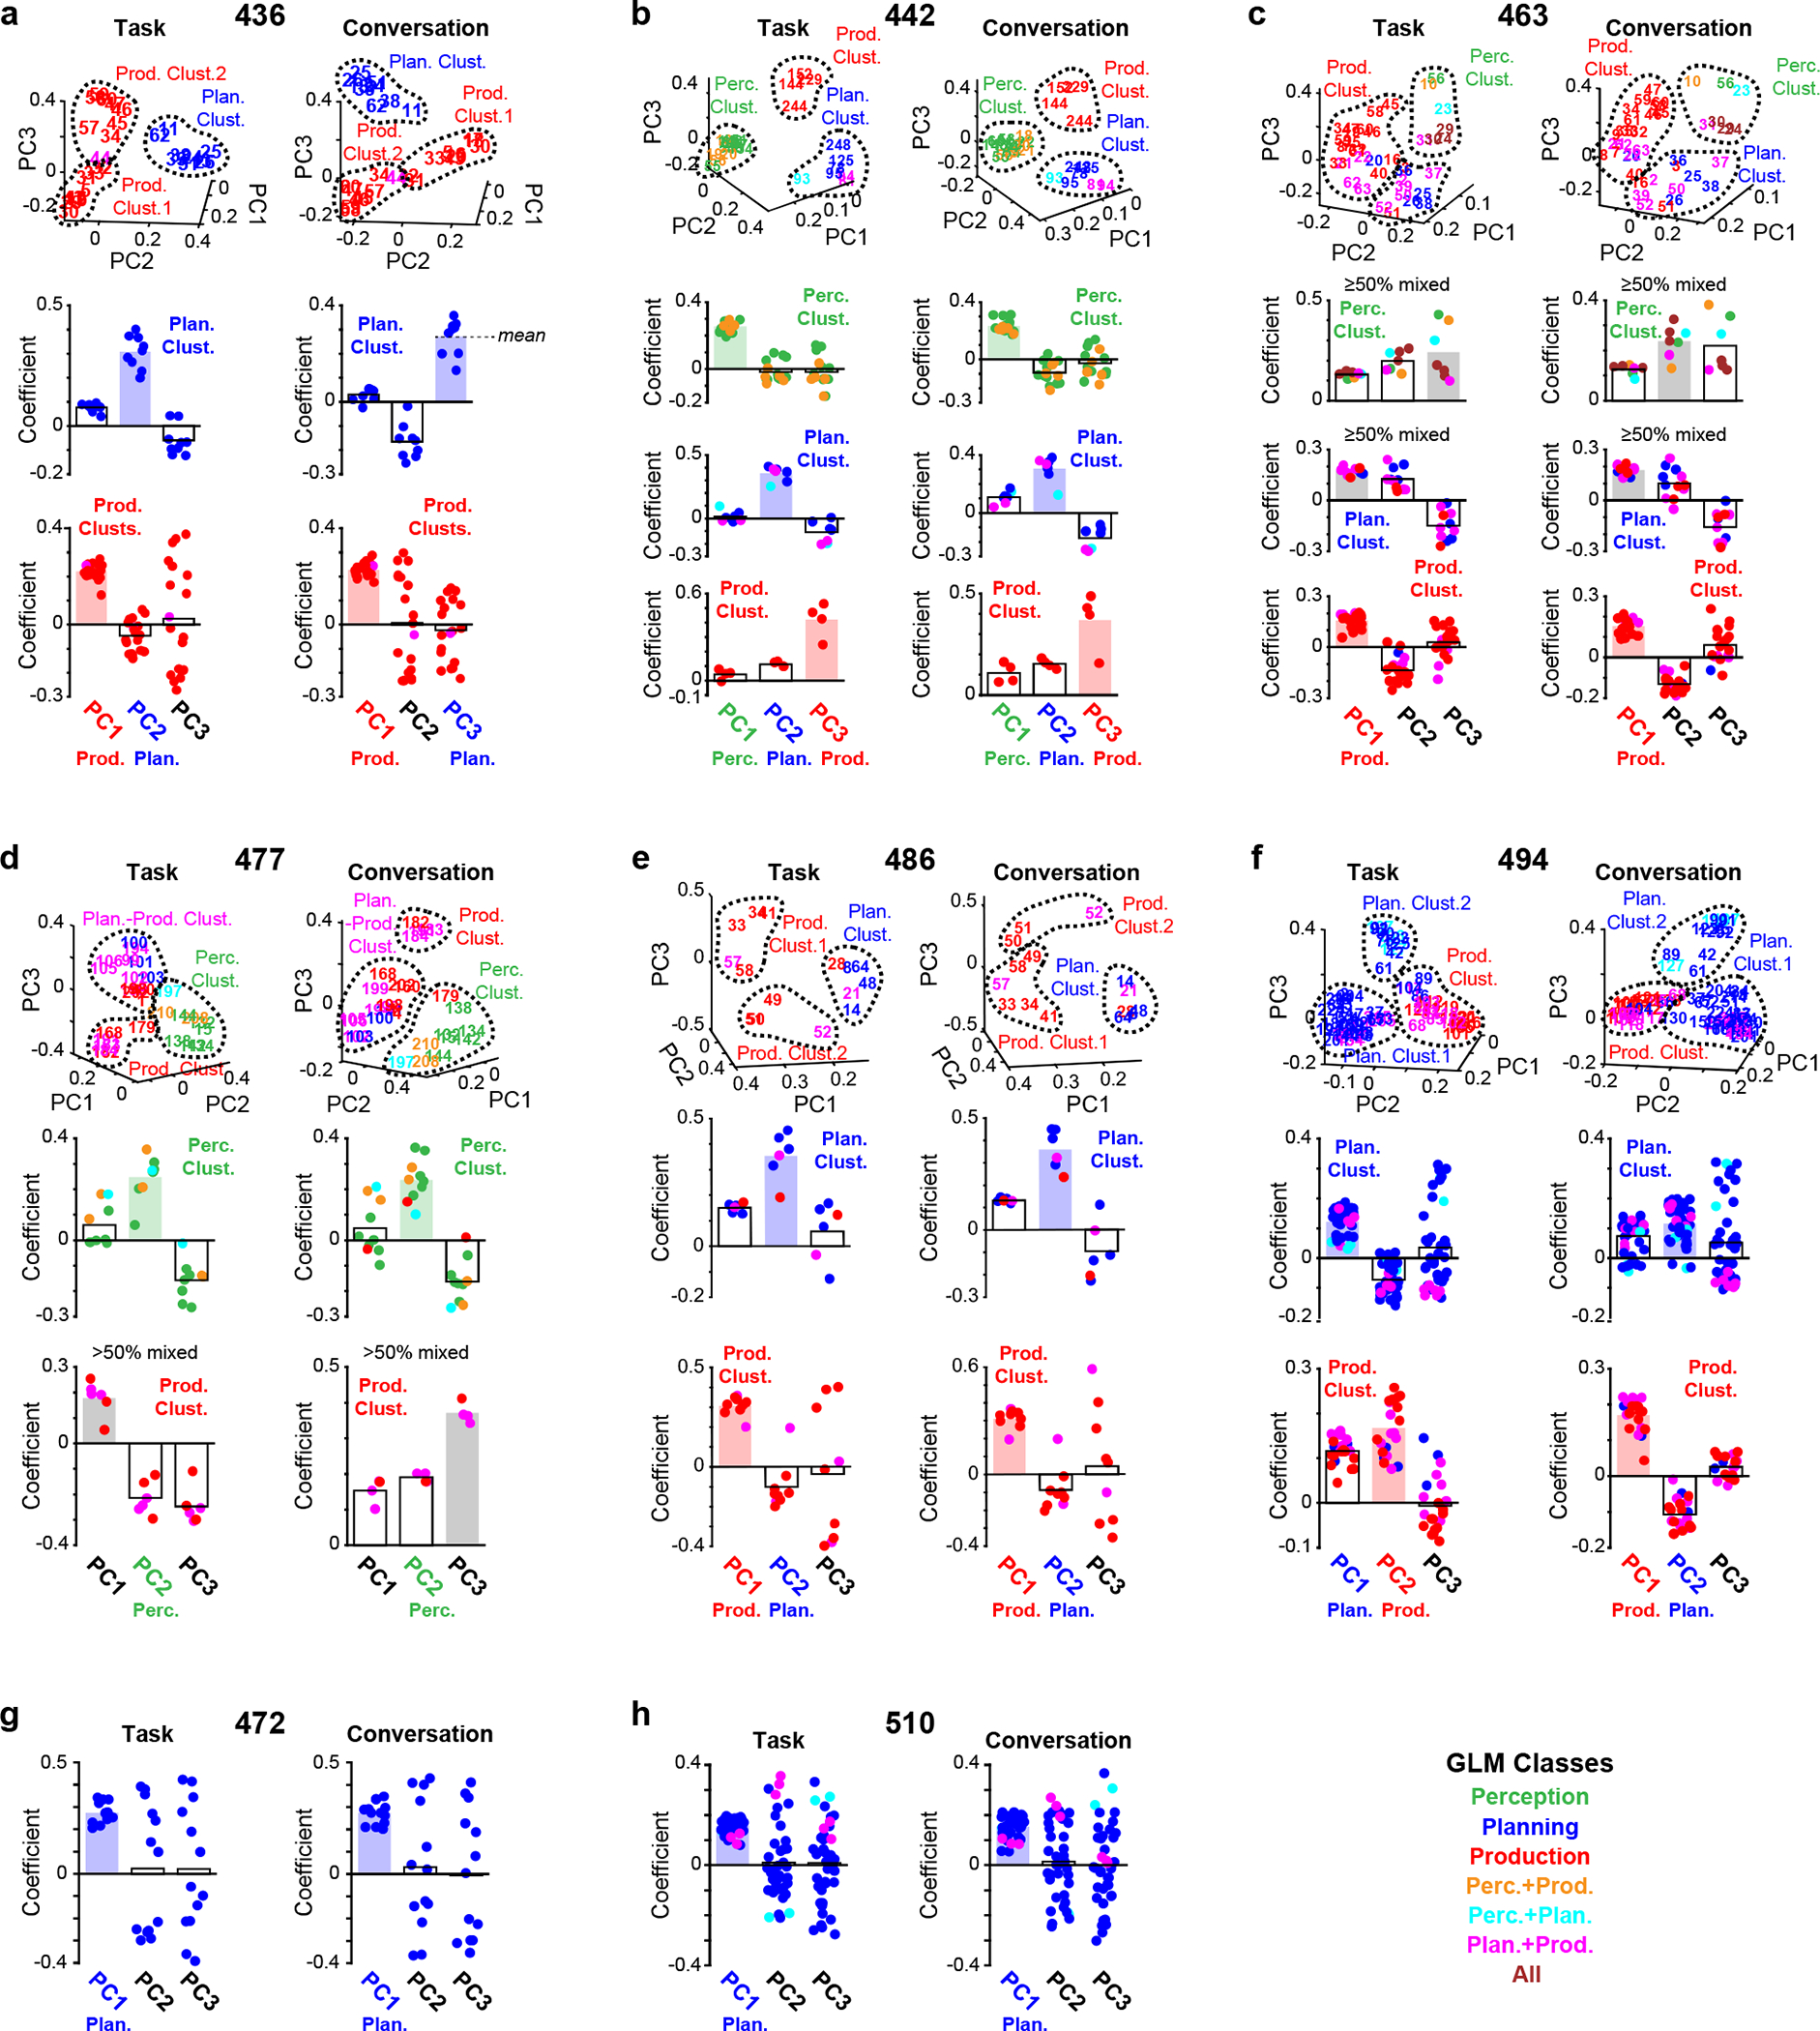
a-f, For 6 participants possessing sufficient numbers of electrodes belonging to multiple GLM classes (see Methods): scatterplots depicting electrode distributions in PC coefficient space in the task and conversation periods (top row). Bar graphs depicting the PC coefficients for all electrodes in perception clusters, planning clusters, or production clusters from the PCA performed on task data and conversation data (bottom rows). g,h, For 2 participants possessing mainly planning electrodes (see Methods and Extended Data Table 2): bar graphs depicting the PC coefficients for all planning-related electrodes from the PCA performed on task data and conversation data. In the bar graphs, the functional categorization of PCs is indicated by filled bars with either green (perception), blue (planning), or red (production). Any clusters rejected due to a high proportion (50%) of mixed electrodes are indicated with gray filled bars.
Extended Data Table 1.
List of all task stimuli
| Critical Information Task | ||
| Question Type | Early critical information | Late critical information |
| Animals * | What animals, who cluck, are often seen on farms or in zoos? | Which animals, who are often seen on farms or in zoos, cluck? |
| What animals, who moo, are often found either on farms or in zoos? | Which animals, who are often seen either on farms or in zoos, moo? | |
| Which animals, who oink, are often found either on farms or in zoos? | Which animals, who are often found either on farms or in zoos, oink? | |
| Which animals, who neigh, are often found either on farms or in zoos? | What animals, who are often seen either on farms or in zoos, neigh? | |
| What animals, who quack, are often found either on farms or in zoos? | Which animals, who are often seen on farms or in zoos, quack? | |
| What animals, who meow, are often seen either on farms or in zoos? | What animals, who are often found on farms or in zoos, meow? | |
| What animals, who bark, are often seen either on farms or in zoos? | Which animals, who are often found either on farms or in zoos, bark? | |
| Which animals, who ribbit, are often found on farms or in zoos? | Which animals, who are often found on farms or in zoos, ribbit? | |
| What animals, who tweet, are often seen on farms or in zoos? | Which animals, who are often seen on farms or in zoos, tweet? | |
| What animals, who roar, are often seen on farms or in zoos? | What animals, who are often seen on farms or in zoos, roar? | |
| Which animals, who howl at the moon, are often seen either on farms or in zoos? | What animals, who are often found either on farms or in zoos, howl at the moon? | |
| Which animals, who laugh like people, are often found on farms or in zoos? | Which animals, who are often found either on farms or in zoos, laugh like people? | |
| What animals, who can imitate speech, are often found either on farms or in zoos? | What animals, who are often found on farms or in zoos, can imitate speech? | |
| What animals, who hiss, are often found on farms or in zoos? | What animals, who are often found either on farms or in zoos, hiss? | |
| Which animals, who squeak, are often seen either on farms or in zoos? | Which animals, who are often seen on farms or in zoos, squeak? | |
| Which animals, who baa, are often seen either on farms or in zoos? | What animals, who are often found on farms or in zoos, baa? | |
| Which animals, who gobble, are often seen on farms or in zoos? | What animals, who are often seen on farms or in zoos, gobble? | |
| Which animals, who crow at sunrise, are often seen either on farms or in zoos? | What animals, who are often seen either on farms or in zoos, crow at sunrise? | |
| Which animals, who hee-haw, are often found on farms or in zoos? | What animals, who are often seen either on farms or in zoos, hee-haw? | |
| What animals, who honk, are often found on farms or in zoos? | Which animals, who are often found on farms or in zoos, honk? | |
| Antonyms ** | The opposite of soft is what frequent word? | Which common word is the opposite of soft? |
| The opposite of nice is which common word? | What word is the opposite of nice? | |
| The opposite of sad is what familiar word? | Which familiar word is the opposite of sad? | |
| The opposite of hot is what common word? | What word is the opposite of hot? | |
| The opposite of hungry is which familiar word? | Which familiar word is the opposite of hungry? | |
| The opposite of fast is what common word? | Which word is the opposite of fast? | |
| The opposite of small is which word? | What word is the opposite of small? | |
| The opposite of first is what word? | Which word is the opposite of first? | |
| The opposite of rich is what frequent word? | Which frequent word is the opposite of rich? | |
| The opposite of easy is which frequent word? | What common word is the opposite of easy? | |
| The opposite of pretty is what common word? | Which frequent word is the opposite of pretty? | |
| The opposite of wet is which frequent word? | What frequent word is the opposite of wet? | |
| The opposite of strong is which common word? | What common word is the opposite of strong? | |
| The opposite of bad is which common word? | What frequent word is the opposite of bad? | |
| The opposite of tall is which familiar word? | What familiar word is the opposite of tall? | |
| The opposite of late is which common word? | Which frequent word is the opposite of late? | |
| The opposite of heavy is which word? | What frequent word is the opposite of heavy? | |
| The opposite of old is what word? | What familiar word is the opposite of old? | |
| The opposite of false is what familiar word? | Which familiar word is the opposite of false? | |
| The opposite of happy is what word? | What word is the opposite of happy? | |
| The opposite of clean is which word? | What familiar word is the opposite of clean? | |
| The opposite of war is what word? | What word is the opposite of war? | |
| The opposite of big is what familiar word? | What familiar word is the opposite of big? | |
| The opposite of stop is what familiar word? | What familiar word is the opposite of stop? | |
| The opposite of rare is what familiar word? | What familiar word is the opposite of rare? | |
| The opposite of float is what familiar word? | What familiar word is the opposite of float? | |
| The opposite of hate is what word? | What word is the opposite of hate? | |
| The opposite of life is what word? | What word is the opposite of life? | |
| Body Parts ** | How many fingers does a healthy person have? | A healthy human has how many fingers? |
| How many toes does a man have? | A human has how many toes? | |
| How many arms does a human being have? | The average human being has how many arms? | |
| How many legs does a healthy person have? | A typical man has how many legs? | |
| How many hands does the average human have? | A healthy woman has how many hands? | |
| How many heads does a typical person have? | The average woman has how many heads? | |
| How many mouths does a human have? | A woman has how many mouths? | |
| How many eyes does a human being have? | A person has how many eyes? | |
| How many ears does a healthy woman have? | A healthy human being has how many ears? | |
| How many shoulders does a woman have? | A healthy man has how many shoulders? | |
| How many knees does a man have? | A typical person has how many knees? | |
| How many elbows does the average person have? | A typical human has how many elbows? | |
| How many feet does a typical man have? | The average human being has how many feet? | |
| How many eyebrows does a typical human have? | The average human has how many eyebrows? | |
| How many kidneys does a person have? | A healthy human being has how many kidneys? | |
| How many hearts does a typical human being have? | The average woman has how many hearts? | |
| How many necks does a typical woman have? | A typical human being has how many necks? | |
| How many noses does a typical woman have? | A healthy human has how many noses? | |
| How many finger nails does a healthy man have? | The average man has how many finger nails? | |
| How many toes nails does the average person have? | The average man has how many toes nails? | |
| Miscellaneous*** | N/A | What is a fruit, that is very good for you, that is red? |
| N/A | What is a commonly consumed vegetable that is red? | |
| Command Response Tasks | ||
| CR Task | Early critical information | Late critical information |
| CR1 - Hand Movements | Click the button one time with your right hand. | With your right hand, click the button one time. |
| Click the button two times with your right hand. | With your right hand, click the button two times. | |
| Click the button three times with your right hand. | With your right hand, click the button three times. | |
| Click the button four times with your right hand. | With your right hand, click the button four times. | |
| CR2 - Hand Movements | Stick out your tongue so it can be seen on the camera. | So it can be seen on the camera, stick out your tongue. |
| Open your mouth so it can be seen on the camera. | So it can be seen on the camera, open your mouth. | |
| Pucker your lips so it can be seen on the camera. | So it can be seen on the camera, pucker your lips. | |
| Make a smile so it can be seen on the camera. | So it can be seen on the camera, make a smile. | |
| CR3a**** - Monosyllabic Pseudoword Repetition | Repeat the sound ka so it can be heard clearly. | So it can be heard clearly, repeat the sound ka. |
| Repeat the sound ta so it can be heard clearly. | So it can be heard clearly, repeat the sound ta. | |
| Repeat the sound ga so it can be heard clearly. | So it can be heard clearly, repeat the sound ga. | |
| Repeat the sound da so it can be heard clearly. | So it can be heard clearly, repeat the sound da. | |
| CR3b**** - Disyllabic Pseudoword Repetition | Repeat the sound kaka so it can be heard clearly. | So it can be heard clearly, repeat the sound kaka. |
| Repeat the sound tata so it can be heard clearly. | So it can be heard clearly, repeat the sound tata. | |
| Repeat the sound gaga so it can be heard clearly. | So it can be heard clearly, repeat the sound gaga. | |
| Repeat the sound dada so it can be heard clearly. | So it can be heard clearly, repeat the sound dada. | |
| CR3c - Monosyllabic Word Repetition | Say the word cat so it can be heard clearly. | So it can be heard clearly, say the word cat. |
| Say the word dog so it can be heard clearly. | So it can be heard clearly, say the word dog. | |
| Say the word cow so it can be heard clearly. | So it can be heard clearly, say the word cow. | |
| Say the word duck so it can be heard clearly. | So it can be heard clearly, say the word duck. | |
| CR4a - Regular Pluralization | Say the plural of cat so it can be heard clearly. | So it can be heard clearly, say the plural of cat. |
| Say the plural of dog so it can be heard clearly. | So it can be heard clearly, say the plural of dog. | |
| Say the plural of cow so it can be heard clearly. | So it can be heard clearly, say the plural of cow. | |
| Say the plural of duck so it can be heard clearly. | So it can be heard clearly, say the plural of duck. | |
| CR4b - Irregular Pluralization | Say the plural of goose so it can be heard clearly. | So it can be heard clearly, say the plural of goose. |
| Say the plural of foot so it can be heard clearly. | So it can be heard clearly, say the plural of foot. | |
| Say the plural of man so it can be heard clearly. | So it can be heard clearly, say the plural of man. | |
| Say the plural of mouse so it can be heard clearly. | So it can be heard clearly, say the plural of mouse. | |
For intraoperative patients, usually only the first 7 stimuli were used and the words “or in zoos” were omitted.
For intraoperative patients, usually only the first 7 stimuli were used.
Stimuli only used for 436, who was the first participant of the study. Data from these questions were not included in the response amplitude analysis reported in Extended Data Figure 1.
For some participants, the word “say” was used instead of “repeat”.
Extended Data Table 2.
Participant information
| Code | Age | Sex | Type | Handedness | Wada Testing | Pathology/Diagnosis | Tumor location/seizure loci | Tasks Completed | Data Rejected | Notes |
|---|---|---|---|---|---|---|---|---|---|---|
| 436 | 58 | F | Acute | RH | N/A | Grade II oligodendroglioma (tumor) | Left middle frontal gyrus | CI questions; conversation | N/A | N/A |
| 442 | 35 | F | Chronic | 70+ | LH language dominant | epilepsy | Multifocal onset | CI questions; CR1, CR2, CR3a, CR3c, CR4a, CR4b; conversation | N/A | CR and CI trials not interleaved. |
| 463 | 65 | M | Acute | ambidextrous | N/A | Glioblastoma (tumor) | Left parahippocampal gyrus | CI questions; CR1, CR2, CR3a, CR4b; conversation | Excluded from CR analysis as only 2 pluralization trials (CR4) were completed correctly; planning and perception electrode clusters rejected from PC functional analysis (≥50% mixed electrodes) | N/A |
| 472 | 32 | M | Acute | RH | N/A | Vascular malformation, focal cortical dysplasia TIIIc (tumor) | Left temporal pole | CI questions; CR1, CR2, CR3a, CR4b; conversation | Excluded from PCA clustering analysis (n = 0 unmixed perception and n = 0 unmixed production electrodes) | N/A |
| 477 | 24 | F | Chronic | 80+ | LH language dominant | epilepsy/mild gliosis | Left parietal seizure focus | CI questions; CR1, CR2, CR3a, CR3b, CR4a, CR4b; conversation | Production electrode cluster rejected from PC functional analysis (≥50% mixed electrodes); mixed planning-production electrode cluster rejected from PC functional analysis | N/A |
| 486 | 53 | M | Acute | RH | LH language dominant | Glioblastoma (tumor) | Left inferior frontal gyrus | CI questions; CR1, CR2, CR3a, CR4b; conversation | N/A | N/A |
| 494 | 30 | M | Acute | 70+ | LH language dominant | Hippocampal sclerosis (epilepsy) | Left hippocampus | CI questions; CR1, CR2, CR3a, CR4b; conversation | N/A | N/A |
| 510 | 54 | M | Acute | RH | N/A | Anaplastic Oligodendroglioma (tumor) | Left inferior frontal gyrus | CI questions; CR1, CR2, CR3a, CR4b; conversation | Excluded from PCA clustering analysis (n = 0 unmixed perception and n = 1 unmixed production electrodes). | N/A |
Extended Data Table 3a.
All electrode locations and GLM classifications
| Patient | Electrode | Rejected by Jittering Analysis? | GLM Weights (z) | MNI Coordinates | CIT168 to MNI Coordinates | DKT Label | |||||||||
|---|---|---|---|---|---|---|---|---|---|---|---|---|---|---|---|
| Number | GLM Designation | Trial | Perception | Planning | Production | X | Y | Z | X | Y | Z | Automatic | Corrected (GC-CK-JG) | ||
| 436L Intraoperative | 1 | Excluded - Artifactual | N/A | −57.53 | −37.93 | 35.55 | −59.77 | −34.40 | 42.96 | Left supramarginal gyrus | |||||
| 2 | YES | N.S. | N.S. | 0.25757 | N.S. | −58.11 | −33.17 | 34.71 | −60.11 | −29.29 | 41.12 | Left supramarginal gyrus | |||
| 3 | Excluded - Artifactual | N/A | −58.71 | −28.40 | 33.91 | −60.47 | −24.20 | 39.14 | Left supramarginal gyrus | ||||||
| 4 | Excluded - Artifactual | N/A | −59.30 | −23.64 | 33.09 | −60.67 | −19.44 | 37.26 | Left postcentral gyrus | ||||||
| 5 | Production | NO | N.S. | N.S. | N.S. | 0.5188129 | −59.83 | −18.89 | 32.23 | −60.86 | −14.50 | 36.23 | Left postcentral gyrus | ||
| 6 | YES | N.S. | N.S. | N.S. | N.S. | −60.23 | −14.14 | 31.27 | −61.20 | −9.42 | 35.36 | Left postcentral gyrus | |||
| 7 | YES | N.S. | N.S. | N.S. | 0.3881277 | −60.43 | −9.41 | 30.14 | −62.04 | −4.46 | 34.47 | Left precentral gyrus | |||
| 8 | YES | N.S. | N.S. | N.S. | N.S. | −60.36 | −4.70 | 28.78 | −62.55 | 0.54 | 33.36 | Left precentral gyrus | |||
| 9 | YES | N.S. | N.S. | N.S. | N.S. | −60.07 | −0.02 | 27.26 | −62.18 | 5.36 | 31.51 | Left precentral gyrus | |||
| 10 | YES | −0.246621886 | N.S. | 0.20485 | 0.3595874 | −59.66 | 4.66 | 25.65 | −61.28 | 10.17 | 29.30 | Left precentral gyrus | |||
| 11 | Planning | NO | 0.299508389 | N.S. | 0.44039 | N.S. | −59.18 | 9.33 | 23.99 | −59.22 | 14.43 | 26.41 | Left pars opercularis | ||
| 12 | Excluded - Artifactual | N/A | −58.69 | 14.00 | 22.33 | −58.87 | 18.27 | 24.23 | Left pars opercularis | ||||||
| 13 | Planning | NO | N.S. | N.S. | 0.7416 | N.S. | −58.25 | 18.68 | 20.70 | −58.49 | 22.04 | 22.61 | Left pars opercularis | ||
| 14 | YES | N.S. | N.S. | N.S. | 0.2736352 | −53.93 | −37.04 | 40.51 | −55.85 | −32.72 | 47.58 | Left supramarginal gyrus | Left postcentral gyrus | ||
| 15 | YES | N.S. | N.S. | N.S. | 0.2957145 | −54.53 | −32.28 | 39.66 | −56.29 | −28.13 | 45.90 | Left postcentral gyrus | |||
| 16 | Production | NO | N.S. | −0.202617537 | N.S. | 0.5448633 | −55.16 | −27.51 | 38.85 | −56.83 | −23.37 | 44.17 | Left supramarginal gyrus | Left postcentral gyrus | |
| 17 | Production | NO | N.S. | N.S. | N.S. | 0.4011025 | −55.79 | −22.74 | 38.03 | −57.30 | −18.67 | 42.49 | Left postcentral gyrus | ||
| 18 | Production | NO | N.S. | N.S. | N.S. | 0.543027 | −56.36 | −17.98 | 37.17 | −57.55 | −13.93 | 41.30 | Left postcentral gyrus | ||
| 19 | NO | N.S. | N.S. | N.S. | N.S. | −56.83 | −13.22 | 36.22 | −57.61 | −8.98 | 40.33 | Left precentral gyrus | |||
| 20 | YES | N.S. | N.S. | N.S. | N.S. | −57.09 | −8.48 | 35.11 | −57.93 | −3.69 | 39.52 | Left precentral gyrus | |||
| 21 | YES | N.S. | N.S. | N.S. | N.S. | −57.01 | −3.77 | 33.72 | −58.92 | 1.39 | 38.38 | Left precentral gyrus | |||
| 22 | YES | N.S. | N.S. | N.S. | N.S. | −56.73 | 0.92 | 32.16 | −59.29 | 6.29 | 36.68 | Left precentral gyrus | |||
| 23 | YES | N.S. | N.S. | 0.22356 | N.S. | −56.33 | 5.60 | 30.53 | −58.28 | 11.06 | 34.46 | Left precentral gyrus | |||
| 24 | Planning | NO | N.S. | −0.204891664 | 0.35086 | N.S. | −55.86 | 10.27 | 28.85 | −56.28 | 14.86 | 31.61 | Left pars opercularis | ||
| 25 | Planning | NO | N.S. | N.S. | 0.48775 | N.S. | −55.39 | 14.95 | 27.19 | −55.72 | 18.63 | 29.39 | Left pars opercularis | ||
| 26 | Planning | NO | N.S. | N.S. | 0.83801 | N.S. | −54.97 | 19.62 | 25.56 | −55.59 | 22.71 | 27.52 | Left pars opercularis | ||
| 27 | YES | N.S. | N.S. | N.S. | 0.2793434 | −50.29 | −36.16 | 45.47 | −51.56 | −31.95 | 52.55 | Left postcentral gyrus | |||
| 28 | YES | N.S. | N.S. | N.S. | N.S. | −50.90 | −31.39 | 44.60 | −52.14 | −27.61 | 51.05 | Left postcentral gyrus | |||
| 29 | Production | NO | N.S. | −0.206478079 | N.S. | 0.5294417 | −51.54 | −26.62 | 43.76 | −52.95 | −23.36 | 49.56 | Left postcentral gyrus | ||
| 30 | Production | NO | N.S. | N.S. | N.S. | 0.4174418 | −52.18 | −21.84 | 42.91 | −53.71 | −18.92 | 47.69 | Left postcentral gyrus | ||
| 31 | Production | NO | N.S. | −0.241816995 | N.S. | 0.8817166 | −52.77 | −17.08 | 42.02 | −54.38 | −14.47 | 46.24 | Left postcentral gyrus | ||
| 32 | Production | NO | N.S. | N.S. | N.S. | 0.9627801 | −53.23 | −12.32 | 41.03 | −54.73 | −9.72 | 45.26 | Left precentral gyrus | ||
| 33 | Production | NO | N.S. | N.S. | N.S. | 0.4099064 | −53.50 | −7.58 | 39.88 | −54.77 | −4.06 | 44.48 | Left precentral gyrus | ||
| 34 | Production | NO | N.S. | N.S. | N.S. | 0.5938367 | −53.49 | −2.86 | 38.51 | −54.34 | 1.26 | 42.74 | Left precentral gyrus | ||
| 35 | YES | N.S. | N.S. | N.S. | N.S. | −53.27 | 1.84 | 36.97 | −54.22 | 5.93 | 40.89 | Left precentral gyrus | |||
| 36 | YES | N.S. | N.S. | N.S. | 0.2609964 | −52.93 | 6.53 | 35.34 | −53.37 | 10.34 | 39.00 | Left precentral gyrus | |||
| 37 | YES | N.S. | N.S. | 0.22927 | N.S. | −52.52 | 11.22 | 33.68 | −52.30 | 14.37 | 37.00 | Left precentral gyrus | |||
| 38 | Planning | NO | N.S. | −0.277229163 | 0.28887 | N.S. | −52.11 | 15.90 | 32.02 | −52.03 | 18.50 | 34.80 | Left pars opercularis | ||
| 39 | Planning | NO | N.S. | N.S. | 0.38464 | N.S. | −51.72 | 20.58 | 30.41 | −52.34 | 23.08 | 32.51 | Left pars opercularis | ||
| 40 | Excluded - Artifactual | N/A | −46.63 | −35.28 | 50.41 | −47.60 | −31.49 | 58.44 | Left postcentral gyrus | ||||||
| 41 | NO | N.S. | N.S. | N.S. | N.S. | −47.23 | −30.51 | 49.51 | −47.86 | −27.13 | 56.89 | Left postcentral gyrus | |||
| 42 | Excluded - Artifactual | N/A | −47.87 | −25.73 | 48.63 | −48.22 | −22.78 | 55.06 | Left postcentral gyrus | ||||||
| 43 | Production | NO | N.S. | N.S. | N.S. | 0.6803557 | −48.51 | −20.96 | 47.73 | −49.18 | −18.45 | 52.96 | Left postcentral gyrus | Left precentral gyrus | |
| 44 | Planning-Production | NO | N.S. | −0.37831231 | 0.27894 | 0.8914032 | −49.08 | −16.19 | 46.79 | −50.22 | −13.87 | 51.45 | Left precentral gyrus | ||
| 45 | Production | NO | N.S. | N.S. | N.S. | 0.9633869 | −49.52 | −11.43 | 45.75 | −51.03 | −9.19 | 50.74 | Left precentral gyrus | ||
| 46 | Production | NO | 0.233344565 | N.S. | N.S. | 0.7261057 | −49.79 | −6.68 | 44.56 | −51.23 | −3.90 | 50.08 | Left precentral gyrus | ||
| 47 | Production | NO | N.S. | −0.232255414 | N.S. | 0.4176748 | −49.84 | −1.95 | 43.20 | −50.57 | 1.31 | 48.19 | Left precentral gyrus | ||
| 48 | YES | N.S. | N.S. | N.S. | N.S. | −49.71 | 2.76 | 41.69 | −49.72 | 5.97 | 45.93 | Left caudal middle frontal gyrus | |||
| 49 | YES | N.S. | N.S. | N.S. | 0.2463998 | −49.46 | 7.46 | 40.10 | −49.04 | 10.32 | 44.02 | Left caudal middle frontal gyrus | |||
| 50 | YES | N.S. | N.S. | 0.20577 | 0.2490346 | −49.14 | 12.15 | 38.46 | −48.82 | 14.67 | 42.26 | Left precentral gyrus | Left caudal middle frontal gyrus | ||
| 51 | Planning | NO | N.S. | N.S. | 0.37714 | N.S. | −48.78 | 16.84 | 36.82 | −48.68 | 18.89 | 40.31 | Left pars opercularis | Left caudal middle frontal gyrus | |
| 52 | YES | N.S. | N.S. | 0.30163 | 0.2393926 | −48.44 | 21.53 | 35.24 | −48.15 | 23.29 | 37.82 | Left rostral middle frontal gyrus | |||
| 53 | YES | N.S. | N.S. | N.S. | N.S. | −42.97 | −34.39 | 55.31 | −44.29 | −30.69 | 64.60 | Left postcentral gyrus | |||
| 54 | YES | N.S. | N.S. | N.S. | N.S. | −43.56 | −29.62 | 54.38 | −44.47 | −26.34 | 62.92 | Left postcentral gyrus | |||
| 55 | YES | −0.272407936 | N.S. | N.S. | N.S. | −44.19 | −24.84 | 53.46 | −44.64 | −21.98 | 60.91 | Left postcentral gyrus | |||
| 56 | NO | N.S. | N.S. | −0.16439 | N.S. | −44.80 | −20.07 | 52.51 | −45.23 | −17.65 | 58.72 | Left precentral gyrus | |||
| 57 | Production | NO | −0.265519531 | −0.207795467 | N.S. | 1.0455253 | −45.34 | −15.30 | 51.51 | −46.15 | −13.13 | 56.72 | Left precentral gyrus | ||
| 58 | Production | NO | N.S. | N.S. | N.S. | 0.8295242 | −45.76 | −10.54 | 50.42 | −46.44 | −8.39 | 55.57 | Left precentral gyrus | ||
| 59 | Production | NO | N.S. | N.S. | N.S. | 0.7187525 | −46.03 | −5.79 | 49.20 | −46.70 | −3.77 | 54.78 | Left precentral gyrus | ||
| 60 | Production | NO | N.S. | N.S. | N.S. | 0.4652766 | −46.14 | −1.05 | 47.85 | −46.76 | 1.13 | 53.61 | Left caudal middle frontal gyrus | ||
| 61 | YES | N.S. | −0.187775583 | N.S. | 0.2325704 | −46.09 | 3.67 | 46.38 | −46.53 | 6.01 | 51.89 | Left caudal middle frontal gyrus | |||
| 62 | Planning | NO | N.S. | N.S. | 0.28976 | N.S. | −45.92 | 8.38 | 44.82 | −46.21 | 10.48 | 49.79 | Left caudal middle frontal gyrus | ||
| 63 | YES | −0.210930735 | N.S. | N.S. | N.S. | −45.68 | 13.08 | 43.22 | −45.94 | 14.97 | 47.60 | Left rostral middle frontal gyrus | |||
| 64 | YES | N.S. | N.S. | N.S. | N.S. | −45.40 | 17.78 | 41.61 | −45.72 | 19.63 | 45.48 | Left rostral middle frontal gyrus | |||
| 463L Intraoperative | 1 | Excluded - Artifactual | N/A | −59.36 | −7.75 | −21.40 | −63.20 | −6.90 | −30.69 | Left middle temporal gyrus | |||||
| 2 | Planning-Production | NO | N.S. | N.S. | 0.30705 | 0.2866195 | −58.31 | −4.77 | −17.18 | −62.69 | −3.54 | −27.41 | Left middle temporal gyrus | ||
| 3 | Production | NO | N.S. | −0.16580427 | N.S. | 0.2391814 | −57.37 | −1.83 | −12.95 | −62.14 | −0.15 | −23.87 | Left middle temporal gyrus | ||
| 4 | Excluded - Artifactual | N/A | −56.45 | 1.12 | −8.72 | −61.46 | 3.28 | −19.70 | Left middle temporal gyrus | ||||||
| 5 | YES | N.S. | N.S. | N.S. | 0.2794977 | −55.52 | 4.06 | −4.49 | −60.64 | 6.67 | −14.79 | Left middle temporal gyrus | |||
| 6 | YES | N.S. | N.S. | N.S. | 0.2729939 | −54.60 | 7.00 | −0.26 | −59.77 | 10.36 | −9.16 | Left superior temporal gyrus | |||
| 7 | Production | NO | N.S. | N.S. | N.S. | 0.4822546 | −53.69 | 9.93 | 3.97 | −58.29 | 13.44 | −4.18 | Left precentral gyrus | ||
| 8 | Production | NO | −0.338820362 | N.S. | N.S. | 0.7582374 | −52.83 | 12.86 | 8.20 | −56.82 | 16.26 | −0.83 | Left precentral gyrus | ||
| 9 | Production | NO | −0.483763704 | N.S. | N.S. | 0.6479538 | −52.02 | 15.76 | 12.44 | −56.22 | 20.26 | 2.33 | Left pars opercularis | ||
| 10 | Perception-Production | NO | N.S. | 0.548440014 | N.S. | 0.2279239 | −51.28 | 18.64 | 16.68 | −55.64 | 24.70 | 6.35 | Left pars opercularis | ||
| 11 | YES | N.S. | N.S. | N.S. | N.S. | −50.62 | 21.50 | 20.92 | −55.07 | 28.68 | 10.56 | Left pars opercularis | |||
| 12 | Excluded - Artifactual | N/A | −50.01 | 24.34 | 25.16 | −54.23 | 32.19 | 14.40 | Left pars opercularis | ||||||
| 13 | YES | N.S. | N.S. | N.S. | N.S. | −49.32 | 27.21 | 29.40 | −53.53 | 35.34 | 17.94 | Left caudal middle frontal gyrus | Left rostral middle frontal gyrus | ||
| 14 | YES | N.S. | N.S. | N.S. | 0.2744417 | −61.17 | −12.28 | −18.28 | −64.64 | −11.33 | −27.26 | Left middle temporal gyrus | |||
| 15 | YES | N.S. | N.S. | N.S. | 0.2382969 | −59.98 | −9.26 | −14.06 | −64.12 | −7.94 | −24.02 | Left middle temporal gyrus | |||
| 16 | Production | NO | N.S. | N.S. | N.S. | 0.3501959 | −58.85 | −6.25 | −9.84 | −63.48 | −4.76 | −20.70 | Left middle temporal gyrus | ||
| 17 | YES | N.S. | N.S. | 0.16509 | N.S. | −57.73 | −3.25 | −5.62 | −62.22 | −1.71 | −16.52 | Left middle temporal gyrus | Left superior temporal gyrus | ||
| 18 | YES | N.S. | N.S. | N.S. | N.S. | −56.61 | −0.24 | −1.40 | −61.60 | 1.87 | −11.43 | Left middle temporal gyrus | Left superior temporal gyrus | ||
| 19 | NO | N.S. | −0.180036929 | N.S. | N.S. | −55.49 | 2.76 | 2.82 | −61.16 | 5.97 | −5.41 | Left superior temporal gyrus | |||
| 20 | Planning | NO | 0.404202996 | −0.3524339 | 0.15759 | N.S. | −54.39 | 5.76 | 7.04 | −58.98 | 8.69 | −0.21 | Left precentral gyrus | ||
| 21 | Planning-Production | NO | N.S. | −0.18931978 | 0.20421 | 0.5966911 | −53.33 | 8.74 | 11.26 | −57.19 | 11.22 | 3.07 | Left precentral gyrus | ||
| 22 | Planning-Production | NO | N.S. | −0.12673648 | 0.15018 | 0.3963801 | −52.33 | 11.71 | 15.49 | −57.27 | 15.67 | 6.27 | Left pars opercularis | ||
| 23 | Perception-Planning | NO | N.S. | 0.605285025 | 0.28684 | N.S. | −51.40 | 14.65 | 19.72 | −56.59 | 20.46 | 10.44 | Left pars opercularis | ||
| 24 | Perception-Planning-Production | NO | N.S. | 0.53447814 | 0.62091 | 0.440486 | −50.57 | 17.56 | 23.95 | −55.68 | 24.76 | 14.95 | Left pars opercularis | ||
| 25 | Planning | NO | N.S. | N.S. | 0.47296 | N.S. | −49.82 | 20.45 | 28.19 | −55.01 | 28.21 | 19.02 | Left pars opercularis | ||
| 26 | Planning | NO | N.S. | −0.365201192 | 0.22575 | N.S. | −49.05 | 23.34 | 32.43 | −54.09 | 31.45 | 22.61 | Left rostral middle frontal gyrus | ||
| 27 | Excluded - Artifactual | N/A | −63.18 | −16.88 | −15.15 | −67.28 | −15.28 | −23.73 | Left middle temporal gyrus | ||||||
| 28 | YES | N.S. | N.S. | 0.14738 | N.S. | −61.84 | −13.80 | −10.94 | −65.91 | −11.98 | −20.04 | Left middle temporal gyrus | Left middle temporal gyrus | ||
| 29 | Perception-Planning-Production | NO | N.S. | 0.484041428 | 0.47432 | 0.345482 | −60.48 | −10.72 | −6.73 | −64.51 | −8.96 | −16.48 | Left superior temporal gyrus | ||
| 30 | Perception-Planning-Production | NO | −0.316957988 | 0.35337835 | 0.5149 | 0.5180013 | −59.12 | −7.64 | −2.52 | −63.22 | −6.08 | −12.67 | Left superior temporal gyrus | ||
| 31 | Planning-Production | NO | N.S. | N.S. | 0.18953 | 0.3234403 | −57.76 | −4.57 | 1.69 | −62.52 | −2.65 | −7.26 | Left superior temporal gyrus | ||
| 32 | Production | NO | N.S. | N.S. | N.S. | 0.6807492 | −56.42 | −1.49 | 5.90 | −62.22 | 1.32 | −1.24 | Left postcentral gyrus | ||
| 33 | Production | NO | N.S. | −0.239291929 | N.S. | 0.897202 | −55.10 | 1.58 | 10.11 | −60.46 | 3.55 | 3.25 | Left precentral gyrus | ||
| 34 | Production | NO | −0.381041128 | N.S. | N.S. | 1.1042034 | −53.82 | 4.63 | 14.32 | −58.18 | 6.13 | 6.78 | Left precentral gyrus | ||
| 35 | Production | NO | −0.33679518 | N.S. | N.S. | 0.7685204 | −52.59 | 7.67 | 18.54 | −57.20 | 10.65 | 10.50 | Left precentral gyrus | ||
| 36 | Planning | NO | 0.324823236 | N.S. | 0.25807 | N.S. | −51.44 | 10.68 | 22.76 | −57.60 | 15.83 | 14.73 | Left pars opercularis | ||
| 37 | Planning-Production | NO | N.S. | N.S. | 0.48176 | 0.3520618 | −50.38 | 13.67 | 26.98 | −56.79 | 20.13 | 19.21 | Left pars opercularis | ||
| 38 | Planning | NO | N.S. | N.S. | 0.45348 | N.S. | −49.45 | 16.61 | 31.21 | −55.59 | 23.50 | 23.47 | Left pars opercularis | ||
| 39 | Planning-Production | NO | N.S. | −0.247049633 | 0.22404 | 0.3369419 | −48.60 | 19.53 | 35.44 | −54.88 | 27.24 | 27.62 | Left pars opercularis | Left caudal middle frontal gyrus | |
| 40 | Production | NO | 0.200086812 | −0.221967324 | N.S. | 0.2624638 | −65.19 | −21.47 | −12.01 | −68.86 | −19.65 | −19.30 | Left middle temporal gyrus | ||
| 41 | YES | N.S. | N.S. | N.S. | N.S. | −63.70 | −18.35 | −7.81 | −67.35 | −15.85 | −14.98 | Left middle temporal gyrus | |||
| 42 | Excluded - Artifactual | N/A | −62.12 | −15.20 | −3.61 | −65.39 | −12.38 | −10.36 | Left superior temporal gyrus | ||||||
| 43 | YES | N.S. | N.S. | N.S. | N.S. | −60.52 | −12.04 | 0.58 | −63.83 | −9.43 | −6.14 | Left superior temporal gyrus | |||
| 44 | YES | N.S. | 0.493532474 | 0.18991 | 0.4389757 | −58.93 | −8.89 | 4.78 | −63.67 | −5.90 | −0.89 | Left superior temporal gyrus | |||
| 45 | Production | NO | −0.518154137 | N.S. | N.S. | 0.4919819 | −57.37 | −5.75 | 8.98 | −63.04 | −2.84 | 4.60 | Left postcentral gyrus | ||
| 46 | Production | NO | N.S. | N.S. | N.S. | 0.4533271 | −55.84 | −2.61 | 13.18 | −61.50 | −0.70 | 8.96 | Left precentral gyrus | ||
| 47 | Production | NO | N.S. | N.S. | N.S. | 0.6668852 | −54.34 | 0.51 | 17.38 | −59.47 | 1.95 | 12.36 | Left precentral gyrus | ||
| 48 | YES | N.S. | N.S. | N.S. | 0.2230687 | −52.88 | 3.62 | 21.59 | −57.65 | 6.00 | 15.46 | Left precentral gyrus | |||
| 49 | YES | N.S. | −0.223508435 | N.S. | N.S. | −51.49 | 6.71 | 25.79 | −56.98 | 10.73 | 19.52 | Left precentral gyrus | |||
| 50 | Planning-Production | NO | 0.261051214 | N.S. | 0.19476 | 0.2545687 | −50.19 | 9.77 | 30.01 | −56.92 | 14.95 | 24.23 | Left pars opercularis | ||
| 51 | Production | NO | N.S. | −0.3082805 | N.S. | 0.2524143 | −49.06 | 12.78 | 34.23 | −56.71 | 19.00 | 28.92 | Left pars opercularis | ||
| 52 | Planning-Production | NO | 0.195069386 | −0.310855838 | 0.16372 | 0.2745816 | −48.18 | 15.71 | 38.46 | −55.39 | 22.96 | 32.46 | Left caudal middle frontal gyrus | ||
| 53 | YES | N.S. | N.S. | N.S. | 0.2768078 | −67.00 | −26.00 | −8.89 | −70.56 | −24.25 | −15.02 | Left middle temporal gyrus | |||
| 54 | YES | N.S. | 0.150897445 | N.S. | N.S. | −65.37 | −22.84 | −4.70 | −68.55 | −20.04 | −10.11 | Left middle temporal gyrus | |||
| 55 | YES | −0.22297392 | N.S. | N.S. | N.S. | −63.61 | −19.63 | −0.51 | −66.07 | −15.97 | −4.59 | Left superior temporal gyrus | |||
| 56 | Perception | NO | N.S. | 0.589007833 | N.S. | N.S. | −61.83 | −16.41 | 3.68 | −65.34 | −12.21 | 0.77 | Left superior temporal gyrus | ||
| 57 | YES | N.S. | N.S. | N.S. | N.S. | −60.06 | −13.20 | 7.87 | −65.02 | −9.01 | 5.65 | Left postcentral gyrus | Left superior temporal gyrus | ||
| 58 | Production | NO | −0.365247602 | N.S. | N.S. | 0.6033718 | −58.31 | −10.00 | 12.06 | −63.53 | −6.83 | 9.72 | Left postcentral gyrus | ||
| 59 | Production | NO | −0.410804439 | N.S. | N.S. | 1.0408236 | −56.60 | −6.81 | 16.25 | −62.66 | −4.72 | 13.46 | Left postcentral gyrus | ||
| 60 | Production | NO | N.S. | N.S. | N.S. | 0.5821413 | −54.92 | −3.63 | 20.45 | −61.52 | −2.33 | 17.15 | Left precentral gyrus | ||
| 61 | Production | NO | −0.304387994 | N.S. | N.S. | 0.7779056 | −53.28 | −0.46 | 24.64 | −59.20 | 1.87 | 20.35 | Left precentral gyrus | ||
| 62 | Planning-Production | NO | 0.239540178 | −0.327519099 | 0.2512 | 0.5230921 | −51.69 | 2.69 | 28.84 | −57.48 | 6.02 | 24.39 | Left precentral gyrus | ||
| 63 | Planning-Production | NO | N.S. | N.S. | 0.29172 | 0.9096786 | −50.20 | 5.81 | 33.04 | −56.40 | 10.29 | 29.02 | Left precentral gyrus | ||
| 64 | YES | N.S. | −0.114595064 | N.S. | 0.2344248 | −48.89 | 8.88 | 37.25 | −56.54 | 14.49 | 33.36 | Left precentral gyrus | Left caudal middle frontal gyrus | ||
| 472L Intraoperative | 1 | Excluded - Artifactual | N/A | −66.30 | −13.74 | 11.37 | −67.42 | −11.23 | 10.82 | Left postcentral gyrus | |||||
| 2 | NO | 0.440167675 | −0.252981596 | N.S. | N.S. | −65.08 | −8.80 | 9.62 | −65.53 | −6.37 | 8.57 | Left postcentral gyrus | |||
| 3 | Planning | NO | 0.632257972 | −0.338431832 | 0.2988 | N.S. | −63.86 | −3.83 | 7.84 | −63.55 | −1.56 | 6.19 | Left postcentral gyrus | Left precentral gyrus | |
| 4 | Excluded - Artifactual | NO | −62.65 | 1.14 | 6.06 | −61.99 | 3.14 | 4.74 | Left precentral gyrus | ||||||
| 5 | Planning | NO | 0.478953792 | −0.351789372 | 0.30301 | N.S. | −61.44 | 6.12 | 4.28 | −61.06 | 8.51 | 3.06 | Left precentral gyrus | ||
| 6 | YES | 0.253921029 | −0.252644121 | N.S. | N.S. | −60.22 | 11.09 | 2.49 | −60.16 | 13.66 | 1.14 | Left precentral gyrus | Left pars opercularis | ||
| 7 | YES | N.S. | N.S. | 0.15893 | N.S. | −59.01 | 16.08 | 0.70 | −58.40 | 18.49 | −0.51 | Left pars opercularis | |||
| 8 | YES | N.S. | N.S. | N.S. | N.S. | −57.80 | 21.07 | −1.10 | −56.21 | 23.39 | −2.06 | Left pars triangularis | |||
| 9 | YES | N.S. | N.S. | N.S. | N.S. | −56.60 | 26.09 | −2.92 | −53.58 | 28.90 | −3.23 | Left pars triangularis | |||
| 10 | YES | N.S. | N.S. | N.S. | N.S. | −55.40 | 31.12 | −4.76 | −52.31 | 34.39 | −5.00 | Left pars triangularis | |||
| 11 | YES | N.S. | N.S. | N.S. | N.S. | −54.21 | 36.18 | −6.63 | −51.44 | 39.86 | −7.98 | Left pars triangularis | |||
| 12 | Excluded - Artifactual | N/A | −53.03 | 41.26 | −8.51 | −50.02 | 44.77 | −10.61 | Left pars orbitalis | ||||||
| 13 | YES | N.S. | N.S. | N.S. | N.S. | −51.83 | 46.32 | −10.37 | −48.86 | 49.82 | −12.88 | Left pars orbitalis | |||
| 14 | NO | 0.637884357 | −0.676395326 | N.S. | N.S. | −65.99 | −11.81 | 16.34 | −66.75 | −8.87 | 15.34 | Left postcentral gyrus | |||
| 15 | YES | 0.224192086 | −0.218652105 | N.S. | N.S. | −64.76 | −6.92 | 14.64 | −65.17 | −3.91 | 13.32 | Left postcentral gyrus | |||
| 16 | NO | 0.378802324 | −0.202053885 | N.S. | N.S. | −63.52 | −2.01 | 12.92 | −63.23 | 0.46 | 11.19 | Left precentral gyrus | |||
| 17 | Planning | NO | 1.011357061 | −0.537163882 | 0.73877 | −0.792162 | −62.29 | 2.90 | 11.20 | −61.42 | 4.82 | 9.79 | Left precentral gyrus | ||
| 18 | Planning | NO | 0.435273735 | −0.259550212 | 0.43448 | N.S. | −61.06 | 7.81 | 9.48 | −60.21 | 9.78 | 8.35 | Left precentral gyrus | ||
| 19 | YES | N.S. | N.S. | N.S. | N.S. | −59.83 | 12.73 | 7.76 | −59.20 | 14.91 | 6.67 | Left pars opercularis | |||
| 20 | YES | N.S. | N.S. | N.S. | N.S. | −58.60 | 17.64 | 6.03 | −57.56 | 20.07 | 4.83 | Left pars opercularis | |||
| 21 | YES | N.S. | N.S. | 0.47115 | N.S. | −57.38 | 22.58 | 4.29 | −55.24 | 25.58 | 3.32 | Left pars triangularis | |||
| 22 | YES | N.S. | N.S. | 0.27843 | N.S. | −56.16 | 27.53 | 2.53 | −53.28 | 31.03 | 1.86 | Left pars triangularis | |||
| 23 | Planning | NO | N.S. | N.S. | 0.83896 | N.S. | −54.94 | 32.50 | 0.75 | −52.27 | 36.37 | 0.44 | Left pars triangularis | ||
| 24 | YES | 0.38447788 | −0.224609399 | N.S. | N.S. | −53.74 | 37.51 | −1.07 | −51.45 | 41.93 | −2.32 | Left pars triangularis | |||
| 25 | YES | N.S. | N.S. | N.S. | N.S. | −52.54 | 42.54 | −2.90 | −50.24 | 47.12 | −5.19 | Left pars triangularis | |||
| 26 | YES | 0.473273848 | −0.538356945 | 0.16755 | N.S. | −51.34 | 47.57 | −4.73 | −48.74 | 51.77 | −7.49 | Left pars triangularis | Left rostral middle frontal gyrus | ||
| 27 | Excluded - Artifactual | N/A | −65.70 | −9.81 | 21.26 | −65.59 | −6.33 | 20.16 | Left postcentral gyrus | ||||||
| 28 | NO | 0.382639476 | −0.277674307 | N.S. | N.S. | −64.45 | −4.97 | 19.60 | −63.49 | −1.65 | 18.29 | Left precentral gyrus | |||
| 29 | YES | 0.286842858 | −0.213347758 | 0.13488 | N.S. | −63.20 | −0.13 | 17.96 | −61.95 | 2.63 | 16.65 | Left precentral gyrus | |||
| 30 | Planning | NO | 1.068651264 | −0.618537545 | 0.62218 | −0.747139 | −61.95 | 4.70 | 16.31 | −60.67 | 6.83 | 15.32 | Left precentral gyrus | ||
| 31 | YES | N.S. | N.S. | N.S. | N.S. | −60.69 | 9.53 | 14.66 | −59.81 | 11.44 | 14.11 | Left precentral gyrus | |||
| 32 | Planning | NO | N.S. | N.S. | 0.46617 | N.S. | −59.44 | 14.37 | 13.01 | −58.47 | 16.72 | 12.76 | Left pars opercularis | ||
| 33 | YES | N.S. | N.S. | N.S. | N.S. | −58.20 | 19.22 | 11.35 | −56.46 | 21.94 | 10.97 | Left pars opercularis | |||
| 34 | YES | N.S. | N.S. | 0.23722 | N.S. | −56.95 | 24.08 | 9.68 | −54.12 | 27.60 | 9.31 | Left pars opercularis | |||
| 35 | YES | 0.311999454 | −0.246335168 | 0.26925 | −0.272267 | −55.71 | 28.95 | 8.00 | −52.92 | 32.86 | 7.48 | Left pars triangularis | |||
| 36 | YES | 0.470987114 | −0.301629547 | N.S. | −0.313468 | −54.48 | 33.85 | 6.29 | −52.24 | 38.29 | 5.80 | Left pars triangularis | |||
| 37 | YES | N.S. | −0.344413712 | 0.3831 | N.S. | −53.25 | 38.78 | 4.54 | −51.58 | 43.94 | 3.27 | Left rostral middle frontal gyrus | |||
| 38 | YES | 0.449066103 | −0.459650249 | 0.19744 | N.S. | −52.04 | 43.76 | 2.76 | −50.05 | 48.87 | 0.50 | Left pars triangularis | |||
| 39 | YES | N.S. | −0.272628412 | N.S. | N.S. | −50.83 | 48.76 | 0.96 | −48.68 | 53.55 | −1.85 | Left pars triangularis | Left rostral middle frontal gyrus | ||
| 40 | Planning | NO | 0.539036948 | −0.50031757 | 0.17977 | N.S. | −65.41 | −7.81 | 26.17 | −64.27 | −3.87 | 25.18 | Left postcentral gyrus | ||
| 41 | YES | N.S. | −0.262695065 | 0.27019 | N.S. | −64.15 | −3.02 | 24.56 | −62.41 | 0.66 | 23.53 | Left precentral gyrus | |||
| 42 | Excluded - Artifactual | N/A | −62.87 | 1.74 | 22.99 | −61.24 | 5.24 | 22.28 | Left precentral gyrus | ||||||
| 43 | YES | 0.494673404 | −0.418444201 | N.S. | −0.367371 | −61.60 | 6.50 | 21.42 | −60.37 | 9.47 | 21.18 | Left precentral gyrus | |||
| 44 | YES | N.S. | N.S. | N.S. | N.S. | −60.33 | 11.26 | 19.84 | −59.63 | 14.00 | 20.22 | Left precentral gyrus | |||
| 45 | YES | N.S. | N.S. | N.S. | N.S. | −59.06 | 16.02 | 18.26 | −58.05 | 19.22 | 19.11 | Left pars opercularis | |||
| 46 | YES | N.S. | N.S. | N.S. | N.S. | −57.79 | 20.80 | 16.67 | −55.40 | 24.49 | 17.35 | Left pars opercularis | |||
| 47 | YES | N.S. | N.S. | N.S. | N.S. | −56.53 | 25.59 | 15.07 | −53.85 | 29.81 | 15.37 | Left pars opercularis | |||
| 48 | YES | 0.343138386 | N.S. | 0.35942 | N.S. | −55.27 | 30.39 | 13.45 | −52.59 | 34.55 | 13.21 | Left pars opercularis | Left pars triangularis | ||
| 49 | YES | N.S. | N.S. | 0.28328 | N.S. | −54.01 | 35.21 | 11.82 | −51.45 | 39.67 | 10.95 | Left pars triangularis | |||
| 50 | Planning | NO | N.S. | −0.395152957 | 0.39462 | N.S. | −52.76 | 40.06 | 10.15 | −50.64 | 45.18 | 8.63 | Left rostral middle frontal gyrus | ||
| 51 | Planning | NO | N.S. | −0.327776527 | 0.26532 | N.S. | −51.53 | 44.97 | 8.43 | −49.21 | 50.04 | 6.21 | Left rostral middle frontal gyrus | ||
| 52 | YES | N.S. | N.S. | 0.29785 | N.S. | −50.32 | 49.96 | 6.64 | −47.88 | 54.79 | 3.83 | Left rostral middle frontal gyrus | |||
| 53 | YES | N.S. | N.S. | N.S. | N.S. | −65.10 | −5.88 | 31.15 | −63.39 | −2.40 | 30.35 | Left postcentral gyrus | |||
| 54 | YES | N.S. | N.S. | N.S. | N.S. | −63.82 | −1.13 | 29.59 | −61.83 | 2.60 | 28.90 | Left precentral gyrus | |||
| 55 | YES | 0.339569431 | N.S. | N.S. | N.S. | −62.54 | 3.57 | 28.07 | −60.67 | 7.88 | 27.78 | Left precentral gyrus | |||
| 56 | YES | N.S. | N.S. | N.S. | N.S. | −61.25 | 8.27 | 26.55 | −59.77 | 12.49 | 26.70 | Left precentral gyrus | |||
| 57 | YES | N.S. | N.S. | N.S. | N.S. | −59.96 | 12.96 | 25.04 | −59.43 | 17.16 | 25.94 | Left precentral gyrus | |||
| 58 | YES | 0.428636207 | −0.320898333 | 0.17322 | −0.314109 | −58.67 | 17.67 | 23.51 | −57.83 | 21.79 | 24.87 | Left pars opercularis | Left rostral middle frontal gyrus | ||
| 59 | Planning | NO | 0.360666621 | −0.268568031 | 0.35077 | N.S. | −57.39 | 22.39 | 21.98 | −54.99 | 26.67 | 22.94 | Left rostral middle frontal gyrus | ||
| 60 | Planning | NO | 0.408381151 | −0.344766467 | 0.56884 | N.S. | −56.11 | 27.12 | 20.43 | −53.29 | 31.48 | 20.57 | Left rostral middle frontal gyrus | ||
| 61 | Planning | NO | 0.595820839 | −0.569480192 | 0.35142 | −0.421541 | −54.83 | 31.86 | 18.88 | −52.00 | 36.23 | 18.33 | Left rostral middle frontal gyrus | ||
| 62 | YES | 0.524204866 | −0.442951814 | N.S. | −0.552984 | −53.56 | 36.62 | 17.30 | −50.78 | 41.25 | 16.15 | Left rostral middle frontal gyrus | |||
| 63 | YES | N.S. | N.S. | 0.21636 | N.S. | −52.30 | 41.41 | 15.70 | −49.60 | 46.31 | 13.98 | Left rostral middle frontal gyrus | |||
| 64 | YES | N.S. | N.S. | 0.16891 | N.S. | −51.05 | 46.25 | 14.04 | −48.09 | 51.09 | 11.64 | Left rostral middle frontal gyrus | |||
| 486L Intraoperative | 1 | YES | 0.199330532 | N.S. | N.S. | N.S. | −51.32 | 21.99 | −11.21 | −50.34 | 22.24 | −11.04 | Left lateral orbitofrontal cortex | ||
| 2 | YES | N.S. | N.S. | N.S. | N.S. | −51.60 | 25.01 | −6.41 | −51.83 | 25.65 | −7.40 | Unknown | Left pars orbitalis | ||
| 3 | YES | N.S. | N.S. | N.S. | N.S. | −51.96 | 28.03 | −1.63 | −53.15 | 29.52 | −3.58 | Unknown | Left pars orbitalis | ||
| 4 | YES | N.S. | N.S. | N.S. | N.S. | −52.02 | 31.10 | 3.13 | −53.64 | 33.30 | 0.09 | Unknown | Left pars orbitalis | ||
| 5 | Excluded - Artifactual | N/A | −51.45 | 34.30 | 7.88 | −52.74 | 36.30 | 4.02 | Left pars triangularis | ||||||
| 6 | Excluded - Artifactual | N/A | −50.11 | 37.65 | 12.63 | −51.08 | 38.93 | 8.36 | Left pars triangularis | ||||||
| 7 | YES | N.S. | N.S. | 0.21509 | N.S. | −48.15 | 41.12 | 17.37 | −48.87 | 42.34 | 13.20 | Left pars triangularis | |||
| 8 | Planning | NO | 0.433222481 | −0.29695292 | 0.27275 | N.S. | −45.88 | 44.66 | 22.14 | −46.08 | 46.04 | 18.41 | Left rostral middle frontal gyrus | ||
| 9 | Excluded - On resected tissue | N/A | −54.18 | 17.45 | −7.59 | −53.61 | 17.89 | −6.94 | Unknown | Resected tissue | |||||
| 10 | Excluded - On resected tissue | N/A | −54.45 | 20.48 | −2.78 | −55.26 | 20.65 | −3.02 | Unknown | Resected tissue | |||||
| 11 | Excluded - On resected tissue | N/A | −54.86 | 23.48 | 2.02 | −56.14 | 24.35 | 1.13 | Unknown | Resected tissue | |||||
| 12 | YES | 0.351479452 | −0.235094562 | N.S. | N.S. | −55.01 | 26.54 | 6.80 | −56.62 | 28.05 | 5.01 | Left pars triangularis | |||
| 13 | YES | N.S. | N.S. | 0.25713 | N.S. | −54.46 | 29.73 | 11.58 | −56.02 | 31.32 | 8.93 | Left pars triangularis | |||
| 14 | Planning | NO | 0.423703077 | −0.293359211 | 0.3931 | N.S. | −52.87 | 33.13 | 16.34 | −53.99 | 34.07 | 12.97 | Left pars triangularis | ||
| 15 | YES | 0.283747429 | N.S. | N.S. | N.S. | −50.60 | 36.66 | 21.10 | −51.89 | 37.55 | 17.51 | Left pars triangularis | |||
| 16 | YES | N.S. | −0.275819064 | N.S. | N.S. | −48.07 | 40.25 | 25.88 | −49.18 | 41.36 | 22.50 | Left rostral middle frontal gyrus | |||
| 17 | Excluded - On resected tissue | N/A | −56.99 | 12.93 | −4.00 | −57.41 | 13.37 | −4.29 | Left superior temporal gyrus | Resected tissue | |||||
| 18 | Excluded - On resected tissue | N/A | −57.18 | 15.98 | 0.83 | −58.62 | 16.38 | −0.01 | Unknown | Resected tissue | |||||
| 19 | Excluded - On resected tissue | N/A | −57.46 | 19.00 | 5.65 | −59.23 | 19.83 | 4.37 | Left pars triangularis | Resected tissue | |||||
| 20 | YES | N.S. | N.S. | 0.22818 | N.S. | −57.54 | 22.06 | 10.47 | −59.09 | 23.17 | 8.79 | Left pars triangularis | Left pars triangularis | ||
| 21 | Planning-Production | NO | N.S. | −0.171387499 | 0.21219 | 0.2306402 | −57.00 | 25.25 | 15.27 | −58.96 | 26.67 | 13.15 | Unknown | Left pars triangularis | |
| 22 | NO | 0.250686174 | −0.259133504 | N.S. | N.S. | −55.09 | 28.71 | 20.06 | −57.30 | 30.05 | 17.34 | Left cerebral white matter | Left pars triangularis | ||
| 23 | YES | N.S. | N.S. | N.S. | N.S. | −52.57 | 32.30 | 24.84 | −54.63 | 33.31 | 21.70 | Left pars triangularis | |||
| 24 | NO | 0.343076244 | −0.366714191 | N.S. | −0.230496 | −49.87 | 35.91 | 29.64 | −51.40 | 36.80 | 26.46 | Left rostral middle frontal gyrus | |||
| 25 | Excluded - On resected tissue | N/A | −59.51 | 8.47 | −0.43 | −60.17 | 9.14 | −1.62 | Left superior temporal gyrus | Resected tissue | |||||
| 26 | Excluded - On resected tissue | N/A | −59.51 | 11.55 | 4.43 | −61.42 | 12.59 | 2.71 | Left pars opercularis | Resected tissue | |||||
| 27 | Excluded - On resected tissue | N/A | −59.50 | 14.63 | 9.27 | −61.17 | 15.73 | 7.22 | Unknown | Resected tissue | |||||
| 28 | Production | NO | N.S. | −0.187201696 | N.S. | 0.2421053 | −59.23 | 17.76 | 14.12 | −60.36 | 18.85 | 11.89 | Left pars triangularis | ||
| 29 | NO | N.S. | −0.215874396 | N.S. | N.S. | −58.29 | 21.03 | 18.95 | −60.07 | 22.20 | 16.44 | Unknown | Left pars triangularis | ||
| 30 | NO | 0.377271915 | −0.332261691 | N.S. | N.S. | −56.39 | 24.48 | 23.77 | −58.81 | 25.93 | 20.96 | Left pars triangularis | |||
| 31 | YES | N.S. | N.S. | N.S. | N.S. | −53.87 | 28.06 | 28.58 | −55.99 | 28.99 | 25.32 | Unknown | Left pars triangularis | ||
| 32 | YES | N.S. | −0.169079508 | N.S. | N.S. | −51.14 | 31.69 | 33.40 | −52.76 | 32.34 | 30.14 | Unknown | Left rostral middle frontal gyrus | ||
| 33 | Production | NO | N.S. | N.S. | N.S. | 0.683511 | −61.68 | 4.07 | 3.14 | −62.88 | 5.47 | 1.33 | Left precentral gyrus | Left pars opercularis | |
| 34 | Production | NO | N.S. | N.S. | N.S. | 0.3177786 | −61.40 | 7.21 | 8.01 | −63.43 | 8.90 | 5.60 | Left pars opercularis | ||
| 35 | YES | N.S. | N.S. | N.S. | N.S. | −61.01 | 10.36 | 12.89 | −63.21 | 12.04 | 10.14 | Left pars opercularis | |||
| 36 | YES | N.S. | N.S. | N.S. | N.S. | −60.29 | 13.58 | 17.76 | −61.68 | 15.01 | 14.88 | Left pars opercularis | |||
| 37 | YES | N.S. | N.S. | 0.18086 | 0.2351348 | −59.00 | 16.92 | 22.62 | −60.11 | 18.09 | 19.55 | Left pars opercularis | |||
| 38 | YES | N.S. | N.S. | 0.23901 | N.S. | −57.03 | 20.38 | 27.48 | −58.52 | 21.49 | 24.40 | Left pars opercularis | |||
| 39 | YES | N.S. | N.S. | N.S. | N.S. | −54.57 | 23.95 | 32.32 | −56.02 | 24.63 | 28.93 | Left pars triangularis | Left pars opercularis | ||
| 40 | NO | 0.386937203 | −0.213720789 | N.S. | −0.26783 | −51.92 | 27.56 | 37.16 | −53.05 | 27.95 | 33.59 | Unknown | Left rostral middle frontal gyrus | ||
| 41 | Production | NO | N.S. | −0.16174871 | N.S. | 0.3531824 | −63.53 | −0.26 | 6.71 | −64.17 | 1.27 | 4.14 | Left precentral gyrus | Left pars opercularis | |
| 42 | YES | N.S. | N.S. | N.S. | N.S. | −62.95 | 2.94 | 11.60 | −65.02 | 5.10 | 8.69 | Left precentral gyrus | Left pars opercularis | ||
| 43 | YES | N.S. | N.S. | N.S. | N.S. | −62.17 | 6.17 | 16.49 | −64.94 | 8.58 | 13.35 | Left precentral gyrus | Left pars opercularis | ||
| 44 | YES | N.S. | N.S. | N.S. | N.S. | −61.05 | 9.46 | 21.39 | −62.87 | 11.39 | 18.22 | Left pars opercularis | |||
| 45 | YES | N.S. | N.S. | N.S. | N.S. | −59.46 | 12.86 | 26.29 | −60.31 | 14.41 | 22.94 | Left pars opercularis | |||
| 46 | YES | N.S. | N.S. | N.S. | N.S. | −57.37 | 16.35 | 31.17 | −58.27 | 17.93 | 27.94 | Left pars opercularis | |||
| 47 | YES | N.S. | N.S. | 0.21809 | 0.288971 | −54.92 | 19.91 | 36.05 | −55.71 | 20.96 | 32.48 | Left rostral middle frontal gyrus | Left caudal middle frontal gyrus | ||
| 48 | Planning | NO | 0.484438908 | N.S. | 0.37849 | N.S. | −52.35 | 23.50 | 40.91 | −52.52 | 23.82 | 36.98 | Left rostral middle frontal gyrus | Left caudal middle frontal gyrus | |
| 49 | Production | NO | N.S. | N.S. | N.S. | 0.542823 | −65.12 | −4.54 | 10.29 | −64.52 | −3.08 | 7.39 | Left precentral gyrus | ||
| 50 | Production | NO | N.S. | N.S. | N.S. | 0.405237 | −64.25 | −1.29 | 15.19 | −64.99 | 0.63 | 12.06 | Left precentral gyrus | ||
| 51 | Production | NO | N.S. | N.S. | N.S. | 0.4717783 | −63.13 | 2.01 | 20.11 | −64.81 | 4.59 | 16.79 | Left precentral gyrus | ||
| 52 | Planning-Production | NO | N.S. | N.S. | 0.30772 | 0.2769672 | −61.69 | 5.37 | 25.03 | −63.01 | 8.01 | 21.84 | Left precentral gyrus | Left pars opercularis | |
| 53 | YES | N.S. | N.S. | N.S. | N.S. | −59.86 | 8.81 | 29.95 | −61.25 | 11.25 | 27.00 | Left pars opercularis | |||
| 54 | YES | N.S. | N.S. | N.S. | N.S. | −57.64 | 12.32 | 34.87 | −58.10 | 14.50 | 31.82 | Left pars opercularis | |||
| 55 | YES | N.S. | 0.386769066 | N.S. | N.S. | −55.16 | 15.89 | 39.77 | −54.92 | 17.28 | 36.11 | Left rostral middle frontal gyrus | Left caudal middle frontal gyrus | ||
| 56 | YES | N.S. | N.S. | N.S. | N.S. | −52.63 | 19.47 | 44.65 | −52.29 | 20.24 | 40.81 | Left rostral middle frontal gyrus | Left caudal middle frontal gyrus | ||
| 57 | Planning-Production | NO | N.S. | N.S. | 0.16054 | 0.8579636 | −66.50 | −8.77 | 13.88 | −65.94 | −6.99 | 10.92 | Left precentral gyrus | ||
| 58 | Production | NO | N.S. | N.S. | N.S. | 0.4956224 | −65.37 | −5.48 | 18.80 | −65.46 | −3.44 | 15.56 | Left precentral gyrus | ||
| 59 | YES | N.S. | N.S. | 0.18186 | 0.3830288 | −63.99 | −2.13 | 23.73 | −64.07 | 0.43 | 20.49 | Left precentral gyrus | |||
| 60 | YES | N.S. | N.S. | N.S. | N.S. | −62.31 | 1.28 | 28.67 | −62.69 | 4.32 | 25.65 | Left precentral gyrus | |||
| 61 | YES | N.S. | N.S. | 0.2198 | N.S. | −60.32 | 4.75 | 33.61 | −61.51 | 7.94 | 31.25 | Left precentral gyrus | |||
| 62 | YES | N.S. | 0.267075774 | 0.16413 | N.S. | −58.02 | 8.27 | 38.55 | −59.04 | 10.92 | 36.36 | Left pars opercularis | |||
| 63 | YES | N.S. | N.S. | 0.21974 | N.S. | −55.52 | 11.85 | 43.47 | −54.81 | 13.53 | 40.22 | Left rostral middle frontal gyrus | Left caudal middle frontal gyrus | ||
| 64 | Planning | NO | 0.862298192 | −0.523659597 | 0.60115 | N.S. | −53.01 | 15.42 | 48.36 | −51.67 | 16.12 | 44.23 | Left caudal middle frontal gyrus | ||
| 510L Intraoperative | 1 | Planning | NO | N.S. | N.S. | 0.32852 | N.S. | −41.71 | 31.14 | 32.65 | −42.61 | 37.78 | 34.51 | Left rostral middle frontal gyrus | |
| 2 | YES | 0.208456962 | −0.129416211 | 0.11041 | −0.202355 | −44.88 | 26.49 | 33.41 | −46.43 | 32.90 | 35.44 | Left rostral middle frontal gyrus | Left caudal middle frontal gyrus | ||
| 3 | YES | N.S. | N.S. | N.S. | N.S. | −48.11 | 21.86 | 34.16 | −49.50 | 27.92 | 36.24 | Left rostral middle frontal gyrus | Left caudal middle frontal gyrus | ||
| 4 | Planning | NO | N.S. | N.S. | 0.45096 | N.S. | −51.10 | 17.19 | 34.81 | −52.23 | 22.53 | 36.81 | Left rostral middle frontal gyrus | Left caudal middle frontal gyrus | |
| 5 | Planning | NO | N.S. | N.S. | 0.47576 | N.S. | −53.65 | 12.42 | 35.24 | −54.56 | 17.50 | 36.45 | Left rostral middle frontal gyrus | Left caudal middle frontal gyrus | |
| 6 | Planning | NO | 0.353484667 | −0.23533349 | 0.50965 | N.S. | −55.53 | 7.42 | 35.26 | −57.04 | 12.36 | 35.26 | Left rostral middle frontal gyrus | Left caudal middle frontal gyrus | |
| 7 | YES | N.S. | N.S. | 0.22106 | 0.2977129 | −56.99 | 2.33 | 35.11 | −59.51 | 5.79 | 34.66 | Left precentral gyrus | |||
| 8 | YES | N.S. | N.S. | 0.13175 | N.S. | −58.20 | −2.76 | 34.98 | −61.58 | −0.89 | 34.86 | Left precentral gyrus | |||
| 9 | YES | N.S. | N.S. | 0.27999 | N.S. | −45.32 | 31.51 | 27.81 | −45.80 | 37.66 | 29.55 | Left rostral middle frontal gyrus | |||
| 10 | Planning | NO | 0.48716049 | N.S. | 0.43181 | N.S. | −48.11 | 26.73 | 28.44 | −49.46 | 32.61 | 29.89 | Left rostral middle frontal gyrus | Left caudal middle frontal gyrus | |
| 11 | Planning | NO | 0.42298043 | N.S. | 0.25925 | −0.32905 | −50.91 | 21.95 | 29.04 | −51.88 | 27.26 | 30.35 | Left rostral middle frontal gyrus | Left caudal middle frontal gyrus | |
| 12 | Planning | NO | N.S. | N.S. | 0.92591 | N.S. | −53.51 | 17.16 | 29.55 | −54.26 | 22.26 | 31.04 | Left rostral middle frontal gyrus | Left caudal middle frontal gyrus | |
| 13 | Planning | NO | 0.426277094 | N.S. | 0.48511 | N.S. | −55.70 | 12.28 | 29.88 | −56.60 | 17.30 | 30.69 | Left rostral middle frontal gyrus | Left caudal middle frontal gyrus | |
| 14 | Planning | NO | 0.504105748 | N.S. | 0.56732 | N.S. | −57.35 | 7.28 | 29.93 | −58.42 | 12.51 | 29.71 | Left rostral middle frontal gyrus | Left caudal middle frontal gyrus | |
| 15 | YES | N.S. | N.S. | 0.21407 | N.S. | −58.59 | 2.21 | 29.85 | −60.14 | 6.47 | 29.19 | Left precentral gyrus | |||
| 16 | YES | N.S. | N.S. | N.S. | N.S. | −59.60 | −2.86 | 29.79 | −62.43 | −0.58 | 29.55 | Left precentral gyrus | |||
| 17 | YES | N.S. | N.S. | N.S. | N.S. | −48.80 | 31.85 | 22.88 | −49.03 | 37.36 | 24.17 | Left rostral middle frontal gyrus | |||
| 18 | Planning | NO | N.S. | N.S. | 0.49852 | N.S. | −51.18 | 26.92 | 23.35 | −52.97 | 32.43 | 24.39 | Left rostral middle frontal gyrus | Left caudal middle frontal gyrus | |
| 19 | Planning | NO | 0.266358871 | N.S. | 0.60408 | N.S. | −53.47 | 21.97 | 23.77 | −55.59 | 27.11 | 24.78 | Left pars opercularis | ||
| 20 | Planning | NO | 0.392209656 | N.S. | 0.7459 | N.S. | −55.64 | 17.02 | 24.12 | −56.95 | 21.86 | 25.19 | Left pars opercularis | ||
| 21 | Planning | NO | 0.642420831 | −0.333914246 | 0.56251 | N.S. | −57.46 | 12.05 | 24.37 | −58.20 | 16.64 | 24.86 | Left pars opercularis | ||
| 22 | Planning | NO | 0.473355443 | N.S. | 0.26827 | N.S. | −58.84 | 7.05 | 24.49 | −59.47 | 11.86 | 24.25 | Left precentral gyrus | Left pars opercularis | |
| 23 | YES | N.S. | N.S. | 0.22275 | N.S. | −59.85 | 2.02 | 24.53 | −61.16 | 6.14 | 24.01 | Left precentral gyrus | |||
| 24 | YES | N.S. | N.S. | N.S. | N.S. | −60.68 | −3.00 | 24.57 | −63.18 | −0.26 | 24.48 | Left precentral gyrus | |||
| 25 | YES | 0.359298982 | N.S. | N.S. | N.S. | −51.02 | 31.90 | 17.52 | −51.76 | 37.22 | 18.38 | Left rostral middle frontal gyrus | |||
| 26 | Planning | NO | N.S. | N.S. | 0.41302 | N.S. | −53.35 | 26.93 | 17.97 | −55.55 | 32.09 | 18.77 | Left rostral middle frontal gyrus | ||
| 27 | Planning | NO | N.S. | N.S. | 0.43256 | N.S. | −55.43 | 21.89 | 18.31 | −57.63 | 26.57 | 19.02 | Left pars opercularis | ||
| 28 | Planning | NO | 0.50620564 | N.S. | 0.49832 | N.S. | −57.32 | 16.83 | 18.59 | −58.70 | 20.81 | 18.81 | Left pars opercularis | ||
| 29 | Planning | NO | 0.693185708 | −0.480408783 | 0.66969 | −0.363006 | −58.87 | 11.79 | 18.81 | −59.68 | 15.76 | 18.42 | Left pars opercularis | ||
| 30 | Planning | NO | 0.311544952 | −0.236325395 | 0.27764 | N.S. | −59.96 | 6.79 | 19.01 | −60.84 | 10.41 | 18.45 | Left precentral gyrus | ||
| 31 | YES | N.S. | −0.217762971 | 0.18866 | N.S. | −60.73 | 1.81 | 19.17 | −62.56 | 5.14 | 18.61 | Left precentral gyrus | |||
| 32 | Planning-Production | NO | N.S. | −0.566568899 | 0.24758 | 0.4254089 | −61.40 | −3.17 | 19.32 | −63.83 | −0.06 | 19.21 | Left precentral gyrus | ||
| 33 | Planning | NO | 0.484665653 | N.S. | 0.19299 | −0.390847 | −52.45 | 31.82 | 11.96 | −53.51 | 36.64 | 12.18 | Left pars triangularis | ||
| 34 | Perception-Planning | NO | N.S. | 0.481418562 | 0.28298 | N.S. | −54.70 | 26.82 | 12.40 | −57.12 | 31.43 | 12.76 | Left pars triangularis | ||
| 35 | Planning | NO | N.S. | N.S. | 0.51738 | N.S. | −56.68 | 21.74 | 12.74 | −58.60 | 25.74 | 12.79 | Left pars opercularis | ||
| 36 | Planning | NO | N.S. | N.S. | 0.69998 | N.S. | −58.40 | 16.64 | 13.01 | −59.51 | 20.13 | 12.84 | Left pars opercularis | ||
| 37 | Planning | NO | 0.474669863 | −0.326314496 | 0.58215 | N.S. | −59.79 | 11.55 | 13.25 | −59.86 | 15.16 | 12.74 | Left pars opercularis | ||
| 38 | Planning | NO | N.S. | −0.283509145 | 0.21357 | N.S. | −60.62 | 6.57 | 13.54 | −61.20 | 9.61 | 12.52 | Left precentral gyrus | ||
| 39 | Planning | NO | N.S. | −0.401969205 | 0.30129 | N.S. | −61.20 | 1.63 | 13.81 | −62.89 | 4.53 | 12.96 | Left precentral gyrus | ||
| 40 | Production | NO | 0.489013025 | −0.521472245 | N.S. | 0.868548 | −61.76 | −3.31 | 14.05 | −63.71 | −0.32 | 13.80 | Left precentral gyrus | ||
| 41 | Planning | NO | 0.632453312 | −0.33482728 | 0.5754 | −0.36381 | −53.38 | 31.71 | 6.31 | −54.39 | 35.82 | 5.43 | Left pars triangularis | ||
| 42 | Planning | NO | N.S. | N.S. | 0.44637 | N.S. | −55.49 | 26.69 | 6.76 | −57.43 | 30.47 | 6.31 | Left pars triangularis | ||
| 43 | Planning | NO | N.S. | N.S. | 0.37837 | N.S. | −57.33 | 21.61 | 7.14 | −59.09 | 25.02 | 6.89 | Left pars opercularis | ||
| 44 | Planning | NO | 0.305345451 | N.S. | 0.4285 | N.S. | −58.88 | 16.51 | 7.47 | −59.67 | 19.73 | 7.17 | Left pars opercularis | ||
| 45 | Planning | NO | 0.824084787 | −0.716412383 | 0.82188 | N.S. | −60.05 | 11.44 | 7.79 | −59.80 | 14.68 | 7.06 | Left pars opercularis | ||
| 46 | Planning | NO | N.S. | −0.291786065 | 0.16488 | N.S. | −60.78 | 6.45 | 8.13 | −60.93 | 9.17 | 6.91 | Left precentral gyrus | Left pars opercularis | |
| 47 | YES | N.S. | −0.189180259 | N.S. | N.S. | −61.28 | 1.50 | 8.47 | −62.95 | 4.13 | 7.27 | Left precentral gyrus | |||
| 48 | Planning-Production | NO | N.S. | N.S. | 0.13964 | 0.2048724 | −61.80 | −3.43 | 8.78 | −63.46 | −0.54 | 8.43 | Left precentral gyrus | ||
| 49 | Planning | NO | N.S. | N.S. | 0.33685 | N.S. | −53.98 | 31.59 | 0.66 | −55.72 | 34.98 | −0.88 | Left pars triangularis | ||
| 50 | Perception-Planning | NO | N.S. | 0.32769173 | 0.37152 | N.S. | −55.92 | 26.57 | 1.12 | −57.31 | 29.57 | 0.31 | Left pars triangularis | ||
| 51 | YES | N.S. | 0.171237471 | 0.29163 | N.S. | −57.61 | 21.51 | 1.56 | −58.98 | 24.24 | 0.94 | Left pars triangularis | |||
| 52 | YES | N.S. | N.S. | 0.09562 | N.S. | −58.98 | 16.43 | 1.96 | −59.02 | 18.90 | 1.35 | Left pars opercularis | |||
| 53 | Planning | NO | N.S. | −0.384929302 | 0.29977 | N.S. | −60.00 | 11.38 | 2.36 | −59.16 | 13.88 | 1.59 | Left pars opercularis | ||
| 54 | YES | N.S. | N.S. | N.S. | N.S. | −60.66 | 6.39 | 2.76 | −60.31 | 8.91 | 1.96 | Left pars opercularis | |||
| 55 | YES | N.S. | N.S. | N.S. | N.S. | −61.13 | 1.43 | 3.16 | −61.99 | 4.14 | 2.61 | Left precentral gyrus | |||
| 56 | Planning-Production | NO | 0.137276056 | −0.154542337 | 0.09038 | 0.0930603 | −61.65 | −3.50 | 3.52 | −63.55 | −0.55 | 3.24 | Left precentral gyrus | ||
| 57 | Planning | NO | N.S. | N.S. | 0.3698 | N.S. | −54.39 | 31.49 | −4.95 | −55.48 | 33.89 | −5.92 | Left pars triangularis | ||
| 58 | YES | N.S. | N.S. | 0.11547 | N.S. | −56.18 | 26.47 | −4.46 | −57.14 | 28.65 | −5.04 | Left pars triangularis | |||
| 59 | YES | N.S. | N.S. | N.S. | N.S. | −57.73 | 21.43 | −3.98 | −58.32 | 23.35 | −4.54 | Left pars triangularis | |||
| 60 | YES | N.S. | N.S. | N.S. | N.S. | −58.98 | 16.38 | −3.51 | −58.35 | 18.14 | −4.03 | Left pars opercularis | |||
| 61 | YES | N.S. | N.S. | 0.04688 | N.S. | −59.91 | 11.35 | −3.06 | −58.78 | 13.45 | −3.47 | Left pars opercularis | |||
| 62 | YES | N.S. | N.S. | N.S. | N.S. | −60.55 | 6.36 | −2.61 | −59.58 | 8.67 | −2.82 | Left pars opercularis | |||
| 63 | YES | N.S. | N.S. | 0.04246 | N.S. | −61.03 | 1.40 | −2.17 | −61.63 | 4.00 | −2.46 | Left superior temporal gyrus | |||
| 64 | YES | N.S. | N.S. | N.S. | N.S. | −61.56 | −3.54 | −1.76 | −63.60 | −0.70 | −2.15 | Left superior temporal gyrus | |||
| 494L Intraoperative | 1 | NO | 0.208118379 | −0.199180401 | N.S. | N.S. | −53.95 | 26.89 | 19.88 | −58.68 | 28.53 | 17.45 | Left rostral middle frontal gyrus | Left pars triangularis | |
| 2 | Planning | NO | 0.686115686 | −0.531954313 | 0.42777 | −0.439542 | −54.48 | 25.15 | 17.36 | −59.23 | 26.58 | 14.88 | Left rostral middle frontal gyrus | Left pars triangularis | |
| 3 | YES | N.S. | N.S. | N.S. | N.S. | −55.00 | 23.42 | 14.86 | −59.66 | 24.74 | 12.35 | Left pars opercularis | Left pars triangularis | ||
| 4 | YES | N.S. | N.S. | N.S. | N.S. | −55.53 | 21.69 | 12.38 | −59.94 | 22.97 | 9.81 | Left pars opercularis | |||
| 5 | Excluded - Artifactual | N/A | −56.06 | 19.94 | 9.89 | −60.06 | 21.23 | 7.17 | Left pars opercularis | ||||||
| 6 | Excluded - Artifactual | N/A | −56.59 | 18.16 | 7.37 | −60.33 | 19.54 | 4.37 | Left pars opercularis | ||||||
| 7 | YES | N.S. | N.S. | 0.17016 | N.S. | −57.11 | 16.35 | 4.82 | −60.90 | 17.92 | 1.47 | Left pars opercularis | |||
| 8 | YES | N.S. | N.S. | N.S. | N.S. | −57.64 | 14.49 | 2.23 | −61.65 | 16.30 | −1.45 | Left pars opercularis | |||
| 9 | YES | 0.28726197 | N.S. | N.S. | N.S. | −58.16 | 12.58 | −0.40 | −62.22 | 14.56 | −4.22 | Left superior temporal gyrus | Left pars opercularis | ||
| 10 | YES | 0.473359244 | −0.31610037 | 0.1646 | −0.30333 | −58.68 | 10.61 | −3.09 | −62.47 | 12.67 | −6.77 | Left superior temporal gyrus | |||
| 11 | YES | 0.541709278 | −0.363313985 | 0.22838 | −0.333031 | −59.20 | 8.61 | −5.80 | −62.58 | 10.71 | −9.20 | Left superior temporal gyrus | |||
| 12 | YES | 0.400007469 | N.S. | 0.24115 | N.S. | −59.71 | 6.58 | −8.54 | −62.80 | 8.80 | −11.63 | Left superior temporal gyrus | |||
| 13 | YES | N.S. | N.S. | N.S. | N.S. | −60.23 | 4.53 | −11.30 | −63.20 | 6.87 | −14.09 | Left superior temporal gyrus | |||
| 14 | YES | N.S. | N.S. | N.S. | N.S. | −60.75 | 2.47 | −14.08 | −63.64 | 4.82 | −16.63 | Left middle temporal gyrus | Left superior temporal gyrus | ||
| 15 | YES | N.S. | N.S. | 0.25643 | N.S. | −61.26 | 0.41 | −16.86 | −63.90 | 2.50 | −19.28 | Left middle temporal gyrus | Left superior temporal gyrus | ||
| 16 | YES | N.S. | N.S. | −0.33144 | −0.31285 | −61.77 | −1.63 | −19.67 | −63.98 | 0.02 | −22.03 | Left middle temporal gyrus | Left superior temporal gyrus | ||
| 17 | Planning | NO | 0.400029818 | −0.482544483 | 0.52059 | N.S. | −54.90 | 24.35 | 22.13 | −59.56 | 25.87 | 19.72 | Left rostral middle frontal gyrus | Left pars triangularis | |
| 18 | Planning | NO | 0.507576664 | −0.484240639 | 0.37696 | N.S. | −55.42 | 22.62 | 19.59 | −60.13 | 23.86 | 17.12 | Left rostral middle frontal gyrus | Left pars triangularis | |
| 19 | YES | N.S. | N.S. | N.S. | N.S. | −55.95 | 20.90 | 17.08 | −60.47 | 21.89 | 14.56 | Left pars opercularis | |||
| 20 | YES | N.S. | N.S. | 0.34265 | 0.4062324 | −56.47 | 19.18 | 14.59 | −60.57 | 19.95 | 11.96 | Left pars opercularis | |||
| 21 | YES | N.S. | N.S. | 0.40761 | N.S. | −57.00 | 17.45 | 12.08 | −60.71 | 18.14 | 9.22 | Left pars opercularis | |||
| 22 | YES | N.S. | N.S. | 0.27841 | N.S. | −57.52 | 15.69 | 9.56 | −61.02 | 16.47 | 6.37 | Left pars opercularis | |||
| 23 | YES | N.S. | N.S. | N.S. | N.S. | −58.05 | 13.89 | 6.99 | −61.59 | 14.95 | 3.47 | Left pars opercularis | |||
| 24 | YES | N.S. | N.S. | N.S. | N.S. | −58.57 | 12.04 | 4.38 | −62.32 | 13.41 | 0.57 | Left precentral gyrus | Left pars opercularis | ||
| 25 | YES | N.S. | N.S. | 0.34066 | N.S. | −59.09 | 10.12 | 1.72 | −62.80 | 11.71 | −2.16 | Left superior temporal gyrus | Left pars opercularis | ||
| 26 | YES | 0.320965793 | N.S. | 0.21487 | −0.398714 | −59.61 | 8.15 | −1.00 | −62.96 | 9.83 | −4.71 | Left superior temporal gyrus | |||
| 27 | YES | N.S. | N.S. | 0.17307 | −0.285865 | −60.12 | 6.14 | −3.75 | −63.11 | 7.92 | −7.09 | Left superior temporal gyrus | |||
| 28 | YES | N.S. | N.S. | 0.23218 | N.S. | −60.64 | 4.10 | −6.53 | −63.49 | 6.07 | −9.48 | Left superior temporal gyrus | |||
| 29 | YES | N.S. | N.S. | N.S. | N.S. | −61.15 | 2.04 | −9.33 | −64.00 | 4.17 | −11.90 | Left superior temporal gyrus | |||
| 30 | YES | N.S. | N.S. | N.S. | N.S. | −61.66 | −0.03 | −12.13 | −64.55 | 2.14 | −14.44 | Left middle temporal gyrus | Left superior temporal gyrus | ||
| 31 | YES | N.S. | N.S. | N.S. | N.S. | −62.17 | −2.09 | −14.94 | −64.76 | −0.17 | −17.11 | Left middle temporal gyrus | Left superior temporal gyrus | ||
| 32 | YES | N.S. | N.S. | N.S. | N.S. | −62.69 | −4.14 | −17.77 | −64.87 | −2.60 | −19.87 | Left middle temporal gyrus | Left superior temporal gyrus | ||
| 33 | Planning | NO | 0.595276233 | −0.332447284 | 0.58862 | N.S. | −55.84 | 21.80 | 24.42 | −60.23 | 23.19 | 21.95 | Left pars opercularis | Left pars triangularis | |
| 34 | Planning | NO | 0.482909313 | −0.548620445 | 0.52244 | N.S. | −56.37 | 20.08 | 21.86 | −60.86 | 21.15 | 19.34 | Left pars opercularis | Left pars triangularis | |
| 35 | YES | N.S. | −0.387882246 | N.S. | N.S. | −56.89 | 18.37 | 19.33 | −61.10 | 19.08 | 16.72 | Left pars opercularis | |||
| 36 | YES | N.S. | N.S. | N.S. | N.S. | −57.41 | 16.65 | 16.81 | −61.34 | 17.08 | 14.02 | Left pars opercularis | |||
| 37 | Planning | NO | N.S. | N.S. | 0.41161 | N.S. | −57.94 | 14.93 | 14.28 | −61.71 | 15.22 | 11.24 | Left pars opercularis | ||
| 38 | YES | N.S. | N.S. | N.S. | N.S. | −58.46 | 13.19 | 11.73 | −61.99 | 13.54 | 8.36 | Left precentral gyrus | Left pars opercularis | ||
| 39 | YES | N.S. | N.S. | N.S. | N.S. | −58.98 | 11.41 | 9.16 | −62.36 | 12.02 | 5.51 | Left precentral gyrus | |||
| 40 | YES | N.S. | N.S. | N.S. | N.S. | −59.50 | 9.57 | 6.52 | −62.90 | 10.48 | 2.67 | Left precentral gyrus | |||
| 41 | YES | N.S. | N.S. | 0.40159 | N.S. | −60.02 | 7.65 | 3.82 | −63.30 | 8.79 | −0.09 | Left superior temporal gyrus | |||
| 42 | Planning | NO | N.S. | N.S. | 0.42644 | −0.466477 | −60.53 | 5.66 | 1.06 | −63.40 | 6.92 | −2.68 | Left superior temporal gyrus | ||
| 43 | YES | N.S. | N.S. | 0.19285 | N.S. | −61.04 | 3.64 | −1.74 | −63.71 | 5.10 | −5.06 | Left superior temporal gyrus | |||
| 44 | YES | N.S. | N.S. | 0.25574 | N.S. | −61.55 | 1.60 | −4.56 | −64.20 | 3.25 | −7.42 | Left superior temporal gyrus | |||
| 45 | YES | 0.334387361 | N.S. | N.S. | N.S. | −62.07 | −0.47 | −7.39 | −64.71 | 1.35 | −9.84 | Left superior temporal gyrus | |||
| 46 | YES | N.S. | N.S. | N.S. | N.S. | −62.58 | −2.53 | −10.22 | −65.41 | −0.57 | −12.36 | Left superior temporal gyrus | |||
| 47 | YES | N.S. | N.S. | 0.23662 | N.S. | −63.09 | −4.59 | −13.07 | −65.87 | −2.71 | −14.99 | Left middle temporal gyrus | Left superior temporal gyrus | ||
| 48 | YES | N.S. | N.S. | N.S. | N.S. | −63.59 | −6.64 | −15.92 | −66.06 | −5.11 | −17.81 | Left middle temporal gyrus | Left superior temporal gyrus | ||
| 49 | YES | N.S. | N.S. | 0.25118 | N.S. | −56.79 | 19.24 | 26.71 | −60.93 | 20.58 | 24.23 | Left pars opercularis | |||
| 50 | YES | N.S. | N.S. | 0.31929 | N.S. | −57.31 | 17.52 | 24.14 | −61.51 | 18.49 | 21.56 | Left pars opercularis | |||
| 51 | Planning | NO | 0.659057171 | −0.736069217 | 0.55545 | N.S. | −57.83 | 15.81 | 21.58 | −61.81 | 16.40 | 18.83 | Left pars opercularis | ||
| 52 | Planning | NO | 0.359460492 | −0.502344592 | 0.3998 | N.S. | −58.35 | 14.10 | 19.02 | −62.26 | 14.53 | 16.06 | Left pars opercularis | ||
| 53 | YES | N.S. | N.S. | 0.1782 | N.S. | −58.88 | 12.39 | 16.47 | −62.71 | 12.77 | 13.26 | Left precentral gyrus | Left pars opercularis | ||
| 54 | YES | N.S. | N.S. | N.S. | N.S. | −59.40 | 10.65 | 13.89 | −62.90 | 10.99 | 10.36 | Left precentral gyrus | Left pars opercularis | ||
| 55 | YES | N.S. | N.S. | 0.15689 | 0.2936284 | −59.91 | 8.88 | 11.28 | −63.16 | 9.32 | 7.51 | Left precentral gyrus | Left pars opercularis | ||
| 56 | YES | N.S. | N.S. | 0.13057 | N.S. | −60.43 | 7.06 | 8.62 | −63.61 | 7.70 | 4.70 | Left precentral gyrus | Left pars opercularis | ||
| 57 | YES | N.S. | N.S. | N.S. | N.S. | −60.94 | 5.13 | 5.88 | −63.91 | 5.94 | 1.92 | Left superior temporal gyrus | Left pars opercularis | ||
| 58 | YES | N.S. | N.S. | N.S. | N.S. | −61.45 | 3.14 | 3.07 | −64.11 | 4.11 | −0.68 | Left superior temporal gyrus | |||
| 59 | YES | N.S. | N.S. | N.S. | N.S. | −61.96 | 1.12 | 0.24 | −64.63 | 2.32 | −3.08 | Left superior temporal gyrus | |||
| 60 | NO | 0.610075759 | N.S. | N.S. | −0.499255 | −62.47 | −0.93 | −2.61 | −65.10 | 0.44 | −5.42 | Left superior temporal gyrus | |||
| 61 | Planning | NO | 0.722563146 | −0.333441997 | 0.25261 | N.S. | −62.98 | −2.99 | −5.48 | −65.55 | −1.47 | −7.84 | Left superior temporal gyrus | ||
| 62 | YES | 0.432883167 | N.S. | 0.44382 | N.S. | −63.49 | −5.05 | −8.35 | −66.28 | −3.34 | −10.33 | Left superior temporal gyrus | |||
| 63 | YES | N.S. | N.S. | N.S. | N.S. | −63.99 | −7.11 | −11.22 | −66.86 | −5.42 | −12.97 | Left middle temporal gyrus | Left superior temporal gyrus | ||
| 64 | YES | N.S. | N.S. | N.S. | N.S. | −64.50 | −9.16 | −14.09 | −67.02 | −7.87 | −15.86 | Left middle temporal gyrus | |||
| 65 | YES | N.S. | N.S. | N.S. | N.S. | −57.74 | 16.66 | 28.99 | −61.70 | 18.06 | 26.55 | Left pars opercularis | |||
| 66 | YES | N.S. | N.S. | 0.39927 | N.S. | −58.26 | 14.94 | 26.40 | −62.23 | 15.90 | 23.78 | Left pars opercularis | |||
| 67 | Planning | NO | N.S. | −0.330036165 | 0.317 | N.S. | −58.78 | 13.23 | 23.81 | −62.55 | 13.85 | 20.94 | Left precentral gyrus | Left pars opercularis | |
| 68 | Planning-Production | NO | N.S. | N.S. | 0.20225 | 0.3570327 | −59.30 | 11.52 | 21.22 | −63.04 | 12.12 | 18.11 | Left precentral gyrus | ||
| 69 | YES | N.S. | N.S. | N.S. | 0.3761229 | −59.81 | 9.81 | 18.62 | −63.43 | 10.40 | 15.25 | Left precentral gyrus | |||
| 70 | YES | N.S. | N.S. | 0.16391 | 0.4275066 | −60.33 | 8.07 | 16.01 | −63.75 | 8.60 | 12.35 | Left precentral gyrus | |||
| 71 | YES | N.S. | N.S. | N.S. | 0.4175961 | −60.84 | 6.30 | 13.36 | −64.24 | 6.87 | 9.48 | Left precentral gyrus | |||
| 72 | Production | NO | N.S. | N.S. | N.S. | 0.3403755 | −61.36 | 4.46 | 10.65 | −64.69 | 5.13 | 6.66 | Left precentral gyrus | Left pars opercularis | |
| 73 | YES | N.S. | N.S. | 0.15594 | N.S. | −61.87 | 2.55 | 7.88 | −64.98 | 3.33 | 3.92 | Left superior temporal gyrus | Left pars opercularis | ||
| 74 | YES | 0.534607136 | −0.337739136 | 0.19433 | −0.31088 | −62.38 | 0.58 | 5.05 | −65.29 | 1.49 | 1.35 | Left superior temporal gyrus | |||
| 75 | Planning | NO | 0.676132778 | N.S. | 0.2744 | −0.646717 | −62.88 | −1.44 | 2.19 | −65.66 | −0.42 | −1.05 | Left superior temporal gyrus | ||
| 76 | NO | 0.811309793 | N.S. | N.S. | −0.618533 | −63.39 | −3.48 | −0.70 | −66.03 | −2.36 | −3.38 | Left superior temporal gyrus | |||
| 77 | YES | N.S. | N.S. | N.S. | N.S. | −63.89 | −5.53 | −3.60 | −66.48 | −4.30 | −5.78 | Left superior temporal gyrus | |||
| 78 | YES | 0.2371267 | N.S. | N.S. | N.S. | −64.40 | −7.58 | −6.50 | −67.03 | −6.27 | −8.30 | Left superior temporal gyrus | |||
| 79 | YES | N.S. | N.S. | 0.16549 | N.S. | −64.90 | −9.64 | −9.40 | −67.50 | −8.42 | −11.00 | Left middle temporal gyrus | Left superior temporal gyrus | ||
| 80 | YES | N.S. | N.S. | N.S. | N.S. | −65.41 | −11.68 | −12.28 | −67.56 | −10.87 | −13.95 | Left middle temporal gyrus | |||
| 81 | YES | N.S. | N.S. | 0.32735 | N.S. | −58.69 | 14.07 | 31.26 | −62.32 | 15.52 | 28.87 | Left precentral gyrus | Left pars opercularis | ||
| 82 | YES | N.S. | N.S. | 0.29691 | N.S. | −59.20 | 12.35 | 28.64 | −62.72 | 13.38 | 25.99 | Left precentral gyrus | Left pars opercularis | ||
| 83 | YES | N.S. | −0.324217746 | N.S. | N.S. | −59.72 | 10.63 | 26.02 | −63.12 | 11.43 | 23.10 | Left precentral gyrus | |||
| 84 | YES | N.S. | N.S. | N.S. | N.S. | −60.23 | 8.92 | 23.39 | −63.58 | 9.68 | 20.20 | Left precentral gyrus | |||
| 85 | Planning-Production | NO | N.S. | N.S. | 0.2685 | 0.4708179 | −60.75 | 7.20 | 20.75 | −64.05 | 7.95 | 17.29 | Left precentral gyrus | ||
| 86 | Planning | NO | N.S. | N.S. | 0.53598 | N.S. | −61.26 | 5.45 | 18.09 | −64.51 | 6.20 | 14.38 | Left precentral gyrus | ||
| 87 | Planning-Production | NO | N.S. | N.S. | 0.3821 | 0.807277 | −61.77 | 3.67 | 15.39 | −65.09 | 4.44 | 11.50 | Left precentral gyrus | ||
| 88 | Planning-Production | NO | 0.339863558 | N.S. | 0.483 | 0.6350564 | −62.28 | 1.83 | 12.65 | −65.55 | 2.61 | 8.72 | Left postcentral gyrus | Left pars opercularis | |
| 89 | Planning | NO | 0.406196999 | N.S. | 0.2234 | N.S. | −62.79 | −0.07 | 9.85 | −65.92 | 0.73 | 6.02 | Left postcentral gyrus | Left pars opercularis | |
| 90 | Planning | NO | 0.613314132 | N.S. | 0.27609 | −0.527217 | −63.30 | −2.03 | 7.00 | −66.26 | −1.22 | 3.46 | Left superior temporal gyrus | ||
| 91 | Planning | NO | 0.809619678 | N.S. | 0.27393 | −0.711245 | −63.80 | −4.03 | 4.11 | −66.57 | −3.21 | 1.08 | Left superior temporal gyrus | ||
| 92 | Planning | NO | 0.796250048 | N.S. | 0.19069 | −0.664806 | −64.30 | −6.05 | 1.20 | −66.95 | −5.17 | −1.24 | Left superior temporal gyrus | ||
| 93 | YES | N.S. | N.S. | N.S. | N.S. | −64.80 | −8.09 | −1.73 | −67.26 | −7.20 | −3.63 | Left superior temporal gyrus | |||
| 94 | YES | N.S. | N.S. | N.S. | 0.2651268 | −65.30 | −10.14 | −4.66 | −67.68 | −9.24 | −6.19 | Left superior temporal gyrus | |||
| 95 | YES | N.S. | N.S. | N.S. | N.S. | −65.81 | −12.18 | −7.58 | −68.10 | −11.38 | −8.92 | Left middle temporal gyrus | Left superior temporal gyrus | ||
| 96 | YES | N.S. | N.S. | 0.14703 | N.S. | −66.31 | −14.22 | −10.47 | −68.02 | −13.80 | −11.93 | Left middle temporal gyrus | |||
| 97 | YES | N.S. | N.S. | 0.36278 | N.S. | −59.63 | 11.47 | 33.49 | −62.81 | 12.95 | 31.08 | Left precentral gyrus | Left pars opercularis | ||
| 98 | YES | N.S. | N.S. | 0.20728 | N.S. | −60.15 | 9.74 | 30.85 | −63.25 | 10.93 | 28.20 | Left precentral gyrus | |||
| 99 | YES | N.S. | −0.229651013 | N.S. | N.S. | −60.66 | 8.02 | 28.20 | −63.73 | 9.05 | 25.28 | Left precentral gyrus | |||
| 100 | Production | NO | 0.396756157 | −0.43536151 | N.S. | 0.5928112 | −61.17 | 6.30 | 25.53 | −64.38 | 7.35 | 22.41 | Left precentral gyrus | ||
| 101 | Production | NO | 0.442640228 | −0.559696993 | N.S. | 0.956519 | −61.68 | 4.57 | 22.85 | −64.83 | 5.64 | 19.47 | Left precentral gyrus | ||
| 102 | Planning-Production | NO | 0.317576577 | N.S. | 0.4956 | 1.2112041 | −62.19 | 2.81 | 20.14 | −65.17 | 3.84 | 16.50 | Left precentral gyrus | ||
| 103 | Planning-Production | NO | N.S. | N.S. | 0.56988 | 0.8823763 | −62.70 | 1.02 | 17.40 | −65.72 | 2.02 | 13.65 | Left precentral gyrus | ||
| 104 | Planning | NO | 0.571387409 | −0.337086547 | 0.42918 | N.S. | −63.21 | −0.82 | 14.62 | −66.27 | 0.10 | 10.90 | Left postcentral gyrus | Left precentral gyrus | |
| 105 | Production | NO | 0.320336712 | −0.369097192 | N.S. | 0.7885149 | −63.71 | −2.71 | 11.79 | −66.70 | −1.92 | 8.22 | Left postcentral gyrus | Left precentral gyrus | |
| 106 | Perception-Planning | NO | 0.466984061 | 0.277848136 | 0.29228 | −0.312234 | −64.22 | −4.66 | 8.92 | −67.02 | −4.01 | 5.63 | Left postcentral gyrus | Left superior temporal gyrus | |
| 107 | Perception-Planning | NO | N.S. | 0.54576096 | 0.4206 | −0.347955 | −64.72 | −6.64 | 6.02 | −67.26 | −6.09 | 3.24 | Left superior temporal gyrus | ||
| 108 | YES | 0.49289152 | N.S. | N.S. | −0.387588 | −65.22 | −8.64 | 3.09 | −67.48 | −8.14 | 0.95 | Left superior temporal gyrus | |||
| 109 | YES | N.S. | N.S. | N.S. | N.S. | −65.72 | −10.67 | 0.14 | −67.80 | −10.17 | −1.48 | Left superior temporal gyrus | |||
| 110 | YES | N.S. | N.S. | N.S. | N.S. | −66.21 | −12.71 | −2.81 | −68.18 | −12.21 | −4.13 | Left superior temporal gyrus | |||
| 111 | YES | N.S. | N.S. | N.S. | N.S. | −66.72 | −14.74 | −5.75 | −68.47 | −14.35 | −6.96 | Left superior temporal gyrus | |||
| 112 | Production | NO | N.S. | N.S. | N.S. | 0.3636677 | −67.22 | −16.77 | −8.66 | −68.51 | −16.64 | −9.94 | Left middle temporal gyrus | ||
| 113 | YES | −0.349168965 | 0.35204141 | 0.24921 | 0.5308946 | −60.57 | 8.86 | 35.68 | −63.37 | 10.41 | 33.22 | Left precentral gyrus | |||
| 114 | YES | N.S. | N.S. | 0.14352 | N.S. | −61.09 | 7.13 | 33.02 | −63.87 | 8.43 | 30.37 | Left precentral gyrus | |||
| 115 | YES | N.S. | N.S. | N.S. | N.S. | −61.60 | 5.40 | 30.33 | −64.50 | 6.57 | 27.48 | Left precentral gyrus | |||
| 116 | Production | NO | 0.47725241 | −0.419504301 | N.S. | 0.8882201 | −62.11 | 3.67 | 27.63 | −65.24 | 4.90 | 24.62 | Left precentral gyrus | ||
| 117 | Planning-Production | NO | 0.511615973 | N.S. | 0.68658 | 0.3154233 | −62.61 | 1.93 | 24.91 | −65.57 | 3.22 | 21.65 | Left precentral gyrus | ||
| 118 | Planning-Production | NO | 0.54340936 | −0.241996841 | 0.39515 | 0.9863127 | −63.12 | 0.16 | 22.17 | −65.91 | 1.47 | 18.69 | Left precentral gyrus | ||
| 119 | Production | NO | N.S. | N.S. | N.S. | 0.8051178 | −63.63 | −1.64 | 19.40 | −66.63 | −0.36 | 15.86 | Left precentral gyrus | ||
| 120 | Production | NO | 0.569992103 | −0.831687471 | N.S. | 0.8015205 | −64.13 | −3.48 | 16.59 | −67.30 | −2.36 | 13.13 | Left postcentral gyrus | Left precentral gyrus | |
| 121 | Production | NO | N.S. | −0.460260109 | N.S. | 0.4765639 | −64.63 | −5.37 | 13.74 | −67.47 | −4.61 | 10.46 | Left postcentral gyrus | Left precentral gyrus | |
| 122 | Production | NO | N.S. | N.S. | N.S. | 0.5489617 | −65.13 | −7.30 | 10.85 | −67.66 | −6.85 | 7.86 | Left postcentral gyrus | Left precentral gyrus | |
| 123 | Planning | NO | 0.4876166 | N.S. | 0.23818 | N.S. | −65.63 | −9.26 | 7.93 | −68.02 | −8.93 | 5.44 | Left superior temporal gyrus | ||
| 124 | YES | 0.403989498 | N.S. | 0.19335 | N.S. | −66.13 | −11.25 | 4.99 | −68.34 | −10.97 | 3.05 | Left superior temporal gyrus | |||
| 125 | Planning | NO | 0.461298078 | N.S. | 0.17854 | N.S. | −66.63 | −13.26 | 2.03 | −68.55 | −13.04 | 0.47 | Left superior temporal gyrus | ||
| 126 | NO | 0.660195039 | N.S. | N.S. | −0.570145 | −67.13 | −15.29 | −0.93 | −68.56 | −15.19 | −2.29 | Left superior temporal gyrus | |||
| 127 | Perception-Planning | NO | N.S. | 0.395354754 | 0.19466 | N.S. | −67.63 | −17.31 | −3.89 | −68.82 | −17.34 | −5.24 | Left superior temporal gyrus | ||
| 128 | Production | NO | N.S. | N.S. | N.S. | 0.3904261 | −68.13 | −19.33 | −6.81 | −69.09 | −19.50 | −8.11 | Left middle temporal gyrus | ||
| 129 | YES | N.S. | −0.290047821 | 0.32529 | N.S. | −28.03 | 58.45 | 31.71 | −29.47 | 60.30 | 27.05 | Left rostral middle frontal gyrus | Left superior frontal gyrus | ||
| 130 | Planning | NO | N.S. | −0.478665538 | 0.4469 | N.S. | −31.02 | 55.46 | 31.81 | −32.71 | 57.73 | 27.84 | Left rostral middle frontal gyrus | Left superior frontal gyrus | |
| 131 | YES | N.S. | −0.472549924 | 0.44554 | N.S. | −34.06 | 52.48 | 31.90 | −36.12 | 54.60 | 28.28 | Left rostral middle frontal gyrus | Left superior frontal gyrus | ||
| 132 | YES | N.S. | N.S. | N.S. | N.S. | −45.21 | 37.44 | 32.86 | −48.72 | 39.40 | 30.79 | Left rostral middle frontal gyrus | |||
| 133 | YES | N.S. | N.S. | 0.41443 | N.S. | −46.83 | 34.39 | 33.15 | −50.55 | 36.51 | 31.28 | Left rostral middle frontal gyrus | |||
| 134 | Planning-Production | NO | N.S. | N.S. | 0.55915 | 0.4932839 | −48.37 | 31.31 | 33.46 | −52.02 | 33.43 | 31.58 | Left rostral middle frontal gyrus | ||
| 135 | YES | N.S. | N.S. | 0.19102 | N.S. | −30.35 | 58.25 | 28.29 | −32.19 | 60.29 | 23.98 | Left rostral middle frontal gyrus | Left superior frontal gyrus | ||
| 136 | YES | N.S. | N.S. | 0.44957 | N.S. | −33.35 | 55.26 | 28.38 | −35.48 | 57.44 | 24.61 | Left rostral middle frontal gyrus | Left superior frontal gyrus | ||
| 137 | YES | N.S. | N.S. | 0.30719 | N.S. | −36.39 | 52.27 | 28.48 | −38.77 | 54.01 | 24.86 | Left rostral middle frontal gyrus | Left superior frontal gyrus | ||
| 138 | YES | N.S. | N.S. | N.S. | N.S. | −39.18 | 49.27 | 28.60 | −41.87 | 50.64 | 25.08 | Left rostral middle frontal gyrus | |||
| 139 | YES | N.S. | N.S. | 0.23668 | N.S. | −41.53 | 46.27 | 28.77 | −44.61 | 47.59 | 25.51 | Left rostral middle frontal gyrus | |||
| 140 | YES | N.S. | N.S. | N.S. | N.S. | −43.49 | 43.26 | 28.99 | −46.88 | 44.78 | 26.17 | Left rostral middle frontal gyrus | |||
| 141 | YES | N.S. | N.S. | −0.22107 | N.S. | −45.20 | 40.23 | 29.25 | −48.72 | 41.98 | 26.84 | Left rostral middle frontal gyrus | |||
| 142 | YES | N.S. | N.S. | N.S. | N.S. | −46.76 | 37.18 | 29.54 | −50.41 | 39.13 | 27.47 | Left rostral middle frontal gyrus | |||
| 143 | Planning | NO | N.S. | −0.359056089 | 0.48131 | N.S. | −48.24 | 34.10 | 29.86 | −51.98 | 36.18 | 27.97 | Left rostral middle frontal gyrus | ||
| 144 | Planning | NO | 0.415476798 | −0.531732573 | 0.43211 | N.S. | −49.66 | 31.01 | 30.19 | −53.29 | 33.05 | 28.26 | Left rostral middle frontal gyrus | ||
| 145 | YES | −0.480200486 | N.S. | 0.24176 | 0.4394925 | −32.67 | 58.07 | 24.85 | −34.88 | 60.02 | 20.69 | Left rostral middle frontal gyrus | Left superior frontal gyrus | ||
| 146 | YES | −0.358477925 | N.S. | N.S. | N.S. | −35.65 | 55.08 | 24.94 | −37.94 | 56.66 | 20.96 | Left rostral middle frontal gyrus | |||
| 147 | YES | N.S. | N.S. | N.S. | N.S. | −38.66 | 52.08 | 25.04 | −41.22 | 53.13 | 21.13 | Left rostral middle frontal gyrus | |||
| 148 | YES | N.S. | N.S. | N.S. | N.S. | −41.38 | 49.08 | 25.18 | −44.34 | 49.93 | 21.32 | Left rostral middle frontal gyrus | |||
| 149 | YES | N.S. | N.S. | N.S. | N.S. | −43.49 | 46.07 | 25.38 | −46.73 | 46.99 | 21.80 | Left rostral middle frontal gyrus | |||
| 150 | YES | N.S. | N.S. | −0.22454 | N.S. | −45.19 | 43.04 | 25.63 | −48.65 | 44.24 | 22.48 | Left rostral middle frontal gyrus | |||
| 151 | YES | N.S. | N.S. | −0.16513 | N.S. | −46.69 | 39.99 | 25.92 | −50.31 | 41.56 | 23.26 | Left rostral middle frontal gyrus | |||
| 152 | YES | N.S. | N.S. | N.S. | N.S. | −48.08 | 36.91 | 26.25 | −51.77 | 38.72 | 23.95 | Left rostral middle frontal gyrus | |||
| 153 | Planning | NO | N.S. | N.S. | 0.46842 | N.S. | −49.44 | 33.81 | 26.59 | −53.13 | 35.74 | 24.49 | Left rostral middle frontal gyrus | ||
| 154 | YES | N.S. | N.S. | 0.42377 | N.S. | −50.78 | 30.69 | 26.95 | −54.52 | 32.66 | 24.87 | Left rostral middle frontal gyrus | |||
| 155 | YES | N.S. | N.S. | 0.23393 | N.S. | −34.74 | 57.90 | 21.42 | −37.13 | 59.40 | 17.09 | Left rostral middle frontal gyrus | |||
| 156 | YES | −0.418091248 | N.S. | N.S. | N.S. | −37.62 | 54.92 | 21.52 | −40.28 | 56.00 | 17.35 | Left rostral middle frontal gyrus | |||
| 157 | YES | N.S. | N.S. | N.S. | N.S. | −40.53 | 51.92 | 21.62 | −43.79 | 52.76 | 17.48 | Left rostral middle frontal gyrus | |||
| 158 | YES | N.S. | N.S. | 0.22088 | N.S. | −43.17 | 48.90 | 21.77 | −46.82 | 49.67 | 17.66 | Left rostral middle frontal gyrus | |||
| 159 | Planning | NO | 0.431468356 | −0.466100735 | 0.52114 | N.S. | −45.00 | 45.88 | 22.00 | −48.69 | 46.62 | 18.09 | Left rostral middle frontal gyrus | ||
| 160 | YES | N.S. | N.S. | N.S. | N.S. | −46.49 | 42.83 | 22.29 | −50.26 | 43.85 | 18.81 | Left rostral middle frontal gyrus | |||
| 161 | NO | N.S. | N.S. | −0.1945 | N.S. | −47.83 | 39.75 | 22.62 | −51.76 | 41.21 | 19.66 | Left rostral middle frontal gyrus | |||
| 162 | YES | N.S. | −0.270173192 | N.S. | N.S. | −49.13 | 36.64 | 22.98 | −53.11 | 38.38 | 20.42 | Left rostral middle frontal gyrus | |||
| 163 | YES | N.S. | N.S. | N.S. | N.S. | −50.41 | 33.51 | 23.36 | −54.48 | 35.41 | 21.04 | Left rostral middle frontal gyrus | |||
| 164 | YES | N.S. | N.S. | 0.45142 | N.S. | −51.70 | 30.36 | 23.74 | −55.98 | 32.34 | 21.53 | Left rostral middle frontal gyrus | |||
| 165 | YES | N.S. | N.S. | N.S. | 0.395963 | −36.46 | 57.73 | 18.04 | −39.00 | 58.86 | 13.58 | Left rostral middle frontal gyrus | |||
| 166 | YES | N.S. | N.S. | N.S. | N.S. | −39.10 | 54.77 | 18.13 | −42.40 | 55.75 | 13.86 | Left rostral middle frontal gyrus | |||
| 167 | YES | N.S. | N.S. | N.S. | N.S. | −41.70 | 51.78 | 18.25 | −45.87 | 52.81 | 14.02 | Left rostral middle frontal gyrus | |||
| 168 | Planning | NO | N.S. | −0.364397159 | 0.28151 | N.S. | −44.01 | 48.77 | 18.42 | −48.52 | 49.67 | 14.16 | Left rostral middle frontal gyrus | ||
| 169 | Planning | NO | N.S. | −0.40258237 | 0.41346 | N.S. | −45.81 | 45.72 | 18.67 | −50.27 | 46.55 | 14.51 | Left rostral middle frontal gyrus | ||
| 170 | YES | N.S. | −0.289334239 | N.S. | N.S. | −47.28 | 42.63 | 18.99 | −51.69 | 43.70 | 15.21 | Left rostral middle frontal gyrus | |||
| 171 | YES | N.S. | N.S. | N.S. | 0.3799264 | −48.60 | 39.51 | 19.35 | −52.95 | 40.89 | 16.04 | Left rostral middle frontal gyrus | |||
| 172 | YES | N.S. | N.S. | −0.1498 | N.S. | −49.88 | 36.36 | 19.74 | −54.22 | 38.02 | 16.84 | Left rostral middle frontal gyrus | |||
| 173 | YES | N.S. | N.S. | 0.18761 | N.S. | −51.14 | 33.19 | 20.15 | −55.65 | 35.07 | 17.58 | Left rostral middle frontal gyrus | |||
| 174 | Planning | NO | 0.513333262 | −0.361443944 | 0.5672 | N.S. | −52.43 | 30.02 | 20.55 | −57.09 | 31.92 | 18.17 | Left rostral middle frontal gyrus | ||
| 175 | YES | N.S. | N.S. | 0.24259 | N.S. | −37.87 | 57.54 | 14.69 | −40.77 | 58.57 | 10.15 | Left rostral middle frontal gyrus | |||
| 176 | NO | N.S. | N.S. | N.S. | N.S. | −40.19 | 54.60 | 14.79 | −44.20 | 55.70 | 10.38 | Left rostral middle frontal gyrus | |||
| 177 | YES | N.S. | N.S. | N.S. | N.S. | −42.40 | 51.65 | 14.92 | −47.13 | 52.66 | 10.47 | Left rostral middle frontal gyrus | |||
| 178 | YES | N.S. | N.S. | N.S. | N.S. | −44.41 | 48.64 | 15.11 | −49.54 | 49.56 | 10.64 | Left pars triangularis | Left rostral middle frontal gyrus | ||
| 179 | YES | 0.566479099 | −0.532987781 | 0.21628 | N.S. | −46.16 | 45.56 | 15.38 | −51.20 | 46.43 | 10.97 | Left pars triangularis | Left rostral middle frontal gyrus | ||
| 180 | Planning | NO | 0.719029168 | −0.851926431 | 0.28542 | N.S. | −47.69 | 42.43 | 15.73 | −52.57 | 43.48 | 11.56 | Left pars triangularis | Left rostral middle frontal gyrus | |
| 181 | YES | N.S. | N.S. | N.S. | N.S. | −49.08 | 39.25 | 16.12 | −53.89 | 40.60 | 12.39 | Left pars triangularis | Left rostral middle frontal gyrus | ||
| 182 | YES | N.S. | −0.490610546 | 0.22024 | N.S. | −50.39 | 36.06 | 16.55 | −55.19 | 37.71 | 13.26 | Left rostral middle frontal gyrus | |||
| 183 | YES | 0.327363325 | −0.333835397 | N.S. | N.S. | −51.69 | 32.86 | 16.98 | −56.54 | 34.72 | 14.09 | Left rostral middle frontal gyrus | |||
| 184 | YES | 0.386698715 | N.S. | 0.21871 | N.S. | −53.00 | 29.66 | 17.40 | −57.84 | 31.47 | 14.81 | Left rostral middle frontal gyrus | |||
| 185 | YES | N.S. | N.S. | N.S. | N.S. | −39.09 | 57.31 | 11.40 | −42.33 | 58.22 | 6.68 | Left rostral middle frontal gyrus | |||
| 186 | YES | N.S. | N.S. | N.S. | N.S. | −41.09 | 54.40 | 11.50 | −45.44 | 55.39 | 6.86 | Left rostral middle frontal gyrus | |||
| 187 | YES | N.S. | N.S. | N.S. | N.S. | −42.93 | 51.47 | 11.63 | −47.94 | 52.28 | 6.97 | Left pars triangularis | Left rostral middle frontal gyrus | ||
| 188 | YES | N.S. | N.S. | N.S. | N.S. | −44.65 | 48.48 | 11.83 | −50.13 | 49.23 | 7.23 | Left pars triangularis | |||
| 189 | YES | N.S. | N.S. | N.S. | N.S. | −46.34 | 45.37 | 12.14 | −51.73 | 46.10 | 7.56 | Left pars triangularis | |||
| 190 | YES | N.S. | N.S. | 0.20705 | N.S. | −47.94 | 42.19 | 12.51 | −53.19 | 43.13 | 8.08 | Left pars triangularis | |||
| 191 | Planning | NO | N.S. | −0.397844856 | 0.34621 | N.S. | −49.40 | 38.97 | 12.94 | −54.67 | 40.31 | 8.88 | Left pars triangularis | ||
| 192 | Excluded - Artifactual | N/A | −50.78 | 35.73 | 13.39 | −56.02 | 37.45 | 9.78 | Left pars triangularis | ||||||
| 193 | YES | N.S. | −0.350056308 | N.S. | N.S. | −52.12 | 32.50 | 13.84 | −57.31 | 34.41 | 10.69 | Left rostral middle frontal gyrus | Left pars triangularis | ||
| 194 | YES | 0.422534773 | −0.41124449 | 0.2455 | N.S. | −53.48 | 29.28 | 14.27 | −58.44 | 31.09 | 11.49 | Left rostral middle frontal gyrus | Left pars triangularis | ||
| 195 | YES | −0.361720879 | N.S. | N.S. | 0.3754501 | −40.27 | 57.03 | 8.16 | −43.68 | 57.64 | 3.24 | Left rostral middle frontal gyrus | |||
| 196 | YES | N.S. | N.S. | 0.34366 | N.S. | −42.00 | 54.13 | 8.27 | −46.27 | 54.68 | 3.43 | Left rostral middle frontal gyrus | |||
| 197 | YES | N.S. | N.S. | N.S. | N.S. | −43.54 | 51.22 | 8.41 | −48.51 | 51.56 | 3.68 | Left pars triangularis | |||
| 198 | YES | 0.550820192 | −0.62394099 | N.S. | N.S. | −44.99 | 48.24 | 8.62 | −50.45 | 48.52 | 4.00 | Left pars triangularis | |||
| 199 | YES | N.S. | N.S. | 0.37912 | N.S. | −46.64 | 45.10 | 8.95 | −52.07 | 45.46 | 4.31 | Left pars triangularis | |||
| 200 | Planning-Production | NO | N.S. | N.S. | 0.38229 | 0.4774449 | −48.24 | 41.89 | 9.35 | −53.62 | 42.60 | 4.77 | Left pars triangularis | ||
| 201 | Planning | NO | N.S. | −0.360895411 | 0.26511 | N.S. | −49.74 | 38.64 | 9.79 | −55.24 | 39.90 | 5.51 | Left pars triangularis | ||
| 202 | YES | N.S. | N.S. | N.S. | N.S. | −51.14 | 35.37 | 10.26 | −56.59 | 37.08 | 6.39 | Left pars triangularis | |||
| 203 | YES | 0.596919851 | −0.590250453 | 0.42056 | N.S. | −52.52 | 32.11 | 10.72 | −57.81 | 34.01 | 7.37 | Left pars triangularis | |||
| 204 | Planning | NO | 0.583516417 | −0.485800061 | 0.4441 | N.S. | −53.91 | 28.88 | 11.17 | −58.79 | 30.70 | 8.24 | Left rostral middle frontal gyrus | Left pars triangularis | |
| 205 | Planning-Production | NO | −0.525620905 | N.S. | 0.33882 | 0.7154558 | −41.47 | 56.69 | 4.97 | −45.07 | 56.94 | 0.02 | Left rostral middle frontal gyrus | ||
| 206 | YES | −0.518968937 | N.S. | N.S. | 0.3371256 | −43.02 | 53.78 | 5.11 | −47.11 | 53.74 | 0.24 | Left rostral middle frontal gyrus | |||
| 207 | YES | N.S. | −0.442286298 | 0.2905 | N.S. | −44.40 | 50.85 | 5.27 | −49.12 | 50.49 | 0.59 | Left pars triangularis | Left rostral middle frontal gyrus | ||
| 208 | YES | N.S. | N.S. | N.S. | N.S. | −45.76 | 47.85 | 5.50 | −50.89 | 47.46 | 0.88 | Left pars triangularis | |||
| 209 | YES | N.S. | N.S. | N.S. | N.S. | −47.23 | 44.73 | 5.83 | −52.45 | 44.62 | 1.11 | Left pars triangularis | |||
| 210 | Planning-Production | NO | N.S. | N.S. | 0.40709 | 0.420953 | −48.74 | 41.52 | 6.23 | −53.96 | 41.91 | 1.48 | Left pars triangularis | ||
| 211 | YES | N.S. | N.S. | N.S. | N.S. | −50.20 | 38.26 | 6.68 | −55.52 | 39.28 | 2.17 | Left pars triangularis | |||
| 212 | Planning-Production | NO | N.S. | −0.417270935 | 0.34341 | 0.4051321 | −51.59 | 34.98 | 7.15 | −56.95 | 36.53 | 3.08 | Left pars triangularis | ||
| 213 | Planning | NO | N.S. | −0.887215574 | 0.72968 | N.S. | −52.97 | 31.70 | 7.63 | −58.08 | 33.47 | 4.12 | Left pars triangularis | ||
| 214 | Planning | NO | 0.984719301 | −0.857115685 | 0.5447 | −0.670937 | −54.38 | 28.46 | 8.08 | −59.01 | 30.20 | 5.06 | Left pars triangularis | ||
| 215 | Planning-Production | NO | −0.395708892 | N.S. | 0.28817 | 0.5820646 | −42.65 | 56.30 | 1.82 | −46.27 | 56.14 | −3.18 | Left rostral middle frontal gyrus | ||
| 216 | YES | N.S. | N.S. | N.S. | 0.3792047 | −44.09 | 53.37 | 1.98 | −48.06 | 52.86 | −2.89 | Left rostral middle frontal gyrus | |||
| 217 | YES | N.S. | −0.353313752 | N.S. | N.S. | −45.40 | 50.42 | 2.17 | −49.98 | 49.67 | −2.49 | Left pars triangularis | Left rostral middle frontal gyrus | ||
| 218 | YES | N.S. | N.S. | N.S. | N.S. | −46.69 | 47.40 | 2.42 | −51.60 | 46.73 | −2.24 | Left pars triangularis | Left pars orbitalis | ||
| 219 | YES | N.S. | N.S. | N.S. | N.S. | −48.04 | 44.28 | 2.75 | −53.02 | 44.01 | −2.02 | Left pars triangularis | Left pars orbitalis | ||
| 220 | YES | N.S. | N.S. | N.S. | N.S. | −49.44 | 41.09 | 3.15 | −54.41 | 41.35 | −1.65 | Left pars triangularis | |||
| 221 | YES | N.S. | N.S. | 0.28888 | N.S. | −50.83 | 37.84 | 3.59 | −55.80 | 38.68 | −0.99 | Left pars triangularis | |||
| 222 | YES | N.S. | N.S. | N.S. | N.S. | −52.20 | 34.57 | 4.06 | −57.23 | 35.93 | −0.09 | Left pars triangularis | |||
| 223 | YES | N.S. | N.S. | N.S. | N.S. | −53.56 | 31.29 | 4.53 | −58.36 | 32.91 | 0.94 | Left pars triangularis | |||
| 224 | Planning | NO | 0.789961341 | −0.813582119 | 0.54161 | −0.419804 | −54.97 | 28.04 | 4.99 | −59.38 | 29.72 | 1.87 | Left pars triangularis | ||
| 442L Chronic | 1 | YES | N.S. | N.S. | N.S. | N.S. | −24.36 | 8.56 | −14.09 | −24.46 | 9.93 | −15.98 | Left insular cortex | ||
| 2 | YES | N.S. | N.S. | N.S. | N.S. | −34.51 | 6.83 | −12.37 | −34.69 | 7.44 | −14.15 | Left insular cortex | |||
| 3 | YES | N.S. | 0.083650613 | N.S. | N.S. | −44.92 | 6.10 | −10.87 | −46.42 | 6.96 | −12.71 | Left superior temporal gyrus | |||
| 4 | YES | N.S. | N.S. | N.S. | N.S. | −55.31 | 4.87 | −9.93 | −55.58 | 6.54 | −12.36 | Left superior temporal gyrus | |||
| 15 | Excluded - In white matter | N/A | −28.89 | −39.57 | 13.70 | −30.08 | −39.71 | 9.33 | Left superior temporal gyrus | White matter | |||||
| 16 | Excluded - In white matter | N/A | −31.61 | −35.42 | 11.58 | −32.37 | −35.78 | 7.62 | Left superior temporal gyrus | White matter | |||||
| 17 | Excluded - In white matter | N/A | −34.46 | −31.23 | 9.54 | −34.77 | −31.99 | 6.41 | Left superior temporal gyrus | White matter | |||||
| 18 | Perception-Production | NO | N.S. | 0.58311654 | −0.14119 | 0.490018 | −37.48 | −27.08 | 7.64 | −37.60 | −28.50 | 5.44 | Left transverse temporal gyrus | Left transverse temporal gyrus | |
| 19 | Perception-Production | NO | N.S. | 0.784240992 | −0.09455 | 0.4448385 | −40.68 | −23.02 | 5.92 | −40.46 | −24.73 | 4.35 | Left superior temporal gyrus | Left transverse temporal gyrus | |
| 20 | Perception-Production | NO | N.S. | 0.508104183 | −0.17185 | 0.1970076 | −43.99 | −19.00 | 4.31 | −43.70 | −20.52 | 2.42 | Left superior temporal gyrus | Left transverse temporal gyrus | |
| 21 | Perception-Production | NO | N.S. | 0.526808366 | −0.10338 | 0.1661044 | −47.33 | −14.98 | 2.77 | −47.99 | −15.79 | −0.71 | Left superior temporal gyrus | Left transverse temporal gyrus | |
| 22 | Perception | NO | N.S. | 0.370590562 | −0.11896 | N.S. | −50.64 | −10.89 | 1.27 | −52.87 | −11.41 | −2.99 | Left superior temporal gyrus | Left transverse temporal gyrus | |
| 23 | YES | N.S. | 0.270722266 | N.S. | N.S. | −53.85 | −6.68 | −0.20 | −56.11 | −5.76 | −2.96 | Left superior temporal gyrus | Left transverse temporal gyrus | ||
| 24 | YES | N.S. | 0.266031243 | N.S. | N.S. | −56.93 | −2.40 | −1.63 | −58.55 | −0.37 | −3.32 | Left superior temporal gyrus | Left transverse temporal gyrus | ||
| 25 | YES | N.S. | 0.338945069 | N.S. | 0.1845125 | −59.87 | 1.90 | −2.97 | −61.26 | 3.73 | −5.34 | Left superior temporal gyrus | Left transverse temporal gyrus | ||
| 26 | Excluded - Outside of brain | N/A | −62.72 | 6.20 | −4.26 | −64.03 | 7.89 | −7.07 | Left superior temporal gyrus | Outside brain | |||||
| 53 | Perception | NO | N.S. | 0.289494235 | −0.11427 | N.S. | −32.29 | −15.55 | 2.14 | −33.27 | −17.57 | −0.29 | Left insular cortex | ||
| 54 | Perception | NO | N.S. | 0.35177898 | −0.19546 | N.S. | −37.39 | −16.58 | 3.77 | −37.35 | −18.48 | 1.51 | Left insular cortex | ||
| 55 | Perception | NO | N.S. | 0.96298254 | N.S. | N.S. | −42.17 | −17.82 | 5.08 | −41.89 | −19.54 | 3.07 | Left superior temporal gyrus | Left transverse temporal gyrus | |
| 56 | Perception-Production | NO | N.S. | 0.76026345 | −0.16449 | 0.1437885 | −46.74 | −19.06 | 6.22 | −46.34 | −20.11 | 4.39 | Left superior temporal gyrus | Left transverse temporal gyrus | |
| 57 | Perception | NO | N.S. | 0.359656568 | −0.09559 | N.S. | −51.32 | −19.98 | 7.47 | −50.43 | −19.70 | 5.03 | Left superior temporal gyrus | Left transverse temporal gyrus | |
| 58 | Perception | NO | 0.248615927 | 0.232630454 | −0.30897 | N.S. | −55.99 | −20.33 | 9.18 | −54.91 | −18.42 | 6.14 | Left superior temporal gyrus | Left transverse temporal gyrus | |
| 59 | YES | N.S. | 0.255673852 | N.S. | N.S. | −60.38 | −20.31 | 11.78 | −61.41 | −18.82 | 8.61 | Left superior temporal gyrus | |||
| 60 | Perception | NO | N.S. | 0.442240776 | N.S. | N.S. | −64.70 | −20.26 | 14.74 | −68.17 | −20.53 | 11.28 | Left superior temporal gyrus | ||
| 61 | Excluded - Seizure focus | N/A | −30.24 | −29.45 | −19.99 | −32.56 | −27.73 | −29.63 | Left parahippocampal gyrus | Left fusiform gyrus | |||||
| 62 | Excluded - Seizure focus | N/A | −37.81 | −35.77 | −22.74 | −40.73 | −34.40 | −31.44 | Left fusiform gyrus | Left fusiform gyrus | |||||
| 63 | Excluded - Seizure focus | N/A | −46.43 | −41.41 | −23.91 | −48.31 | −39.48 | −32.34 | Left fusiform gyrus | Left fusiform gyrus | |||||
| 64 | YES | N.S. | N.S. | −0.12941 | N.S. | −54.78 | −46.10 | −20.71 | −55.06 | −44.92 | −29.80 | Left fusiform gyrus | Left inferior temporal gyrus | ||
| 65 | Excluded - Seizure focus | N/A | −27.91 | −46.32 | −13.18 | −27.47 | −46.30 | −20.14 | Left fusiform gyrus | ||||||
| 66 | Excluded - Seizure focus | N/A | −25.77 | −36.99 | −15.79 | −25.69 | −35.10 | −22.45 | Left fusiform gyrus | ||||||
| 67 | Excluded - Seizure focus | N/A | −23.51 | −27.35 | −20.02 | −25.10 | −25.77 | −28.18 | Left parahippocampal gyrus | ||||||
| 68 | Excluded - Seizure focus | N/A | −21.36 | −17.70 | −25.34 | −21.94 | −17.40 | −32.71 | Left entrohinal cortex | ||||||
| 69 | Excluded - Seizure focus | N/A | −19.67 | −8.28 | −30.14 | −20.55 | −7.74 | −33.08 | Left entrohinal cortex | ||||||
| 70 | Excluded - Seizure focus | N/A | −19.26 | 0.57 | −34.30 | −20.58 | 1.40 | −35.49 | Left entrohinal cortex | ||||||
| 71 | YES | N.S. | N.S. | N.S. | N.S. | −21.82 | 8.59 | −40.39 | −21.50 | 10.80 | −44.97 | Left entrohinal cortex | |||
| 72 | YES | N.S. | N.S. | N.S. | N.S. | −25.77 | 17.82 | −39.87 | −25.60 | 20.76 | −44.67 | Left temporal pole | |||
| 73 | YES | N.S. | N.S. | N.S. | N.S. | −32.46 | 23.63 | −33.78 | −32.93 | 26.12 | −37.65 | Left temporal pole | |||
| 74 | YES | N.S. | N.S. | −0.09122 | N.S. | −40.97 | 24.79 | −27.91 | −41.25 | 26.36 | −30.99 | Left superior temporal gyrus | Left temporal pole | ||
| 75 | YES | N.S. | N.S. | N.S. | N.S. | −51.44 | 35.91 | 7.36 | −54.64 | 39.97 | 7.02 | Left pars triangularis | Left rostral middle frontal gyrus | ||
| 76 | YES | N.S. | N.S. | 0.28314 | N.S. | −52.92 | 32.42 | 10.50 | −55.68 | 35.65 | 10.07 | Left pars triangularis | |||
| 77 | YES | N.S. | N.S. | 0.09471 | 0.1694217 | −54.23 | 28.83 | 13.75 | −56.47 | 30.89 | 12.87 | Left pars triangularis | |||
| 78 | Planning | NO | N.S. | −0.231101435 | 0.25731 | N.S. | −55.43 | 25.22 | 17.09 | −57.25 | 25.74 | 16.01 | Left pars triangularis | ||
| 79 | YES | N.S. | N.S. | N.S. | N.S. | −56.67 | 21.67 | 20.51 | −58.28 | 21.83 | 19.87 | Left pars opercularis | Left pars triangularis | ||
| 80 | YES | N.S. | −0.212510613 | 0.26971 | N.S. | −46.43 | 42.01 | −6.26 | −48.46 | 45.98 | −9.23 | Left pars orbitalis | |||
| 81 | Planning-Production | NO | N.S. | −0.257939163 | 0.34577 | 0.2372587 | −48.69 | 38.87 | −2.64 | −52.00 | 43.58 | −4.79 | Left pars orbitalis | ||
| 82 | YES | N.S. | N.S. | 0.33808 | N.S. | −50.82 | 35.76 | 0.41 | −54.10 | 40.25 | −0.90 | Left pars triangularis | |||
| 83 | YES | 0.198960758 | −0.202421681 | 0.2593 | N.S. | −52.74 | 32.56 | 3.35 | −55.57 | 36.43 | 2.63 | Left pars triangularis | |||
| 84 | YES | N.S. | N.S. | 0.24347 | N.S. | −54.38 | 29.18 | 6.45 | −56.30 | 32.17 | 5.78 | Left pars triangularis | |||
| 85 | YES | N.S. | N.S. | 0.16327 | N.S. | −55.80 | 25.67 | 9.71 | −57.14 | 27.67 | 8.72 | Left pars triangularis | |||
| 86 | YES | N.S. | −0.104057039 | 0.09603 | N.S. | −57.08 | 22.13 | 13.09 | −58.28 | 22.77 | 11.97 | Left pars triangularis | |||
| 87 | YES | N.S. | N.S. | N.S. | N.S. | −58.38 | 18.62 | 16.56 | −59.49 | 19.18 | 15.65 | Left pars opercularis | |||
| 88 | YES | N.S. | N.S. | 0.17666 | N.S. | −46.58 | 38.30 | −10.28 | −47.95 | 41.51 | −14.13 | Left pars orbitalis | |||
| 89 | YES | N.S. | N.S. | 0.18563 | N.S. | −49.15 | 35.24 | −6.86 | −51.33 | 39.02 | −9.75 | Left pars orbitalis | |||
| 90 | YES | N.S. | N.S. | 0.1006 | N.S. | −51.74 | 32.23 | −3.81 | −54.25 | 36.13 | −5.96 | Left pars triangularis | |||
| 91 | YES | N.S. | N.S. | 0.14279 | N.S. | −54.03 | 29.12 | −0.85 | −55.87 | 32.61 | −2.42 | Left pars triangularis | |||
| 92 | YES | N.S. | N.S. | 0.15158 | N.S. | −55.87 | 25.83 | 2.31 | −56.87 | 28.62 | 1.10 | Left pars triangularis | |||
| 93 | Perception-Planning | NO | N.S. | 0.227715842 | 0.25491 | N.S. | −57.39 | 22.42 | 5.65 | −57.91 | 24.47 | 4.26 | Left pars triangularis | ||
| 94 | Planning-Production | NO | N.S. | −0.256299395 | 0.37672 | 0.2444724 | −58.79 | 18.96 | 9.11 | −59.78 | 20.36 | 7.66 | Left pars opercularis | ||
| 95 | Planning | NO | N.S. | −0.305080447 | 0.41982 | N.S. | −60.16 | 15.50 | 12.64 | −61.51 | 16.80 | 11.31 | Left pars opercularis | ||
| 96 | YES | N.S. | N.S. | 0.15559 | N.S. | −46.86 | 34.61 | −14.51 | −48.16 | 37.18 | −18.45 | Left pars orbitalis | |||
| 120 | YES | N.S. | N.S. | 0.29606 | N.S. | −49.71 | 31.61 | −11.22 | −28.22 | 9.33 | −48.53 | Left pars orbitalis | |||
| 121 | YES | N.S. | N.S. | 0.23189 | N.S. | −52.62 | 28.65 | −8.16 | −37.76 | 14.85 | −45.89 | Left pars orbitalis | |||
| 122 | YES | N.S. | −0.248406893 | N.S. | N.S. | −55.23 | 25.62 | −5.13 | −46.44 | 18.46 | −38.27 | Left pars triangularis | |||
| 123 | YES | 0.24249816 | −0.165329408 | 0.12059 | N.S. | −57.19 | 22.38 | −1.85 | −49.46 | 17.54 | −27.37 | Left pars triangularis | |||
| 124 | YES | N.S. | −0.113972627 | N.S. | N.S. | −58.84 | 19.04 | 1.59 | −53.88 | 18.07 | −17.43 | Left pars triangularis | |||
| 125 | Planning | NO | 0.387885157 | −0.618726533 | 0.45789 | N.S. | −60.36 | 15.65 | 5.13 | −58.63 | 20.41 | −8.10 | Left pars opercularis | ||
| 126 | YES | N.S. | −0.208991946 | 0.10942 | 0.1889376 | −61.82 | 12.24 | 8.72 | −31.17 | 3.48 | −49.82 | Left pars opercularis | |||
| 97 | YES | N.S. | N.S. | N.S. | N.S. | −29.12 | 6.85 | −43.18 | −41.40 | 5.09 | −48.97 | Left temporal pole | |||
| 98 | Excluded - Seizure focus | N/A | −38.66 | 12.39 | −40.62 | −49.69 | 7.60 | −42.11 | Left middle temporal gyrus | Left Inferior temporal gyrus | |||||
| 99 | Excluded - Seizure focus | N/A | −46.81 | 16.32 | −33.97 | −54.39 | 8.88 | −31.25 | Left middle temporal gyrus | ||||||
| 100 | Excluded - Seizure focus | N/A | −49.74 | 15.74 | −24.41 | −59.10 | 9.70 | −20.17 | Left superior temporal gyrus | ||||||
| 101 | Excluded - Seizure focus | N/A | −53.86 | 16.55 | −15.10 | −31.89 | −5.84 | −48.93 | Left superior temporal gyrus | ||||||
| 102 | YES | N.S. | N.S. | N.S. | N.S. | −58.09 | 18.08 | −5.87 | −42.32 | −5.28 | −49.60 | Left superior temporal gyrus | Left pars triangularis | ||
| 103 | YES | N.S. | N.S. | N.S. | 0.1354987 | −31.64 | 1.33 | −42.80 | −50.97 | −4.13 | −44.60 | Left fusiform gyrus | Left temporal pole | ||
| 104 | YES | N.S. | N.S. | N.S. | 0.236212 | −42.09 | 3.81 | −43.17 | −57.66 | −2.01 | −34.36 | Left Inferior temporal gyrus | Left temporal pole | ||
| 105 | Excluded - Seizure focus | N/A | −49.87 | 6.63 | −35.58 | −32.47 | −9.69 | −47.77 | Left middle temporal gyrus | ||||||
| 106 | Excluded - Seizure focus | N/A | −54.41 | 7.31 | −26.20 | −42.84 | −11.72 | −46.29 | Left middle temporal gyrus | ||||||
| 107 | YES | N.S. | N.S. | N.S. | N.S. | −58.75 | 7.74 | −16.70 | −52.59 | −12.66 | −42.08 | Left superior temporal gyrus | |||
| 108 | YES | N.S. | N.S. | N.S. | N.S. | −31.92 | −7.05 | −41.25 | −61.63 | −11.95 | −34.41 | Left fusiform gyrus | Left temporal pole | ||
| 109 | Excluded - Seizure focus | N/A | −42.07 | −6.25 | −40.76 | −31.76 | −22.00 | −33.66 | Left inferior temporal gyrus | ||||||
| 110 | YES | N.S. | N.S. | N.S. | N.S. | −51.18 | −4.11 | −35.68 | −42.51 | −22.66 | −33.76 | Left Inferior temporal gyrus | |||
| 111 | YES | N.S. | N.S. | N.S. | N.S. | −58.01 | −2.19 | −27.85 | −53.02 | −22.78 | −33.66 | Left inferior temporal gyrus | |||
| 112 | YES | N.S. | N.S. | N.S. | 0.2760766 | −32.36 | −10.69 | −40.03 | −63.65 | −21.11 | −32.59 | Left fusiform gyrus | Left temporal pole | ||
| 113 | YES | N.S. | N.S. | N.S. | N.S. | −43.11 | −12.49 | −38.12 | −50.97 | 34.29 | −14.46 | Left inferior temporal gyrus | |||
| 114 | YES | N.S. | N.S. | N.S. | N.S. | −53.23 | −13.15 | −34.66 | −53.88 | 31.43 | −10.79 | Left Inferior temporal gyrus | |||
| 115 | Excluded - Seizure focus | N/A | −61.75 | −12.85 | −28.48 | −55.92 | 28.41 | −7.20 | Left inferior temporal gyrus | ||||||
| 116 | Excluded - Seizure focus | N/A | −30.91 | −22.23 | −23.85 | −57.38 | 24.97 | −3.72 | Left parahippocampal gyrus | ||||||
| 117 | Excluded - Seizure focus | N/A | −41.94 | −21.60 | −24.04 | −59.07 | 21.36 | −0.29 | Left inferior temporal gyrus | ||||||
| 118 | Excluded - Seizure focus | N/A | −52.34 | −23.32 | −26.07 | −61.50 | 17.78 | 3.34 | Left Inferior temporal gyrus | ||||||
| 119 | Excluded - Seizure focus | N/A | −62.22 | −22.27 | −25.22 | −63.87 | 14.21 | 6.93 | Left inferior temporal gyrus | ||||||
| 129 | YES | N.S. | N.S. | N.S. | N.S. | −69.23 | −16.49 | −17.98 | −69.91 | −15.61 | −23.20 | Left middle temporal gyrus | |||
| 130 | YES | N.S. | N.S. | 0.1037 | N.S. | −68.45 | −13.96 | −13.69 | −68.66 | −13.33 | −17.74 | Left middle temporal gyrus | |||
| 131 | YES | N.S. | N.S. | N.S. | N.S. | −67.65 | −11.41 | −9.42 | −68.13 | −10.89 | −13.35 | Left middle temporal gyrus | |||
| 132 | YES | N.S. | N.S. | N.S. | N.S. | −66.83 | −8.83 | −5.12 | −67.97 | −8.33 | −9.36 | Left middle temporal gyrus | |||
| 133 | YES | N.S. | N.S. | N.S. | N.S. | −66.01 | −6.20 | −0.62 | −68.31 | −5.45 | −4.62 | Left middle temporal gyrus | Left superior temporal gyrus | ||
| 134 | Perception | NO | N.S. | 0.392321059 | N.S. | N.S. | −65.24 | −3.48 | 4.30 | −68.90 | −2.41 | 1.03 | Left superior temporal gyrus | ||
| 135 | YES | N.S. | 0.205796258 | N.S. | N.S. | −64.57 | −0.73 | 9.48 | −68.76 | 0.39 | 6.70 | Left postcentral gyrus | Left precentral gyrus | ||
| 136 | YES | N.S. | N.S. | N.S. | 0.1983028 | −64.02 | 2.02 | 14.72 | −67.94 | 2.82 | 12.35 | Left postcentral gyrus | Left precentral gyrus | ||
| 137 | YES | N.S. | N.S. | N.S. | N.S. | −70.55 | −20.94 | −15.57 | −70.97 | −20.07 | −20.81 | Left middle temporal gyrus | |||
| 138 | YES | N.S. | −0.123781033 | 0.20156 | N.S. | −69.73 | −18.41 | −11.28 | −70.36 | −17.67 | −15.31 | Left middle temporal gyrus | |||
| 139 | YES | N.S. | N.S. | 0.25577 | N.S. | −68.88 | −15.84 | −7.05 | −69.60 | −15.22 | −10.63 | Left middle temporal gyrus | |||
| 140 | YES | N.S. | N.S. | N.S. | N.S. | −67.99 | −13.23 | −2.79 | −69.16 | −12.67 | −6.50 | Left middle temporal gyrus | |||
| 141 | YES | N.S. | 0.213025785 | N.S. | N.S. | −67.07 | −10.58 | 1.63 | −69.38 | −9.95 | −1.92 | Left superior temporal gyrus | |||
| 142 | YES | N.S. | 0.437730403 | 0.24572 | 0.4487851 | −66.12 | −7.90 | 6.39 | −69.56 | −7.28 | 3.35 | Left superior temporal gyrus | |||
| 143 | Perception | NO | N.S. | 0.522819238 | N.S. | N.S. | −65.17 | −5.20 | 11.41 | −69.12 | −4.87 | 8.58 | Left postcentral gyrus | Left precentral gyrus | |
| 144 | Production | NO | N.S. | N.S. | N.S. | 0.5868092 | −64.36 | −2.50 | 16.53 | −68.01 | −2.67 | 13.98 | Left postcentral gyrus | Left precentral gyrus | |
| 145 | YES | N.S. | N.S. | N.S. | N.S. | −71.90 | −25.41 | −13.14 | −72.17 | −24.44 | −18.52 | Left middle temporal gyrus | |||
| 146 | YES | N.S. | N.S. | 0.11675 | N.S. | −71.05 | −22.86 | −8.83 | −71.85 | −22.09 | −13.22 | Left middle temporal gyrus | |||
| 147 | YES | N.S. | N.S. | 0.24004 | N.S. | −70.17 | −20.28 | −4.58 | −71.01 | −19.61 | −8.17 | Left middle temporal gyrus | Left superior temporal gyrus | ||
| 148 | YES | N.S. | N.S. | 0.1731 | N.S. | −69.25 | −17.64 | −0.33 | −70.14 | −17.07 | −3.50 | Left superior temporal gyrus | |||
| 149 | YES | N.S. | 0.349182075 | N.S. | 0.1443428 | −68.27 | −14.97 | 4.02 | −70.08 | −14.43 | 1.08 | Left superior temporal gyrus | |||
| 150 | YES | N.S. | 0.312134873 | N.S. | N.S. | −67.24 | −12.31 | 8.61 | −70.38 | −11.92 | 5.91 | Left superior temporal gyrus | |||
| 151 | Perception | NO | N.S. | 0.608022411 | N.S. | N.S. | −66.13 | −9.66 | 13.44 | −69.93 | −9.86 | 10.80 | Left postcentral gyrus | ||
| 152 | Production | NO | N.S. | −0.153422794 | N.S. | 0.4770204 | −65.09 | −7.02 | 18.40 | −68.74 | −8.00 | 15.84 | Left postcentral gyrus | ||
| 153 | YES | 0.137525003 | −0.125487377 | 0.09863 | N.S. | −73.25 | −29.88 | −10.70 | −74.33 | −28.82 | −16.52 | Left middle temporal gyrus | |||
| 154 | YES | N.S. | N.S. | 0.10122 | N.S. | −72.39 | −27.33 | −6.36 | −73.75 | −26.56 | −11.42 | Left middle temporal gyrus | Left superior temporal gyrus | ||
| 155 | YES | N.S. | −0.107251031 | 0.14241 | N.S. | −71.50 | −24.74 | −2.06 | −72.72 | −24.20 | −6.40 | Left superior temporal gyrus | |||
| 156 | YES | N.S. | N.S. | N.S. | N.S. | −70.59 | −22.09 | 2.23 | −71.89 | −21.66 | −1.44 | Left superior temporal gyrus | |||
| 157 | YES | N.S. | N.S. | N.S. | N.S. | −69.63 | −19.41 | 6.53 | −71.71 | −19.07 | 3.31 | Left superior temporal gyrus | |||
| 158 | YES | N.S. | N.S. | N.S. | N.S. | −68.66 | −16.75 | 11.01 | −71.77 | −16.72 | 8.04 | Left superior temporal gyrus | |||
| 159 | YES | N.S. | N.S. | N.S. | N.S. | −67.77 | −14.09 | 15.70 | −71.84 | −14.62 | 12.88 | Left superior temporal gyrus | Left postcentral gyrus | ||
| 160 | YES | N.S. | N.S. | N.S. | 0.2152216 | −67.08 | −11.43 | 20.57 | −71.19 | −12.72 | 17.92 | Left postcentral gyrus | |||
| 161 | YES | N.S. | N.S. | N.S. | N.S. | −68.74 | −42.35 | −10.99 | −69.20 | −41.42 | −18.54 | Left middle temporal gyrus | |||
| 162 | YES | N.S. | N.S. | N.S. | N.S. | −70.69 | −40.01 | −6.42 | −71.85 | −39.26 | −13.44 | Left middle temporal gyrus | |||
| 163 | YES | N.S. | N.S. | N.S. | N.S. | −72.15 | −37.50 | −1.99 | −74.09 | −36.94 | −8.49 | Left middle temporal gyrus | |||
| 164 | YES | N.S. | N.S. | N.S. | N.S. | −72.10 | −34.83 | 2.02 | −74.09 | −34.44 | −3.90 | Bank of the left superior temporal sulcus | |||
| 165 | YES | N.S. | N.S. | N.S. | N.S. | −71.72 | −32.09 | 6.34 | −74.16 | −32.02 | 0.93 | Left superior temporal gyrus | |||
| 166 | YES | N.S. | 0.149587084 | N.S. | N.S. | −71.12 | −29.25 | 10.78 | −74.28 | −29.58 | 5.94 | Left superior temporal gyrus | |||
| 167 | YES | N.S. | N.S. | N.S. | N.S. | −70.32 | −26.28 | 15.11 | −73.88 | −26.96 | 11.02 | Left superior temporal gyrus | |||
| 168 | YES | N.S. | 0.141415445 | N.S. | N.S. | −69.69 | −23.33 | 19.51 | −73.79 | −24.48 | 16.06 | Left superior temporal gyrus | Left supramarginal gyrus | ||
| 169 | YES | N.S. | N.S. | N.S. | N.S. | −67.28 | −46.72 | −8.28 | −68.09 | −46.24 | −16.69 | Left middle temporal gyrus | |||
| 170 | YES | N.S. | N.S. | N.S. | N.S. | −68.97 | −44.42 | −3.71 | −69.70 | −43.76 | −11.40 | Left middle temporal gyrus | |||
| 171 | YES | N.S. | −0.17421237 | 0.28608 | N.S. | −70.15 | −41.94 | 0.72 | −71.27 | −41.28 | −6.21 | Left middle temporal gyrus | |||
| 172 | YES | N.S. | N.S. | N.S. | N.S. | −70.35 | −39.32 | 4.95 | −71.93 | −38.94 | −1.34 | Bank of the left superior temporal sulcus | Left middle temporal gyrus | ||
| 173 | YES | N.S. | N.S. | N.S. | N.S. | −70.00 | −36.60 | 9.30 | −72.30 | −36.61 | 3.64 | Bank of the left superior temporal sulcus | Left superior temporal gyrus | ||
| 174 | YES | N.S. | N.S. | N.S. | N.S. | −69.39 | −33.78 | 13.74 | −72.73 | −34.31 | 9.00 | Left superior temporal gyrus | |||
| 175 | Excluded - Seizure focus | N/A | −68.62 | −30.85 | 18.15 | −72.38 | −31.94 | 14.30 | Left superior temporal gyrus | ||||||
| 176 | YES | N.S. | 0.115340733 | N.S. | N.S. | −68.07 | −27.93 | 22.62 | −72.23 | −29.64 | 19.33 | Left superior temporal gyrus | Left supramarginal gyrus | ||
| 177 | YES | N.S. | N.S. | N.S. | N.S. | −65.60 | −50.91 | −5.57 | −66.23 | −50.59 | −14.35 | Left middle temporal gyrus | |||
| 178 | YES | N.S. | N.S. | 0.11665 | N.S. | −67.01 | −48.67 | −1.00 | −67.47 | −47.93 | −8.90 | Left middle temporal gyrus | |||
| 179 | Excluded - Seizure focus | N/A | −67.98 | −46.25 | 3.48 | −68.39 | −45.39 | −3.49 | Left middle temporal gyrus | ||||||
| 180 | Excluded - Seizure focus | N/A | −68.34 | −43.71 | 7.88 | −69.65 | −43.31 | 1.62 | Bank of the left superior temporal sulcus | ||||||
| 181 | YES | N.S. | N.S. | N.S. | N.S. | −68.20 | −41.05 | 12.31 | −70.07 | −41.21 | 6.72 | Bank of the left superior temporal sulcus | Left middle temporal gyrus | ||
| 182 | Excluded - Seizure focus | N/A | −67.73 | −38.28 | 16.79 | −70.89 | −39.04 | 12.34 | Left superior temporal gyrus | ||||||
| 183 | Excluded - Seizure focus | N/A | −67.11 | −35.42 | 21.29 | −71.18 | −36.90 | 17.76 | Left superior temporal gyrus | Left supramarginal gyrus | |||||
| 184 | Excluded - Seizure focus | N/A | −66.65 | −32.53 | 25.83 | −71.34 | −34.75 | 22.77 | Left supramarginal gyrus | ||||||
| 185 | Excluded - Seizure focus | N/A | −63.55 | −54.82 | −2.85 | −64.59 | −54.74 | −11.39 | Left middle temporal gyrus | ||||||
| 186 | Excluded - Seizure focus | N/A | −64.79 | −52.67 | 1.75 | −65.36 | −51.77 | −5.59 | Left middle temporal gyrus | ||||||
| 187 | YES | N.S. | N.S. | N.S. | N.S. | −65.70 | −50.37 | 6.29 | −66.34 | −49.23 | 0.26 | Left middle temporal gyrus | |||
| 188 | YES | N.S. | N.S. | N.S. | N.S. | −66.23 | −47.94 | 10.81 | −67.52 | −47.36 | 5.31 | Left middle temporal gyrus | |||
| 189 | YES | N.S. | N.S. | N.S. | N.S. | −66.38 | −45.38 | 15.33 | −68.88 | −45.54 | 10.40 | Bank of the left superior temporal sulcus | |||
| 190 | Excluded - Seizure focus | N/A | −66.26 | −42.71 | 19.89 | −69.95 | −43.54 | 15.88 | Left superior temporal gyrus | ||||||
| 191 | Excluded - Seizure focus | N/A | −65.94 | −39.93 | 24.47 | −70.65 | −41.54 | 21.15 | Left supramarginal gyrus | ||||||
| 192 | Excluded - Seizure focus | N/A | −65.59 | −37.08 | 29.07 | −70.90 | −39.39 | 26.13 | Left supramarginal gyrus | ||||||
| 193 | Excluded - Seizure focus | N/A | −60.97 | −58.38 | −0.16 | −63.27 | −59.01 | −8.31 | Left middle temporal gyrus | ||||||
| 194 | Excluded - Seizure focus | N/A | −62.24 | −56.39 | 4.49 | −63.57 | −55.66 | −2.08 | Left middle temporal gyrus | ||||||
| 195 | Excluded - Seizure focus | N/A | −63.25 | −54.26 | 9.11 | −64.29 | −52.79 | 4.05 | Left middle temporal gyrus | ||||||
| 196 | Excluded - Seizure focus | N/A | −64.01 | −52.00 | 13.72 | −66.11 | −51.24 | 8.94 | Left middle temporal gyrus | ||||||
| 197 | YES | −0.155973803 | N.S. | N.S. | N.S. | −64.53 | −49.57 | 18.33 | −67.68 | −49.65 | 13.95 | Bank of the left superior temporal sulcus | Left superior temporal gyrus | ||
| 198 | YES | N.S. | N.S. | N.S. | N.S. | −64.87 | −46.99 | 22.96 | −68.48 | −47.75 | 19.34 | Left superior temporal gyrus | |||
| 199 | YES | N.S. | N.S. | N.S. | N.S. | −65.13 | −44.31 | 27.61 | −69.33 | −45.84 | 24.44 | Left supramarginal gyrus | |||
| 200 | YES | N.S. | N.S. | N.S. | −0.147215 | −65.27 | −41.53 | 32.24 | −70.19 | −43.73 | 29.42 | Left supramarginal gyrus | |||
| 201 | YES | N.S. | N.S. | N.S. | N.S. | −58.10 | −61.72 | 2.51 | −61.75 | −63.26 | −5.28 | Left middle temporal gyrus | |||
| 202 | YES | −0.158471267 | 0.095273408 | N.S. | N.S. | −59.43 | −59.89 | 7.22 | −61.95 | −59.87 | 1.02 | Left middle temporal gyrus | |||
| 203 | YES | N.S. | N.S. | N.S. | N.S. | −60.62 | −57.98 | 11.92 | −63.14 | −57.24 | 6.96 | Left middle temporal gyrus | |||
| 204 | YES | N.S. | N.S. | N.S. | N.S. | −61.63 | −55.90 | 16.62 | −64.91 | −55.53 | 12.24 | Left middle temporal gyrus | Left superior temporal gyrus | ||
| 205 | YES | N.S. | N.S. | N.S. | N.S. | −62.46 | −53.59 | 21.29 | −66.23 | −53.84 | 17.50 | Left superior temporal gyrus | |||
| 206 | YES | N.S. | N.S. | N.S. | N.S. | −63.19 | −51.09 | 25.96 | −67.35 | −52.11 | 22.74 | Left superior temporal gyrus | |||
| 207 | YES | N.S. | −0.110612424 | N.S. | N.S. | −63.92 | −48.46 | 30.64 | −68.34 | −50.17 | 27.73 | Left supramarginal gyrus | |||
| 208 | YES | N.S. | −0.136739472 | N.S. | N.S. | −64.55 | −45.75 | 35.30 | −69.59 | −48.07 | 32.68 | Left supramarginal gyrus | |||
| 209 | YES | N.S. | N.S. | N.S. | N.S. | −55.10 | −64.94 | 5.18 | −59.60 | −67.32 | −2.38 | Left middle temporal gyrus | |||
| 210 | YES | N.S. | N.S. | N.S. | N.S. | −56.50 | −63.27 | 9.94 | −60.74 | −64.77 | 3.70 | Left middle temporal gyrus | |||
| 211 | YES | N.S. | N.S. | N.S. | N.S. | −57.87 | −61.58 | 14.72 | −62.15 | −62.21 | 9.65 | Left middle temporal gyrus | |||
| 212 | YES | N.S. | N.S. | N.S. | N.S. | −59.08 | −59.67 | 19.48 | −63.72 | −60.21 | 15.47 | Left supramarginal gyrus | Left superior temporal gyrus | ||
| 213 | YES | N.S. | N.S. | N.S. | −0.141312 | −60.08 | −57.44 | 24.20 | −64.77 | −58.31 | 20.87 | Left supramarginal gyrus | Left superior temporal gyrus | ||
| 214 | YES | N.S. | N.S. | N.S. | N.S. | −60.93 | −54.95 | 28.87 | −65.72 | −56.41 | 25.99 | Left supramarginal gyrus | Left superior temporal gyrus | ||
| 215 | YES | N.S. | N.S. | N.S. | N.S. | −61.67 | −52.31 | 33.54 | −66.80 | −54.41 | 30.97 | Left supramarginal gyrus | Left inferior parietal lobule | ||
| 216 | YES | N.S. | −0.19565944 | N.S. | N.S. | −62.19 | −49.57 | 38.19 | −67.68 | −52.18 | 35.82 | Left supramarginal gyrus | |||
| 217 | Excluded - Seizure focus | N/A | −52.14 | −68.18 | 7.86 | −56.30 | −70.57 | 0.02 | Left lateral occipital cortex | ||||||
| 218 | Excluded - Seizure focus | N/A | −53.61 | −66.63 | 12.67 | −58.58 | −68.87 | 5.94 | Left middle temporal gyrus | ||||||
| 219 | YES | N.S. | N.S. | N.S. | N.S. | −55.08 | −65.08 | 17.50 | −60.41 | −66.63 | 12.05 | Left inferior parietal lobule | Left middle temporal gyrus | ||
| 220 | YES | N.S. | N.S. | N.S. | N.S. | −56.40 | −63.31 | 22.32 | −61.94 | −64.74 | 18.04 | Left supramarginal gyrus | Left middle temporal gyrus | ||
| 221 | YES | N.S. | N.S. | N.S. | N.S. | −57.44 | −61.10 | 27.04 | −62.70 | −62.68 | 23.56 | Left supramarginal gyrus | Left inferior parietal lobule | ||
| 222 | YES | N.S. | N.S. | N.S. | N.S. | −58.27 | −58.61 | 31.73 | −63.50 | −60.61 | 28.89 | Left supramarginal gyrus | Left inferior parietal lobule | ||
| 223 | YES | N.S. | N.S. | N.S. | N.S. | −58.88 | −55.96 | 36.39 | −64.34 | −58.48 | 34.01 | Left inferior parietal lobule | |||
| 224 | YES | −0.08661985 | 0.06167594 | 0.05387 | 0.0843445 | −59.28 | −53.21 | 41.04 | −64.94 | −56.18 | 38.79 | Left supramarginal gyrus | Left inferior parietal lobule | ||
| 225 | YES | N.S. | N.S. | N.S. | −0.191236 | −50.33 | −46.07 | 57.04 | −56.19 | −51.26 | 53.62 | Left supramarginal gyrus | Left inferior parietal lobule | ||
| 226 | YES | N.S. | N.S. | N.S. | N.S. | −52.69 | −36.18 | 54.03 | −59.55 | −40.41 | 53.23 | Left supramarginal gyrus | |||
| 227 | YES | N.S. | N.S. | N.S. | N.S. | −54.98 | −25.64 | 50.33 | −61.24 | −28.18 | 50.38 | Left supramarginal gyrus | |||
| 228 | YES | N.S. | −0.112604223 | N.S. | N.S. | −57.68 | −15.58 | 46.68 | −63.98 | −17.49 | 46.40 | Left postcentral gyrus | |||
| 229 | Production | NO | N.S. | −0.207951847 | N.S. | 0.2739099 | −59.38 | −6.01 | 42.53 | −64.70 | −8.16 | 41.73 | Left postcentral gyrus | ||
| 230 | YES | N.S. | N.S. | N.S. | N.S. | −58.31 | 3.13 | 37.71 | −62.32 | 1.58 | 37.15 | Left precentral gyrus | |||
| 231 | YES | 0.193135157 | N.S. | N.S. | N.S. | −56.09 | 12.02 | 32.79 | −58.57 | 12.55 | 33.65 | Left precentral gyrus | |||
| 232 | YES | N.S. | −0.351506755 | 0.11044 | −0.218381 | −53.57 | 20.66 | 28.20 | −55.63 | 20.96 | 29.00 | Left pars opercularis | |||
| 233 | YES | N.S. | N.S. | N.S. | N.S. | −44.47 | −43.79 | 63.23 | −51.25 | −49.96 | 58.95 | Left supramarginal gyrus | Left inferior parietal lobule | ||
| 234 | YES | N.S. | N.S. | N.S. | N.S. | −47.06 | −33.80 | 61.48 | −53.39 | −38.55 | 60.16 | Left supramarginal gyrus | |||
| 235 | YES | N.S. | N.S. | N.S. | N.S. | −49.38 | −22.82 | 58.93 | −53.95 | −24.11 | 60.30 | Left postcentral gyrus | |||
| 236 | YES | N.S. | −0.138208913 | −0.14485 | N.S. | −51.42 | −12.45 | 55.44 | −55.49 | −12.41 | 56.45 | Left postcentral gyrus | Left precentral gyrus | ||
| 237 | YES | N.S. | −0.147250548 | −0.20659 | −0.17116 | −52.42 | −3.02 | 51.00 | −56.57 | −3.97 | 51.07 | Left precentral gyrus | |||
| 238 | YES | N.S. | −0.183942603 | N.S. | N.S. | −51.81 | 5.96 | 45.95 | −54.58 | 6.38 | 46.67 | Left precentral gyrus | |||
| 239 | YES | N.S. | N.S. | N.S. | N.S. | −50.44 | 14.71 | 40.87 | −52.69 | 15.62 | 41.89 | Left caudal middle frontal gyrus | |||
| 240 | YES | N.S. | −0.155540289 | N.S. | −0.135277 | −49.11 | 22.98 | 36.31 | −52.51 | 24.04 | 37.33 | Left rostral middle frontal gyrus | Left caudal middle frontal gyrus | ||
| 241 | YES | N.S. | N.S. | N.S. | N.S. | −37.65 | −40.41 | 68.82 | −44.90 | −47.09 | 65.13 | Left supramarginal gyrus | Left superior parietal lobule | ||
| 242 | YES | N.S. | N.S. | N.S. | N.S. | −40.63 | −30.74 | 68.68 | −46.18 | −35.78 | 67.80 | Left postcentral gyrus | |||
| 243 | YES | 0.131789619 | N.S. | N.S. | N.S. | −43.06 | −19.27 | 67.64 | −46.81 | −21.19 | 69.06 | Left postcentral gyrus | Left precentral gyrus | ||
| 244 | Production | NO | 0.19358143 | −0.140244608 | −0.11378 | 0.4502113 | −44.36 | −9.02 | 64.28 | −47.36 | −9.51 | 65.63 | Left precentral gyrus | ||
| 245 | YES | 0.176286436 | −0.169108276 | 0.14281 | N.S. | −44.59 | −0.20 | 59.46 | −47.33 | −0.05 | 61.02 | Left caudal middle frontal gyrus | |||
| 246 | YES | N.S. | N.S. | 0.18695 | N.S. | −44.11 | 8.41 | 54.23 | −47.07 | 9.19 | 56.63 | Left caudal middle frontal gyrus | |||
| 247 | YES | N.S. | N.S. | 0.14006 | N.S. | −43.25 | 17.26 | 49.01 | −46.33 | 18.46 | 50.72 | Left caudal middle frontal gyrus | |||
| 248 | Planning | NO | N.S. | −0.342254315 | 0.20873 | N.S. | −42.04 | 26.55 | 44.12 | −46.24 | 28.59 | 45.79 | Left caudal middle frontal gyrus | ||
| 249 | YES | N.S. | N.S. | N.S. | N.S. | −28.41 | −33.81 | 74.43 | −34.66 | −40.44 | 74.14 | Left postcentral gyrus | Left superior parietal lobule | ||
| 250 | YES | N.S. | N.S. | N.S. | N.S. | −32.78 | −26.62 | 75.71 | −37.61 | −31.67 | 75.79 | Left postcentral gyrus | |||
| 251 | YES | N.S. | N.S. | N.S. | N.S. | −35.22 | −15.26 | 75.94 | −38.74 | −18.65 | 76.83 | Left precentral gyrus | |||
| 252 | YES | 0.173277009 | N.S. | N.S. | −0.171999 | −36.15 | −5.91 | 72.47 | −39.35 | −8.66 | 73.78 | Left precentral gyrus | |||
| 253 | YES | N.S. | 0.347646325 | 0.18108 | N.S. | −36.19 | 2.35 | 67.59 | −38.65 | 0.70 | 70.06 | Left caudal middle frontal gyrus | Left superior frontal gyrus | ||
| 254 | YES | 0.249849017 | N.S. | 0.1504 | N.S. | −35.83 | 10.58 | 62.61 | −37.71 | 9.95 | 66.97 | Left caudal middle frontal gyrus | Left superior frontal gyrus | ||
| 255 | YES | N.S. | N.S. | N.S. | N.S. | −35.32 | 18.95 | 57.79 | −37.83 | 19.13 | 61.64 | Left caudal middle frontal gyrus | |||
| 256 | YES | N.S. | −0.211392421 | 0.18779 | N.S. | −34.49 | 27.22 | 53.22 | −37.94 | 28.63 | 56.60 | Left caudal middle frontal gyrus | Left superior frontal gyrus | ||
| 477L Chronic | 1 | Production | NO | 0.250784621 | −0.185148907 | N.S. | 0.5861435 | −32.02 | −10.14 | −47.44 | −34.07 | −8.45 | −46.01 | Left Inferior temporal gyrus | |
| 2 | YES | N.S. | N.S. | N.S. | N.S. | −41.78 | −15.03 | −45.36 | −44.17 | −12.87 | −44.91 | Left inferior temporal gyrus | |||
| 3 | YES | N.S. | N.S. | N.S. | N.S. | −51.70 | −17.99 | −39.53 | −52.78 | −17.18 | −38.23 | Left Inferior temporal gyrus | |||
| 4 | Production | NO | 0.192196317 | −0.213378598 | N.S. | 0.5117164 | −59.31 | −21.42 | −34.79 | −59.61 | −21.91 | −33.89 | Left inferior temporal gyrus | ||
| 9 | NO | 0.484883826 | −0.629336107 | N.S. | N.S. | 0.14 | −72.02 | −7.00 | −1.47 | −76.74 | −6.09 | Left lingual gyrus | |||
| 10 | NO | 0.390912908 | −0.50682255 | N.S. | N.S. | −5.87 | −76.21 | −19.21 | −7.00 | −80.59 | −18.06 | Left lingual gyrus | |||
| 11 | NO | 0.420299074 | −0.560083719 | N.S. | N.S. | −14.56 | −81.86 | −24.56 | −15.34 | −85.30 | −21.39 | Left lingual gyrus | |||
| 12 | YES | 0.299435208 | −0.191865191 | 0.12348 | −0.253442 | −23.37 | −87.97 | −24.68 | −24.31 | −89.53 | −22.98 | Left lateral occipital cortex | |||
| 13 | YES | N.S. | N.S. | N.S. | N.S. | −26.18 | −41.64 | −22.53 | −23.51 | −43.02 | −20.83 | Left fusiform gyrus | |||
| 14 | YES | N.S. | N.S. | N.S. | −0.322284 | −36.57 | −38.55 | −27.99 | −35.35 | −40.30 | −26.47 | Left fusiform gyrus | |||
| 15 | Perception | NO | N.S. | 0.358448236 | N.S. | −0.178556 | −46.03 | −37.28 | −31.47 | −46.33 | −38.10 | −29.78 | Left fusiform gyrus | Left inferior temporal gyrus | |
| 16 | YES | N.S. | N.S. | N.S. | N.S. | −54.89 | −35.82 | −32.59 | −55.37 | −36.13 | −31.36 | Left inferior temporal gyrus | |||
| 41 | YES | N.S. | N.S. | N.S. | N.S. | −20.61 | −55.67 | −17.28 | −18.31 | −58.87 | −16.34 | Left lingual gyrus | |||
| 42 | YES | N.S. | −0.368949606 | −0.11748 | N.S. | −30.92 | −58.86 | −21.30 | −28.26 | −62.94 | −20.07 | Left fusiform gyrus | |||
| 43 | YES | N.S. | −0.309745509 | N.S. | N.S. | −40.07 | −63.79 | −22.64 | −39.05 | −67.14 | −21.84 | Left fusiform gyrus | |||
| 44 | YES | 0.556917684 | −0.506005045 | N.S. | −0.505072 | −48.97 | −66.83 | −19.88 | −48.35 | −68.15 | −18.74 | Left fusiform gyrus | |||
| 97 | YES | N.S. | N.S. | N.S. | N.S. | −42.32 | 47.25 | 21.28 | −42.37 | 50.36 | 19.04 | Left rostral middle frontal gyrus | |||
| 98 | YES | N.S. | N.S. | 0.2458 | N.S. | −47.03 | 37.42 | 26.51 | −46.59 | 41.07 | 24.57 | Left rostral middle frontal gyrus | |||
| 99 | Planning-Production | NO | N.S. | N.S. | 0.51527 | 0.2413405 | −51.23 | 27.57 | 31.29 | −50.84 | 31.36 | 30.27 | Left rostral middle frontal gyrus | Left caudal middle frontal gyrus | |
| 100 | Planning | NO | N.S. | −0.264541483 | 0.29671 | N.S. | −53.11 | 17.39 | 34.06 | −52.24 | 21.06 | 34.46 | Left pars opercularis | Left caudal middle frontal gyrus | |
| 101 | Planning | NO | N.S. | −0.192696698 | 0.46695 | N.S. | −54.22 | 7.33 | 36.57 | −54.39 | 12.08 | 36.78 | Left pars opercularis | ||
| 102 | Planning-Production | NO | 0.430315217 | N.S. | 0.37904 | 0.4173668 | −55.74 | −2.37 | 40.52 | −56.57 | 2.84 | 42.44 | Left precentral gyrus | ||
| 103 | Planning | NO | 0.634872202 | N.S. | 0.33053 | N.S. | −57.40 | −11.86 | 44.38 | −57.53 | −8.40 | 47.20 | Left precentral gyrus | ||
| 104 | YES | N.S. | N.S. | N.S. | N.S. | −59.59 | −21.01 | 46.61 | −59.94 | −18.35 | 49.00 | Left postcentral gyrus | |||
| 105 | Planning-Production | NO | 0.326693518 | −0.311377292 | 0.20608 | 0.4306377 | −60.84 | −30.87 | 47.91 | −62.69 | −27.42 | 51.15 | Left supramarginal gyrus | ||
| 106 | Planning-Production | NO | N.S. | N.S. | 0.26215 | 0.3723763 | −59.30 | −42.66 | 48.50 | −60.25 | −39.56 | 51.23 | Left supramarginal gyrus | ||
| 129 | YES | 0.362128673 | −0.158611686 | N.S. | −0.174346 | −21.13 | −108.87 | 9.17 | −21.86 | −108.73 | 10.89 | Left cerebral white matter | Left lateral occipital cortex | ||
| 130 | NO | N.S. | N.S. | N.S. | −0.50015 | −30.68 | −102.39 | 6.94 | −31.01 | −102.05 | 8.44 | Left lateral occipital cortex | |||
| 131 | Excluded - Seizure focus | N/A | −39.42 | −95.63 | 4.28 | −39.33 | −95.70 | 6.25 | Left lateral occipital cortex | ||||||
| 132 | Perception | NO | 0.282296045 | 0.20794382 | N.S. | −0.375022 | −46.89 | −88.46 | 2.30 | −47.83 | −89.24 | 4.59 | Left lateral occipital cortex | ||
| 133 | YES | N.S. | N.S. | N.S. | N.S. | −53.38 | −80.35 | 0.62 | −55.38 | −80.94 | 2.19 | Left lateral occipital cortex | |||
| 134 | Perception | NO | N.S. | 0.580043992 | N.S. | N.S. | −58.67 | −71.14 | −0.56 | −60.59 | −70.46 | 0.80 | Left middle temporal gyrus | Left inferior temporal gyrus | |
| 135 | YES | N.S. | 0.207679782 | 0.20393 | N.S. | −62.79 | −60.97 | −1.90 | −65.80 | −60.46 | −1.52 | Left middle temporal gyrus | |||
| 136 | YES | N.S. | N.S. | N.S. | N.S. | −66.33 | −50.12 | −3.41 | −68.64 | −49.92 | −2.07 | Left middle temporal gyrus | |||
| 137 | YES | 0.398540472 | −0.22023389 | N.S. | −0.2324 | −21.57 | −106.53 | 16.06 | −22.25 | −106.63 | 17.89 | Left cerebral white matter | Left lateral occipital cortex | ||
| 138 | Perception | NO | −0.289678029 | 0.601936213 | N.S. | N.S. | −31.35 | −100.06 | 15.65 | −32.05 | −100.78 | 17.71 | Left lateral occipital cortex | ||
| 139 | YES | 0.412649848 | −0.343000963 | N.S. | −0.346572 | −40.13 | −93.07 | 14.86 | −40.65 | −94.80 | 17.60 | Left Inferior parietal lobule | |||
| 140 | YES | 0.231084149 | −0.309147965 | N.S. | −0.262653 | −47.62 | −86.27 | 13.91 | −47.70 | −87.34 | 16.60 | Left inferior parietal lobule | |||
| 141 | YES | N.S. | N.S. | −0.1891 | N.S. | −54.39 | −78.70 | 12.87 | −55.38 | −79.20 | 15.35 | Left lateral occipital cortex | |||
| 142 | Perception | NO | −0.270866836 | 0.412288465 | N.S. | N.S. | −60.31 | −69.91 | 11.93 | −63.33 | −69.78 | 14.10 | Left middle temporal gyrus | Left inferior parietal lobule | |
| 143 | YES | −0.167684183 | 0.206101397 | N.S. | N.S. | −64.85 | −59.90 | 10.75 | −67.55 | −59.24 | 12.44 | Left middle temporal gyrus | |||
| 144 | Perception | NO | 0.221536403 | 0.393187376 | N.S. | N.S. | −67.92 | −49.17 | 8.97 | −70.62 | −48.39 | 11.52 | Left superior temporal gyrus | ||
| 145 | YES | N.S. | N.S. | −0.02561 | N.S. | −20.61 | −103.44 | 23.31 | −21.15 | −103.89 | 25.19 | Left lateral occipital cortex | |||
| 146 | YES | N.S. | −0.121312545 | −0.09938 | N.S. | −30.57 | −97.43 | 25.16 | −30.88 | −98.65 | 27.39 | Left lateral occipital cortex | |||
| 147 | YES | 0.225848462 | −0.222320852 | N.S. | N.S. | −39.12 | −90.92 | 26.41 | −38.83 | −92.56 | 28.89 | Left Inferior parietal lobule | |||
| 148 | YES | N.S. | N.S. | N.S. | −0.243976 | −46.84 | −84.18 | 26.48 | −46.28 | −85.27 | 28.73 | Left inferior parietal lobule | |||
| 149 | YES | N.S. | N.S. | 0.26223 | N.S. | −53.93 | −76.89 | 25.72 | −54.37 | −77.07 | 27.84 | Left inferior parietal lobule | |||
| 150 | YES | N.S. | N.S. | N.S. | 0.1765627 | −60.41 | −68.47 | 24.77 | −63.51 | −68.28 | 26.92 | Left inferior parietal lobule | |||
| 151 | YES | N.S. | 0.130518643 | N.S. | N.S. | −65.76 | −58.70 | 23.68 | −68.48 | −58.69 | 26.09 | Left supramarginal gyrus | |||
| 152 | YES | N.S. | N.S. | N.S. | 0.2066385 | −68.21 | −47.98 | 21.46 | −69.83 | −47.02 | 24.44 | Left supramarginal gyrus | |||
| 153 | NO | 0.422759481 | −0.665496903 | N.S. | N.S. | −17.32 | −98.69 | 33.59 | −17.41 | −99.74 | 35.33 | Left lateral occipital cortex | |||
| 154 | Excluded - Seizure focus | N/A | −26.81 | −94.66 | 36.87 | −26.70 | −95.78 | 38.89 | Left superior parietal lobule | ||||||
| 155 | YES | 0.155334661 | N.S. | N.S. | N.S. | −36.15 | −88.63 | 38.56 | −35.97 | −89.78 | 41.07 | Left inferior parietal lobule | |||
| 156 | YES | N.S. | 0.145119769 | N.S. | N.S. | −44.49 | −81.89 | 39.08 | −44.94 | −82.51 | 41.09 | Left inferior parietal lobule | |||
| 157 | YES | N.S. | 0.155112344 | N.S. | N.S. | −51.74 | −74.71 | 38.17 | −53.67 | −75.12 | 39.97 | Left inferior parietal lobule | |||
| 158 | YES | N.S. | N.S. | N.S. | N.S. | −58.01 | −66.51 | 36.83 | −60.52 | −65.83 | 38.65 | Left supramarginal gyrus | Left inferior parietal lobule | ||
| 159 | YES | N.S. | N.S. | N.S. | 0.1934886 | −62.99 | −56.72 | 35.38 | −65.38 | −56.19 | 38.04 | Left supramarginal gyrus | Left Inferior parietal lobule | ||
| 160 | Production | NO | −0.211418842 | N.S. | −0.1671 | 0.205268 | −66.12 | −46.18 | 33.25 | −67.55 | −45.02 | 36.55 | Left supramarginal gyrus | ||
| 161 | Excluded - Seizure focus | N/A | −33.02 | −81.57 | 45.32 | −33.30 | −82.75 | 48.56 | Left inferior parietal lobule | ||||||
| 162 | Excluded - Seizure focus | N/A | −37.64 | −73.08 | 51.46 | −39.51 | −71.85 | 53.00 | Left inferior parietal lobule | ||||||
| 163 | YES | N.S. | N.S. | N.S. | N.S. | −42.29 | −63.68 | 56.63 | −45.28 | −62.03 | 56.76 | Left inferior parietal lobule | |||
| 164 | YES | N.S. | N.S. | 0.18591 | N.S. | −45.72 | −53.02 | 60.44 | −48.82 | −50.50 | 60.91 | Left inferior parietal lobule | Left superior parietal lobule | ||
| 165 | YES | N.S. | N.S. | 0.15576 | 0.2083636 | −47.76 | −42.62 | 61.62 | −49.55 | −39.48 | 62.76 | Left postcentral gyrus | |||
| 166 | YES | −0.286641893 | N.S. | 0.17842 | 0.4369122 | −49.54 | −31.27 | 60.10 | −50.86 | −29.20 | 61.56 | Left postcentral gyrus | |||
| 167 | YES | N.S. | N.S. | 0.1214 | 0.1490372 | −50.52 | −20.40 | 56.93 | −50.40 | −19.36 | 58.94 | Left postcentral gyrus | |||
| 168 | Production | NO | 0.326546674 | N.S. | N.S. | 0.8042652 | −50.98 | −10.23 | 53.64 | −51.78 | −9.70 | 56.63 | Left postcentral gyrus | Left precentral gyrus | |
| 169 | Excluded - Seizure focus | N/A | −26.45 | −79.69 | 55.14 | −27.65 | −79.30 | 57.77 | Left superior parietal lobule | ||||||
| 170 | YES | N.S. | N.S. | 0.20875 | 0.2170109 | −30.24 | −71.46 | 59.08 | −32.28 | −70.15 | 61.16 | Left superior parietal lobule | |||
| 171 | YES | N.S. | N.S. | N.S. | 0.1899193 | −33.99 | −61.77 | 63.75 | −37.01 | −60.62 | 64.13 | Left superior parietal lobule | |||
| 172 | YES | N.S. | N.S. | N.S. | N.S. | −38.00 | −50.25 | 67.95 | −40.31 | −47.56 | 68.38 | Left superior parietal lobule | |||
| 173 | YES | −0.173433129 | N.S. | 0.1086 | 0.436405 | −40.28 | −39.73 | 69.00 | −40.81 | −36.93 | 69.82 | Left postcentral gyrus | |||
| 174 | YES | −0.157188337 | N.S. | N.S. | 0.3799243 | −42.02 | −28.66 | 67.40 | −42.01 | −26.17 | 69.46 | Left postcentral gyrus | |||
| 175 | YES | N.S. | N.S. | 0.20203 | 0.2065716 | −42.71 | −18.48 | 63.84 | −41.28 | −16.40 | 65.35 | Left precentral gyrus | |||
| 176 | YES | N.S. | N.S. | N.S. | 0.3066738 | −43.24 | −8.53 | 60.34 | −42.91 | −6.13 | 62.23 | Left precentral gyrus | |||
| 177 | Excluded - Seizure focus | N/A | −18.81 | −77.69 | 55.39 | −20.19 | −77.99 | 57.46 | Left superior parietal lobule | ||||||
| 178 | Excluded - Seizure focus | N/A | −22.04 | −70.06 | 61.01 | −23.01 | −68.50 | 63.70 | Left superior parietal lobule | ||||||
| 179 | Production | NO | N.S. | N.S. | N.S. | 0.4920054 | −23.98 | −61.01 | 67.19 | −24.81 | −59.54 | 68.58 | Left superior parietal lobule | ||
| 180 | YES | N.S. | N.S. | N.S. | 0.2789078 | −27.81 | −50.11 | 72.42 | −27.90 | −49.04 | 72.03 | Left superior parietal lobule | |||
| 181 | YES | N.S. | N.S. | N.S. | N.S. | −30.65 | −38.93 | 74.20 | −29.98 | −38.18 | 74.77 | Left superior parietal lobule | |||
| 182 | Production | NO | N.S. | N.S. | N.S. | 0.5686038 | −32.37 | −27.70 | 72.76 | −32.11 | −26.45 | 73.91 | Left postcentral gyrus | ||
| 183 | Planning-Production | NO | N.S. | N.S. | 0.24375 | 0.5663252 | −33.39 | −17.54 | 69.75 | −32.87 | −14.73 | 70.67 | Left postcentral gyrus | ||
| 184 | Planning-Production | NO | N.S. | N.S. | 0.14376 | 0.3828541 | −33.89 | −8.42 | 66.88 | −32.32 | −3.76 | 67.35 | Left caudal middle frontal gyrus | ||
| 185 | Excluded - Seizure focus | N/A | −10.09 | −75.08 | 53.14 | −10.48 | −77.68 | 53.44 | Left superior parietal lobule | ||||||
| 186 | Excluded - Seizure focus | N/A | −12.75 | −67.51 | 60.49 | −12.19 | −66.42 | 62.78 | Left superior parietal lobule | ||||||
| 187 | YES | N.S. | N.S. | −0.13232 | N.S. | −15.00 | −59.16 | 68.27 | −14.94 | −58.95 | 69.59 | Left superior parietal lobule | |||
| 188 | YES | N.S. | N.S. | N.S. | N.S. | −17.87 | −49.43 | 74.52 | −17.63 | −49.35 | 74.81 | Left superior parietal lobule | |||
| 189 | YES | N.S. | 0.190913917 | N.S. | N.S. | −20.41 | −38.64 | 77.41 | −18.86 | −38.42 | 77.14 | Left superior parietal lobule | |||
| 190 | YES | N.S. | N.S. | N.S. | 0.2756657 | −22.30 | −26.70 | 76.39 | −21.36 | −27.12 | 76.29 | Left postcentral gyrus | |||
| 191 | Planning-Production | NO | N.S. | N.S. | 0.15417 | 0.5477178 | −23.67 | −15.68 | 74.15 | −22.65 | −11.79 | 74.05 | Left precentral gyrus | ||
| 192 | YES | N.S. | 0.116525491 | N.S. | N.S. | −24.62 | −5.14 | 71.68 | −21.91 | −1.55 | 70.71 | Left superior frontal gyrus | |||
| 193 | YES | N.S. | N.S. | N.S. | 0.2251305 | −48.52 | 49.54 | −3.04 | −49.31 | 48.37 | −5.50 | Left pars triangularis | Left pars orbitalis | ||
| 194 | Planning-Production | NO | N.S. | −0.356131656 | 0.37344 | 0.3076047 | −50.90 | 40.27 | 1.10 | −52.18 | 40.01 | −3.32 | Left pars triangularis | ||
| 195 | YES | N.S. | N.S. | N.S. | N.S. | −53.53 | 31.02 | 5.20 | −55.69 | 33.34 | 1.11 | Left pars triangularis | |||
| 196 | YES | N.S. | N.S. | −0.13817 | N.S. | −56.46 | 21.53 | 9.15 | −57.10 | 25.14 | 7.45 | Left pars opercularis | |||
| 197 | Perception-Planning | NO | 0.237520638 | 0.244929423 | 0.18556 | N.S. | −59.47 | 11.93 | 13.07 | −60.53 | 14.16 | 12.09 | Left pars opercularis | ||
| 198 | Production | NO | N.S. | −0.249380075 | N.S. | 0.3943139 | −62.36 | 2.23 | 17.11 | −64.27 | 3.78 | 16.64 | Left precentral gyrus | ||
| 199 | Planning-Production | NO | 0.292747754 | −0.350743936 | 0.19146 | 0.5363179 | −64.69 | −7.37 | 21.55 | −67.36 | −5.63 | 20.77 | Left postcentral gyrus | ||
| 200 | YES | N.S. | N.S. | N.S. | N.S. | −66.27 | −16.63 | 26.68 | −67.49 | −13.14 | 27.20 | Left postcentral gyrus | |||
| 201 | YES | −0.276541896 | N.S. | N.S. | 0.2300405 | −66.82 | −26.87 | 31.80 | −69.27 | −23.14 | 34.39 | Left postcentral gyrus | |||
| 202 | Production | NO | N.S. | −0.141298012 | −0.22988 | 0.1789325 | −65.46 | −39.88 | 36.33 | −66.69 | −37.50 | 40.00 | Left supramarginal gyrus | ||
| 203 | YES | N.S. | N.S. | 0.10268 | 0.172734 | −48.44 | 18.70 | −21.00 | −48.42 | 20.94 | −22.08 | Left superior temporal gyrus | |||
| 204 | YES | N.S. | 0.322106128 | N.S. | N.S. | −53.68 | 10.87 | −15.38 | −53.73 | 12.62 | −16.60 | Left superior temporal gyrus | |||
| 205 | Excluded - Seizure focus | N/A | −58.36 | 3.56 | −9.69 | −59.11 | 4.33 | −11.25 | Left superior temporal gyrus | ||||||
| 206 | Excluded - Seizure focus | N/A | −61.41 | −3.31 | −3.77 | −62.45 | −2.12 | −4.03 | Left superior temporal gyrus | ||||||
| 207 | Excluded - Seizure focus | N/A | −66.37 | −11.93 | 3.13 | −69.42 | −10.89 | 2.53 | Left superior temporal gyrus | ||||||
| 208 | Perception-Planning | NO | 0.167387669 | 0.914867258 | N.S. | 0.2850466 | −68.42 | −20.47 | 7.91 | −71.88 | −19.42 | 7.36 | Left superior temporal gyrus | ||
| 209 | YES | N.S. | 0.326878501 | N.S. | N.S. | −69.04 | −29.70 | 10.95 | −71.39 | −28.00 | 13.12 | Left superior temporal gyrus | |||
| 210 | Perception-Planning | NO | N.S. | 0.235113453 | N.S. | 0.4693901 | −69.25 | −40.69 | 12.40 | −71.65 | −39.22 | 15.81 | Left superior temporal gyrus | ||
| 211 | YES | N.S. | N.S. | −0.25645 | N.S. | −66.25 | −11.92 | −19.79 | −67.49 | −13.58 | −19.52 | Left middle temporal gyrus | |||
| 212 | YES | N.S. | N.S. | N.S. | N.S. | −66.72 | −19.40 | −15.74 | −71.08 | −19.74 | −14.61 | Left middle temporal gyrus | |||
| 213 | YES | N.S. | N.S. | 0.16958 | N.S. | −70.22 | −28.22 | −9.98 | −71.94 | −27.05 | −7.51 | Left superior temporal gyrus | Left middle temporal gyrus | ||
| 214 | YES | N.S. | N.S. | −0.17149 | N.S. | −70.23 | −37.80 | −3.91 | −70.65 | −36.41 | −0.59 | Left superior temporal gyrus | |||
Extended Data Table 3b.
DKT parcellation of all CI task-responsive electrodes
| DKT Label | # Perception Sites | # Production Sites | # Planning Sites | All** |
|---|---|---|---|---|
| Left superior frontal gyrus | 0 | 0 | 1 | 11 |
| Left rostral middle frontal gyrus* | 0 | 3 | 20 | 91 |
| Left caudal middle frontal gyrus* | 0 | 5 | 19 | 37 |
| Left pars opercularis* | 4 | 14 | 43 | 109 |
| Left pars triangularis* | 3 | 6 | 27 | 89 |
| Left pars orbitalis | 0 | 1 | 1 | 14 |
| Left precentral gyrus* | 1 | 53 | 29 | 128 |
| Left postcentral gyrus | 1 | 16 | 3 | 46 |
| Left superior parietal lobule | 0 | 1 | 0 | 12 |
| Left supramarginal gyrus | 0 | 4 | 2 | 17 |
| Left Inferior parietal lobule | 1 | 0 | 0 | 20 |
| Left superior temporal gyrus* | 11 | 5 | 14 | 103 |
| Left middle temporal gyrus | 0 | 6 | 1 | 53 |
| Left Inferior temporal gyrus | 2 | 2 | 0 | 12 |
| Left transverse temporal gyrus | 9 | 5 | 0 | 12 |
| Left lateral occipital cortex | 2 | 0 | 0 | 11 |
| Left insular cortex | 2 | 0 | 0 | 4 |
| Total | 36 | 121 | 160 | 769 |
Regions which combine to include 152 of 160 (95.0%) of all planning electrodes (inferior and middle frontal gyri, superior temporal gyrus, and precentral gyrus).
Total does not include electrodes which are located outside of the anatomical structures listed in this table.
ACKNOWLEDGEMENTS
We thank Adeen Flinker, Eric Jackson, Jelena Krivokapić, David Schneider, Nicholas Tritsch, and members of the Long laboratory for comments on earlier versions of this manuscript. We thank Araceli Ramirez-Cardenas, Haiming Chen, Kenji Ibayashi, Hiroto Kawasaki, Kirill Nourski, Hiroyuki Oya, Ariane Rhone, and Beau Snoad for help with data collection, and we also acknowledge helpful conversations with Frank Guenther and Najib Majaj.
Funding:
This research was supported by R01 DC019354 (M.A.L.), R01 DC015260 (J.D.W.G.), and Simons Collaboration on the Global Brain (M.A.L.).
Footnotes
COMPETING INTERESTS
The authors declare no competing interests.
REFERENCES
- 1.Sacks H, Schegloff EA & Jefferson G A Simplest Systematics for the Organization of Turn-Taking for Conversation. Language 50, 696–735 (1974). [Google Scholar]
- 2.Levinson SC & Torreira F Timing in turn-taking and its implications for processing models of language. Front Psychol 6, 731 (2015). [DOI] [PMC free article] [PubMed] [Google Scholar]
- 3.Heldner M & Edlund J Pauses, gaps and overlaps in conversations. Journal of Phonetics 38 (2010). [Google Scholar]
- 4.Stivers T et al. Universals and cultural variation in turn-taking in conversation. Proc Natl Acad Sci U S A 106, 10587–10592 (2009). [DOI] [PMC free article] [PubMed] [Google Scholar]
- 5.Schiffman HR Sensation and Perception. An Integrated Approach. (John Wiley and Sons, Inc., New York; 2001). [Google Scholar]
- 6.Bates E et al. Timed picture naming in seven languages. Psychon Bull Rev. 10, 344–380 (2003). [DOI] [PMC free article] [PubMed] [Google Scholar]
- 7.Flinker A et al. Redefining the role of Broca’s area in speech. Proc Natl Acad Sci U S A 112, 2871–2875 (2015). [DOI] [PMC free article] [PubMed] [Google Scholar]
- 8.Bohland JW, Bullock D & Guenther FH Neural representations and mechanisms for the performance of simple speech sequences. J Cogn Neurosci 22, 1504–1529 (2010). [DOI] [PMC free article] [PubMed] [Google Scholar]
- 9.Basilakos A, Smith KG, Fillmore P, Fridriksson J & Fedorenko E Functional Characterization of the Human Speech Articulation Network. Cereb Cortex 28, 1816–1830 (2018). [DOI] [PMC free article] [PubMed] [Google Scholar]
- 10.Mirman D, Kraft AE, Harvey DY, Brecher AR & Schwartz MF Mapping articulatory and grammatical subcomponents of fluency deficits in post-stroke aphasia. Cogn Affect Behav Neurosci 19, 1286–1298 (2019). [DOI] [PMC free article] [PubMed] [Google Scholar]
- 11.Papoutsi M et al. From phonemes to articulatory codes: an fMRI study of the role of Broca’s area in speech production. Cereb Cortex 19, 2156–2165 (2009). [DOI] [PMC free article] [PubMed] [Google Scholar]
- 12.Guenther FH Neural Control of Speech. (MIT Press, 2016). [Google Scholar]
- 13.Sahin NT, Pinker S, Cash SS, Schomer D & Halgren E Sequential processing of lexical, grammatical, and phonological information within Broca’s area. Science 326, 445–449 (2009). [DOI] [PMC free article] [PubMed] [Google Scholar]
- 14.Dronkers NF A new brain region for coordinating speech articulation. Nature 384, 159–161 (1996). [DOI] [PubMed] [Google Scholar]
- 15.Broca P Remarques sur le siege de la faculté du langage articulé, suivies d’une observation d’aphémie (perte de la parole). Bulletins et mémoires de la Société Anatomique de Paris 36, 330–356 (1861). [Google Scholar]
- 16.Trupe LA et al. Chronic apraxia of speech and Broca’s area. Stroke 44, 740–744 (2013). [DOI] [PMC free article] [PubMed] [Google Scholar]
- 17.Chang EF et al. Pure Apraxia of Speech After Resection Based in the Posterior Middle Frontal Gyrus. Neurosurgery 87, E383–E389 (2020). [DOI] [PMC free article] [PubMed] [Google Scholar]
- 18.Buchsbaum BR, Greer S, Chang WL & Berman KF Meta-analysis of neuroimaging studies of the Wisconsin card-sorting task and component processes. Hum Brain Mapp 25, 35–45 (2005). [DOI] [PMC free article] [PubMed] [Google Scholar]
- 19.Brass M & von Cramon DY The role of the frontal cortex in task preparation. Cereb Cortex 12, 908–914 (2002). [DOI] [PubMed] [Google Scholar]
- 20.Sierpowska J et al. Involvement of the middle frontal gyrus in language switching as revealed by electrical stimulation mapping and functional magnetic resonance imaging in bilingual brain tumor patients. Cortex 99, 78–92 (2018). [DOI] [PubMed] [Google Scholar]
- 21.Levinson SC Turn-taking in Human Communication--Origins and Implications for Language Processing. Trends Cogn Sci 20, 6–14 (2016). [DOI] [PubMed] [Google Scholar]
- 22.Indefrey P The spatial and temporal signatures of word production components: a critical update. Front Psychol 2, 255 (2011). [DOI] [PMC free article] [PubMed] [Google Scholar]
- 23.Levelt WJ, Roelofs A & Meyer AS A theory of lexical access in speech production. Behav Brain Sci 22, 1–38; discussion 38–75 (1999). [DOI] [PubMed] [Google Scholar]
- 24.Fuchs S, Petrone C, Krivokapić J & Hoole P Acoustic and respiratory evidence for utterance planning in German. . Journal of Phonetics 41, 29–47 (2013). [Google Scholar]
- 25.Redford MA Unifying Speech and Language in a Developmentally Sensitive Model of Production. J Phon 53, 141–152 (2015). [DOI] [PMC free article] [PubMed] [Google Scholar]
- 26.Turk A & Shattuck-Hufnagel S Timing Evidence for Symbolic Phonological Representations and Phonology-Extrinsic Timing in Speech Production. Front Psychol 10, 2952 (2019). [DOI] [PMC free article] [PubMed] [Google Scholar]
- 27.Schuhmann T, Schiller NO, Goebel R & Sack AT The temporal characteristics of functional activation in Broca’s area during overt picture naming. Cortex 45, 1111–1116 (2009). [DOI] [PubMed] [Google Scholar]
- 28.Alario FX, Chainay H, Lehericy S & Cohen L The role of the supplementary motor area (SMA) in word production. Brain Res 1076, 129–143 (2006). [DOI] [PubMed] [Google Scholar]
- 29.Giahi Saravani A, Forseth KJ, Tandon N & Pitkow X Dynamic Brain Interactions during Picture Naming. eNeuro 6 (2019). [DOI] [PMC free article] [PubMed] [Google Scholar]
- 30.Ferpozzi V et al. Broca’s Area as a Pre-articulatory Phonetic Encoder: Gating the Motor Program. Front Hum Neurosci 12, 64 (2018). [DOI] [PMC free article] [PubMed] [Google Scholar]
- 31.Tilsen S et al. Anticipatory Posturing of the Vocal Tract Reveals Dissociation of Speech Movement Plans from Linguistic Units. PLoS One 11, e0146813 (2016). [DOI] [PMC free article] [PubMed] [Google Scholar]
- 32.Ramanarayanan V, Goldstein L, Byrd D & Narayanan SS An investigation of articulatory setting using real-time magnetic resonance imaging. J Acoust Soc Am 134, 510–519 (2013). [DOI] [PMC free article] [PubMed] [Google Scholar]
- 33.Bogels S, Magyari L & Levinson SC Neural signatures of response planning occur midway through an incoming question in conversation. Sci Rep 5, 12881 (2015). [DOI] [PMC free article] [PubMed] [Google Scholar]
- 34.Ferreira F & Swets B How Incremental Is Language Production? Evidence from the Production of Utterances Requiring the Computation of Arithmetic Sums. Journal of Memory and Language 46, 57–84 (2002). [Google Scholar]
- 35.Wagner V, Jescheniak JD & Schriefers H On the flexibility of grammatical advance planning during sentence production: Effects of cognitive load on multiple lexical access. J Exp Psychol Learn Mem Cogn 36, 423–440 (2010). [DOI] [PubMed] [Google Scholar]
- 36.Bogels S, Casillas M & Levinson SC Planning versus comprehension in turn-taking: Fast responders show reduced anticipatory processing of the question. Neuropsychologia 109, 295–310 (2018). [DOI] [PubMed] [Google Scholar]
- 37.Dubey A & Ray S Cortical Electrocorticogram (ECoG) Is a Local Signal. J Neurosci 39, 4299–4311 (2019). [DOI] [PMC free article] [PubMed] [Google Scholar]
- 38.Buzsaki G, Anastassiou CA & Koch C The origin of extracellular fields and currents--EEG, ECoG, LFP and spikes. Nat Rev Neurosci 13, 407–420 (2012). [DOI] [PMC free article] [PubMed] [Google Scholar]
- 39.Cheung C, Hamiton LS, Johnson K & Chang EF The auditory representation of speech sounds in human motor cortex. Elife 5 (2016). [DOI] [PMC free article] [PubMed] [Google Scholar]
- 40.Wilson SM, Saygin AP, Sereno MI & Iacoboni M Listening to speech activates motor areas involved in speech production. Nat Neurosci 7, 701–702 (2004). [DOI] [PubMed] [Google Scholar]
- 41.Glanz Iljina O et al. Real-life speech production and perception have a shared premotor-cortical substrate. Sci Rep 8, 8898 (2018). [DOI] [PMC free article] [PubMed] [Google Scholar]
- 42.Cisek P & Kalaska JF Neural mechanisms for interacting with a world full of action choices. Annu Rev Neurosci 33, 269–298 (2010). [DOI] [PubMed] [Google Scholar]
- 43.Ray S & Maunsell JH Different origins of gamma rhythm and high-gamma activity in macaque visual cortex. PLoS Biol 9, e1000610 (2011). [DOI] [PMC free article] [PubMed] [Google Scholar]
- 44.Leszczynski M et al. Dissociation of broadband high-frequency activity and neuronal firing in the neocortex. Sci Adv 6, eabb0977 (2020). [DOI] [PMC free article] [PubMed] [Google Scholar]
- 45.Mukamel R et al. Invariance of firing rate and field potential dynamics to stimulus modulation rate in human auditory cortex. Hum Brain Mapp 32, 1181–1193 (2011). [DOI] [PMC free article] [PubMed] [Google Scholar]
- 46.Steinschneider M, Volkov IO, Noh MD, Garell PC & Howard MA 3rd Temporal encoding of the voice onset time phonetic parameter by field potentials recorded directly from human auditory cortex. J Neurophysiol 82, 2346–2357 (1999). [DOI] [PubMed] [Google Scholar]
- 47.Mesgarani N, Cheung C, Johnson K & Chang EF Phonetic feature encoding in human superior temporal gyrus. Science 343, 1006–1010 (2014). [DOI] [PMC free article] [PubMed] [Google Scholar]
- 48.Flinker A, Chang EF, Barbaro NM, Berger MS & Knight RT Sub-centimeter language organization in the human temporal lobe. Brain Lang 117, 103–109 (2011). [DOI] [PMC free article] [PubMed] [Google Scholar]
- 49.Hamilton LS, Edwards E & Chang EF A Spatial Map of Onset and Sustained Responses to Speech in the Human Superior Temporal Gyrus. Curr Biol 28, 1860–1871 e1864 (2018). [DOI] [PubMed] [Google Scholar]
- 50.Bouchard KE, Mesgarani N, Johnson K & Chang EF Functional organization of human sensorimotor cortex for speech articulation. Nature 495, 327–332 (2013). [DOI] [PMC free article] [PubMed] [Google Scholar]
- 51.Mugler EM et al. Differential Representation of Articulatory Gestures and Phonemes in Precentral and Inferior Frontal Gyri. J Neurosci 38, 9803–9813 (2018). [DOI] [PMC free article] [PubMed] [Google Scholar]
- 52.Cogan GB et al. Sensory-motor transformations for speech occur bilaterally. Nature 507, 94–98 (2014). [DOI] [PMC free article] [PubMed] [Google Scholar]
- 53.Kotz SA et al. Lexicality drives audio-motor transformations in Broca’s area. Brain Lang 112, 3–11 (2010). [DOI] [PubMed] [Google Scholar]
- 54.Gerardin E et al. Partially overlapping neural networks for real and imagined hand movements. Cereb Cortex 10, 1093–1104 (2000). [DOI] [PubMed] [Google Scholar]
- 55.Fadiga L & Craighero L Hand actions and speech representation in Broca’s area. Cortex 42, 486–490 (2006). [DOI] [PubMed] [Google Scholar]
- 56.Papitto G, Friederici AD & Zaccarella E The topographical organization of motor processing: An ALE meta-analysis on six action domains and the relevance of Broca’s region. Neuroimage 206, 116321 (2020). [DOI] [PubMed] [Google Scholar]
- 57.Lange VM & Laganaro M Inter-subject variability modulates phonological advance planning in the production of adjective-noun phrases. Front Psychol 5, 1–12 (2014). [DOI] [PMC free article] [PubMed] [Google Scholar]
- 58.Torreira F, Bogels S & Levinson SC Breathing for answering: the time course of response planning in conversation. Front Psychol 6, 284 (2015). [DOI] [PMC free article] [PubMed] [Google Scholar]
- 59.Knudsen B, Creemers A & Meyer AS Forgotten Little Words: How Backchannels and Particles May Facilitate Speech Planning in Conversation? Front Psychol 11, 593671 (2020). [DOI] [PMC free article] [PubMed] [Google Scholar]
- 60.Dichter BK, Breshears JD, Leonard MK & Chang EF The Control of Vocal Pitch in Human Laryngeal Motor Cortex. Cell 174, 21–31 e29 (2018). [DOI] [PMC free article] [PubMed] [Google Scholar]
- 61.Chang EF et al. Stereotactic probability and variability of speech arrest and anomia sites during stimulation mapping of the language dominant hemisphere. J Neurosurg 126, 114–121 (2017). [DOI] [PubMed] [Google Scholar]
- 62.Long MA et al. Functional Segregation of Cortical Regions Underlying Speech Timing and Articulation. Neuron 89, 1187–1193 (2016). [DOI] [PMC free article] [PubMed] [Google Scholar]
- 63.Klaus J & Hartwigsen G Dissociating semantic and phonological contributions of the left inferior frontal gyrus to language production. Hum Brain Mapp 40, 3279–3287 (2019). [DOI] [PMC free article] [PubMed] [Google Scholar]
- 64.Tate MC, Herbet G, Moritz-Gasser S, Tate JE & Duffau H Probabilistic map of critical functional regions of the human cerebral cortex: Broca’s area revisited. Brain 137, 2773–2782 (2014). [DOI] [PubMed] [Google Scholar]
- 65.Nottebohm F, Stokes TM & Leonard CM Central control of song in the canary, Serinus canarius. J Comp Neurol 165, 457–486 (1976). [DOI] [PubMed] [Google Scholar]
- 66.Long MA & Fee MS Using temperature to analyse temporal dynamics in the songbird motor pathway. Nature 456, 189–194 (2008). [DOI] [PMC free article] [PubMed] [Google Scholar]
- 67.Okobi DE Jr., Banerjee A, Matheson AMM, Phelps SM & Long MA Motor cortical control of vocal interaction in neotropical singing mice. Science 363, 983–988 (2019). [DOI] [PubMed] [Google Scholar]
- 68.Tremblay P & Dick AS Broca and Wernicke are dead, or moving past the classic model of language neurobiology. Brain Lang 162, 60–71 (2016). [DOI] [PubMed] [Google Scholar]
- 69.Hosman T et al. Auditory cues reveal intended movement information in middle frontal gyrus neuronal ensemble activity of a person with tetraplegia. Sci Rep 11, 98 (2021). [DOI] [PMC free article] [PubMed] [Google Scholar]
- 70.Catani M et al. Short frontal lobe connections of the human brain. Cortex 48, 273–291 (2012). [DOI] [PubMed] [Google Scholar]
- 71.Glasser MF et al. A multi-modal parcellation of human cerebral cortex. Nature 536, 171–178 (2016). [DOI] [PMC free article] [PubMed] [Google Scholar]
- 72.Mathis A et al. DeepLabCut: markerless pose estimation of user-defined body parts with deep learning. Nat Neurosci 21, 1281–1289 (2018). [DOI] [PubMed] [Google Scholar]
- 73.Deger K & Ziegler W Speech motor programming in apraxia of speech. . Journal of Phonetics 30, 321–335 (2002). [Google Scholar]
- 74.Neef NE, Hoang TN, Neef A, Paulus W & Sommer M Speech dynamics are coded in the left motor cortex in fluent speakers but not in adults who stutter. Brain 138, 712–725 (2015). [DOI] [PMC free article] [PubMed] [Google Scholar]
- 75.Jackson ES et al. A fNIRS Investigation of Speech Planning and Execution in Adults Who Stutter. Neuroscience 406, 73–85 (2019). [DOI] [PubMed] [Google Scholar]
- 76.Dale AM, Fischl B & Sereno MI Cortical surface-based analysis. I. Segmentation and surface reconstruction. Neuroimage 9, 179–194 (1999). [DOI] [PubMed] [Google Scholar]
- 77.Fischl B et al. Automatically parcellating the human cerebral cortex. Cereb Cortex 14, 11–22 (2004). [DOI] [PubMed] [Google Scholar]
- 78.Klein A & Tourville J 101 labeled brain images and a consistent human cortical labeling protocol. Front Neurosci 6, 171 (2012). [DOI] [PMC free article] [PubMed] [Google Scholar]
- 79.Desikan RS et al. An automated labeling system for subdividing the human cerebral cortex on MRI scans into gyral based regions of interest. Neuroimage 31, 968–980 (2006). [DOI] [PubMed] [Google Scholar]
- 80.Avants BB et al. A reproducible evaluation of ANTs similarity metric performance in brain image registration. Neuroimage 54, 2033–2044 (2011). [DOI] [PMC free article] [PubMed] [Google Scholar]
- 81.Tyszka JM & Pauli WM In vivo delineation of subdivisions of the human amygdaloid complex in a high-resolution group template. Hum Brain Mapp 37, 3979–3998 (2016). [DOI] [PMC free article] [PubMed] [Google Scholar]
- 82.Kovach CK & Gander PE The demodulated band transform. J Neurosci Methods 261, 135–154 (2016). [DOI] [PMC free article] [PubMed] [Google Scholar]
- 83.Liu Y, Coon WG, Pesters A, de B, P. & Schalk, G. The effects of spatial filtering and artifacts on electrocorticographic signals. J. Neural Eng 12, 056008 (2015). [DOI] [PMC free article] [PubMed] [Google Scholar]
- 84.Friston KJ et al. Statistical Parametric Maps in functional imaging: A general linear approach. Human Brain Mapping 2, 189–210 (1995). [Google Scholar]
- 85.Qian T, Wu W, Zhou W, Gao S & Hong B in Annual International Conference of the IEEE Engineering in Medicine and Biology Society 2347–2350 (Boston, MA; 2011). [DOI] [PubMed] [Google Scholar]