Abstract
Depression and anxiety disorders overlap in clinical populations, suggesting common mechanisms that may be further investigated in reliable animal models. We used filial 8 female Long-Evans rats bred for high (HAn; n=19) and low anxiety (LAn)-like behavior (n=21) to assess forced swim test mobility strategies and chronic mild stress (CMS)-induced depression-like symptoms. We measured (1) weight, (2) fur piloerection, (3) sweet food consumption, (4) grooming behavior, and (5) circulating estradiol (E2). One month after CMS terminated and following a terminal forced swim test, brains were processed for immunohistochemistry targeting c-Fos and serotonin 1A receptor (5-HT1AR) protein in the paraventricular nucleus (PVN) of the hypothalamus. HAn female rats showed increased anxiety-like behavior (i.e., lower open to closed arm ratios, increased closed arm entries), more swimming (i.e., mobility), and less floating (i.e., immobility) behavior in the forced swim test. Overall, HAn females weighed less than their LAn counterparts. After chronic mild stress, HAn lines displayed even greater mobility and consumed fewer Froot Loops™. Fur and grooming analyses indicated no significant differences in mean counts across experimental groups. One month after CMS, cycling E2 concentrations (pg/ml) did not differ between HAn and LAn animals. Elevated c-Fos and 5-HT1AR expression were observed in the PVN, where HAn CMS rats expressed the most c-Fos and 5-HT1AR immunoreactivity. In summary, outbred HAn rats show robust anxiety-like behavior, exhibit more mobility in the forced swim test, and are more sensitive to chronic mild stress-induced grooming and decline in palatable food ingestion.
Keywords: forced-swim test, trait anxiety, unpredictable stress, anhedonia, serotonin receptors, immediate early gene, rodents
1. Introduction
While many individuals experience everyday life stressors without any remarkable socioemotional decline, others will show extreme distress to the same stressors (Marciniak et al., 2004). Anxiety and depression are significantly comorbid in children and adolescents (Brady & Kendall, 1992; Cummings et al., 2014) and adults (Rohde et al., 1991; Flint, 1994; Mineka et al., 1998; Kessler et al., 2012B; Hasin et al., 2018). The World Health Organization’s (WHO) global prevalence estimates for anxiety and depression disorders grew by 14.9% and 18.4%, respectively, from 2005–2015 (WHO, 2017). In the United States, one-year and lifetime prevalence estimates for depression disorders are almost two-fold higher in women than men (Hasin et al., 2018). Out of individuals with chronic stress disorders, women were more likely to develop a comorbid depressive disorder (McLean, Asnaani et al., 2011). Further, females report higher rates of multiple anxiety disorders than males (for review see, McLean and Andersen, 2009; for review see, Christiansen, 2015; for review see, Asher et al., 2017; Asher & Aderka, 2018).
Depressive episodes disproportionately impact women (Yang & Lee, 2009), have a heritable component, and are linked to pre-existing traits and physiological differences such as temperament and neuroendocrine function (Gorwood et al., 2004). An increase in major depressive disorder (MDD) diagnosis in girls parallels the onset of ovarian cycling (i.e., a significant increase in circulating estrogens), and post-pubertal females experience up to twice as many MDD episodes as males (Altemus et al., 2014). Ovarian hormone fluctuations can account for variability in behavioral changes related to emotionality and anxiety (Mora, Dussaubat & Diaz-Veliz, 1996; Palanza et al., 2001; Azizi-Malekabadi et al., 2015; Ramos-Ortolaza et al., 2017). For example, a reduction in anxiety-like behavior (ALB) in female rats is reported during proestrus and estrus (Mora, Dussaubat, and Diaz-Veliz 1996; Zimmberg & Farley, 1993; Palanza et al., 2001); while estradiol, progesterone, and their metabolites exert anti-anxiety effects in rats and mice (Mora et al., 1996; Rodgers et al., 1998; Palanza et al., 2001; Weiser et al., 2010; Calmarza-Font et al., 2012; Oyola et al., 2012). Furthermore, these anxiolytic effects are either mediated by changes in GABA/benzodiazepine receptors or serotonin (Mora et al., 1997; Rodgers et al., 1998; Palanza et al., 2001; MacKenzie & Maguire, 2014; Ferreira et al., 2016).
Rats inbred along high and low ALB differ in their coping responses to the forced swim test (FST) since high ALB rats exhibit more passive and depression-like behaviors, including freezing, attenuated struggling, and low sensory thresholds relative to low ALB rats (Landgraf & Wigger, 2002). In response to a social defeat test, high ALB rats showed more significant Fos immunoreactivity in the medial nucleus of the amygdala, produced more ultrasonic vocalizations, and exhibited increased freezing during the confrontation (Landgraf & Wigger, 2003). Additionally, Cohen and colleagues (2017) selectively bred rats for high (HR) or low (LR) response to novel stimuli—a behavioral measure of ALB, where low ALB animals are designated as HR. In response to the defensive burying test, HR rats showed proactive while LR rats displayed reactive coping styles (i.e., increased immobility scores). The increase in proactive coping styles in HR rats was associated with increased activation of serotoninergic neurons and differential neuroimmune mRNA expression compared to LR rats (Cohen et al., 2017).
In the current study, we used selectively outbred filial 8 (F8) Long-Evans female rats displaying high (HAn) and low anxiety (LAn)-like behavior to assess mobility strategies in the FST and to determine the impact of a three-week chronic mild stress (CMS) paradigm (adapted from Papp et al., 2003) on depression-like symptoms (DLS), serum estradiol (E2) concentration, and c-Fos and serotonin 1A receptor (5-HT1AR) immunoreactivity (IR) in the paraventricular nucleus (PVN) of the hypothalamus. The PVN is implicated in ALB and stress regulation in clinical populations and rodent models (Flandreau et al., 2012). For example, in rats, serotonin depletion in the PVN significantly altered ALB on the elevated plus maze (EPM) behavior (Ciobica et al., 2010). We further selected the PVN as recent work in our lab has shown higher 5-HT1A receptor protein expression in this region in filial 5 outbred HAn males (Niedzielak et al., 2020).
2. Materials and Methods
2.1. Study Design
2.1.1. Animals
For the current study, female Long-Evans rats from a ninth generational line (F8; N=104) were housed in groups of 3–4 per cage under controlled conditions of temperature, light (12h light-dark cycle; lights on from 0700 h to 1900 h, E.S.T.), and humidity, with free access to food and water. All animals used were bred from nine generations of unrelated Trait ALB mating pairs (HAn males and HAn females/LAn males and LAn females), determined by quartile analysis of time spent on the open arms in the EPM (e.g., lower quartile, less time spent on OA, HAn; upper quartile, more time spent on OA, LAn), in the animal facilities of the University of Massachusetts Boston in Boston, Massachusetts (For details, see Ravenelle et al., 2013). Previous work in our lab (Ravenelle et al., 2013) has demonstrated that successive generational lines of animals starting at filial 3 (4th generational line) resemble the parental line (filial 0, F0) when screened on the EPM and this effect was observed for filial 5 generational line animals as well (Niedzielak et al., 2020). Accordingly, in the current study, we selected females (N=65) screened on the EPM that shared similar Trait ALB to the F0 parental line. We did vaginal swabs and evaluated stage of estrous at this selection process and prior to testing; only females that were cycling together were selected. All protocols were approved by the University of Massachusetts IACUC and adhered to the applicable portions of the Animal Welfare Act and the U.S. Department of Health and Human Services “Guide for the Care and Use of Laboratory Animals.”
2.2. Elevated Plus Maze
2.2.1. Equipment
The EPM (Med Associates, St. Albans, VT) was elevated 70 cm from the floor and consisted of two opposing high-walled arms and two opposing arms open to the ambient testing room, with a square (10 × 10 cm) junction at the center of the four arms. The EPM was automated to a PC using MedAssociates software (Med Associates, St. Albans, VT) for calculating entry and time parameters.
2.2.2. Procedure
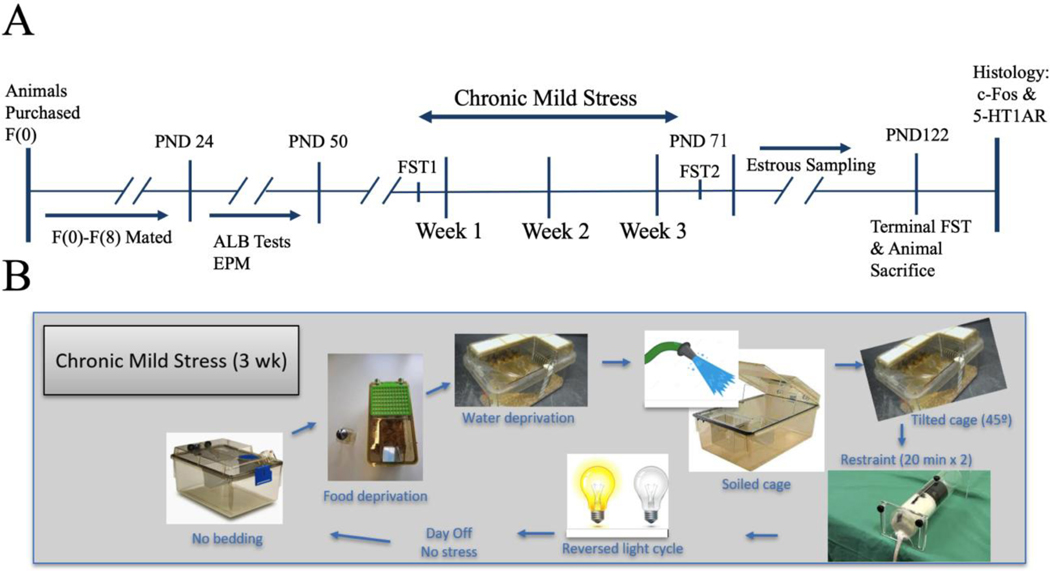
Animals were phenotyped on the EPM using a quartile analysis, with animals characterized as having HAn in the lower quartile (i.e., they spent <20% of their time on the open arms) and LAn in the upper quartile (i.e., they spent >40% of their time on the open arms). To confirm emotionality or extreme HAn and LAn phenotypes, we tested all animals on the EPM on postnatal day (PND) 25, after weaning, and PND 49, before the onset of CMS. Before starting each session, the maze was sanitized with a mixture of mild detergent and water and dried. A rat was placed on the central platform facing an open or closed arm and allowed to move for 5 minutes freely; the direction of placement was randomized for each subsequent animal. Percent of time spent on open arms (%OA) was collected and utilized from MED-SYST-8 interface and software. We next calculated a quartile analysis for %OA data. Animals in the lower quartile (those animals showing the least %OA time) and upper quartile (those animals showing the most %OA time) of the quartile analysis were used to determine HAn and LAn phenotypes, respectively. A total of 65 eligible females (HAn: n=25, LAn: n=40) from the F8 generational line were screened on the EPM across two rounds of tests to confirm ALB (PND 25 and PND 49). Following the EPM screen on PND 49, the LAn and HAn animals were split by CMS treatment (3 weeks) to yield four experimental groups: LAn control (n=11), LAn CMS (n = 10), HAn control (n=9), and HAn CMS (n=10). A pictorial representation of the Study Timeline and the CMS Protocol can be seen in Fig 1 (A–B). EPM data are presented as %OA time ±standard error of the mean (±SEM).
Figure 1A-B. Experimental timeline.
(A) Timeline outlining experimental study details. After nine generations of unrelated trait-paired mating, animals were screened on the EPM on PNDs 25 and 49. Following the last EPM screen, the three-week CMS treatment commenced. Estrous cycling sampling for E2 occurred one month after CMS. Three FSTs were conducted: FST1 prior to the onset of CMS, FST2 following the three-week CMS regimen, and a terminal FST (data not recorded) prior to animal sacrifice. (B) CMS protocol. Schematic depicting seven mild stressors that comprised the CMS procedure.
2.3. Forced Swim Test
The FST was performed three times: 1–2 days pre-CMS onset (FST1), 1–2 days after the end of CMS (FST2), and 60 minutes prior to sacrifice (terminal FST, no data recorded). On PND 71, after the final CMS treatment, animals were exposed to FST2. Thirty minutes before each FST, animals were taken in their home cages to the experimental room (same lighting cycle) to allow for habituation. Rats were individually subjected to the FST in a cylindrical plastic tank (Plexiglas fashioned for the experimenter: height 40 cm, diameter 18 cm) filled with tap water (25ºC) to approximately 20 cm from the top. Over the five minutes, floating and swimming behaviors were recorded as a proxy for immobility and mobility responses, respectively. After the test session, animals were dried with towels and placed in cages with a heating pad for five minutes. FST data are presented as mean percent time ±SEM displaying immobile (floating) or mobile (swimming: whenever the animals moved both forelimbs and hindlimbs or any combination) behavior.
2.4. Chronic Mild Stress
The LAn and HAn animals were further divided into groups based on CMS treatment. LAn and HAn animals that did not experience CMS were categorized as LAn control (n=11) and HAn control (n=9), respectively. Similarly, LAn and HAn animals that did experience CMS were categorized as LAn CMS (n=10) and HAn CMS (n=10), respectively. The CMS procedure was adapted from Papp et al. (1991) and modified for three weeks. CMS was operationalized as the following:
Bedding was removed at 22:00 for 14 hours.
Food was taken away at 20:00 for 14 hours.
Water bottles were removed at 22:00 for 14 hours.
Bedding was moistened with 250 ml of water and remained wet for 14 hours.
Cages were tilted at a 45° angle at 20:00 for 14 hours.
Animals were placed in restraints for 20 minutes.
Animals were induced into a reversed light/dark cycle within home cages for 24 hours.
On days marked as none, there was no stressor performed. Please refer to Figure 1B for a depiction of the rotation of the CMS manipulations.
2.5. Sweet Food Consumption (Froot Loops™)
We conducted a sweet food consumption test at the start of each CMS treatment week for three tests throughout the CMS protocol. Each animal was first isolated and placed into a new cage for the duration of the test. Within each new cage, bedding was removed, and a grid floor was inserted. Next, a sheet of construction paper was placed under the grid to collect any pellet crumbs that may have fallen throughout the test. Froot Loops™ (Kellogg’s pellets containing wheat, cornstarch, and sucrose) were placed in a weigh boat; each weigh boat was weighed prior to the start of the test for pre-test measurements. Froot Loops™ has been used as a highly palatable reward in food consumption and anticipation tasks evoking dopamine efflux (Butts et al., 2011) and has been shown to evoke ultrasonic vocalization patterns like ethanol consumption (Mulvihill & Brudzynski, 2018). Other research examining depression-like behavior (Dandekar et al., 2019) has also been reported, and thus, Froot Loops™ were selected as a highly palatable food reward in the current work.
The filled weigh boat was placed in the corner of the cage, and each animal was left alone for three minutes. After the test, any crumbs that remained at the bottom of the cage were added back into the weigh boat, and the weigh boat was weighed for post-test measurements. The difference between the weigh boat pre-and-post-test was used to calculate total Froot LoopsTM consumption. Data are presented as total Froot Loops™ consumption (g) ±SEM. Animals were exposed to Froot Loops™ and periodic experimenter handling during the week before the sweet food consumption tests to control for neophobia. This protocol was adapted from Silveira et al. (2006).
2.6. Weight, Fur Piloerection, and Grooming
Animals were weighed at the beginning of each week throughout the CMS treatment, including baseline (start of CMS week 1). Following weight measurements, animals were placed in a novel cage in a brightly lit room (70 lux) and underwent fur piloerection and grooming checks. We were interested in whether the groups displayed any differences in weight, fur piloerection, or grooming, used as typical proxies of a decline in health, in response to the CMS treatment. The fur piloerection check examined the face, back, belly, nose, and eyes for piloerection and the tail for discoloration. The grooming check examined the licking of the paws and subsequent cleaning of the face, ears, and fur throughout the rest of the body. A five-minute timer was set, and two raters blind to the experimental design had one sheet corresponding to fur piloerection and another corresponding to grooming behavior. The raters recorded when fur piloerection and grooming behavior was observed across each five-minute test period. Rater one measured the front of each animal, while rater two measured the rear of each animal. A “1” was recorded if fur piloerection or grooming behavior was observed, and a “0” if none were observed. Data are reported as weight (g) and counts of observed fur piloerection and grooming behavior.
2.7. E2 Concentration
One month following FST2, animals (LAn Control (n-=10), HAn control (n=10); LAn CMS (n=11), HAn CMS (n=9)) were exposed to a terminal FST and sacrificed thirty minutes later by rapid live decapitations, and their blood was collected for cycling E2 concentration analysis. Animal sacrifice occurred before 1400 h, trunk blood was collected in heparinized test tubes, centrifuged, and plasma samples were stored at −20ºC until the analysis time. Our radioimmunoassay protocol was adopted from Bridges and Byrnes (2006). As such, plasma E2 concentrations were assayed using a Coat-A-Count Kit targeted against E2 purchased from Diagnostic Products Corporation (Los Angeles, CA). Within a single assay, all samples were assayed in 100ul duplicates at an assay sensitivity of 1 pg/ml and with an intraassay coefficient of variation of 12%. Plasma E2 data are reported as concentration (pg/ml) ±SEM.
2.8. Immunohistochemistry
Following the behavioral tests, animals were given a terminal FST followed by an overdose of Fatal Plus (Vortech Pharmaceuticals, Ltd., Dearborn, MI; 0.075–0.2 ml) 90 minutes later, with a sterile hypodermic needle injection and perfused transcardially to preserve the brain for immunohistochemistry (IHC). Animals were perfused first with 0.9% saline, followed by 4% paraformaldehyde to fix the brain tissue. After perfusions, the brains were extracted and stored in 4% paraformaldehyde until 24 h cryoprotection in a stepwise fashion beginning at 5%, then changing to 10%, and ultimately 25% sucrose+4% paraformaldehyde. Rabbit polyclonal anti-c-Fos antibody (1:5,000 dilution; Calbiochem, Calif., USA) and rabbit polyclonal anti-5-HT1AR antibody (1:7,500; Abcam, Waltham, MA., USA) were used to detect c-Fos and 5-HT1AR protein expression in the PVN. Using free-floating tissue sections, day one began with phosphate-buffered saline (PBS) washes for 15 minutes, then blocking in 0.3% H2O2 for 45 minutes, washed with PBS again, and then incubated in the primary antibodies c-Fos and 5-HT1AR, diluted in Tris-buffered NaPBS, overnight. On day two, the tissue sections were washed in PBS for 15 minutes and then incubated in the respective secondary antibody (Vector labs, Vectastain kit; mouse 1:600 (c-fos) and goat 1:600 (5HT1AR)) for one hour. For day three, the tissue sections were washed, incubated in avidin-biotin solution for one hour, washed with Tris-buffered NaPBS, and placed in 0.02% 3,3’-diaminobenzidine (DAB) for c-Fos and DAB + Nickel for 5HT1AR (Vector labs, Vectastain) stain for 3 minutes. We also ran controls for the antibody staining following the same protocol, save for incubation in the primary antibodies substituting the normal goat serum; here, we observed no staining relative to IHC + antibody tissues (data not shown).
2.8.1. Cell counts
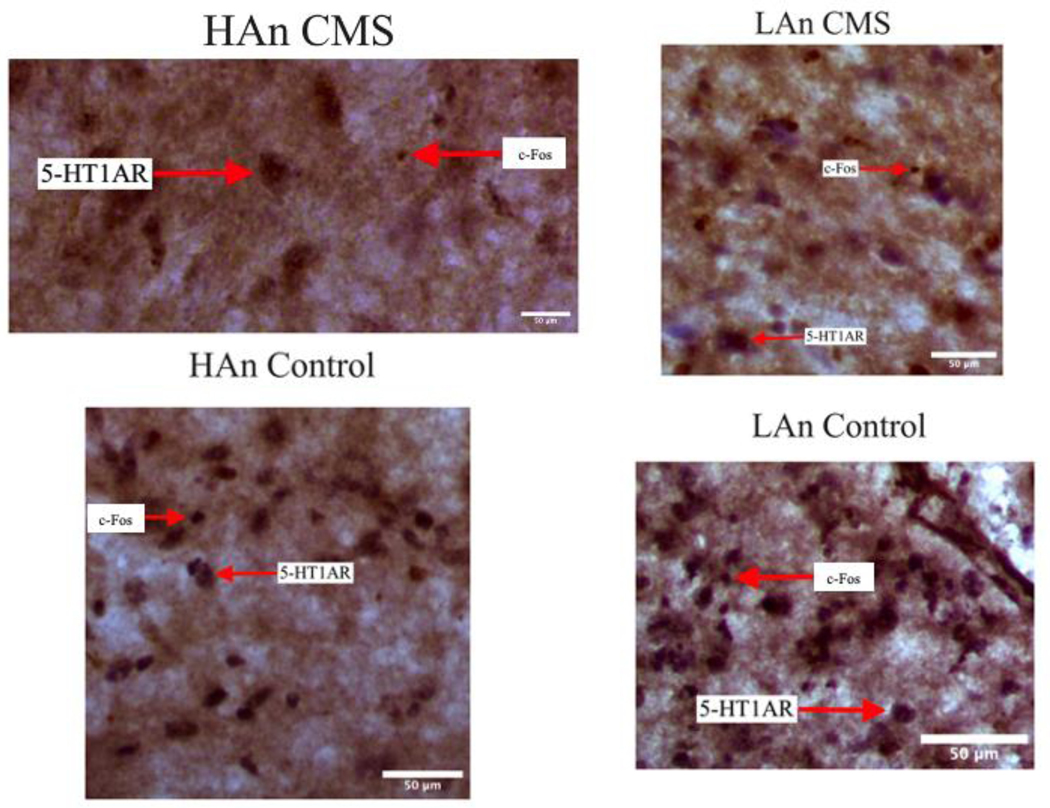
Two experimenters blind to animal identifications were recruited to assist with quantifying c-Fos and 5-HT1AR immunoreactive (IR) cells within the PVN of the hypothalamus. Experimenters were trained to distinguish c-Fos based on its chemogenic DAB light brown staining and 5-HT1AR based on its DAB-Nickel “punctate black” coloring as described in Fort and Jouvet (1990). We used four rats from each experimental group (N=16), and five consecutive 30-μm sections were analyzed per animal; measurements were averaged from the right and left hemispheres from six-eight tissues per animal. For image analyses, a 250 μm 2 square reticule was placed in the PVN, and a digital image was captured so each experimenter could manually count the IR cells within the reticule; we used this same protocol for each protein. Representative images are provided (Figure 12). Data are presented as the number of IR cell counts ± SEM (Figure 11).
Figure 12. Representative Images of PVN Immunohistochemistry.
Representative images (40X magnification) of the PVN from each experimental group expressing immunoreactive staining for c-Fos and 5-HT1AR proteins.
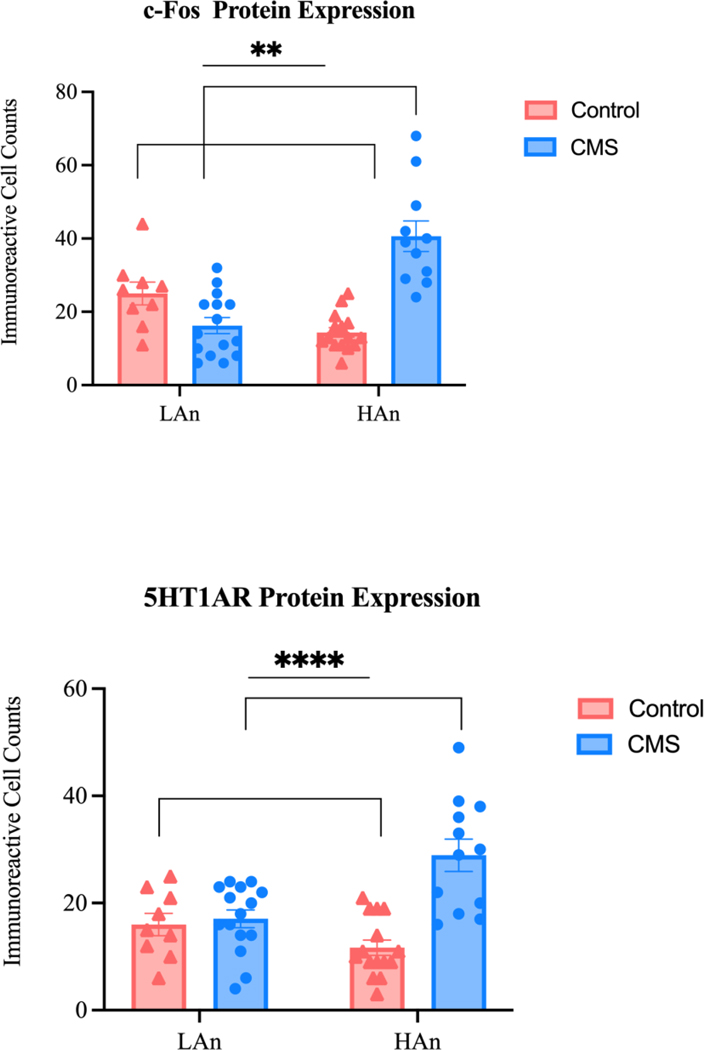
Figure 11. c-Fos and 5HT1AR Expression in the PVN.
Scatter dot plots representing a two-way ANOVA with Šídák’s multiple comparisons test for c-Fos (A) and 5HT1AR (B) protein expression in the PVN. Data are represented as immunoreactive cell counts ±SEM. (A) c-Fos. HAn rats expressed more c-Fos than LAn counterparts [F (1,46) = 6.53; *p=0.014] and CMS/control rats differed in number of IR cell counts of c-Fos expressed [F (1,46) = 10.55; **p=0.002]. Post-hoc analyses revealed that HAn CMS rats expressed the most c-Fos (Šídák’s multiple comparisons test: ####p<0.0001). (B) 5-HT1AR. CMS rats differed from control rats [F (1,47) = 19.10; ****p<0.0001] and HAn/LAn CMS animals differed from HAn/LAn control animals F (1, 47) = 14.91; ***p=0.0003]. Further, HAn CMS rats expressed the most 5-HT1AR (Šídák’s multiple comparisons test: ####p<0.0001).
2.9. Data Analysis
All data were exported to Excel and GraphPad Prism (v. 9.0) for Mac for graphing and analyses. We employed Levene’s test to test all data for homogeneity of variance. Next, we ran Welch’s t-tests for the EPM and weight data to delineate any trait differences. Additionally, where appropriate, we employed two- and three-way ANOVAs for FST, weight, sweet food consumption, fur piloerection, grooming behavior, E2 concentration, and IHC data. Where appropriate, Tukey’s or Šídák’s post-hoc test was used to examine specific group differences.
3. Results
3.1. Elevated Plus Maze
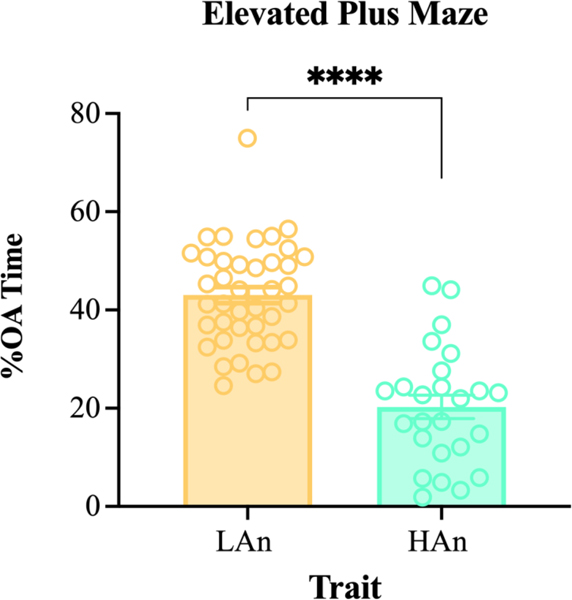
We assessed ALB on the EPM (Figure 2), representing data as %OA time ±SEM. A Kolmogorov– Smirnov test confirmed that data were normally distributed. Next, an unpaired Student’s t-test revealed that HAn rats spent less time in the open arms than LAn rats (t=8.132, df=63; p<0.0001; R2 =0.574), confirming trait phenotypes like parental lines. The LAn mean %OA time (±SEM) was 43.03 (±1.64) relative to the HAn mean of 20.27 (±2.39) with an eta squared of 0.5754.
Figure 2. %Open Arm time on EPM.
Bar graphs with scatter plot depicting %OA time for filial 8 (F8) females. Scores were used to phenotype high anxiety-like behavior (HAn; n=25) and low anxiety-like behavior (LAn; n=40) on the elevated plus maze. Data are represented as %OA time ±SEM. HAn rats spent significantly less time on the open arms (****p<0.0001) than LAn females.
3.2. Forced Swim Test
We operationalized and scored floating and swimming as immobility and mobility responses during each FST five-minute trial. Behaviors scored in the FST were analyzed using a 2 (Trait Anxiety: LAn/HAn) X 2 (Treatment: Control/CMS) X 2 (Time: FST1 and FST2) mixed ANOVA design. Only those behaviors that approached or reached significant effects are discussed. When main effects were found, data were collapsed across other factors and analyzed using unpaired Student’s t-tests to delineate the directionality of the difference(s). All behaviors were manually scored; as such, some behaviors were not captured, leading to missing data points that were dropped by the statistical package GraphPad Prism.
We scored immobile and mobile responses across a five-minute FST trial twice (FST 1,2): one prior to the start of CMS and one after CMS. Data are shown as mean percent time spent ±SEM immobile (Figure 3) and mobile (Figure 4). CMS animals differed from control counterparts in time spent immobile during the two FST trials (main effect of Treatment: F (1, 74) = 5.110; p=0.0267) (Figure 3A). CMS animals spent less time being immobile compared to controls (t=2.371, df=46.44; p=0.02; LAn Control 5.45 ±2.69, LAn CMS 0.91 ±0.91; HAn Control 5 ±2.86; HAn CMS 0); the effect size for immobility/floating was 0.39 (Figure 3B).
Figure 3A-B. FST Mean % Time Spent Immobile.
Scatter plots of mean % immobility time ±SEM. A three-way mixed ANOVA (N=41) showed that CMS and control animals differed in mean % time spent immobile [F (1, 74) = 5.110; *p=0.0267]. (B) A Welch’s-corrected unpaired Student’s t-test (N=41) showed that CMS animals (n=20) spent less time immobile compared to control animals (n=21) (t=2.371, df=46.44; *p=0.02).
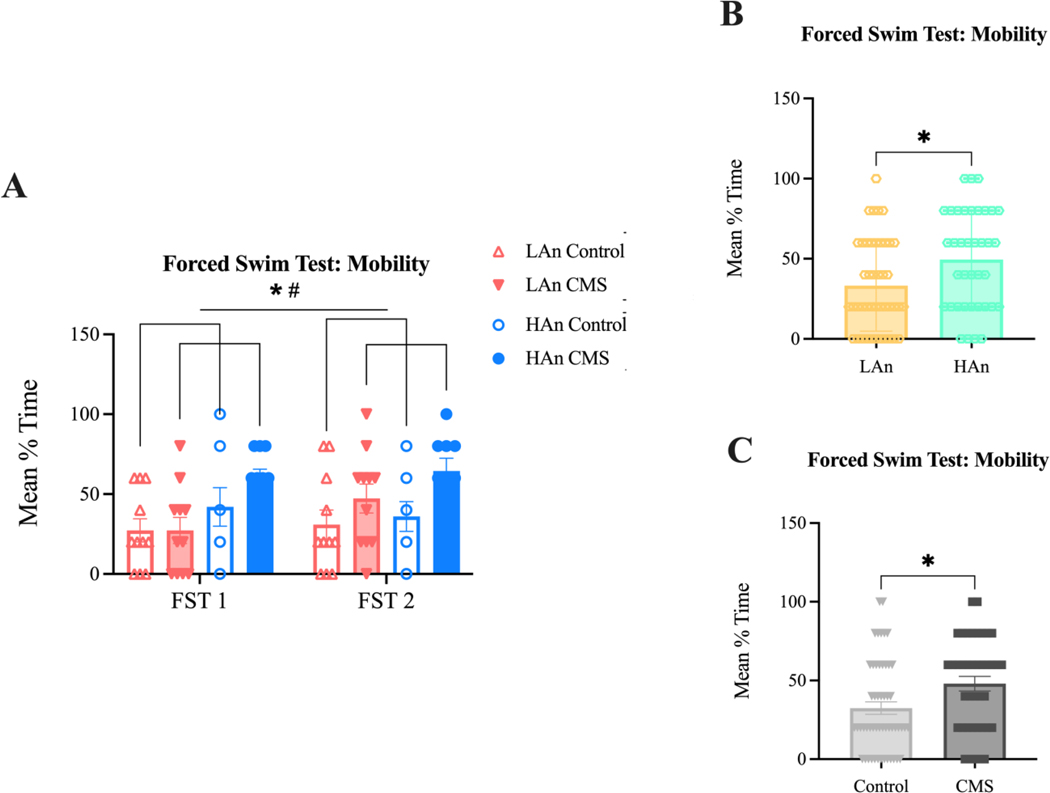
Figure 4A-C. FST Mean % Time Mobile.
Bar graphs with scatter plots (A-C). Data are represented as mean % mobility time ±SEM. (A) A three-way mixed ANOVA (N=41) revealed that CMS and control rats [F (1, 74) = 5.636; *p=0.0202] as well as HAn and LAn rats [F (1, 74) = 6.995; *p=0.0100] differed in % time spent mobile. (B-C) Two Welch’s-corrected unpaired t-tests (N=41), one collapsed across treatment and time to highlight trait differences (B) and the other collapsed across Trait and time to highlight treatment differences (C). (B) HAn rats (n=19) spent more time mobile than LAn rats (n=22) (t=2.483, df=75.92; *p=0.0152). (C) CMS animals (n=20) exhibited more mobility than control rats (n=21) (t=2.550, df=83.53; *p=0.0126).
Further, HAn and LAn animals (main effect of Trait: F (1, 74) = 6.995; p=0.0100) and CMS and control animals (main effect of treatment: F (1, 74) = 5.636; p=0.0202) differed in the amount of time spent mobile during the two FST trials (Figure 4A). Specifically, HAn rats were more mobile than LAn counterparts (t=2.483, df=75.92; p=0.0152) (Figure 4B) and CMS rats were more mobile than control counterparts (t=2.550, df=83.53; p=0.0126; LAn Control 29.09 ±1.82, LAn CMS 37.27 ±10, HAn Control 39 ±3, HAn CMS 61.11 ±3.33); the effect size for mobility/swimming was 0.09 (Figure 4C).
3.3. Froot Loops™ Consumption
Sweet food consumption (Figure 5) was calculated as the original weight (g) of Froot Loops™ minus the final weight of Froot Loops™. Froot Loops™ consumption was analyzed using a 2 (Trait Anxiety: LAn/HAn) X 2 (Treatment: control/CMS) X 3 (Time: CMS weeks 1,2,3) mixed measures ANOVA. Only data that approached or reached significant effects are discussed. Three-way interactions were further explored through a series of two-way ANOVAs.
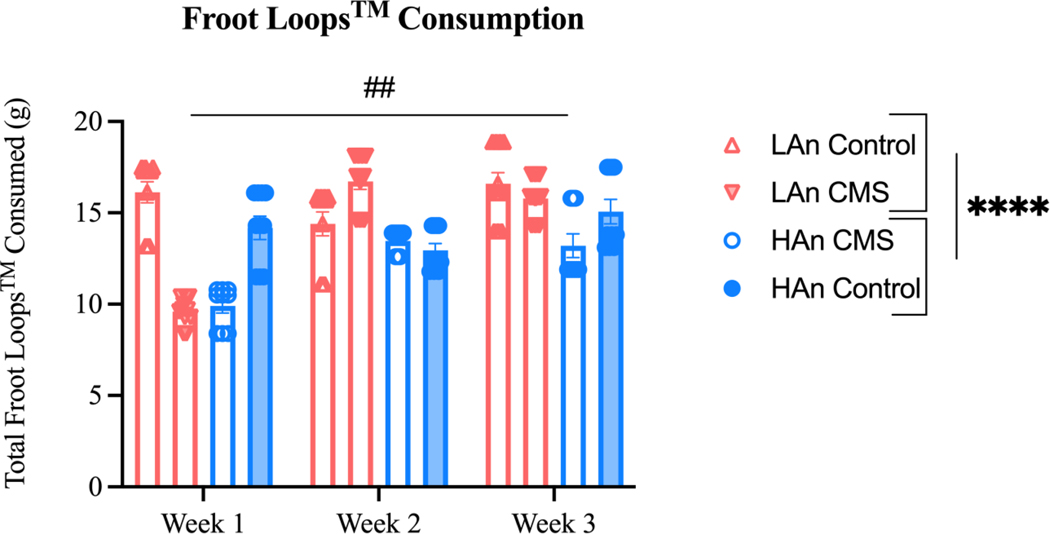
Figure 5. Froot Loops™ Consumption across CMS Treatment.
Scatter bar plots depict a three-way mixed ANOVA. Data are represented as total Froot Loops™ consumption ±SEM. A three-way mixed ANOVA (N=41) revealed HAn animals differed from LAn counterparts [F (1, 111) = 34.63; ****p<0.0001], and an interaction effect across all three factors [F (2, 111) = 4.426; ##p=0.0141].
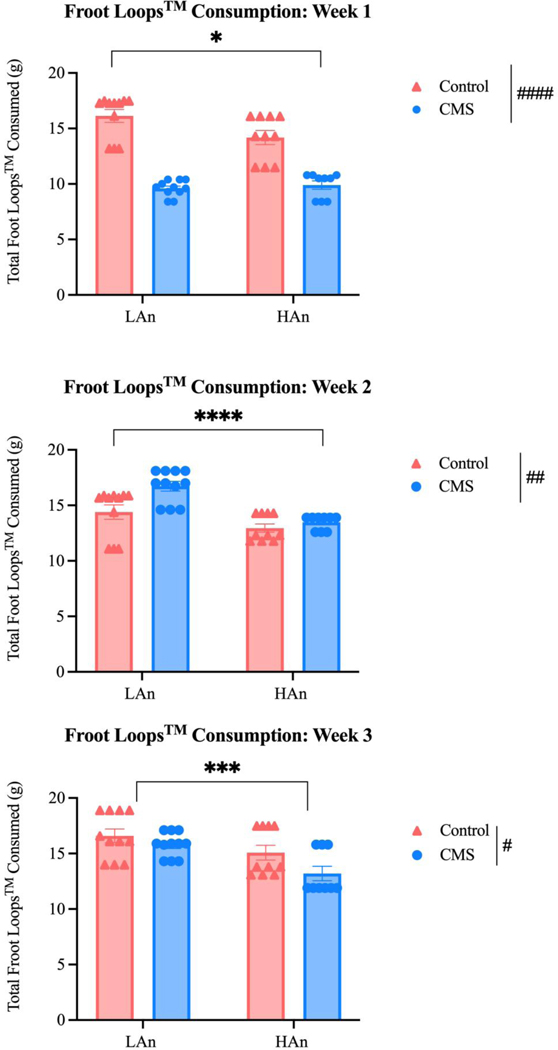
Sweet food consumption changed across the duration of the experiment for all animals (main effect of time: F (2, 111) = 29.57; p<0.0001). Overall, total Froot Loops™ consumption differed between HAn and LAn rats (main effect of trait: F (1, 111) = 34.63; p<0.0001) and CMS and Control animals (main effect of treatment: F (1, 111) = 35.96; p<0.0001). We observed the following means ±SEMs: LAn Control = 15.71±0.67, LAn CMS = 14.03±2.24, HAn Control = 14.07±0.62, HAn CMS = 12.19±1.15). Of interest, sweet food consumption changed as a function of time, trait phenotype, and CMS treatment (time X trait x treatment interaction effect: F (2, 111) = 4.426; p=0.0141). To further explore this three-way interaction, we conducted a series of two-way ANOVAs (Figure 6) on total Froot Loops™ consumption (g) per CMS week to examine phenotypic differences. At Week 1, HAn and LAn CMS rats consumed less Froot LoopsTM than HAn and LAn control rats (trait X treatment interaction effect: F (1, 37) = 5.379; p=0.026) and CMS rats consumed less Froot Loops™ than control rats (main effect of treatment: F (1, 37) = 124.2; p<0.0001). No significant trait differences were found at baseline. In Week 2, a trait difference emerged, where HAn rats consumed less than LAn rats (main effect of Trait: F (1, 37) = 24.80; p<0.0001). Interestingly, CMS animals consumed more than control animals (main effect of treatment: F (1, 37) = 9.022; p=0.0048) at Week 2. By Week 3 of CMS, HAn animals continued to consume less Froot Loops™ than LAn counterparts (main effect of trait: F (1, 37) = 12.71; p=0.001) and CMS animals consumed less than control animals (main effect of treatment: F (1, 37) = 5.429; p=0.025).
Figure 6. Froot Loops™ Consumption per CMS Week.
Scatter plots (A-C) that depict a series of two-way ANOVAs (N=41) reflecting total Froot Loops™ consumption (g) per CMS week to examine potential phenotypic differences. (A) Week one analyses revealed that HAn/LAn CMS rats consumed less Froot Loops™ than HAn/LAn control rats [F (1, 37) = 5.379; p=0.026] and consumption differed for CMS and control animals [F (1, 37) = 124.2; ####p<0.0001]. (B) One week post CMS, HAn rats consumed less Froot LoopsTM than LAn rats [F (1, 37) = 24.80; p<0.0001] and CMS animals continued to differ from control counterparts [F (1, 37) = 9.022; ##p=0.0048]. At the start of the final week of CMS, HAn rats consumed less Froot LoopsTM than LAn rat [F (1, 37) = 12.71; ***p=0.001] and CMS and control animals’ sweet food consumption remained different [F (1, 37) = 5.429; #p=0.025].
3.4. Weight, Fur Piloerection, and Grooming
3.4.1. Weight
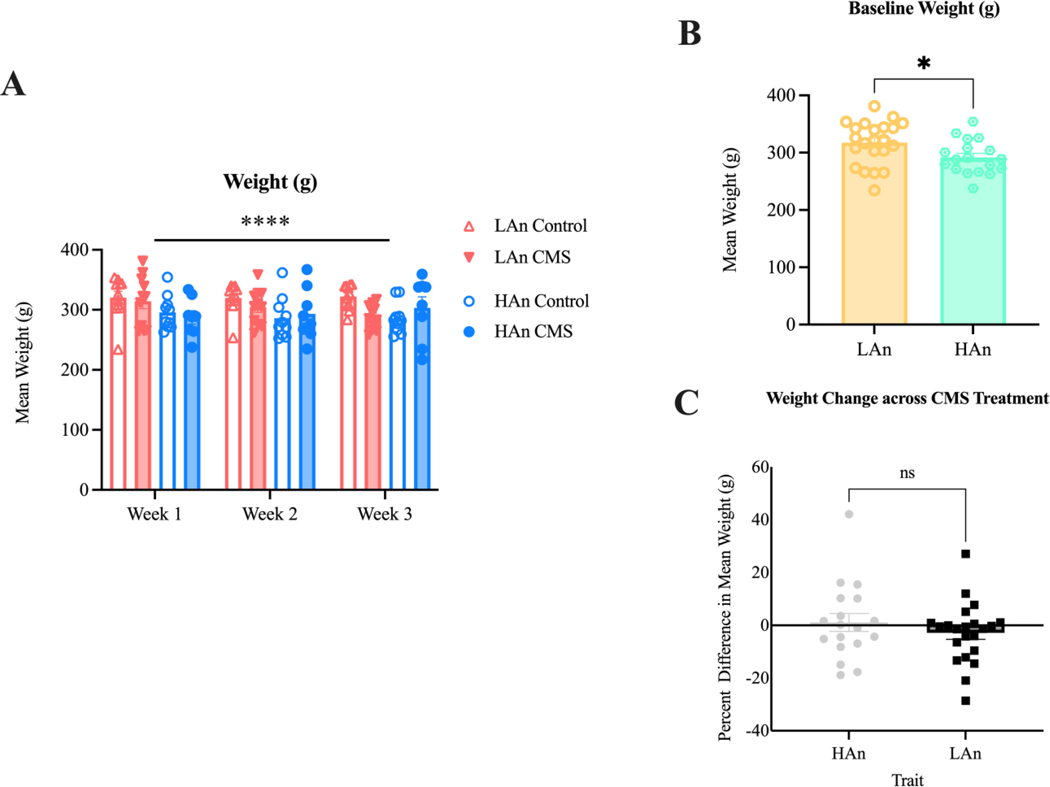
Body weight (Figure 7) was analyzed using a 2 (Trait Anxiety: LAn/HAn) X 2 (Treatment: control or CMS) X 3 (Time: CMS weeks 1,2,3) mixed ANOVA design. Only some data were captured, and GraphPad Prism dropped these missing data points for analysis. To delineate any trait differences between baseline or week three weights, an unpaired Welch’s t-test was performed on HAn and LAn animals’ weights and each group’s percent difference in weight change from baseline to week three. Data are represented as mean weight (g) and percent difference in weight change ±SEM. The mean and SEM for group weights were as follows: (Week 1) LAn Control = 320.5±10.35, LAn CMS = 314.53±12.72, HAn Control = 295.56±8.99, HAn CMS = 287.93±11.25 with eta squared=0.14; (Week 2) LAn Control = 319.69±7.46, LAn CMS = 304.45±8.81, HAn Control = 286.10±10.83, HAn CMS = 292.94±15.42 with eta squared=0.12; (Week 3) LAn Control = 322.06±6.21, LAn CMS = 288.28±6.15, HAn Control = 285.91±8.13, HAn CMS = 302.84±18.51 with eta squared=0.04.
Figure 7. Mean Weight (g) across CMS Treatment.
Pictured are bar graphs with scatter plots representing mean weight (g) data (A-C). Data are represented as mean weight (g) and percent difference in weight change ±SEM. (A) A three-way mixed ANOVA (N=41) indicated that HAn animals weighed less than LAn animals overall [F (1, 108) = 10.83; ***p=0.0013]. (B) Mean weight (g) values collapsed across treatment and time to examine trait differences. At baseline, HAn rats weighed less than LAn rats (t=2.428, df=37.94; *p=0.02). (C) Percent difference in weight change between weeks one and three. HAn and LAn animals did not differ in their weight change from baseline to week 1 (t=0.9472, df=32.05; p=0.29).
In general, HAn females weighed less than LAn counterparts (main effect of Trait: (F (1, 108) = 10.83; p=0.0013; HAn, LAn). To explore the nature of this effect, we conducted Welch’s unpaired t-tests for (1) baseline weights (Week 1: LAn) and (2) percent difference in weight change between baseline and the start of CMS week three. No main treatment effect was found; data were collapsed across treatments to highlight any trait differences. HAn weighed less than LAn rats prior to the start of CMS t=2.428, df=37.94; p=0.02) (Figure 7B); however, HAn and LAn lines did not differ in their percent weight change from baseline to CMS week three (t=0.9472, df=32.05; p=0.29) (Figure 7C). The eta squared for percent difference in weight was (Week 1) 0.09; (Week 2) 0.02, (Week 3) 0.23.
3.4.2. Fur Piloerection
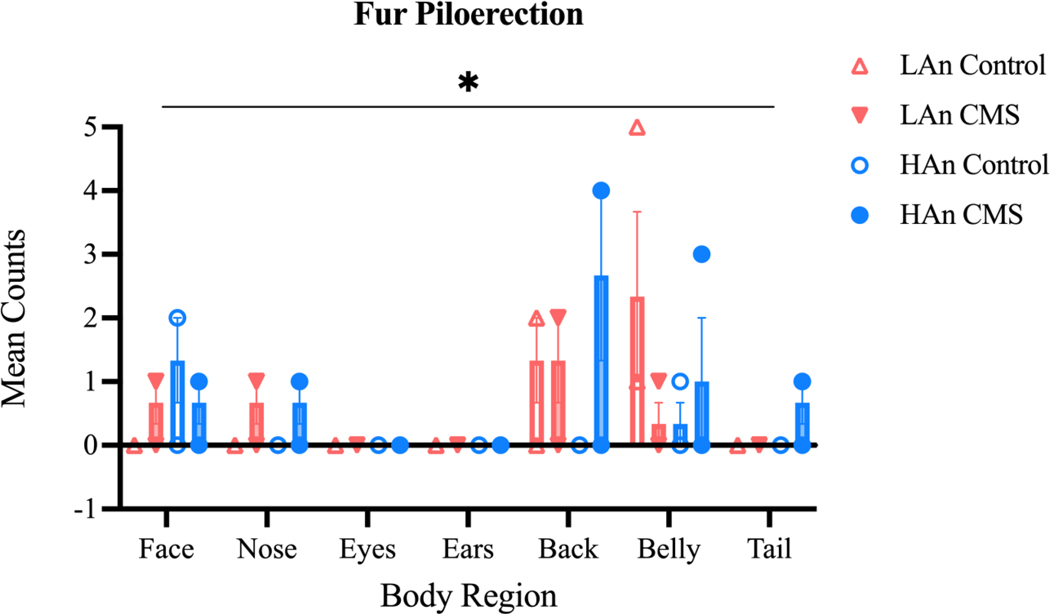
Fur piloerections mean values (Figure 8) were analyzed using a 2 (Trait) X 2 (Treatment) X 7 (Body Region) ANOVA. Fur piloerection differed across the seven body regions (main effect of region: F (6, 56) = 4.511; p=0.0009) and piloerection counts differed as a function of trait phenotype, CMS treatment, and body region (Body Region X Trait X CMS Treatment effect: F (6, 56) = 2.333; p=0.0442). To evaluate any trait phenotype differences embedded within this interaction, mean counts per experimental group were collapsed across treatment and time. A 2 (Trait) X 7 (Body Region) ANOVA revealed that mean counts differed across body region only (main region effect: F (6,6) = 6.548; p=0.02), with no statistically significant difference between HAn and LAn animals.
Figure 8. Number and Mean Number of Piloerections across CMS Treatment.
Graphs with scatter plots representing fur piloerection counts. Data are represented as the mean number of counts ±SEM. A three-way ANOVA (N=39) showed a significant interaction between trait phenotype, CMS treatment group, and body region [F (6, 56) = 2.333; *p=0.0442].
3.4.3. Grooming
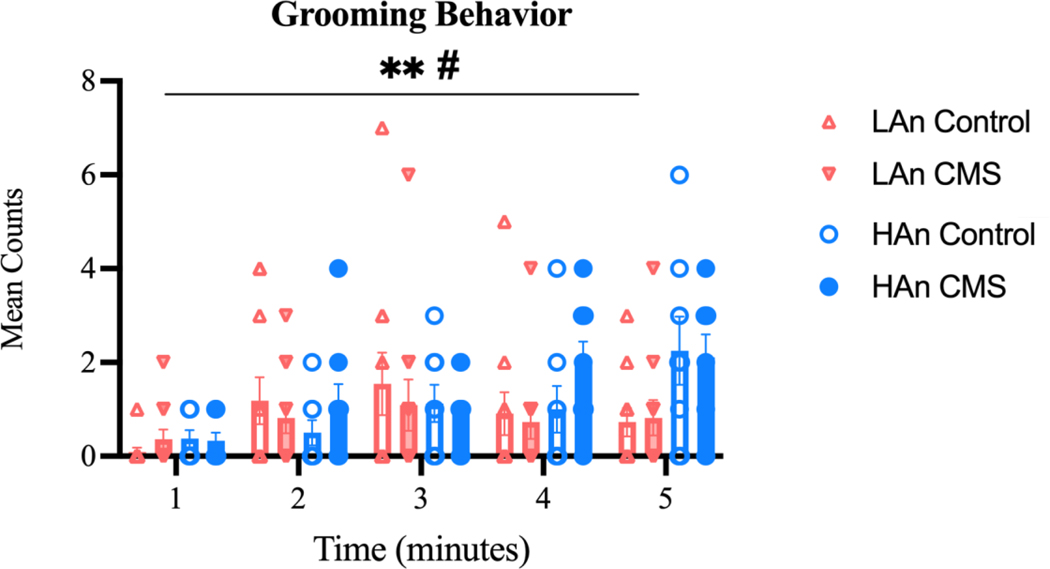
Across all experimental groups, grooming counts (Figure 9) changed over the five-minute test (main effect of grooming: F (4, 175) = 4.446; p=0.0019). Further, HAn and LAn rats differed in their grooming behavior at points during the five-minute test (interaction effect of grooming and Trait: F (4, 175) =2.826; p=0.0264). Group means were: LAn Control = 0.89±0.24, LAn CMS = 0.76±0.12, HAn Control = 1.05±0.33, HAn CMS = 1.29±0.34. Tukey’s multiple comparison tests did not yield statistically significant results; however, two sets of groups approached a statistically significant difference, such that: LAn control rats’ counts during the first minute of the test differed from HAn control rats (q=5.034, df=175; p=0.0564) and HAn CMS rats (q=4.87, df=175; p=0.0793) during the final minute of the test.
Figure 9. Number of Grooming Behavior Counts.
Scatter plots representing grooming behavior counts across a five-minute test interval. Data are represented as the number of counts ±SEM. Grooming counts changed over time [F (4, 175) = 4.446; **p=0.0019]. Further, HAn and LAn rats differed in their grooming counts over time [F (4, 175) =2.826; #p=0.0264].
3.5. Plasma E2 Concentrations
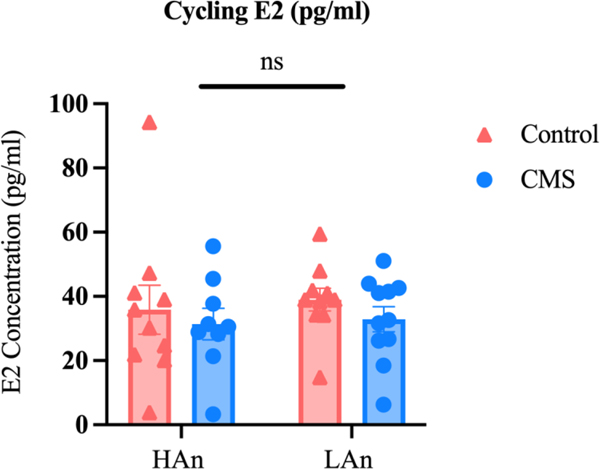
Plasma E2 data are reported as concentration levels (pg/ml) +- SEM and were analyzed using a 2 (Trait: HAn, LAn) X 2 (Treatment: CMS, Control) ANOVA (Figure 10). Exposure to a three-week CMS treatment did not confer differential E2 concentrations between HAn and LAn females nor CMS and control rats one month following CMS (no significance for trait and treatment factors nor interaction effects). Overall, we observed the following means and ±SEMs: LAn Control = 39.0±3.56, LAn CMS = 32.91±3.92, HAn Control = 35.85±7.61, HAn CMS = 31.38±4.9.
Figure 10. Estradiol Concentrations One-Month Post CMS.
Bar graphs with scatter plots representing the levels of cycling E2 at the time of animal sacrifice. A two-way ANOVA revealed that cycling E2 levels (pg/ml) did not differ between Trait and treatment one month following CMS.
3.6. Immunohistochemistry
To evaluate c-Fos and 5HT1AR protein expression (Figure 11) in the PVN, counts were averaged from four animals per group (N=16) using both the left and right hemispheres. This is not a large N and thus, is a limitation for the current work. We had the following IR cell counts ±SEM: c-Fos expression in the PVN: LAn Control = 25.0±2.12, LAn CMS = 16.27±2.18, HAn Control = 14.0±1.30, HAn CMS = 40.64±4.18. Coronal sections of the rat brain were microsections between −1.80 and −1.90, the third ventricle was visualized, and the PVN was located about 0.5 mm from the midline, lateral to the 3V. IR counts differed for CMS and control animals (main effect of treatment: F (1,46) = 10.55; p=0.002) and HAn rats expressed more c-Fos than LAn animals overall (main effect of trait: F (1,46) = 6.53; p=0.014). Further, c-Fos expression was the highest in HAn CMS rats (Šídák’s multiple comparisons test: p<0.0001). 5HT1AR protein expression differed between CMS and control animals (main effect of treatment: F (1,47) = 19.10; p<0.0001), and 5HT1AR protein expression was highest in HAn CMS rats (Šídák’s multiple comparisons test: p<0.0001). Representative images are provided in Figure 12.
4. Discussion
The current data support the ninth generation (F8) of outbred female HAn/LAn lines bred at the University of Massachusetts Boston showing comparable ALB to their parental lines. Further, HAn and LAn rats phenotyped from the F8 generation exhibited differential DLS across a three-week CMS regimen. Specifically, two FSTs, one before (FST1) and one after (FST2) CMS treatment, were used to assess coping strategies, and as a proxy for DLS, we assessed Froot Loops™ consumption, weight, fur piloerection, and grooming behavior. Trait phenotype conferred differences in FST mobility behavior, sweet food consumption, immediate early gene (c-Fos) and 5-HT1AR expression in the PVN.
4.1. Implications of FST: Interpretation is Key
We assessed initial FST mobility responses after a five-minute exposure one to two days before the onset of the CMS protocol (FST1) and then one to two days following a three-week CMS (FST2). We recognize that there are limitations to a test-retest protocol in the FST as it was designed for a single exposure. The second test could impact the ability of the FST to serve as a stressor due to familiarity with the test (Bardi et al., 2012). Mezadri et al. (2011) found that the latency to be immobile decreased across re-tests while the duration (time) increased when animals were tested 1week and 2-weeks later. Thus, our findings with the FST2 should be interpreted with caution. Here, we were also interested in determining coping strategies in the 5-min FST exposures, recognizing that there may be limitations to the test in general and that, as construed initially, the FST was not thought of as a measure of depression-like symptoms.
Thus, HAn animals engaged in active coping strategies, which may typically be an index of low depression like responding since immobility can be modulated by antidepressant drug treatment and is consequently employed as an index of the drug’s clinical efficacy and capacity to reverse DLS (Porsolt et al., 1978; Slattery & Cryan, 2012; Possamai et al., 2015). In most FST protocols, a stressor is given, and the impact on the FST is assessed. However, adapting this test in the current study with the FST probe prior to any manipulation should be interpreted with caution, especially since it is also suggested that floating may be adaptive and not necessarily an index of depression (Molendijk & de Kloet, 2015).
Our behavioral findings are in opposition to those found in high (HAB) and low anxiety behavior (LAB) ALB inbred lines (Landgraf & Wigger, 2002), underscoring key experimental differences. Notably, the high/low ALB animal lines are inbred, while our HAn/LAn lines are outbred (i.e., unrelated mating pairs). Presently, we tested the animals on two separate occasions. The familiarity with the test could have certainly impacted the behavioral responses and diminished the stress-inducing effects (Bardi et al., 2012). The current discrepancies found in FST highlight patterns of inconsistencies reported in the FST literature (Molendijk & de Kloet, 2015). These discrepancies are arguably attributed to varied interpretations of FST outcomes (Pollak, Rey, and Monje, 2010) and the role of personality traits in emotionality, as the current study aims to evaluate.
4.2. CMS-induced DLS
After a week of chronic stress exposure, HAn rats ate less Froot Loops™ than LAn rats, which continued after two weeks of CMS treatment. This palatable food paradigm (i.e., consumption f Froot Loops™) has been validat4d previously and used as a measure of anhedonia in rodent models (Dandekar et al., 2019). HAn CMS rats consumed the least amount of Froot Loops™ of all groups after two weeks of CMS exposure (Figure 6C), suggesting differential DLS likely due to the influence of trait anxiety phenotype. Fur piloerection is a proxy for distress behavior, and no trait differences were observed in the mean number of fur piloerection counts across the seven body regions (Figure 8). Thus, our CMS model reduced sweet food consumption but did not impact grooming behavior in HAn lines indicating greater sensitivity to some effects of CMS and promoting adaptation or resilience to others. In our hands and others, early life stress has been shown to improve pup outcomes, including reducing anxiety-like behavior (Berman, Lot, and Donaldson 2014), promoting growth, and protecting against harm (Carrera et al., 2009; Pryce & Feldon, 2003). Furthermore, HAn and LAn lines are not typical animals, and thus, it is likely that responses to the CMS are not as expected in these extreme anxiety lines. In our hands, and that of other colleagues, extreme inbred/outbred phenotypes can be modified (i.e., to be more normative) to approach each other after manipulations such as maternal separation (Berman, Lott, Donaldson, 2014; Meaney), environmental enrichment (EE) (Ravenelle et al. 2014a, 2014b; Sotnikov et al., 2014) and CMS (Sotnikov et al., 2014). In fact, in their title and interpretation of the impact of EE and CMS on their HAB/LAB lines, Sotnikov and colleagues (2014) suggest there is a “bidirectional rescue” of these extreme phenotypes. Our current data also support this since HAn lines got “better” across the CMS protocol (i.e., in terms of weight gain and mobility in the FST).
4.3. Effects of CMS and Trait Phenotype on Cycling E2 Activity
One month following the end of CMS, blood plasma was collected and analyzed for circulating E2 activity. No trait nor treatment differences were found for plasma E2 levels. It is important to note that the plasma assay occurred one month after CMS terminated and, as such, reflects only the potential chronic effects of CMS on E2 levels. E2 concentration was not measured during or immediately after CMS. Exploring the acute effects of CMS and anxiety-like phenotypes would be advantageous and should be centered in future research. Indeed, DLS-induced changes to hormonal regulation are well documented in animals (Dalla et al., 2005; Dalla et al., 2008) and clinical models (Jacobs et al., 2015).
4.4. CMS differentially affects c-Fos and 5HT1AR Expression in the PVN
CMS-induced differential immediate early gene (c-Fos) and 5HT1AR expression in the PVN of the hypothalamus. Overall, HAn rats expressed more c-Fos than LAn rats, and HAn CMS rats expressed the most c-Fos. HAn animals did not differ from LAn counterparts in 5-HT1AR expression; however, the difference did trend towards significance (p=0.08), and HAn CMS rats expressed the most 5-HT1AR in the PVN.
These results are similar to increased hypothalamic c-Fos expression patterns reported in HAB/LAB animals treated with and without antidepressants (Muigg et al., 2007). Additionally, any conferred effect of trait phenotype on CMS-induced behavior may be regulated through mechanisms than those highlighted by immediate early gene changes in regions implicated in stress responses. For example, factors influencing synaptic plasticity (Żurawek et al., 2013), neurotrophic activity (Taliaz et al., 2011), morphology (Tornese et al., 2019), neurogenesis (Anacker et al., 2018), and downstream effectors of immediate early genes (Waung et al., 2008). Acute and chronic stressors also trigger a variety of time-dependent neurobehavioral (Sterrenburg et al., 2012; Wall, Fischer, & Bland, 2012), neuroendocrine (Brunton & Russel, 2010), neuroimmune (Frank et al., 2013; Hodes et al., 2014), and epigenetic (Sterrenburg et al., 2011; Saunderson et al., 2016) alterations in the rat brain that could be involved in DLS. Moreover, sex-differentiated responses centered around hypothalamic-pituitary-adrenal axis sensitivity exist (Brunton et al., 2011; Kudwa et al., 2014) and highlight the importance of using females in stress and mood experimental models. The findings highlight that HAn female rats exposed to CMS display unique DLS, including increased mobility in the FST, decreased sweet food consumption, initial weight gain, and c-Fos activity. Future work should further examine the intersection of biological factors (e.g., age, stage of estrous activity, sex) and chronic stress on behavior, phenotypic expression, and neural changes in brain regions important for anxiety and depression-like behaviors.
Acknowledgements
The authors thank Elizabeth Boates, Rebecca Ravenelle, and Mitzi Sweeney for assistance with animal maintenance and husbandry, technical help, and support with behavioral testing. Further, the authors thank Allison Parenti for assistance with data visualization. This research was supported by National Institute on Minority Health and Health Disparities Gant # 1P20MD002290 (Pilot Grant PI, TD; PI Celia Moore). The content is solely the responsibility of the authors and does not necessarily represent the official views of the National Institute on Minority Health and Health Disparities or the National Institutes of Health.
Funding
This research was supported by National Institute on Minority Health and Health Disparities Gant # 1P20MD002290 (Pilot Grant PI, TD; PI Celia Moore). The content is solely the responsibility of the authors and does not necessarily represent the official views of the National Institute on Minority Health and Health Disparities or the National Institutes of Health.
Abbreviations
- ALB
anxiety-like behavior
- ANOVA
analysis of variance
- CA
closed arm
- DAB
3-,5- diaminobenzidine
- DLS
depression-like symptoms
- EPM
elevated plus maze
- F0
filial zero (parental line)
- F8
(filial 8; 9th generation)
- FST
forced swim test
- 5-HT1A
5-hydroxytryptamine 1A
- 5HT1AR
5-hydroxytryptamine 1A receptor
- HAB
high anxiety-like behavior
- HAn
high anxiety-like behavior
- IACUC
Institutional Animal Care and Use Committee
- IHC
immunohistochemistry
- LAB
low anxiety-like behavior
- LAn
low anxiety-like behavior
- MDD
major depressive disorder
- NaPBS
sodium phosphate-buffered saline
- OA
open arm
- RO
reverse osmosis
- ™
trademark
Footnotes
Conflicts of Interest:
The authors confirm that “The authors declare that the research was conducted in the absence of any commercial or financial relationships that could be construed as a potential conflict of interest.”
Contribution to the field
Depressive disorders are common and present a set of health issues characterized as a global disease burden. Depression and anxiety disorders often co-occur in clinical populations, and women have an increased comorbid risk of development for both disorders. The underlying biological influences of these comorbid disorders can be further examined using validated psychiatric animal models. Here, we demonstrate that in the ninth generation of selectively outbred extreme trait anxious female Long-Evans rats, repeated exposure to chronic mild stress (CMS) confers differential adaptation to mobility strategies in the forced swim test. Accordingly, repeated CMS exposure increased c-Fos (a proxy for neural activation) and serotonin 1A receptor (5HT1AR) expression in the paraventricular nucleus of the hypothalamus for HAn females. Taken together, repeated CMS exposure may act as an environmental challenge to influence FST mobility responses in HAn females, and changes to the hypothalamic 5HT1AR system may influence this behavioral shift.
CRediT authorship contribution statement
Author STD acquired funding/resources and conceptualized the study/methodology. Authors CL, CAC, STD supervised and managed project administration. Authors STD, CAC, CL, HB, VL conducted investigation. Authors CL, VL, HB conducted formal analyses. Authors STD, CAC, CL, HB, VL conducted data analyses, prepared graphs. Authors CL, CAC, STD developed original draft of manuscript. Authors CAC, STD prepared visualization of manuscript. Authors CAC, STD revised and edited manuscript.
Publisher's Disclaimer: This is a PDF file of an unedited manuscript that has been accepted for publication. As a service to our customers we are providing this early version of the manuscript. The manuscript will undergo copyediting, typesetting, and review of the resulting proof before it is published in its final form. Please note that during the production process errors may be discovered which could affect the content, and all legal disclaimers that apply to the journal pertain.
References
- Asher M, Asnaani A, & Aderka IM (2017). Gender differences in social anxiety disorder: A review. Clinical psychology review, 56, 1–12. [DOI] [PubMed] [Google Scholar]
- Asher M, & Aderka IM (2018). Gender differences in social anxiety disorder. Journal of Clinical Psychology, 74(10), 1730–1741. [DOI] [PubMed] [Google Scholar]
- Altemus M, Sarvaiya N, & Epperson CN (2014). Sex differences in anxiety and depression clinical perspectives. Frontiers in neuroendocrinology, 35(3), 320–330 [DOI] [PMC free article] [PubMed] [Google Scholar]
- Azizi-Malekabadi H, Pourganji M, Zabihi H, Saeedjalali M, & Hosseini M. (2015). Tamoxifen antagonizes the effects of ovarian hormones to induce anxiety and depression-like behavior in rats. Arquivos de neuro-psiquiatria, 73(2), 132–139. [DOI] [PubMed] [Google Scholar]
- Baker SL, Kentner AC, Konkle A, Santa-Maria Barbagallo L, & Bielajew C. (2006). Behavioral and physiological effects of chronic mild stress in female rats. Physiology & behavior, 87(2), 314–322. [DOI] [PubMed] [Google Scholar]
- Bardi M, Rhone AP, Franssen CL, Hampton JE, Shea EA, Hyer MM, Huber J. & Lambert KG (2012) Behavioral training and predisposed coping strategies interact to influence resilience in male Long-Evans rats: Implications for depression, Stress, 15:3, 306–317, DOI: 10.3109/10253890.2011.623739 [DOI] [PubMed] [Google Scholar]
- Bellido I, Gomez-Luque A, Garcia-Carrera P, Rius F, & de la Cuesta FS (2003). Female rats show an increased sensibility to the forced swim test depressive-like stimulus in the hippocampus and frontal cortex 5-HT1A receptors. Neuroscience letters, 350(3), 145–148. [DOI] [PubMed] [Google Scholar]
- Berman AK, Lott R, Donaldson ST (2014). Periodic maternal deprivation may modulate offspring anxiety-like behavior through mechanisms involving neuroplasticity in the amygdala. Brain Research Bulletin, pp. 101, 7-11 [DOI] [PMC free article] [PubMed] [Google Scholar]
- Borsini F, & Meli A. (1988). Is the forced swimming test a suitable model for revealing antidepressant activity? Psychopharmacology, 94(2), 147–160. [DOI] [PubMed] [Google Scholar]
- Brady EU, & Kendall PC (1992). Comorbidity of anxiety and depression in children and adolescents. Psychological Bulletin, 111(2), 244. [DOI] [PubMed] [Google Scholar]
- Butts KA, Weinberg J, Young AH, Phillips AG (2011). Glucocorticoid receptors in the prefrontal cortex regulate stress-evoked dopamine efflux and aspects of executive function. Proc. Natl. Acad. Sci. U.S.A, 108(45), 18459–18464. [DOI] [PMC free article] [PubMed] [Google Scholar]
- Carrera O, Cerrato M, Sanchez A, Gutierrez E, 2009. Long maternal separation has protective effects in rats exposed to activity-based anorexia. Developmental. Psychobiology 51, 616–624. [DOI] [PubMed] [Google Scholar]
- Christiansen DM (2015). Examining sex and gender differences in anxiety disorders. A fresh look at anxiety disorders, 17–49. [Google Scholar]
- Ciobica A, Hritcu L, Padurariu M, Dobrin R, & Bild V. (2010). Effects of serotonin depletion on behavior and neuronal oxidative stress status in rat: relevance for anxiety and affective disorders. Advances in Medical Sciences, 55(2), 289–296. [DOI] [PubMed] [Google Scholar]
- Cohen JL, Ata AE, Jackson NL, Rahn EJ, Ramaker RC, Cooper S, … & Clinton SM (2017). Differential stress induced c-Fos expression and identification of region-specific miRNA-mRNA networks in the dorsal raphe and amygdala of high-responder/low-responder rats. Behavioural Brain Research, 319, 110–123. [DOI] [PMC free article] [PubMed] [Google Scholar]
- Connor TJ, McNamara MG, Finn D, Currid A, O’Malley M, Redmond AM, … & Leonard BE (1998). Acute 3, 4-methylenedioxymethamphetamine (MDMA) administration produces a rapid and sustained suppression of immune function in the rat. Immunopharmacology, 38(3), 253–260. [DOI] [PubMed] [Google Scholar]
- Cummings CM, Caporino NE, & Kendall PC (2014). Comorbidity of anxiety and depression in children and adolescents: 20 years after. Psychological Bulletin, 140(3), 816. [DOI] [PMC free article] [PubMed] [Google Scholar]
- Dalla C, Antoniou K, Drossopoulou G, Xagoraris M, Kokras N, Sfikakis A, & Papadopoulou-Daifoti Z. (2005). Chronic mild stress impact: are females more vulnerable? Neuroscience, 135(3), 703–714. [DOI] [PubMed] [Google Scholar]
- Dandekar MP, Saxena A, Scaini G. et al. (2019). Medial Forebrain Bundle Deep Brain Stimulation Reverses Anhedonic-Like Behavior in a Chronic Model of Depression: Importance of BDNF and Inflammatory Cytokines. Mol Neurobiol 56, 4364–4380. 10.1007/s12035018-1381-5 [DOI] [PubMed] [Google Scholar]
- Depoortère R, Papp M, Gruca P, Lason-Tyburkiewicz M, Niemczyk M, Varney MA, & Newman-Tancredi A. (2019). Cortical 5-hydroxytryptamine 1A receptor biased agonist, NLX-101, displays rapid-acting antidepressant-like properties in the rat chronic mild stress model. Journal of Psychopharmacology, 33(11), 1456–1466. [DOI] [PubMed] [Google Scholar]
- Duncko R, Brtko J, Kvetnanský R, & Jezová D. (2001). Altered function of peripheral organ systems in rats exposed to chronic mild stress model of depression. Cellular and Molecular Neurobiology, 21(4), 403–411. [DOI] [PMC free article] [PubMed] [Google Scholar]
- Dunčko R, Kiss A, Škultétyová I, Rusnák M, & Ježová D. (2001). Corticotropin-releasing hormone mRNA levels in response to chronic mild stress rise in male but not in female rats while tyrosine hydroxylase mRNA levels decrease in both sexes. Psychoneuroendocrinology, 26(1), 77–89. [DOI] [PubMed] [Google Scholar]
- Eley TC, Sugden K, Corsico A, Gregory AM, Sham P, McGuffin P, … & Craig IW (2004). Gene-environment interaction analysis of serotonin system markers with adolescent depression. Molecular Psychiatry, 9(10), 908–915. [DOI] [PubMed] [Google Scholar]
- Elgarf ASA, Aboul-Fotouh S, Abd-Alkhalek HA, El Tabbal M, Hassan AN, Kassim SK, … & Abdel-Tawab AM (2014). Lipopolysaccharide repeated challenge followed by chronic mild stress protocol introduces a combined model of depression in rats: reversibility by imipramine and pentoxifylline. Pharmacology Biochemistry and Behavior, 126, 152–162. [DOI] [PubMed] [Google Scholar]
- Farhan M, & Haleem DJ (2016). Anxiolytic profile of fluoxetine as monitored following repeated administration in an animal rat model of chronic mild stress. Saudi Pharmaceutical Journal, 24(5), 571–578. [DOI] [PMC free article] [PubMed] [Google Scholar]
- Ferreira R, Brandão ML, & Nobre MJ (2016). 5-HT1A receptors of the prelimbic cortex mediate the hormonal impact on learned fear expression in high-anxious female rats. Hormones and Behavior, 84, 84–96. [DOI] [PubMed] [Google Scholar]
- Fort P, & Jouvet M. (1990). Iontophoretic application of unconjugated cholera toxin B subunit (CTb) combined with immunohistochemistry of neurochemical substances: a method for transmitter identification of retrogradely labeled neurons. Brain Research, 534(1–2), 209–224. [DOI] [PubMed] [Google Scholar]
- Flandreau EI, Ressler KJ, Owens MJ, & Nemeroff CB (2012). Chronic overexpression of corticotropin-releasing factor from the central amygdala produces HPA axis hyperactivity and behavioral anxiety associated with gene-expression changes in the hippocampus and paraventricular nucleus of the hypothalamus. Psychoneuroendocrinology, 37(1), 27–38. [DOI] [PMC free article] [PubMed] [Google Scholar]
- Flint AJ (1994). Epidemiology and comorbidity of anxiety disorders in the elderly. The American Journal of Psychiatry. [DOI] [PubMed] [Google Scholar]
- Frank E, Salchner P, Aldag JM, Salomé N, Singewald N, Landgraf R, & Wigger A. (2006). Genetic predisposition to anxiety-related behavior determines coping style, neuroendocrine responses, and neuronal activation during social defeat. Behav Neurosci, 120(1), 60. [DOI] [PubMed] [Google Scholar]
- Galea LAM, McEwen BS, Tanapat P, Deak T, Spencer RL, & Dhabhar FS (1997). Sex differences in dendritic atrophy of CA3 pyramidal neurons in response to chronic restraint stress. Neuroscience, 81(3), 689–697. [DOI] [PubMed] [Google Scholar]
- Genazzani AR, Petraglia F, Ramundo BM, Genazzani AD, Amato F, Algeri I, … & Bidzinska B. (1991). Neuroendocrine Correlates of Stress-Related Amenorrhea. Annals of the New York Academy of Sciences, 626(1), 125–129. [DOI] [PubMed] [Google Scholar]
- Gorwood P. (2004). Generalized anxiety disorder and major depressive disorder comorbidity: an example of genetic pleiotropy? European Psychiatry, 19(1), 27–33. [DOI] [PubMed] [Google Scholar]
- Grant BF, Hasin DS, Stinson FS, Dawson DA, Ruan WJ, Goldstein RB, … & Huang BOJI (2005). Prevalence, correlates, co-morbidity, and comparative disability of DSM-IV generalized anxiety disorder in the USA: results from the National Epidemiologic Survey on Alcohol and Related Conditions. Psychological Medicine -London, 35(12), 1747. [DOI] [PubMed] [Google Scholar]
- Hasin DS, Sarvet AL, Meyers JL, Saha TD, Ruan WJ, Stohl M, & Grant BF (2018). Epidemiology of adult DSM-5 major depressive disorder and its specifiers in the United States. JAMA psychiatry, 75(4), 336–346. [DOI] [PMC free article] [PubMed] [Google Scholar]
- Holmes A, Yang RJ, Lesch KP, Crawley JN, & Murphy DL (2003). Mice lacking the serotonin transporter exhibit 5-HT1A receptor-mediated abnormalities in tests for anxiety-like behavior. Neuropsychopharmacology, 28(12), 2077–2088. [DOI] [PubMed] [Google Scholar]
- Hrdina PD, Demeter E, Vu TB, Sotonyi P, Palkovits M. 5-HT uptake sites and 5-HT2 receptors in brain of antidepressant-free suicide victims/depressives: increase in 5-HT2 sites in cortex and amygdala. Brain Res 1993; 614: 37–44. [DOI] [PubMed] [Google Scholar]
- Hrdina PD, Bakish D, Chudzik J, Ravindran A, Lapierre YD. Serotonergic markers in platelets of patients with major depression: upregulation of 5-HT2 receptors. J Psychiatry Neurosci 1995; 20: 11–19. [PMC free article] [PubMed] [Google Scholar]
- Kendler KS, Gardner CO, Gatz M, & Pedersen NL (2007). The sources of co-morbidity between major depression and generalized anxiety disorder in a Swedish national twin sample. Psychological Med, 37(3), 453. [DOI] [PubMed] [Google Scholar]
- Kessler RC, & Wang PS (2002). Epidemiology of depression. Handbook of Depression, 23–42. [Google Scholar]
- Kessler RC, Berglund P, Demler O, Jin R, Koretz D, Merikangas KR, … & Wang PS (2003). The epidemiology of major depressive disorder: results from the National Comorbidity Survey Replication (NCS-R). JAMA, 289(23), 3095–3105. [DOI] [PubMed] [Google Scholar]
- Kessler RC, Chiu WT, Demler O, & Walters EE (2005). Prevalence, severity, and comorbidity of 12-month DSM-IV disorders in the National Comorbidity Survey Replication. Archives of General Psychiatry, 62(6), 617–627. [DOI] [PMC free article] [PubMed] [Google Scholar]
- Kessler RC, Avenevoli S, Costello J, Green JG, Gruber MJ, McLaughlin KA, … & Merikangas KR (2012A). Severity of 12-month DSM-IV disorders in the national comorbidity survey replication adolescent supplement. Archives of General Psychiatry, 69(4), 381–389 [DOI] [PMC free article] [PubMed] [Google Scholar]
- Kessler RC, Petukhova M, Sampson NA, Zaslavsky AM, & Wittchen HU (2012B). Twelve-month and lifetime prevalence and lifetime morbid risk of anxiety and mood disorders in the United States. International Journal of Methods in Psychiatric Research, 21(3), 169–184. [DOI] [PMC free article] [PubMed] [Google Scholar]
- Kessler RC, & Bromet EJ (2013). The epidemiology of depression across cultures. Annual Review of Public Health, 34, 119–138. [DOI] [PMC free article] [PubMed] [Google Scholar]
- Kokras N, Dalla C, Sideris AC, Dendi A, Mikail HG, Antoniou K, & Papadopoulou-Daifoti Z. (2012). Behavioral sexual dimorphism in models of anxiety and depression due to changes in HPA axis activity. Neuropharmacology, 62(1), 436–445. [DOI] [PubMed] [Google Scholar]
- Landgraf R, & Wigger A. (2002). High vs low anxiety-related behavior rats: an animal model of extremes in trait anxiety. Behavior Genetics, 32(5), 301–314. [DOI] [PubMed] [Google Scholar]
- Landgraf R, & Wigger A. (2003). Born to be anxious: neuroendocrine and genetic correlates of trait anxiety in HAB rats. Stress: The International Journal on the Biology of Stress, 6(2), 111–119. [DOI] [PubMed] [Google Scholar]
- Lesch KP, Wiesmann M, Hoh A, Müller T, Disselkamp-Tietze J, Osterheider M, & Schulte HM (1992). 5-HT1A receptor-effector system responsivity in panic disorder. Psychopharmacology, 106(1), 111–117. [DOI] [PubMed] [Google Scholar]
- Liu B, Xu C, Wu X, Liu F, Du Y, Sun J, … & Dong J. (2015). Icariin exerts an antidepressant effect in an unpredictable chronic mild stress model of depression in rats and is associated with the regulation of hippocampal neuroinflammation. Neuroscience, 294, 193–205 [DOI] [PubMed] [Google Scholar]
- López-Figueroa AL, Norton CS, López-Figueroa MO, Armellini-Dodel D, Burke S, Akil H, … & Watson SJ (2004). Serotonin 5-HT1A, 5-HT1B, and 5-HT2A receptor mRNA expression in subjects with major depression, bipolar disorder, and schizophrenia. Biological psychiatry, 55(3), 225–233. [DOI] [PubMed] [Google Scholar]
- Lowther S, De Paermentier F, Cheetham SC, Crompton MR, Katona CL, & Horton RW (1997). 5-HT< sub> 1A Receptor binding sites in post-mortem brain samples from depressed suicides and controls. Journal of affective disorders, 42(2), 199–207. [DOI] [PubMed] [Google Scholar]
- Lu Y, Ho CS, Liu X, Chua AN, Wang W, McIntyre RS, & Ho RC (2017). Chronic administration of fluoxetine and pro-inflammatory cytokine change in a rat model of depression. PloS one, 12(10). [DOI] [PMC free article] [PubMed] [Google Scholar]
- MacKenzie G, & Maguire J. (2014). The role of ovarian hormone-derived neurosteroids on the regulation of GABA A receptors in affective disorders. Psychopharmacology, 231(17), 3333–3342. [DOI] [PMC free article] [PubMed] [Google Scholar]
- Marcondes FK, Bianchi FJ, & Tanno AP (2002). Determination of the estrous cycle phases of rats: some helpful considerations. Brazilian Journal of Biology, 62(4A), 609–614. [DOI] [PubMed] [Google Scholar]
- Mezardi TJ, Batista GM, Portes AC, Marino-Neto J, Lino-de-Oliveira C. (2011). Repeated rat-forced swim test: Reducing the number of animals to evaluate gradual effects of antidepressant. Journal of Neuroscience Methods 195, 200–205. [DOI] [PubMed] [Google Scholar]
- McLean CP, & Anderson ER (2009). Brave men and timid women? A review of the gender differences in fear and anxiety. Clinical psychology review, 29(6), 496–505. [DOI] [PubMed] [Google Scholar]
- McLean CP, Asnaani A, Litz BT, & Hofmann SG (2011). Gender differences in anxiety disorders: prevalence, course of illness, comorbidity and burden of illness. Journal of psychiatric research, 45(8), 1027–1035. [DOI] [PMC free article] [PubMed] [Google Scholar]
- Mineka S, Watson D, & Clark LA (1998). Comorbidity of anxiety and unipolar mood disorders. Annual review of psychology, 49(1), 377–412. [DOI] [PubMed] [Google Scholar]
- Marciniak M, Lage MJ, Landbloom RP, Dunayevich E, & Bowman L. (2004). Medical and productivity costs of anxiety disorders: case control study. Depression and Anxiety, 19(2), 112–120. [DOI] [PubMed] [Google Scholar]
- Mora S, Dussaubat N, & Díaz-Véliz G. (1996). Effects of the estrous cycle and ovarian hormones on behavioral indices of anxiety in female rats. Psychoneuroendocrinology, 21(7), 609–620. [DOI] [PubMed] [Google Scholar]
- Molendijk ML, & de Kloet ER (2015). Immobility in the forced swim test is adaptive and does not reflect depression. Psychoneuroendocrinology, 62, 389–391. [DOI] [PubMed] [Google Scholar]
- Morais M, Patrício P, Mateus-Pinheiro A, Alves ND, Machado-Santos AR, Correia JS, … & Bessa JM (2017). The modulation of adult neuroplasticity is involved in the mood-improving actions of atypical antipsychotics in an animal model of depression. Translational psychiatry, 7(6), e1146-e1146 [DOI] [PMC free article] [PubMed] [Google Scholar]
- Muigg P, Hoelzl U, Palfrader K, Neumann I, Wigger A, Landgraf R, & Singewald N. (2007). Altered brain activation pattern associated with drug-induced attenuation of enhanced depression-like behavior in rats bred for high anxiety. Biological psychiatry, 61(6), 782–796. [DOI] [PubMed] [Google Scholar]
- Mulvihill KG, & Brudzynski SM (2018). Non-pharmacological induction of rat 50 kHz ultrasonic vocalization: Social and non-social contexts differentially induce 50 kHz call subtypes. Physiology & Behavior, 196, 200–207. 10.1016/j.physbeh.2018.09.005 [DOI] [PubMed] [Google Scholar]
- Nash JR, Sargent PA, Rabiner EA, Hood SD, Argyropoulos SV, Potokar JP, … & Nutt DJ (2008). Serotonin 5-HT1A receptor binding in people with panic disorder: positron emission tomography study. The British Journal of Psychiatry, 193(3), 229–234 [DOI] [PubMed] [Google Scholar]
- Niedzielak T, Ravenelle R, Joseph M, Calhoun C, Plotkin B, Jones R, … & Donaldson ST (2020). 5-HT1A and α2 adrenergic receptor levels are associated with high anxiety-like patterns and impulsivity in selectively bred Long Evans rats. Behavioural brain research, 383, 112522. [DOI] [PubMed] [Google Scholar]
- Noyes R Jr (2001). Comorbidity in generalized anxiety disorder. Psychiatric Clinics of North America, 24(1), 41–55 [DOI] [PubMed] [Google Scholar]
- NOYES RUSSELL Jr, Woodman C, Garvey MJ, Cook BL, Suelzer M, Clancy J, & Anderson DJ (1992). Generalized anxiety disorder vs. panic disorder: Distinguishing characteristics and patterns of comorbidity. The journal of nervous and mental disease, 180(6), 369–379. [DOI] [PubMed] [Google Scholar]
- Oyola MG, Portillo W, Reyna A, Foradori CD, Kudwa A, Hinds L, … & Mani SK (2012). Anxiolytic effects and neuroanatomical targets of estrogen receptor-β (ERβ) activation by a selective ERβ agonist in female mice. Endocrinology, 153(2), 837–846. [DOI] [PMC free article] [PubMed] [Google Scholar]
- Palanza P. (2001). Animal models of anxiety and depression: how are females different? Neuroscience & Biobehavioral Reviews, 25(3), 219–233. [DOI] [PubMed] [Google Scholar]
- Papp M, Gruca P, Boyer PA, & Mocaër E. (2003). Effect of agomelatine in the chronic mild stress model of depression in the rat. Neuropsychopharmacology, 28(4), 694–703. [DOI] [PubMed] [Google Scholar]
- Pitychoutis PM, Dalla C, Sideris AC, Tsonis PA, & Papadopoulou-Daifoti Z. (2012). 5-HT1A, 5-HT2A, and 5-HT2C receptor mRNA modulation by antidepressant treatment in the chronic mild stress model of depression: sex differences exposed. Neuroscience, 210, 152–167. [DOI] [PubMed] [Google Scholar]
- Pryce CR, Feldon J, 2003. Long-term neurobehavioural impact of the postnatal environment in rats: manipulations, effects and mediating mechanisms. Neu- rosci. Biobehav. Rev 27, 57–71. [DOI] [PubMed] [Google Scholar]
- Ramos-Ortolaza DL, Doreste-Mendez RJ, Alvarado-Torres JK, & Torres-Reveron A. (2017). Ovarian hormones modify anxiety behavior and glucocorticoid receptors after chronic social isolation stress. Behavioural brain research, 328, 115–122. [DOI] [PMC free article] [PubMed] [Google Scholar]
- Ravenelle R, Byrnes EM, Byrnes JJ, McInnis C, Park JH, & Donaldson ST (2013). Environmental enrichment effects on the neurobehavioral profile of selective outbred trait anxiety rats. Behavioural brain research, 252, 49–57. [DOI] [PMC free article] [PubMed] [Google Scholar]
- Récamier-Carballo S, Estrada-Camarena E, Reyes R, & Fernández-Guasti A. (2012). Synergistic effect of estradiol and fluoxetine in young adult and middle-aged female rats in two models of experimental depression. Behavioural Brain Research, 233(2), 351–358. [DOI] [PubMed] [Google Scholar]
- Rohde P, Lewinsohn PM, & Seeley JR (1991). Comorbidity of unipolar depression: II. Comorbidity with other mental disorders in adolescents and adults. Journal of abnormal psychology, 100(2), 214. [PubMed] [Google Scholar]
- Rowney J, Hermida T, & Malone D. (2010). Definition and etiology. Anxiety. [Google Scholar]
- Shishkina GT, Kalinina TS, & Dygalo NN (2012). Effects of swim stress and fluoxetine on 5-HT1A receptor gene expression and monoamine metabolism in the rat brain regions. Cellular and molecular neurobiology, 32(5), 787–794. [DOI] [PMC free article] [PubMed] [Google Scholar]
- Silveira PP, da Silva Benetti C, Ayres C, Pederiva FQ, Portella AK, Lucion AB, & Dalmaz C. (2006). Satiety assessment in neonatally handled rats. Behavioural brain research, 173(2), 205–210. [DOI] [PubMed] [Google Scholar]
- Starr KR, Price GW, Watson JM, Atkinson PJ, Arban R, Melotto S, … & Duxon MS (2007). SB-649915-B, a novel 5-HT1A/B autoreceptor antagonist and serotonin reuptake inhibitor, is anxiolytic and displays fast onset activity in the rat high light social interaction test. Neuropsychopharmacology, 32(10), 2163–2172. [DOI] [PubMed] [Google Scholar]
- Stockmeier CA, Shapiro LA, Dilley GE, Kolli TN, Friedman L, & Rajkowska G. (1998). Increase in serotonin-1A autoreceptors in the midbrain of suicide victims with major depression—postmortem evidence for decreased serotonin activity. The journal of neuroscience, 18(18), 7394–7401. [DOI] [PMC free article] [PubMed] [Google Scholar]
- Stratmann JA, & Craft RM (1997). Intracranial self-stimulation in female and male rats: no sex differences using a rate-independent procedure. Drug and alcohol dependence, 46(1–2), 31–40. [DOI] [PubMed] [Google Scholar]
- Strobel A, Gutknecht L, Rothe C, Reif A, Mössner R, Zeng Y, … & Lesch KP (2003). Allelic variation in 5-HT1A receptor expression is associated with anxiety-and depression-related personality traits. Journal of neural transmission, 110(12), 1445–1453. [DOI] [PubMed] [Google Scholar]
- Turner RJ, Wheaton B, & Lloyd DA (1995). The epidemiology of social stress. American sociological review, 104–125. [Google Scholar]
- Vreeburg SA, Zitman FG, van Pelt J, DeRijk RH, Verhagen JC, van Dyck R, … & Penninx BW (2010). Salivary cortisol levels in persons with and without different anxiety disorders. Psychosomatic Medicine, 72(4), 340–347. [DOI] [PubMed] [Google Scholar]
- Wang XL, Gao J, Wang XY, Mu XF, Wei S, Xue L, & Qiao MQ (2018). Treatment with Shuyu capsule increases 5-HT1AR level and activation of cAMP-PKA-CREB pathway in hippocampal neurons treated with serum from a rat model of depression. Molecular medicine reports, 17(3), 3575–3582. [DOI] [PMC free article] [PubMed] [Google Scholar]
- Weiser MJ, Foradori CD, & Handa RJ (2010). Estrogen receptor beta activation prevents glucocorticoid receptor-dependent effects of the central nucleus of the amygdala on behavior and neuroendocrine function. Brain research, 1336, 78–88. [DOI] [PMC free article] [PubMed] [Google Scholar]
- Willner P. (2005). Chronic mild stress (CMS) revisited: consistency and behavioural-neurobiological concordance in the effects of CMS. Neuropsychobiology, 52(2), 90–110 [DOI] [PubMed] [Google Scholar]
- World Health Organization (2017). Depression and other common mental disorders: global health estimates (No. WHO/MSD/MER/2017.2). World Health Organization. [Google Scholar]


