. 2023 Mar 1;12:e80741. doi: 10.7554/eLife.80741

Figure 1. Rhizobium-directed polar growth (RPG) is required for the maintenance of infection thread morphology.

(A) Gene (left) and protein (right) structure of RPG showing the position of the mutations of two different mutant alleles (rpg-1, Arrighi et al., 2008, orange arrowhead; rpg-2, this study, yellow arrowhead). Both mutations map to the third exon of the RPG gene, corresponding to the disordered region of the protein located upstream of the coiled-coil domain. NT-C2=N-terminal C2 domain; IDR = intrinsically disordered region; CC = coiled coil domain. (B) Representative confocal images of aberrant ITs formed 35 dpi within root hairs of rpg-1 and rpg-2 roots compared to thin and elongated infection threads (ITs) of the corresponding wild-types (WT). Images are overlaid with intensity projections of fluorescence and bright field channels. S. meliloti-GFP is shown in magenta. Scale bars = 10 µm. (C) Schematic visualization of the method used to quantify morphological IT defects. The IT diameter was measured on the fluorescent channel at three different points along the IT length: in the proximity of the infection chamber (Pro), in the intermediate part of the IT (Int), and in the distal part of the IT (Dis). (D) IT diameters scored on roots of rpg mutants and corresponding WTs at the three measured points shown in (C). Letters indicate statistically significant differences according to Kruskal-Wallis multiple comparison analysis followed by Dunn’s post-hoc test. Data are from two independent experiments with 10 (WT A17); 11 (rpg-1); 10 (WT R108); 10 (rpg-2) plants analyzed. n=44 (WT A17), 53 (rpg-1), 44 (WT R108), 61 (rpg-2) ITs. (E) Representative transmission electron microscopy (TEM) sections obtained from WT and rpg-1 nodules showing IT structures (arrows) with a thicker appearance in rpg-1 compared to WT. The organization of infected cells and symbiosome (arrowheads) morphology are similar in the two genotypes. The yellow line in the upper panel indicates the IT diameter, positioned at the center of the IT area (white outline), perpendicular to its longest axis. Scale bars = 2 µm (left, upper panel), 5 µm (right, upper panel), 10 µm (lower panels). (F) Nodular IT diameters were measured on TEM sections from nodules formed on roots of rpg-1 and WT. Asterisks indicate statistical significance based on a Mann-Whitney test with p-values <0.05 (*), <0.01 (**), <0.001 (***), and <0.0001 (****). Data are from two independent experiments, with six (WT) and five (rpg-1) nodules analyzed, each harvested from a different plant. n=35 (WT) and 31 (rpg-1) infected cells; n=90 (WT) and 70 (rpg-1) nodular ITs. In each box plot, the top and bottom of each box represent the 75th and 25th percentiles, the middle horizontal bar indicates the median and the whiskers represent the range of minimum and maximum values. Crosses represent sample means.

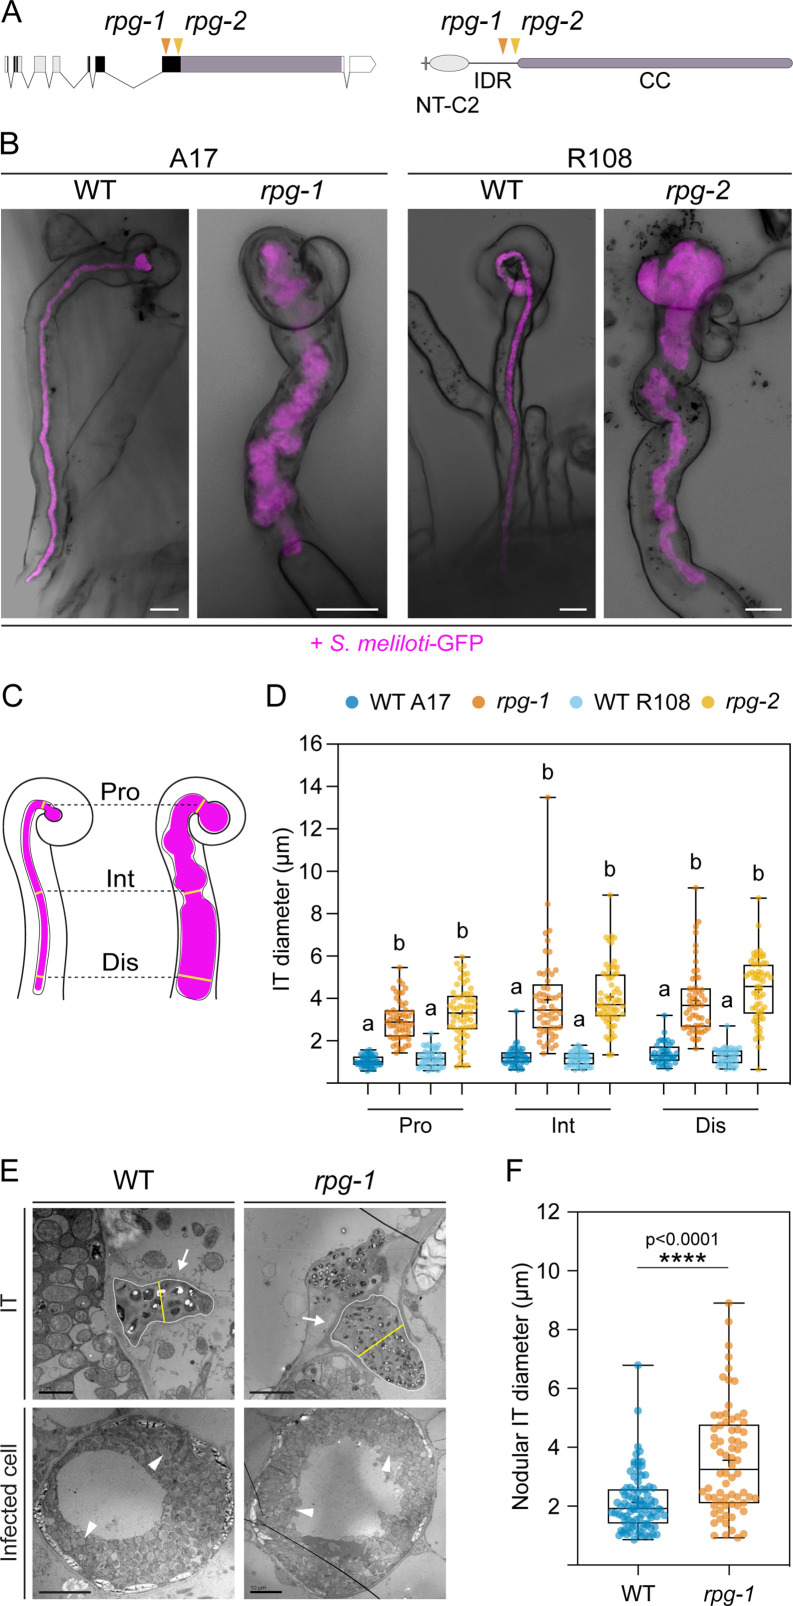
Figure 1—source data 1. IT diameter and statistical analysis.
Figure 1—source data 2. Nodular IT diameter and statistical analysis.

Figure 1.

Figure 1—figure supplement 1. Rhizobium-directed polar growth (RPG) is not required to maintain root hair morphology in un-inoculated conditions.

Figure 1—figure supplement 1.

(A) Representative bright field images of the root tip area (overview, single focal plane) and of the root hair maturation zone (maximum projection) of rpg mutant alleles and their corresponding wild-types (WT). Scale bars = 200 µm (upper panel), 50 µm (lower panel). The root hair diameter was scored on differentiated root hairs from the maturation zone, in the middle region along their length, as shown in the schematic representation in (B). (C) Quantification of root hair diameters on roots of rpg mutant alleles and corresponding wild-types. In the box plot, the top and bottom of each box represent the 75th and 25th percentiles, the middle horizontal bar indicates the median and the whiskers represent the range of minimum and maximum values. Crosses represent sample means. Letters indicate statistically significant differences according to Kruskal-Wallis multiple comparison analysis followed by Dunn’s post-hoc test. Data are from two independent experiments with 21 (WT A17), 21 (rpg-1), 19 (WT R108), 20 (rpg-2) plants analyzed and five root hair cells per plant being examined. n=105 (WT A17), 105 (rpg-1), 95 (WT R108), 100 (rpg-2) root hairs.
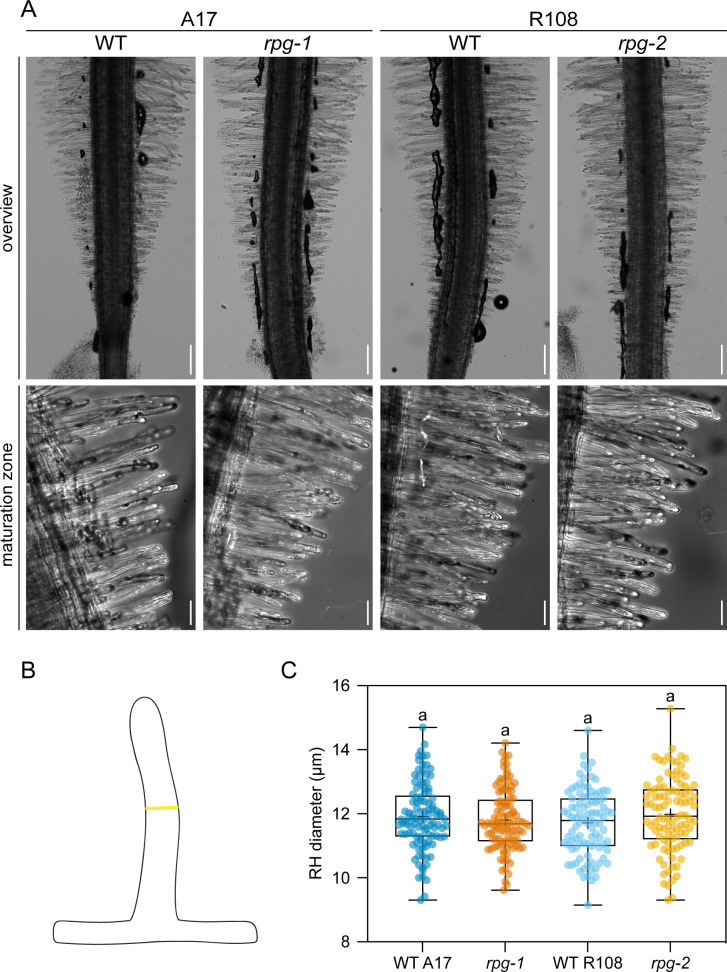
Figure 1—figure supplement 1—source data 1. RH diameter and statistical analysis.
Figure 1—figure supplement 2. Cortical infection threads and nodule phenotype of rpg mutants.

Figure 1—figure supplement 2.

(A) Confocal images of cortical infection threads (ITs) formed in roots of rpg mutants compared to their corresponding wild-types (WT) at 14 dpi with S. meliloti-GFP (magenta). Cell walls were stained with Calcofluor white (white). Images are merges of maximum intensity projections of the fluorescent channels. Samples are representative of two independent experiments, with three (WT A17, WT R108) and four (rpg-1, rpg-2) plants analysed. n=3 (WT A17), 7 (rpg-1), 6 (WT R108), 6 (rpg-2) cortical ITs. Scale bars = 10 µm. (B) Number and type of nodules formed on rpg mutant alleles compared to their corresponding wild-types at 21 dpi with S. meliloti-LacZ. Data are presented as box plots where the top and bottom of each box represent the 75th and 25th percentiles, the middle horizontal bar indicates the median and the whiskers represent the range of minimum and maximum values. Crosses represent sample means. Asterisks indicate statistical significance based on a Mann-Whitney test with p-values <0.05 (*), <0.01 (**), <0.001 (***), and <0.0001 (****). ns = not significant. The number of plants analyzed per genotype was 20 (WT A17), 8 (rpg-1), 17 (WT R108), 17 (rpg-2). Two independent experiments were performed. Nod = total nodule structures; nod inf = total infected nodules; inf round = infected round nodules; inf elong = infected elongated nodules; bumps = bump like nodules with the arrested infection on the top; empty = empty nodules.
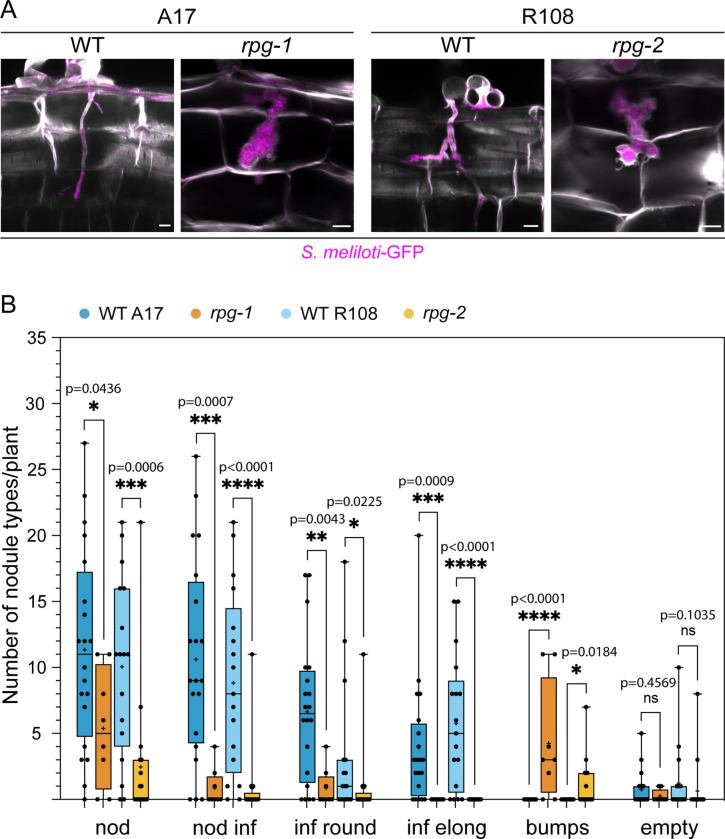
Figure 1—figure supplement 2—source data 1. Nodule number and statistical analysis.