

Abstract
Background
Oncologists often order genomic testing to inform treatment for worsening cancer. The resulting correlation between genomic testing timing and prognosis, or “informative entry,” can bias observational clinico-genomic research. The efficacy of existing approaches to this problem in clinico-genomic cohorts is poorly understood.
Methods
We simulated clinico-genomic cohorts followed from an index date to death. Subgroups in each cohort who underwent genomic testing before death were “observed.” We varied data generation parameters under four scenarios: (1) independent testing and survival times; (2) correlated testing and survival times for all patients; (3) correlated testing and survival times for a subset of patients; and (4) testing and mortality exclusively following progression events. We examined the behavior of conditional Kendall’s tau (Tc) statistics, Cox entry time coefficients, and biases in overall survival (OS) estimation and biomarker inference across scenarios.
Results
Scenario #1 yielded null Tc and Cox entry time coefficients and unbiased OS inference. Scenario #2 yielded positive Tc, negative Cox entry time coefficients, underestimated OS, and biomarker associations biased towards the null. Scenario #3 yielded negative Tc, positive Cox entry time coefficients, and underestimated OS, but biomarker estimates were less biased. Scenario #4 yielded null Tc and Cox entry time coefficients, underestimated OS, and biased biomarker estimates. Transformation and copula modeling did not provide unbiased results.
Conclusions
Approaches to informative clinico-genomic cohort entry, including Tc and Cox entry time statistics, are sensitive to heterogeneity in genotyping and survival time distributions.
Impact
Novel methods are needed for unbiased inference using observational clinico-genomic data.
Keywords: Clinico-genomic, cancer, left truncation, informative cohort entry
Introduction
Precision oncology research relies upon large-scale genomic data linked to clinical outcomes. However, most clinico-genomic datasets are derived from real-world observational cohorts(1,2) in which genomic data are collected when oncologists order testing to inform clinical care. Specifically, oncologists may request genomic testing at times when patients have worsening cancer, hoping the genomic data may identify new biomarker-selected treatment options. Therefore, the timing of genomic data collection may be correlated with mortality risk. When these data are later included in clinico-genomic analyses, this dynamic can lead to informative cohort entry, also known as dependent left truncation or “temporal selection bias.”(3) Informative cohort entry violates a key assumption of the standard risk set adjustment(4) approach to survival analysis in the presence of delayed entry, which removes “immortal time” from analysis by entering patients into the risk set of the Kaplan-Meier denominator at the specific time when they enter the cohort (e.g., at the time of genomic testing) after the index date. When patients enter a clinico-genomic cohort because of clinical worsening, the time after genomic testing could be construed as time at excess risk of mortality relative to the overall disease trajectory (Figure 1). Informative entry may therefore lead to biased estimates of survival time and associations between covariates and survival outcomes, threatening the accuracy of results derived from large institutional and commercial clinico-genomic datasets. No optimal approach to this challenge has been defined.
Figure 1:
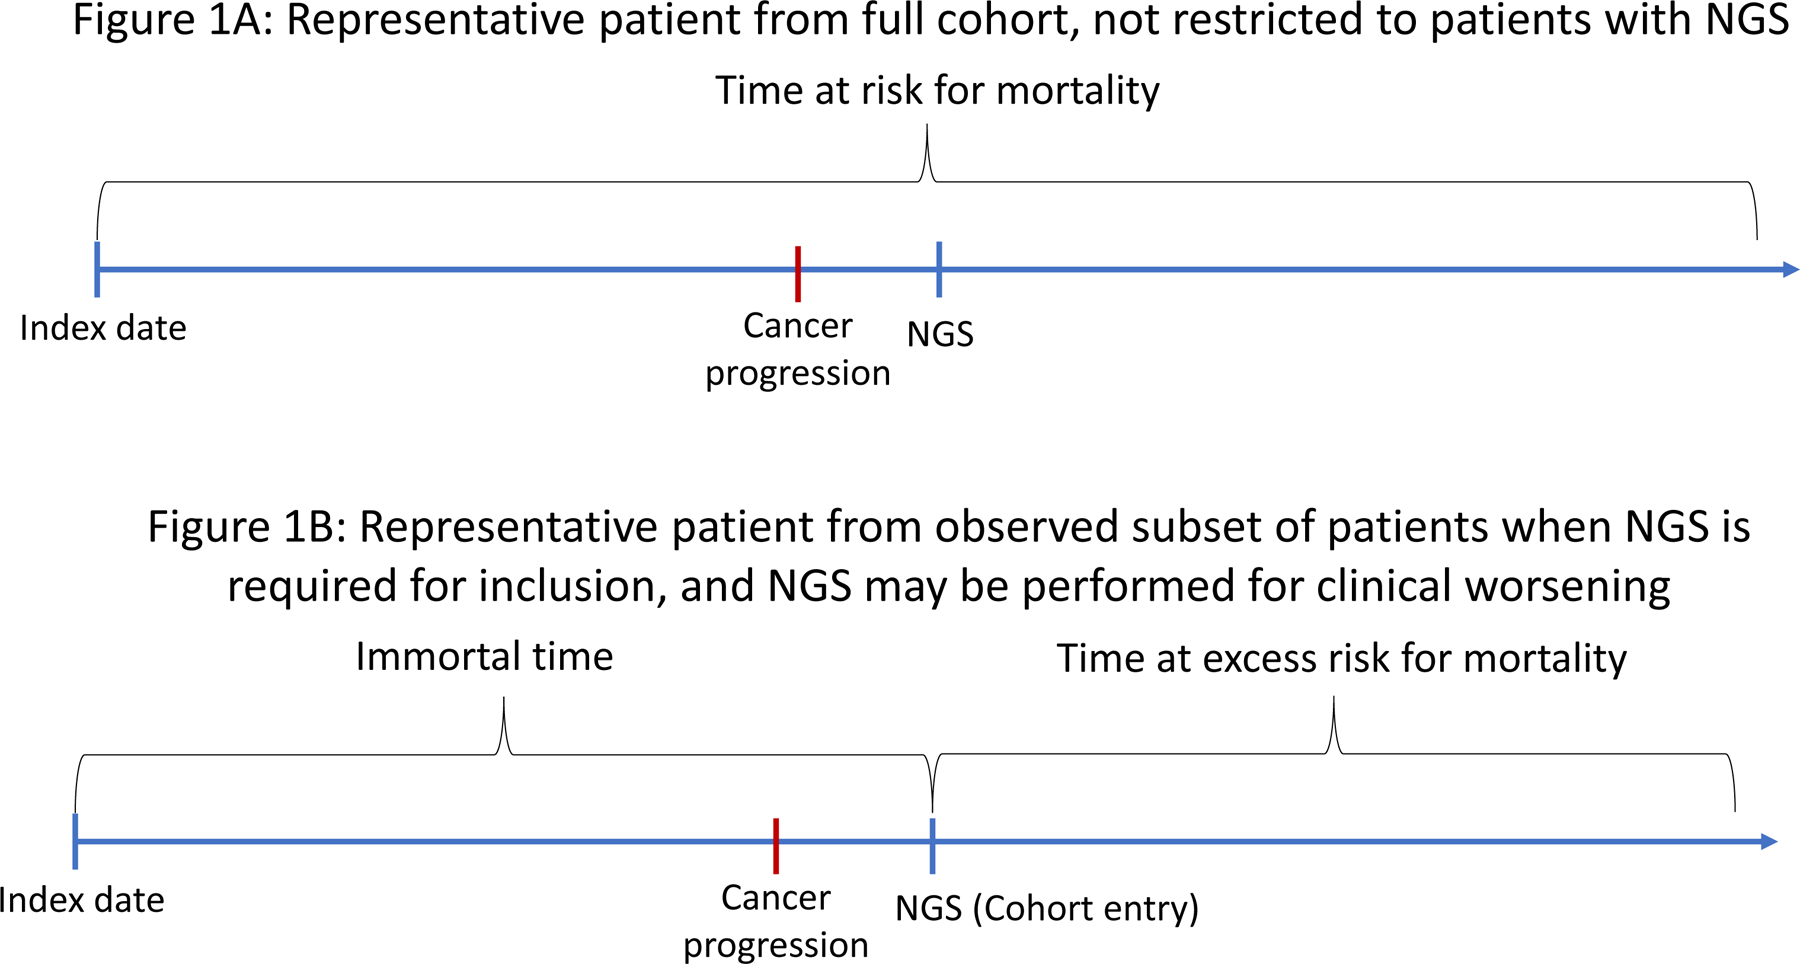
Diagram depicting informative left truncation. Figure 1A: Example disease trajectory for a patient from a full “true” cohort in which next-generation sequencing (NGS) is not required for inclusion, and all time after diagnosis is at risk for mortality. Figure 1B: Example disease trajectory for a patient from the “observed” subset in which NGS is required for inclusion and may be performed for worsening clinical status. Here, the time prior to NGS is “immortal,” because patients who died without NGS would not have been observed, but the time after NGS is a period of excess mortality risk compared to the full disease trajectory, because NGS was performed for worsening clinical status.
Existing methods for detecting informative cohort entry include calculation of the conditional Kendall’s tau statistic(5) and measuring the association between cohort entry time and subsequent survival time using a Cox model.(6) Both statistics have been applied to real-world observational clinico-genomic cohorts to identify dependent left truncation.(3,7) However, their behavior under conditions common in clinico-genomic cancer data, which may exhibit intracohort heterogeneity in the relationship between genomic testing and prognosis, is poorly understood. Practical guidance for translational researchers seeking to assess for dependent left truncation using these methods remains limited.
Similarly, methods for analyzing data subject to informative left truncation, once it is identified or suspected, are not straightforward. Copula modeling, which jointly models cohort entry and survival times,(8) and transformation modeling, which models a latent quasi-independent cohort entry time based on observed entry and survival times,(9) have both been proposed to correct for informative truncation. Still, they are challenging to apply in practice due to the need to choose among hyperparameters that specify strong statistical assumptions about the informative entry process, and there has been little evaluation of the performance of these approaches using data reflective of realistic genomic testing dynamics. Critically, the clinico-genomic cohort entry process may be complex and unknown to the researcher, since genomic testing may be ordered because of worsening cancer for some patients but independently of disease status for others. This intracohort heterogeneity may not be fully captured by existing modeling strategies. Weighting observations by their inverse probability of being left-truncated has also been proposed;(10) this can address the context in which covariates that are measurable at the index date may be associated with the timeline of genomic testing, but not the common context in which genomic testing is performed at some point after the index date specifically because of clinical worsening. To date, the ability of these strategies to promote unbiased measurement of the association between a genomic biomarker and survival is not well understood, particularly for data in which genomic testing might have been performed because of clinical worsening to inform treatment selection for at least some patients.
The objectives of the current study, therefore, were (1) to empirically evaluate the behavior of the conditional Kendall’s tau and Cox coefficient for entry time approaches to detecting informative left truncation given variation in informative entry processes; and (2) to elucidate patterns of bias in survival time estimation and biomarker inference in the presence of informative cohort entry.
Materials and Methods
In this study, statistical simulation was applied to generate data to mimic real-world clinico-genomic scenarios. Hypothetical clinico-genomic cohorts were simulated in which patients were followed from an index date to death or were lost to follow-up (right censoring). The index date was defined as the start of follow-up for mortality for the cohort. Each full simulated cohort was defined as a “true” patient population, and the subset of each true cohort that underwent genomic testing (“testing”) prior to death or right censoring was defined as the “observed” subset. Cohort entry time in the observed subsets was defined as the date of genomic testing, since genomic testing is required for entry into clinico-genomic datasets. “True” survival time was defined as survival in the true cohort; “observed” survival time was defined as survival in the observed subset.
Our first objective was to characterize the distributions of conditional Kendall’s tau statistics and Cox coefficients for entry time that might be observed as the data generating process yielding a clinico-genomic dataset is varied. Conditional Kendall’s tau statistics have been proposed to test for quasi-independence of cohort entry times and event times, in this case genomic testing and survival times.(5) We used the inverse probability weighted conditional Kendall’s tau(11) with a linear transformation function for this analysis. Cox coefficients for entry time refer to the coefficient for the cohort entry time in a Cox proportional hazards model, also intended to assess and potentially adjust for the association between cohort entry time and survival time. To measure the behavior of these two methods for detecting informative cohort entry under varying conditions, four scenarios were simulated, each corresponding to a pattern of relationship between cohort entry time and exponentially distributed survival times. Within each scenario, randomly generated data generation parameters were varied uniformly and continuously over specified ranges during simulation of 100,000 cohorts. Cohort sizes were varied uniformly in size from 50–5000 patients each, and the prevalence of a single hypothetical biomarker associated with decreased overall survival was varied uniformly from 5%−50% of each cohort. Exponential distributions for time to event outcomes and a uniform distribution of non-informative right censoring over the first 120 months of follow-up were also assumed. The simulated scenarios were:
(1). Scenario #1:
Timing of genomic testing independent of clinical risk. This scenario involved exponentially distributed survival times, with cohort entry uniformly distributed over the first year of follow-up from the index date, representing genomic testing without regard to clinical risk. Data generation parameters included the hazard for mortality (range 0.005 to 0.03 per month); and the hazard ratio associated with the hypothetical biomarker (range 1.05–3).
(2). Scenario #2:
Timing of genomic testing correlated with survival time for all patients. This scenario included exponentially distributed survival times, with cohort entry time normally distributed around the survival times (but minimum testing time of zero), representing a consistent pattern of relationship between cohort entry time and survival time for all patients (i.e. patients are disproportionately sequenced closer to death). Data generation parameters included the hazard for mortality (range 0.005–0.03 per month); the hazard ratio for the hypothetical biomarker (range 1.05–3); and the standard deviation of the normal distribution of entry time around survival time (range 1–10 months).
(3). Scenario #3:
Timing of genomic testing correlated with survival time for some patients and independent of clinical risk for others. This scenario involved exponentially distributed survival times, with cohort entry uniformly distributed along the first three months of follow-up for one subgroup but normally distributed around the survival times for a second subgroup (with minimum testing time of zero). This represents a context in which some patients in a cohort have genomic testing performed shortly after the index date without regard to clinical risk (non-informative cohort entry), whereas others have genomic testing performed later, due to increased clinical risk (informative cohort entry). Data generation parameters included the hazard for mortality (range 0.005–0.03 per month); the hazard ratio for the hypothetical biomarker (range 1.05–3); the standard deviation of the normal distribution of cohort entry time around survival time for patients with informative entry (range 1–10 months); and the proportion of patients entering the cohort due to early genotyping without regard to survival time (range 0.001–0.95).
(4). Scenario #4:
Timing of genomic testing and survival time each correlated with clinical progression. This scenario included exponentially distributed times to “progression,” with both survival times and cohort entry times in turn exponentially distributed after the progression date, representing a scenario in which genomic testing and mortality each independently follow progression events. Data generation parameters included the hazard rate for progression (range 0.005–0.03 per month) and the hazard rates for genomic testing (range 0.005–0.03 per month) and mortality (range 0.005–0.03 per month), each indexed at the progression date for each patient. The hypothetical biomarker was assumed to have the same association with progression and with subsequent survival, and its hazard ratio was varied over the range 1.05–3.
To address our second objective of describing patterns of bias in the estimation of survival time distribution and biomarker inference in the presence of informative cohort entry, we applied common methods for adjusting for both noninformative and informative cohort entry, including simple risk set adjustment,(4) risk set adjustment with cohort entry time as a covariate,(6) transformation modeling,(9) and a copula approach.(8,12) Within each scenario, we estimated the following in each cohort: (a) survival time bias, defined as the observed median survival minus true median survival; and (b) biomarker inference bias, defined as the measured Cox coefficient (log hazard ratio) for the association between biomarker status and survival in the observed cohort minus the Cox coefficient measuring the association between biomarker status and survival in the true cohort.
Analyses were performed in R version 4.1.0 (RRID: SCR_001905). Transformation modeling and conditional Kendall’s tau statistic calculation was performed using the tranSurv package(13) and copula modeling using the depend.truncation package;(14) for computational tractability, transformation and copula modeling were not performed for Scenario #1 (in which testing and survival times were independent) and were performed for a random sample of 10% of cohorts for Scenarios #2-#4.
Data availability statement
Analysis code and derived simulation datasets are available at github.com/prissmmnlp/informative_entry_sims.
Results
As expected, scenario #1, in which there was no relationship between cohort entry time and survival time in the data generating process, yielded null Kendall’s tau and Cox entry time coefficients (medians across simulations, 0). It also yielded unbiased survival (median observed minus true median survival across simulations, 0.10 months) and biomarker estimates (median observed minus true log hazard ratio with risk set adjustment with or without entry time adjustment, 0). Statistically significant biomarker associations in the correct direction at two-sided P < 0.05 were detected using simple risk set adjustment in 91% of observed cohorts across simulations (Table 1; Figure 2).
Table 1:
Summary of diagnostic statistic and inference results across patterns of informative cohort entry
| Scenario | Survival time distribution | Genomic testing time distribution | Median conditional Kendall’s tau | Median Cox coefficient for time (risk set adjustment) | Median true median survival time (months) | Median observed minus median true survival time in months (risk set adjustment) | Median observed minus true median survival time in months (transformation modeling) | Median observed minus true median survival time in months (copula modeling) | Median observed minus true biomarker log hazard ratio (risk set adjustment) | Median observed minus true biomarker log hazard ratio (risk set and entry time adjustment) | Biomarker effect detection rate across simulations (risk set adjustment) |
|---|---|---|---|---|---|---|---|---|---|---|---|
| 1 | Exponential from index date | Uniform | 0 | 0 | 32.7 | 0.10 | NA* | NA* | 0 | 0 | 91% |
| 2 | Exponential from index date | Normal around survival time | 0.14 | −0.10 | 32.9 | −30.1 | −15.8 | −22.5 | −0.64 | −0.64 | 11% |
| 3 | Exponential from index date | Subgroup 1: Uniform Subgroup 2: Normal around survival time |
−0.10 | 0.06 | 33.0 | −13.2 | −19.1 | 23.6 | −0.03 | −0.18 | 87% |
| 4 | Exponential from latent exponential progression time | Exponential from latent exponential progression time | 0 | 0 | 78.4 | −44.0 | −45.0 | −42.9 | −0.35 | −0.34 | 72% |
Results derived from 100,000 simulated cohorts for each scenario with data generation parameters varied as per the Methods. Scenario #1 represents genomic testing without regard to mortality risk. Scenario #2 represents genomic testing times correlated with mortality risk for all cohort patients. Scenario #3 represents heterogenous cohorts in which one subgroup of patients undergoes early testing regardless of clinical risk and another undergoes late testing associated with clinical risk. Scenario #4 represents testing and mortality that always follow progression but are not otherwise linked. “Biomarker effect detection rate” refers to the proportion of observed cohorts in which a statistically significant biomarker association with the correct direction of effect was detected.
NA: Transformation and copula modeling were not run for Scenario #1 due to prolonged computation time in the independent entry context
Figure 2:
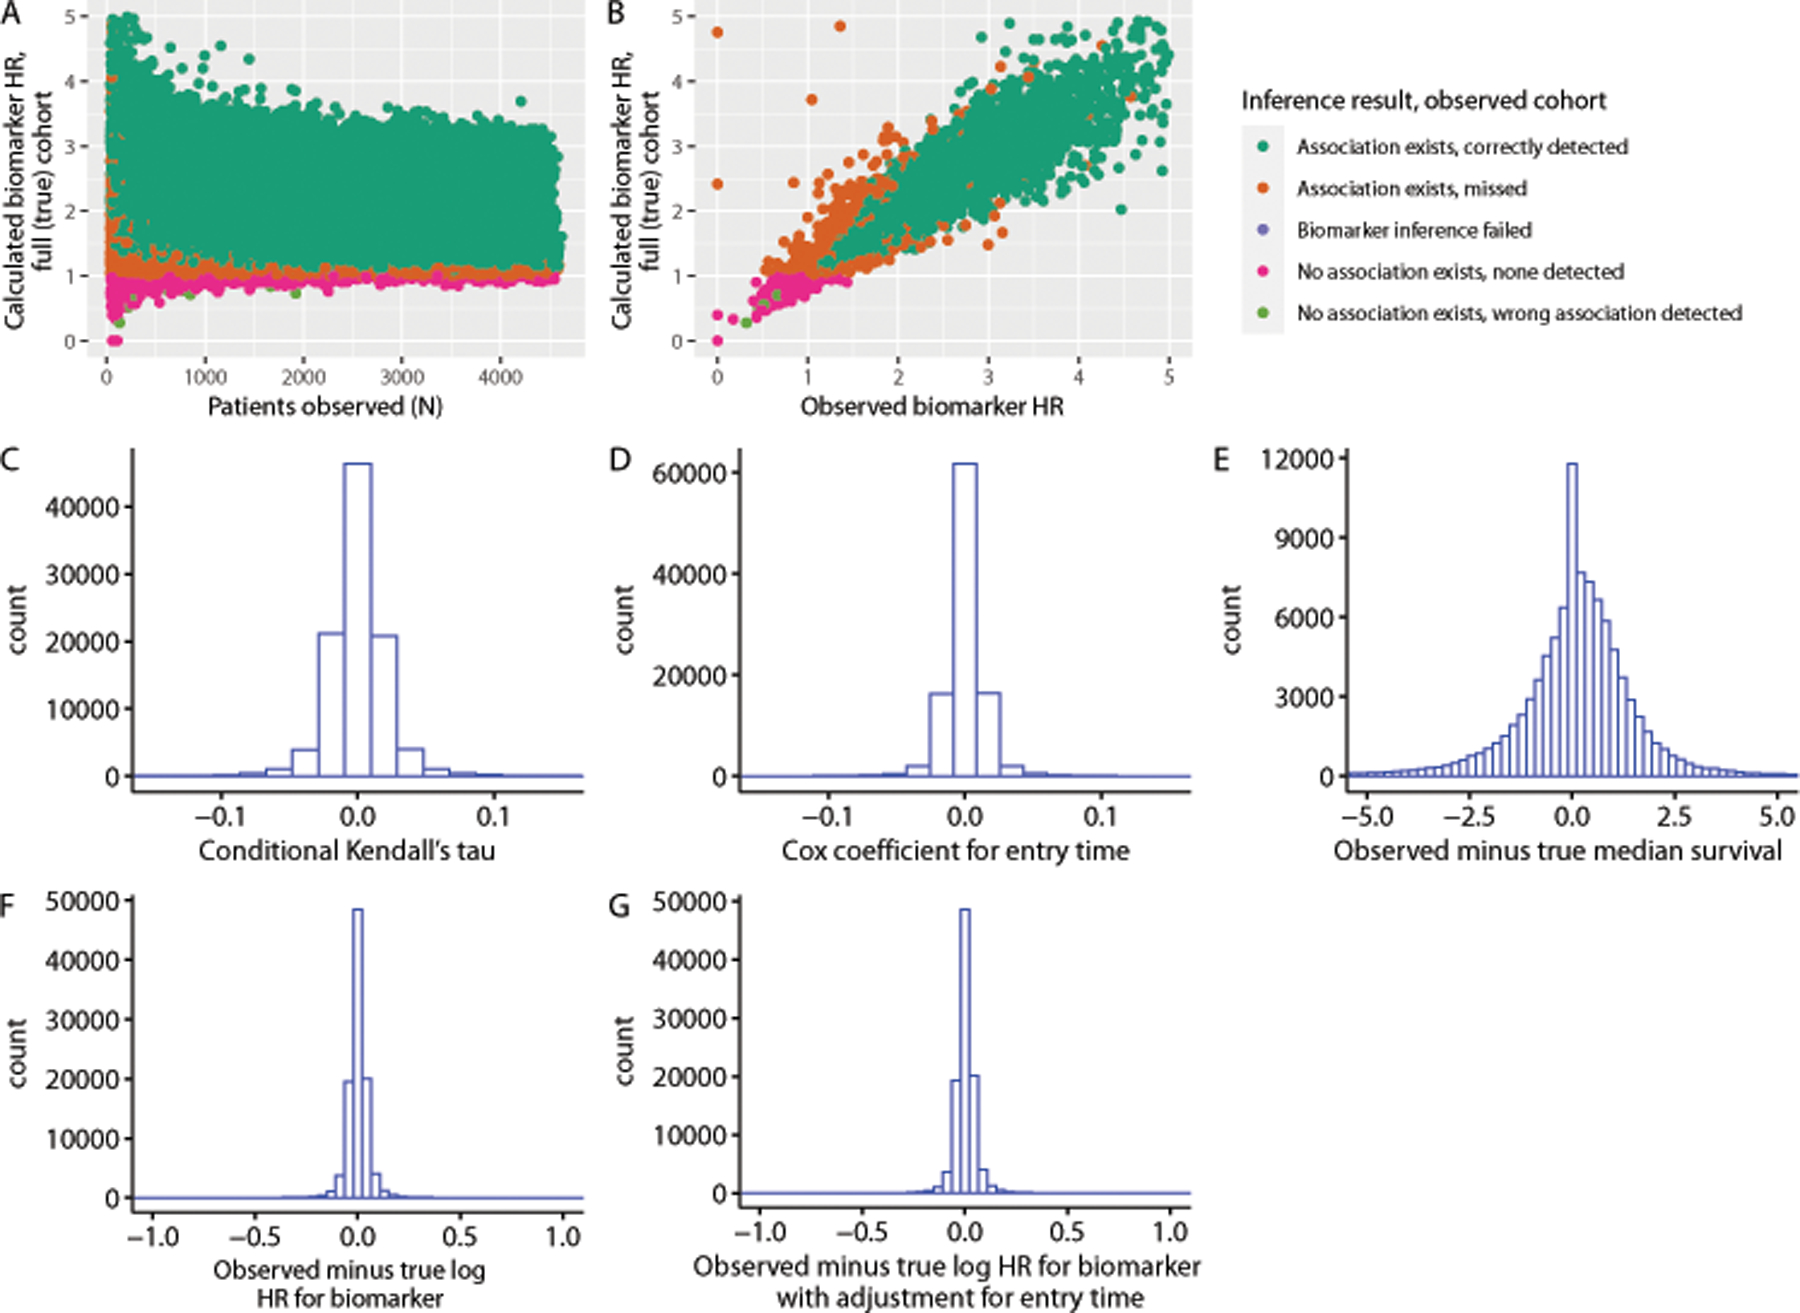
Results for scenario #1, corresponding to uniformly distributed genomic testing times without correlation with survival times. Inference results refer to whether a biomarker association in the correct direction was detected at two-sided p < 0.05 in the observed cohort. (a) Observed biomarker inference results as a function of number of patients observed and calculated biomarker effect in a random sample of the full (true) cohort equal in size to the size of the observed cohort; (b) observed biomarker hazard ratio versus biomarker hazard ratio measured in the true cohort; (c) distribution of Kendall’s tau statistics among simulated observed cohorts; (d) distribution of Cox coefficients for genomic testing time across simulated observed cohorts; (e) distribution of observed median survival time minus true median survival time across cohorts (simple risk set adjustment); (f) distribution of observed log hazard ratio for biomarker effect from Cox models with risk set adjustment minus log hazard ratio for biomarker effect measured in the true cohort across simulated cohorts; (g) distribution of observed log hazard ratio for biomarker effect from Cox models with risk set adjustment and entry time as a covariate minus log hazard ratio for biomarker effect measured in the true cohort across simulations
Scenario #2, in which there was a monotonic relationship between cohort entry time and survival time, yielded consistently positive Kendall’s tau statistics (median across simulations, 0.14), and negative Cox coefficients for entry time (median across simulations, −0.10); this is the opposite of the pattern that has been observed in real clinico-genomic datasets, which demonstrated negative Kendall’s tau statistics(3) and positive Cox entry time coefficients.(7) Survival time was consistently underestimated (median observed minus true median survival, −30.1 months) using simple risk set adjustment. Transformation and copula modeling reduced but did not eliminate this underestimated survival time (median observed minus true median survival, −15.8 months for transformation modeling, −22.5 months for copula modeling). Biomarker inference was consistently biased towards the null (median observed minus true log hazard ratio with risk set adjustment only, −0.64; with risk set and entry time adjustment, −0.64), with a statistically significant biomarker association in the correct direction at two-sided P <0.05 detected in only 11% of observed cohorts across simulations (Table 1; Figure 3).
Figure 3:
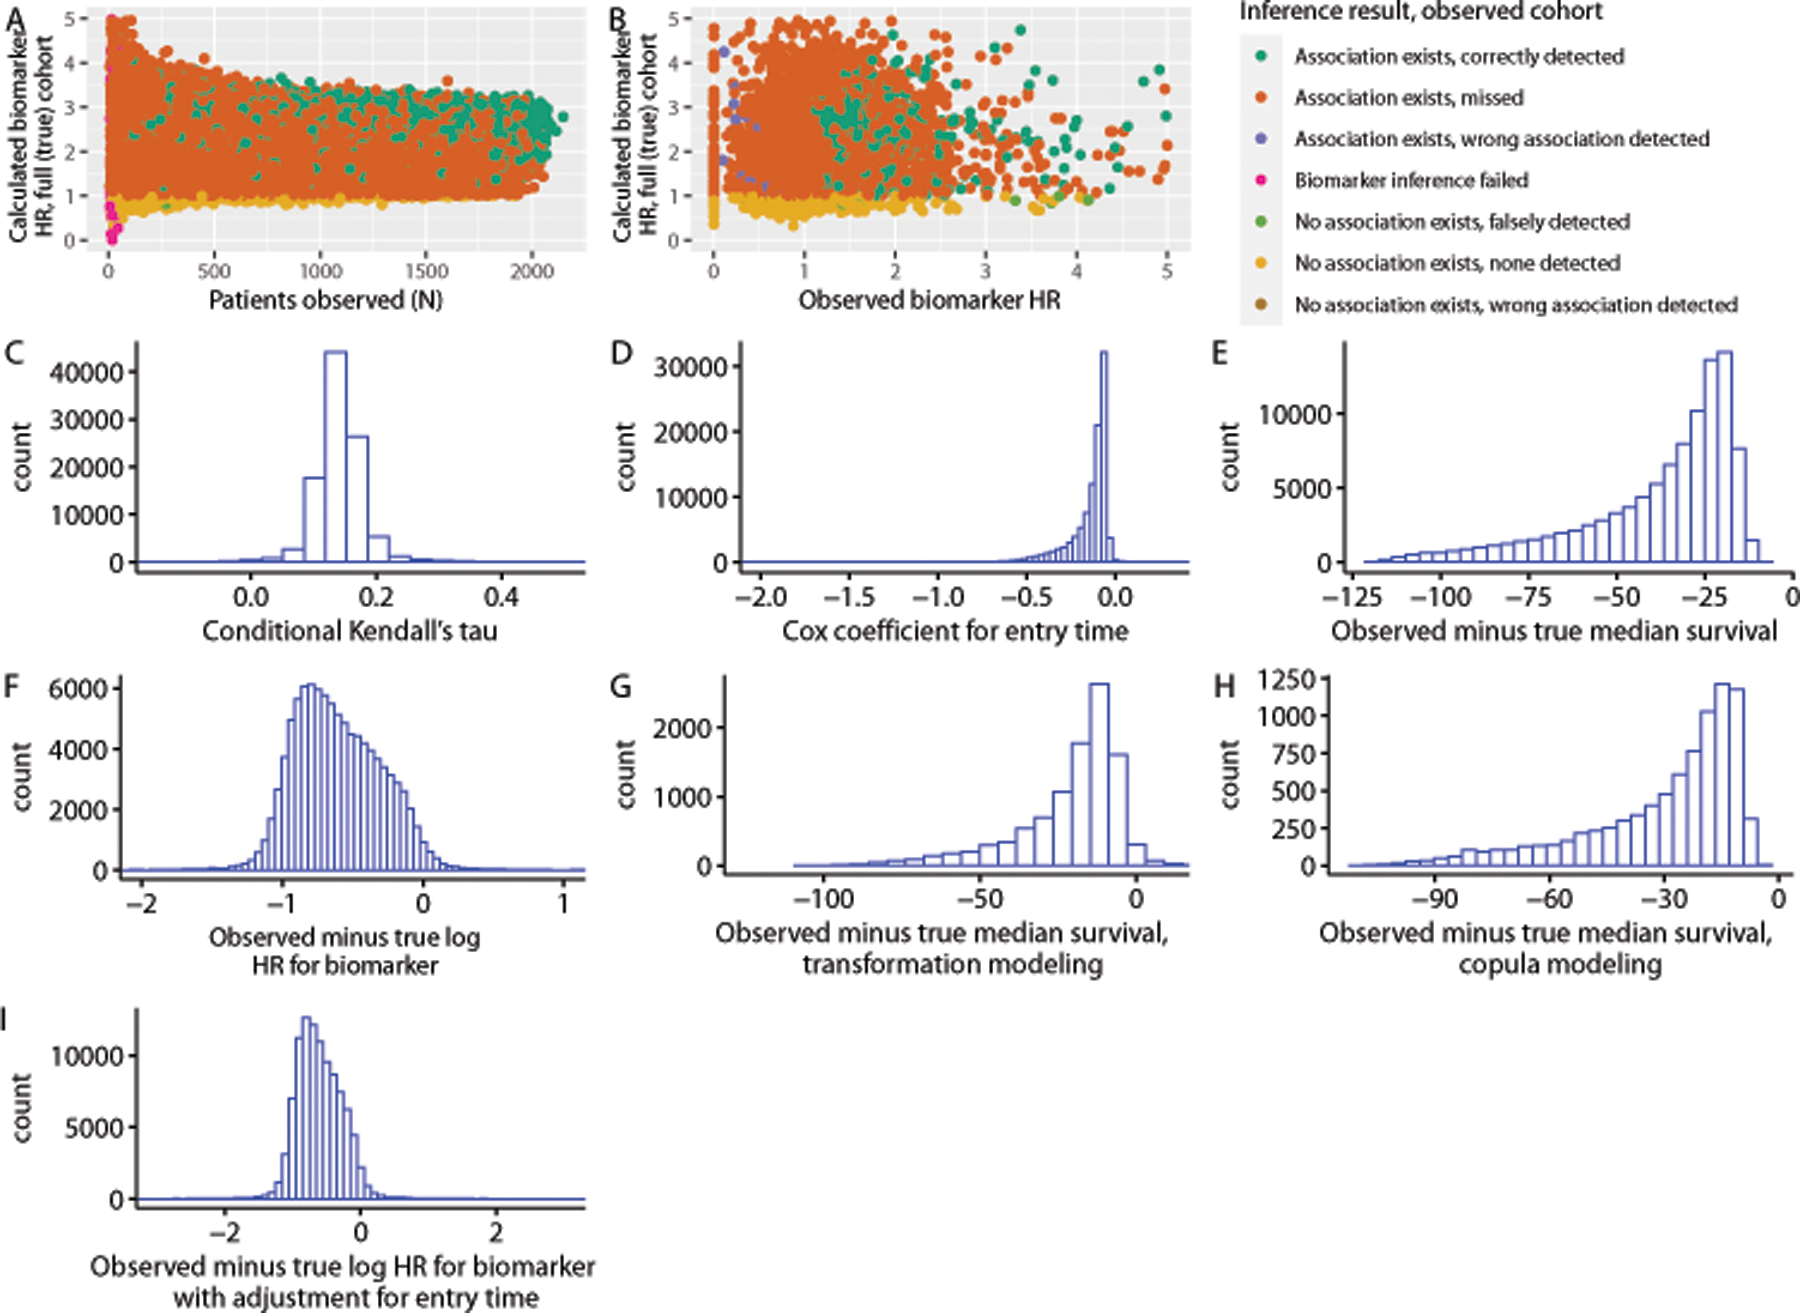
Results for scenario #2, corresponding to testing times normally distributed around survival times for all patients. Inference results refer to whether a biomarker association in the correct direction was detected at two-sided p < 0.05 in the observed cohort. (a) observed biomarker inference results as a function of number of patients observed and calculated biomarker effect in a random sample of the full (true) cohort equal in size to the size of the observed cohort; (b) observed biomarker hazard ratio versus biomarker hazard ratio measured in the true cohort; (c) distribution of conditional Kendall’s tau statistics among simulated observed cohorts; (d) distribution of Cox coefficients for entry time among simulated observed cohorts; (e) distribution of observed median survival times minus true survival times among simulated cohorts (simple risk set adjustment); (f) distribution of observed log hazard ratio for biomarker effect from Cox models minus log hazard ratio for biomarker effect measured in the true cohort across simulations (simple risk set adjustment); (g) distribution of observed median survival times minus true median survival times among simulated cohorts (transformation modeling); (h) distribution of observed median survival times minus true median survival times among simulated cohorts (copula modeling); (i) distribution of observed log hazard ratio for biomarker effect from Cox models with risk set adjustment and entry time as a covariate minus log hazard ratio for biomarker effect measured in the true cohort across simulations
In Scenario #3, in which one subgroup of patients had cohort entry times uncorrelated with survival time but another exhibited informative entry, Kendall’s tau statistics were consistently negative (median across simulations, −0.10) and Cox coefficients for entry time consistently positive (median across simulations, 0.06); this is consistent with previous observations in real datasets.(3,7) Survival time was consistently underestimated using simple risk set adjustment (median observed minus true median survival, −13.2 months), and this underestimation was not ameliorated using transformation modeling (median observed minus true median survival, −19.1 months). Copula modeling yielded overestimation of survival time (median observed minus true median survival, 23.6 months). Interestingly, biomarker inference was less biased towards the null than in Scenario 2, with a statistically significant biomarker association in the correct direction detected in 87% of simulations for Scenario 3; median observed minus true log hazard ratio with simple risk set adjustment −0.03, median observed minus true log hazard ratio with risk set and entry time adjustment, −0.18. (Table 1; Figure 4).
Figure 4:
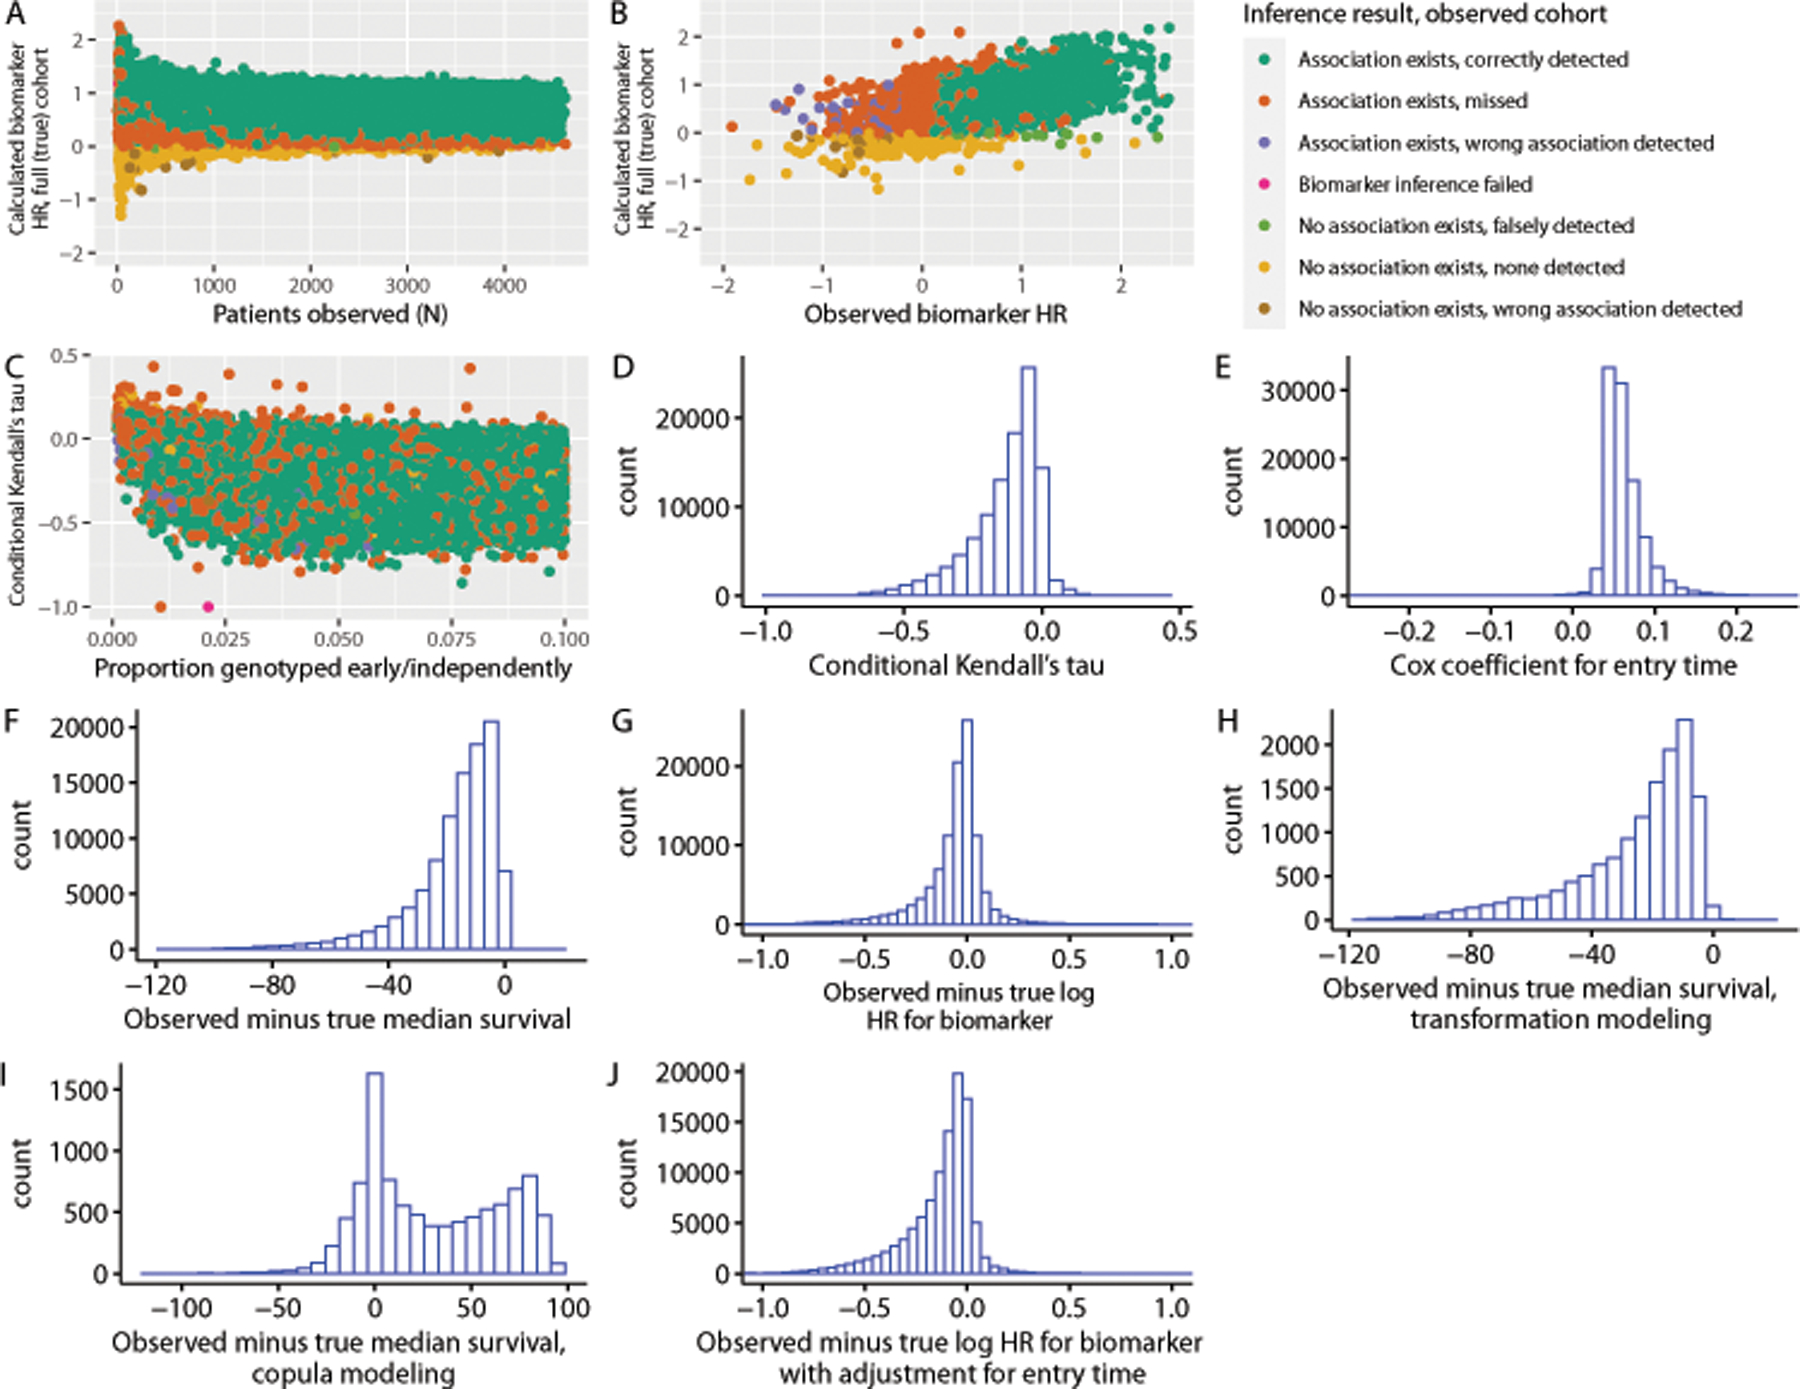
Results for scenario #3, corresponding to cohorts in which one subgroup within each cohort undergoes early genomic testing independent of survival time, while a second subgroup exhibits testing normally distributed around survival times. Inference results refer to whether a biomarker association in the correct direction was detected at two-sided p < 0.05 in the observed cohort. (a) Observed biomarker inference results as a function of number of patients observed and calculated biomarker effect in a random sample of the full (true) cohort equal in size to the size of the observed cohort; (b) observed biomarker hazard ratio versus biomarker hazard ratio measured in the true cohort; (c) distribution of conditional Kendall’s tau statistics among simulated observed cohorts as a function of the proportion of patients genotyped “early,” or independently of clinical risk; (d) distribution of Kendall’s tau statistics among simulated observed cohorts; (e) distribution of Cox coefficients for genomic testing time among simulated observed cohorts; (f) distribution of observed median survival times minus true median survival times among simulated cohorts (simple risk set adjustment); (g) distribution of observed log hazard ratio for biomarker effect from Cox models minus log hazard ratio for biomarker effect (simple risk set adjustment) (h) distribution of observed median survival times minus true median survival times among simulated cohorts (transformation modeling); (i) distribution of observed median survival times minus true median survival times among simulated cohorts (copula modeling); (j) distribution of observed log hazard ratio for biomarker effect from Cox models with risk set adjustment and entry time as a covariate minus log hazard ratio for biomarker effect measured in the true cohort across simulations
In Scenario #4, in which cohort entry and mortality could only occur following a latent progression event but were otherwise not correlated, null values for Kendall’s tau (median 0) and Cox entry time coefficients (median 0) were consistently observed. Despite these null values, survival times were consistently underestimated using simple risk set adjustment (median observed minus expected median survival, −44.0 months). Transformation modeling did not correct this underestimation (median observed minus expected median survival, −45.0 months), nor did copula modeling (median observed minus expected median survival, −42.9 months). Biomarker associations were biased (median observed minus true log hazard ratio, −0.35 with simple risk set adjustment, −0.34 with risk set and entry time adjustment); statistically significant biomarker associations in the correct direction were detected in 72% of observed cohorts across simulations (Table 1; Figure 5).
Figure 5:

Results for Scenario #4, corresponding to cohorts in which genomic testing events and survival events are each exponentially distributed following progression events. Inference results refer to whether a biomarker association in the correct direction was detected at two-sided p < 0.05 in the observed cohort. (a) Observed biomarker inference results as a function of number of patients observed and calculated biomarker effect in a random sample of the full (true) cohort equal in size to the size of the observed cohort; (b) observed biomarker hazard ratio versus biomarker hazard ratio measured in the true cohort; (c) distribution of Kendall’s tau statistics among simulated observed cohorts; (d) distribution of Cox coefficients for entry time among simulated observed cohorts; (e) distribution of observed median survival times minus true median survival times among simulated cohorts (simple risk set adjustment); (f) distribution of observed median survival times minus true median survival times among simulated cohorts (transformation modeling); (g) distribution of observed median survival times minus true median survival times among simulated cohorts (copula modeling); (h) distribution of observed log hazard ratio for biomarker effect from Cox models with risk set adjustment minus log hazard ratio for biomarker effect measured in the true cohort across simulations; (i) distribution of observed log hazard ratio for biomarker effect from Cox models with risk set adjustment and entry time as a covariate minus log hazard ratio for biomarker effect measured in the true cohort across simulations
Discussion
Simulations across four scenarios illustrate that bias stemming from informative cohort entry, leading to survival time underestimation and biased biomarker effects, may be present in clinico-genomic cohorts regardless of the conditional Kendall’s tau statistic or Cox coefficient for entry time, including in certain cases for which these statistics yield null values. The values of the statistics depend on the underlying survival and genomic testing (cohort entry) time distributions, and even null values may not always imply that simple risk set adjustment will yield unbiased inference when compared to the true underlying population that yielded an observed clinico-genomic cohort.
The inability of transformation and copula modeling to consistently correct the survival time underestimation introduced by genomic testing at times of increased mortality risk is notable. This may relate in part to incorporation of the Kendall’s tau statistic into the functions used in both types of modeling(8,9) to correct for dependent left truncation. The sensitivity of the statistic to intra-cohort heterogeneity in the relationship between survival and cohort entry times may translate into sensitivity of the outputs of transformation and copula modeling to that relationship. Further research into approaches to analysis of clinico-genomic data subject to informative cohort entry, particularly for heterogenous cohorts, is needed. Sensitivity analyses could constitute one key approach; that is, varying assumptions about the cohort entry process should be tested to examine the impact on analysis results.(7) Further work is also needed to define best practices for sensitivity analyses for observational clinico-genomic data subject to potentially informative left truncation, especially in the context of intra-cohort heterogeneity in the informative entry process.
The impact of informative cohort entry on clinico-genomic biomarker inference was also sensitive to the relationship between genomic testing (cohort entry) and survival times. When all patients in a cohort were subject to informative entry (Scenario #2), observed biomarker associations were consistently biased towards the null. This makes some intuitive sense, since given a detrimental biomarker that increases mortality risk and disproportionate genomic testing for increased mortality risk, biomarker-negative patients who have poorer prognoses could be disproportionately observed compared with all biomarker-negative patients, diminishing observed associations between the detrimental biomarker and survival. However, this dynamic was substantially diminished when even a small subgroup (~2%) of cohort patients underwent genomic testing independent of survival time (Scenario #3; Figures 4B–4C). This may occur in part because even a small proportion of patients entering early and independently of clinical risk contribute disproportionately to follow-up time in the overall cohort. Available methods for attempting to correct for informative entry do not address this type of heterogeneity. (8,9) It is also notable that risk set adjustment with inclusion of entry time as a covariate in Cox models did not yield unbiased biomarker inference.
The goal of this analysis was to empirically evaluate the performance of existing methods for identifying and ameliorating bias due to informative genomic testing in clinco-genomic datasets for a clinical and translational research audience; we have therefore avoided statistical notation and theory in our presentation. Simplifying limitations in simulations included the use of exponential distributions for event times and proportional hazards for biomarker effects, as well as selection of the distributions governing the relationships between genomic testing and survival times in each scenario. We strove to choose data generation parameter ranges that reflect clinically realistic ranges (eg yielding median true survival times measured in months, and including both rare and common biomarkers with weak or strong associations with survival). Still, different simulation assumptions could have yielded different quantitative results. Specifically, more complex survival time distributions and patterns of biomarker association, particularly situations in which biomarker status itself is independently associated with cohort entry time (such as occurs when patients receiving targeted therapy have genomic testing in search of mechanisms of therapy resistance), would require further study. Methods for analysis of a composite outcome, such as progression-free survival, in which one component of the outcome can occur prior to cohort entry but the other cannot, also require further research in the context of informative cohort entry.
In conclusion, novel statistical or analytic methods are needed to analyze clinico-genomic datasets subject to informative cohort entry, or genomic testing at moments of increased clinical risk, particularly given complex informative entry patterns in internally heterogenous cohorts. Additionally, careful attention to clinical context in formulating clinico-genomic research questions may help to minimize bias due to informative entry, since the extent of this bias may vary by cancer type and across the disease trajectory. At minimum, recording the indication for genomic testing could facilitate identification of those patients who entered a clinico-genomic cohort independent of their mortality risk so that subgroup analyses can be performed. Still, unbiased inference reflecting the underlying population of patients may require that clinico-genomic data be derived from cohorts in which testing is performed uniformly, without regard to clinical status, whenever possible.
FINANCIAL SUPPORT/GRANTS:
The authors wish to acknowledge funding from the National Institutes of Health/National Cancer Institute (R00CA245899, Kehl; and P30CA008748, Lavery, Brown, Panageas); Doris Duke Charitable Foundation (2020080, Kehl)
Drs. Kehl, Schrag, and Pangeas; and Ms. Brown and Ms. Lavery; report receiving research funding from the AACR as part of their efforts on AACR Project GENIE.
Footnotes
CONFLICT OF INTEREST: Drs. Kehl, Schrag, and Pangeas; and Ms. Brown and Ms. Lavery; report receiving research funding from the AACR Project GENIE Biopharmaceutical Consortium, involving derivation of clinico-genomic cohorts, relevant to the submitted work. The other authors declare no potential conflicts of interest.
References
- 1.AACR Project GENIE Consortium. AACR Project GENIE: Powering Precision Medicine through an International Consortium. Cancer Discov [Internet] 2017;7:818–31. Available from: http://www.ncbi.nlm.nih.gov/pubmed/28572459 [DOI] [PMC free article] [PubMed] [Google Scholar]
- 2.Singal G, Miller PG, Agarwala V, Li G, Kaushik G, Backenroth D, et al. Association of Patient Characteristics and Tumor Genomics With Clinical Outcomes Among Patients With Non-Small Cell Lung Cancer Using a Clinicogenomic Database. JAMA [Internet] 2019;321:1391–9. Available from: http://www.ncbi.nlm.nih.gov/pubmed/30964529 [DOI] [PMC free article] [PubMed] [Google Scholar]
- 3.Kehl KL, Schrag D, Hassett MJ, Uno H. Assessment of Temporal Selection Bias in Genomic Testing in a Cohort of Patients With Cancer. JAMA Netw Open [Internet] 2020;3:e206976. Available from: http://www.ncbi.nlm.nih.gov/pubmed/32511717 [DOI] [PMC free article] [PubMed] [Google Scholar]
- 4.Brown S, Lavery JA, Shen R, Martin AS, Kehl KL, Sweeney SM, et al. Implications of Selection Bias Due to Delayed Study Entry in Clinical Genomic Studies. JAMA Oncol [Internet] 2021; Available from: https://jamanetwork.com/journals/jamaoncology/fullarticle/2785693 [DOI] [PMC free article] [PubMed]
- 5.Martin EC, Betensky RA. Testing quasi-independence of failure and truncation times via conditional kendall’s tau. J Am Stat Assoc 2005;100:484–92. [Google Scholar]
- 6.Jones MP, Crowley J. Nonparametric tests of the Markov model for survival data. Biometrika 1992;79:513–22. [Google Scholar]
- 7.Backenroth D, Snider J, Shen R, Seshan V, Castellanos E, McCusker M, et al. Accounting for Delayed Entry in Analyses of Overall Survival in Clinico-Genomic Databases. Cancer Epidemiol Biomarkers Prev [Internet] 2022;1–7. Available from: http://www.ncbi.nlm.nih.gov/pubmed/35027431 [DOI] [PMC free article] [PubMed]
- 8.Emura T, Wang W. Nonparametric maximum likelihood estimation for dependent truncation data based on copulas. J Multivar Anal [Internet] 2012;110:171–88. Available from: http://www.sciencedirect.com/science/article/pii/S0047259X12000838 [Google Scholar]
- 9.Chiou SH, Austin MD, Qian J, Betensky RA. Transformation model estimation of survival under dependent truncation and independent censoring. Stat Methods Med Res [Internet] 2018;096228021881757. Available from: 10.1177/0962280218817573 [DOI] [PMC free article] [PubMed]
- 10.Sondhi A Estimating survival parameters under conditionally independent left truncation. Pharm Stat [Internet] 2022;21:895–906. Available from: http://www.ncbi.nlm.nih.gov/pubmed/35262259 [DOI] [PMC free article] [PubMed] [Google Scholar]
- 11.Austin MD, Betensky RA. Eliminating bias due to censoring in Kendall’s tau estimators for quasi-independence of truncation and failure. Comput Stat Data Anal [Internet] 2014;73:16–26. Available from: http://www.ncbi.nlm.nih.gov/pubmed/24505164 [DOI] [PMC free article] [PubMed] [Google Scholar]
- 12.Zheng M, Klein JP. Estimates of marginal survival for dependent competing risks based on an assumed copula. Biometrika [Internet] 1995;82:127–38. Available from: 10.1093/biomet/82.1.127 [DOI] [Google Scholar]
- 13.Chiou SH (Steven). tranSurv: Estimating a Survival Distribution in the Presence of Dependent Left Truncation and Right Censoring [Internet] 2019. Available from: https://cran.r-project.org/package=tranSurv
- 14.Emura T. Package “depend.truncation” [Internet] [cited 2022. Jun 22]. Available from: https://cran.r-project.org/web/packages/depend.truncation/depend.truncation.pdf
Associated Data
This section collects any data citations, data availability statements, or supplementary materials included in this article.
Data Availability Statement
Analysis code and derived simulation datasets are available at github.com/prissmmnlp/informative_entry_sims.