

Abstract
High-resolution magic angle spinning (HRMAS) nuclear magnetic resonance (NMR)-based metabolomics has demonstrated its utility in studies of biofluids for various diseases. HRMAS NMR spectroscopy is uniquely well-suited for analyzing human blood samples due to the small quantity of sample and minimal preparation required. To develop this methodology into standardized clinical protocols, establishment of the method’s quality assurance (QA) and evaluations of its quality control (QC) are critical. This study aims to assess the QA/QC measured from human blood specimens in the form of serum and plasma through within-subject and between-subject comparisons, as well as stability and consistency comparisons over several freezing-thawing cycles of sample storage conditions, and most importantly, the agreement of pooled control samples against individual samples.
Keywords: nuclear magnetic resonance (NMR), spectroscopy, quality control, quality assurance, metabolomics
Graphical Abstract
This study aims to assess the QA/QC measured from human blood specimens in the form of serum and plasma through within-subject and between-subject comparisons, as well as stability and consistency comparisons over several freezing-thawing cycles of sample storage conditions and the agreement of pooled control samples against individual samples.
Introduction
As downstream biological processes from genomics, proteomics, and transcriptomics, metabolomics evaluate the entire measurable metabolic activities of all physiological and pathological processes and may be the most informative presentation of health and medical status prior to pathological manifestations1. The field of metabolomics has enabled studies to characterize, quantify, and measure the abundance of metabolites associated with human physiology and pathology. Profiling these biochemical activities can provide insights into the human body’s inner workings and health2.
Metabolomics studies are mainly conducted using nuclear magnetic resonance (NMR) spectroscopy and mass spectrometry (MS). MS can measure metabolites at low concentrations of pico- or femto-molar levels, while NMR detections can only reach micro- or nano-molar levels. However, NMR has various advantages that are superior to MS. For instance, NMR requires minimal-to-no sample preparation and is cost-effective, rapid, robust, reproducible, quantitative, nonselective for untargeted studies, and nondestructive3. In addition, NMR can detect various chemical and physical properties that cannot be revealed by MS, including pH, molecular diffusions, and physical environments, such as liquid vs. solid environments4. These factors have made it an excellent candidate for studying disease and drug development3. Most significantly, NMR-based disease metabolomic profiles have the potential to be implemented in clinical through in vivo spectroscopic evaluations using the widely available full-body MRI scanners. Furthermore, NMR allows for the monitoring of changes in metabolic profiles following different treatment strategies or natural disease progression using either in vivo or in situ study designs, now often referred to as fluxomics5,6.
In recent years, high resolution magic angle spinning (HRMAS) proton (1H) NMR has become an innovative platform for studies of NMR-based metabolomics of non-aqueous biological materials7. This technique has been utilized extensively in studies of the underlying molecular mechanisms of both human diseases and disease animal models through analyses of different biological samples, including intact tissues, cell cultures, and biofluids5. Metabolomics studies of human biofluids, such as the blood, are advantageous over the usage of other biological samples for characterizing the presence or alteration of biological activities associated with health and diseases through non- or minimal-invasive procedures. However, the NMR metabolomics study of blood also faces several challenges4. Although blood is a liquid, it is not an aqueous solution due to the presence of cells, proteins and macro-molecules, which limits observations of high-resolution NMR spectra using traditional solution NMR methods. Further, traditional solution NMR requires at least a few hundred micro-liters of samples, which may be difficult to obtain, particularly with well-characterized, retrospective and precious specimens. These technical and clinical difficulties in metabolomic evaluations of human blood can be resolved by using HRMAS NMR. To produce a high-resolution NMR spectrum, HRMAS NMR only requires 1~10 micro-liters of blood, either in the form of either serum or plasma, with minimal sample preparation, and a few minutes for a direct measurement, which can occur either locally or remotely. Considering these advantages, the analysis of human blood via HRMAS NMR has been utilized to develop metabolomics screening tools for human diseases8,9, and discussed in a recent review4.
To advance this technology from pre-clinical research to potential clinical implementation, clinical NMR-based metabolomics, including HRMAS NMR, must be systematically evaluated by quantifying its consistency and reproducibility, including tasks associated with quality assurance (QA) and quality control (QC)10, as reviewed and discussed in this Special Issue by Maroli and Powers11. Here, as the first step towards standardization, we introduce a QA/QC protocol, including: 1) sample collection, 2) storage conditions, and 3) NMR reproducibility, for the establishment of human HRMAS NMR metabolomics through evaluations of blood specimens. We define and report our systematic evaluation of an NMR-based blood metabolomic platform for the study of human blood serum and plasma samples. Specifically, for sample collections, we measured several distinct human plasma samples from the same individuals to quantify within-subject variability, and samples from different subjects to quantify between-subject variability; for sample storage conditions, we analyzed human serum samples through serial measurements after multiple freeze-thawing cycles for experimental stability; and for NMR reproducibility, we compared pooled controls for both serum and plasma samples with their corresponding individual samples.
Methods
Studies of human blood specimens were approved by the IRB of Massachusetts General Hospital as a secondary use of human materials. Blood samples from Alzheimer’s disease (AD) patients, prostate cancer patients, and healthy controls were obtained from our local biospecimen repositories to assess the goals of our systematic evaluation of the NMR-based human blood metabolomic platform. Since the aims of the current study focused on QA/QC evaluations only, no disease status comparisons (e.g., AD vs controls or prostate cancer status) were performed.
Alzheimer’s Disease Plasma.
A total of 45 frozen blood plasma samples from two sources were obtained: 30 cross-sectional samples (20μL of plasma per subject) were obtained from the Massachusetts Alzheimer’s Disease Research Center (MADRC), and 15 longitudinal samples (n=5, 3 replicates two weeks apart) from the Short-Term Stability of Blood Biomarkers for Alzheimer’s Disease Clinical Trials (STS). Six pooled plasma samples were generated, with equal volumes from each of the 30 individual MADRC samples. To produce these pooled samples, after thawing on ice, two well-vortexed 2.5μL samples were extracted from each of the 30 plasma samples and mixed with 7.5μL of D2O each to produce two H2O:D2O=10:1 samples. These two samples were then well-vortexed and each divided into three subsamples to form the final six pooled samples. The STS samples were used to evaluate both temporal within-subject and cross-sectional between-subject metabolic changes.
Prostate Cancer Serum.
Human blood serum samples from progressive (A, n=6) and non-progressive (B, n=6) prostate cancer patients were obtained from the MGB BioBank. For each group, a pooled control sample was generated by combining 20μL of serum from each individual sample into a single 120μL aggregate sample. This procedure was repeated three times to produce three biological replicates of pooled samples for each group. These pooled replicate samples, denoted as Pooled Control Samples A and B, were used to evaluate 1) the stability and consistency of the human blood serum NMR metabolomics following three cycles of −80°C freezing-thawing processes by thawing on ice, and then freezing again at −80°C, as one cycle of freezing-thawing treatment, with two weeks between each cycle, and 2) the reproducibility of the NMR platform, by analyzing them against the averages of individual samples from which the pooled samples were generated.
HRMAS NMR.
All NMR measurements were conducted on a Bruker AVANCE HD III 600MHz spectrometer (Bruker BioSpin, Billerica, MA). Before measurements, all samples were allowed to thaw for approximately an hour on ice. After being vortexed, either 10μL of the individual plasma sample and 2.5μL of D2O, or 12μL of the pooled controls, were added to the 4mm rotor, with a 12μL Kel-f insert. HRMAS NMR data were collected at 4°C, with a spinning rate of 3600Hz and using a rotor-synchronized CPMG method. The other spectral conditions included a recycle time of 5s, 100 CPMG p-pulses with a total mixing time of 55.56ms, 16K data points with a total acquisition time of 0.85s, and a spectral width of 16ppm.
Data Processing.
Spectral analysis was conducted off-line using spectral processing procedure including: 0.5Hz line-broadening, one time zero-fill to 32K data points, Fourier transformation, automatic and manual phasing, baseline correction, chemical shift calibration according to the up-field peak of lactate doublets at 1.32ppm, and resonance peak curve-fitting for complete deconvolutions. Resonance peaks were considered as having finite and non-zero values if their deconvoluted peak intensities were greater than the threshold defined as 1% of the median of all the curve-fitted peaks, calculated for prostate cancer sera, and AD and non-AD plasmas, respectively.
For the prostate cancer serum study, 30 spectral regions were identified with spectral values ranging from 4.5 to 0.5ppm. The intensity for each spectral region was normalized by the sum of all 30 spectral regions. For AD and non-AD plasma samples, 32 spectral regions between 5.5 to 0.5ppm were analyzed. However, due to the presence of water and EDTA resonances, regions between 5.1 and 4.5ppm, and four regions of 3.68–3.55, 3.29–3.04, 2.72–2.67, and 2.59–2.52 were excluded from all subsequent analyses. All remaining 28 spectral regions were then normalized relative to the total spectral intensity. The associated deconvoluted spectral peak intensities were identified for further statistical analyses.
Statistical Analysis.
To quantify the within-subject variability of the STS non-AD cohort, the coefficient of variation (CV=standard deviation/mean) was computed for each subject and spectral region. Subject-specific average CV measurements, mean CV=M(CV), were computed over the three monitoring periods. For each spectral region, an analysis of variance (ANOVA) was performed to quantify between-subject cross-sectional comparisons. Separate linear regression models were constructed to quantify the subject-specific association between the log-transformed spectral relative intensity value and time (loge(spectral relative intensity|time) = β0+βtime*time+ε where time = 0, 14, 28). Robust standard errors were computed to account for multiple measurements per subject1. The Wald test was performed to assess the association between time and relative intensity (H0: βtime=0 vs H1: βtime≠0).
A similar analytic approach was adopted to evaluate possible procedure-induced blood metabolomics alterations due to multiple freeze/thaw preparations, as well as to assess NMR reproducibility using serum and pooled samples from prostate cancer cohorts. Here, between-subject comparisons were conducted among three replicates of two pooled controls using an ANOVA, and within-subject comparisons were assessed by constructing spectrum-specific regression models in which the log-transformed spectral relative intensity value was regressed onto the replicate number.
Finally, separate linear regression models were constructed to quantify the association between aggregated data from pooled control samples and individual samples. Model parameters and their 95% confidence intervals, based on robust variance estimates, were estimated and compared to null hypothesized values associated with the identity line (intercept=0, slope=1).
For each platform objective, the statistical significance level was defined as α = 0.05, and separate false-discovery rate (FDR) adjusted p-values were computed to account for multiple comparisons. All analyses were performed using JMP (Cary, NC) and R 4.1.2.
Results
Temporal Within-subject and Between-subject Human Blood Plasma Metabolomic Alterations
Results obtained from blood plasma samples of five STS non-AD subjects are presented in Fig. 1. The mean CV, averaged across eligible spectra and time, ranged from 0.277 (subject B3708) to 0.409 (subject B3704). Figure 1A depicts the average spectral intensity values, together with +1 standard deviation as shaded areas for subjects B3704 and B3708. The lack of visible shading indicates that the within-subject variation is small, implying agreement across the three measurements. To quantify between-subject spectral differences, CV estimates for each spectral region are plotted in Fig. 1B. The color of each bar corresponds to the significance levels when comparing CV estimates across subjects via ANOVA (purple, pFDR < 0.05; red, p<0.05; brown, p>0.05). Subject-specific average spectral intensity values over the tested three time points are presented via boxplots in Fig. 1C. Note, the y-axis labels are fixed for all subfigures summarized in Fig. 1C. For all subfigures except 1.34–1.27, a magnified subfigure is provided. P-values, with a similar color-coded scheme as Fig 1B, were computed from the log-linear regression models.
Fig. 1. Quantification of within- and between-subject variation in plasma metabolomics.

A) Examples of spectra averaged over three follow-ups with standard deviations presented as subject-specific color shades highlighting each sub. The lack of visible shading indicates that the within-subject variation is small implying agreement among the three measurements. B) CV estimates by subject and spectral region for all STS subjects. C) Within- and between-subject variation in the spectral intensities (Spec. Int.; in arbitrary units, a.u.) used in B). The vertical axis scale was held constant between plots to show the variation, or lack thereof, among the different spectral regions. P-values were computed using either ANOVA (1B) or log-linear regression models (1C) and color-coded by significance level (pFDR < 0.05; red, p<0.05; brown, p>0.05).
Temporal alteration trends and their magnitudes are presented in Fig. 2. Fig. 2A summarizes the relationship between the coefficient associated with time (βtime, for each unit increase time) by spectral region and the p-values associated with these trends. Given that there were no significant findings after the FDR-correction, this plot shows unadjusted p-values only. Significant values (<0.05) are labeled in red and are brown, otherwise. Spectral regions that presented potential trends over the examined three time points are shown as red points circled in green in the plot (i.e., −ln(0.05)=−loge(0.05)=2.995). Regions that presented possible trends but failed to reach significant levels are shown as brown points with green circles. Selected examples of spectra that depict different temporal trends (e.g., 1.34–1.27 [decreasing], 3.39–3.37 [increasing]) are illustrated in Fig. 2B where colors correspond to individual subjects (e.g., B3703 = blue).
Fig. 2. Evaluations of temporal metabolomics changes in human plasma.

A) Log-linear regression coefficients associated with time (βtime) and their corresponding p-values (labeled −ln(p)=-loge(p)). Points are color coded according to (purple, pFDR < 0.05; red, p<0.05; brown, p>0.05). Green circles surrounding the points represent potential trends of spectral regions over the examined three time points (i.e., −ln(0.05)=2.996). B) Raw values by spectra, time and subject (color-coded by subject; e.g. B3703 = blue). Similar as in Fig. 1C, all y-axes are fixed for all subfigures summarized in Fig. 2B. For all subfigures except 1.34–1.27, a magnified subfigure is provided. All p-values correspond to Wald tests evaluating temporal trends.
Potential Metabolomic Changes of Human Blood Sera over Multiple Freezing-Thawing Cycles
Summaries associated with the potential metabolomics alterations due to multiple freezing-thawing cycles are presented in Fig. 3. Fig. 3A summarizes the results obtained for the three replicates of each of the two pooled samples (A and B) by plotting the parameter estimate, βreplicate, and its associated p-value for each the 30 spectral regions. Spectral regions presented significant possible trends over the examined three freezing-thawing cycles are indicated with green circles surrounding the points of spectral regions in the plot. Selected examples of the observed trends are illustrated in Fig. 3B.
Fig. 3. Metabolomic alterations due to multiple freezing-thawing cycles for pooled control samples.
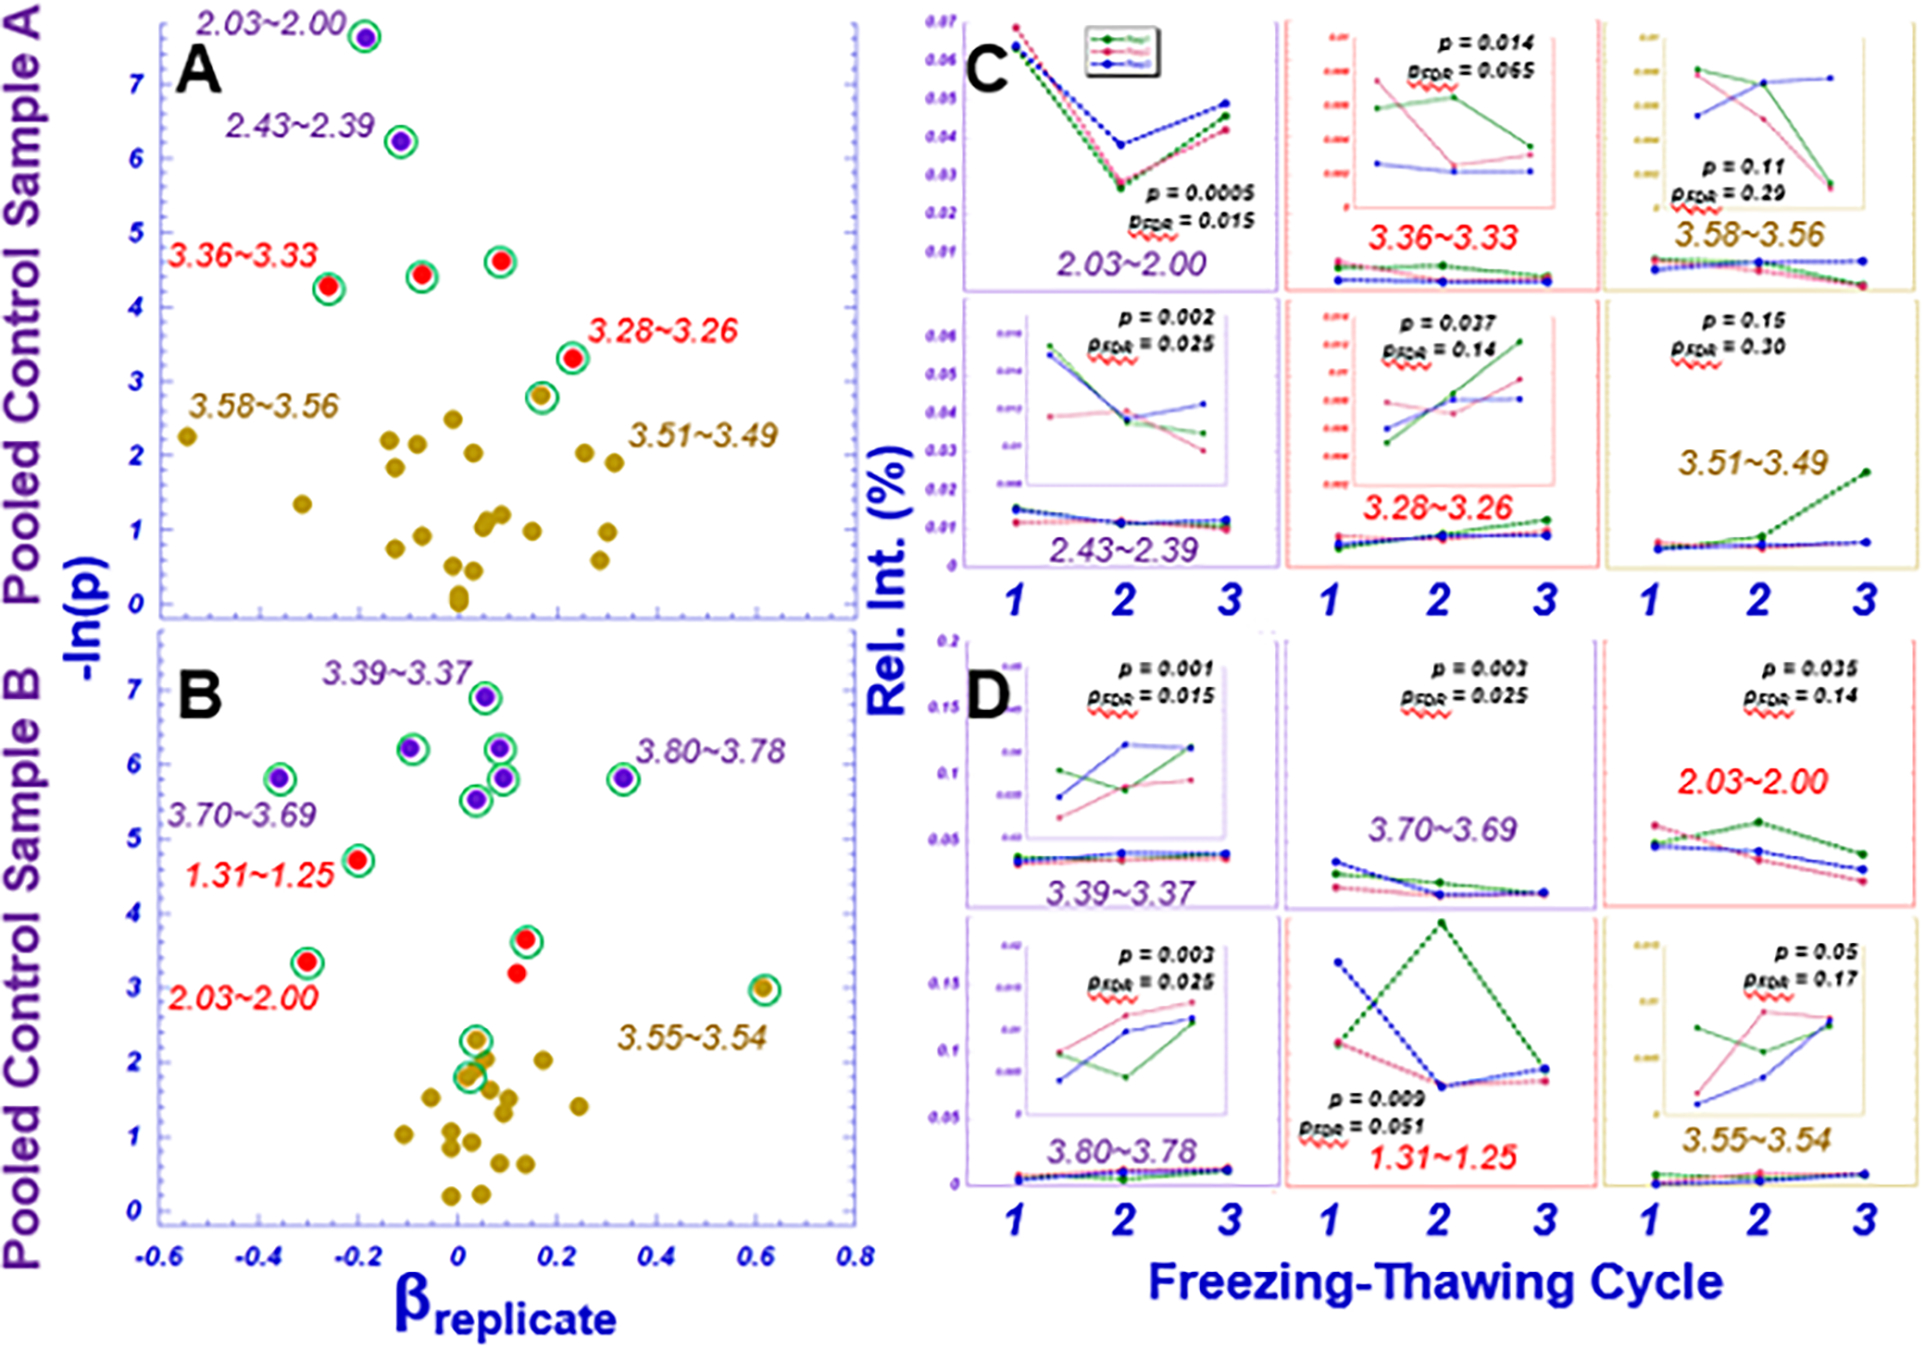
A and B. A, B) Regression coefficients associated with replicate and their corresponding Wald p-values (labeled −ln(p)). Points are color-coded according to statistical significance (purple, pFDR < 0.05; red, p<0.05; brown, p>0.05). Green circles surrounding the points represent possible trends of spectral regions over the examined three time freezing-thawing cycles. C, D) Raw subject-specific spectral values by replication number.
The variations among different biological replicates for each pooled sample are shown in Supplementary Figs. 1A and 1B. Representative spectral regions measured from each biological replicate and freezing-thawing cycle are presented in Supplementary Figs. 1C and 1D, for samples A and B, respectively.
Quality Control: Pooled Control Samples vs. Individual Samples
Systematic QC for the NMR measurements were evaluated by comparing pooled control (serum or plasma) samples with individual samples from which the pooled samples were generated. Fig. 4 presents data obtained from serum samples from prostate cancer patients in two six-patient groups, A and B, as previously discussed. For group A, the estimated intercept and slope were 0.000 (−0.001, 0.005) and 0.94 (0.82, 1.06), respectively. Thus, there was insufficient evidence to conclude that the intercept differed from 0 (p=0.242) and the slope differed from 1 (p=0.352), which indicated that the intensities of the pooled control samples are nearly equivalent to the average intensities of the individual samples for the 30 measurable spectral regions. Similar results were obtained using group B (intercept: 0.002 (−0.001,0.004), slope: 0.95 (0.88, 1.02)).
Fig. 4. Evaluations of individual samples and their pooled control samples for human serum specimens.

Linear association between mean spectral intensities (Spec. Int.) for individual samples and pooled control of biological replicates for control groups A and B. In each plot, the red dotted line represents the line of equality (intercept=0, slope=1) and the black line depicts the fitted regression with the corresponding 95% pointwise confidence interval.
Similar tests comparing pooled controls vs. individual plasma samples were further investigated with specimens obtained from Alzheimer’s disease patients. Similar patterns were observed, and the results have been included in the Supplementary Materials section. Supplementary Fig. 2 demonstrates a linear correlation between the means of 30 individual samples and the six pooled controls for the 30 analyzed spectral regions, with the tangent close to 1 and the intercept through 0, demonstrating reliability of the NMR system.
Discussion
Conceptually, there are two essential assumptions that determine whether blood metabolomics can be considered as phenotypes of a specific physiological or pathological condition. First, blood metabolomics measures for an individual should be reasonably consistent, i.e. variations smaller than the level of the systematic error range and within a time period shorter than the time scale for the development of a chronic condition. Second, metabolomics variations within a single subject, in general, should not greatly exceed metabolomics differences between subjects, i.e. within-subject < between-subject differences.
In the current study, using HRMAS NMR enabled us to measure samples in 10μL volumes, so we could perform studies of human blood samples with a limited supply of ~20μL. However, with such limited quantities of precious human samples, the precision of pooled control samples generated with ~2.5μL from each individual sample presents a certain degree of uncertainty, such as the variations seen among individual pooled control samples shown in plots in Figs. 3C, 3D, S1C, and S1D. Nevertheless, despite these variations, the ability of the pooled control samples to represent their corresponding individual samples was demonstrated by their close-to-ideal, as defined as the identity line, linear relationships in Figs. 4 and S2 for both serum and plasma samples, respectively.
Comparing Figs. 1B with Supplementary Fig. 1A and 1B, more than half of the analyzed spectral regions presented significant means differences in Fig. 1B, but only one or two significant regions can be seen in Supplementary Figs. 1A and 1B, respectively. This finding is of no surprise since the former (Fig. 1B) analyzed biological variations among five different human subjects, while the latter (Supplementary Figs. 1A and 1B) tested pooled controls of three biological replicates.
The current study focused on evaluating spectral or metabolic intensities as functions of temporal variations in an individual (c.f. Fig. 2), or effects of sample storage conditions through multiple freezing-thawing cycles (c.f. Fig. 3). Other than the spectral region of 1.34~1.27, which contains largely lipids and lactate, changes in other regions are insignificant due to the small fold changes, lack of trends, and low relative spectral intensities, as seen in Fig. 2. Overall, including the 1.34~1.27 spectral region, there are no significant p-values associated with trends after FDR corrections. Therefore, for the purpose of evaluating potential temporal human blood plasma metabolite changes over a period of a month as a QA parameter, the average fold change is about 1.08±0.16, or less than 10%, which can be considered as being within the range of NMR experimental errors of 5~10%.
Compared with potential short-term temporal metabolic variations measured from an individual, potential temporal trends of metabolic changes due to sample treatments, such as the multiple freezing-thawing cycles tested in this study, can be unidirectional. Comparing Figs. 3A and 3B with Fig. 2A, more spectral regions presented significant trends as indicated by the numbers of significant p-values after FDR corrections. However, even with these trend p-value significant regions, the effect of these trends are clinically insignificant due to the small fold changes and low relative spectral intensities, that can be seen in Fig. 3C and 3D. Furthermore, among these tested regions for both pooled samples A and B, only one spectral region in sample A, 2.03~2.00 presented significant p-value when comparing means of its three replicates over the three tested cycles, as seen in Fig. 3C. While this observation was interesting and needed further studies to evaluate, its biological explanations are unclear. Overall, similarly as that observed with the above presented plasma studies, the average fold changes observed with these two pooled serum samples were measured as 1.02±0.19 and 1.07±0.20, respectively.
NMR sample preparation has been shown to improve NMR specificity12. As such, there are a number of limitations that warrant attention. First, the number of tested samples was limited, which limits the types of analyses performed, the power of such analyses, and thus the application of the results. Second, for the freezing-thawing evaluations, prior to our initiation of the first freezing-thawing cycle, the human blood samples had experienced at least two more cycles of freezing-thawing after their collection from human subjects: the initial freezing, the thawing to generate the pooled samples, and then the second freezing. Future experimental designs to precisely evaluate possible freezing-thawing effects should consider eliminating any such additional cycles. In addition to freezing-thawing, other treatment effects should also be tested, for instance the length of sample storages. For plasma studies, sample preparations with different agents may also need to be evaluates to establish different parameters. Third, as a technical evaluation study, here we only reported our results in terms of spectral regions, without further analysis into their represented metabolites. Finally, while we involved pooled controls in this study, we did not measure these samples in rigorous intervals within the data collection period. In future studies, controls should be measured at regular intervals. Due to the above stated limitations and focus of this work, we decided to omit discussion of the observed trends according to metabolic pathways to avoid interpretations that may be premature. Nevertheless, possible major contributing metabolites involved in the discussed spectral regions can be found in related literature.
Conclusion
Developing standard quality assurance protocols will improve the accuracy of clinical pathology and the development of linkages between ex-vivo tumor evaluation and in-vivo non-invasive diagnosis for a wide range of human malignancies. As the first step towards the development of QA/QC procedures for metabolomics evaluations of biofluids, the current study analyzed human blood plasma and serum samples, collected from the same subjects at different time points. After several freezing-thawing cycles related to QA, we tested pooled controls against individual samples as NMR systematic QC. Our findings based on HRMAS NMR analysis of human blood serum and plasma sample demonstrated both sample stability and system reproducibility for analysis of biological specimens. The evaluations and the procedures designed for these evaluations are critical for the development of MRS based metabolomics for various disease of concern.
The present study of QA/QC, however, may only be considered an example of how to approach this process; more precise QA/QC procedures for a specific potential clinical application will need to be designed and tested individually. Further studies may consider that the “spin noise tuning optimum” (SNTO) and sample tube selection have been shown to improve sensitivity and resolution for NMR spectra13,12. The present study used traditional 5mm NMR tubes and did not calibrate the spectra collection instrument to the SNTO. The aim of the present study was to demonstrate the importance of QA/QC procedures and present one basic method for quality control, which did not include tuning and specificity enhancements. Nonetheless, future efforts may consider implementing additional measures to improve sample preparation and spectral sensitivity and resolution.
Supplementary Material
Acknowledgments
The MADRC biorepository is supported by NIH-NIA P30AG062421.
The study is supported by NIH NIA AG070257, NCI CA243255, R01CA115746, R01CA115746S1, R01AG070257, R01CA273010, S10OD023406, and MGH A. A. Martinos Center for Biomedical Imaging.
Abbreviations
- NMR
nuclear magnetic resonance
- HRMAS
high resolution magic angle spinning
- QA
quality assurance
- QC
quality control
- AD
Alzheimer’s disease
- MADRC
Massachusetts Alzheimer’s Disease Research Center
- STS
Short-Term Stability of Blood Biomarkers for Alzheimer’s Disease Clinical Trials
References
- 1.Cheng L, Pohl U. The Role of NMR-Based Metabolomics in Cancer. In: The Handbook of Metabonomics and Metabolomics.; 2007:345–374. doi: 10.1016/B978-044452841-4/50014-X [DOI] [Google Scholar]
- 2.Bell JD, Brown JC, Sadler PJ. NMR studies of body fluids. NMR Biomed. 1989;2(5–6):246–256. doi: 10.1002/nbm.1940020513 [DOI] [PubMed] [Google Scholar]
- 3.Emwas AH, Szczepski K, Poulson BG, et al. NMR as a “Gold Standard” Method in Drug Design and Discovery. Molecules. 2020;25(20):4597. doi: 10.3390/molecules25204597 [DOI] [PMC free article] [PubMed] [Google Scholar]
- 4.Emwas AH, Roy R, McKay RT, et al. NMR Spectroscopy for Metabolomics Research. Metabolites. 2019;9(7). doi: 10.3390/metabo9070123 [DOI] [PMC free article] [PubMed] [Google Scholar]
- 5.Bothwell JHF, Griffin JL. An introduction to biological nuclear magnetic resonance spectroscopy. Biol Rev Camb Philos Soc. 2011;86(2):493–510. doi: 10.1111/j.1469-185X.2010.00157.x [DOI] [PubMed] [Google Scholar]
- 6.Judge MT, Wu Y, Tayyari F, et al. Continuous in vivo Metabolism by NMR. Front Mol Biosci. 2019;6. Accessed September 12, 2022. https://www.frontiersin.org/articles/10.3389/fmolb.2019.00026 [DOI] [PMC free article] [PubMed]
- 7.High-resolution magic angle spinning NMR for intact biological specimen analysis: Initial discovery, recent developments, and future directions - Cheng - NMR in Biomedicine - Wiley Online Library. Accessed September 12, 2022. 10.1002/nbm.4684 [DOI] [PubMed]
- 8.Schult TA, Lauer MJ, Berker Y, et al. Screening human lung cancer with predictive models of serum magnetic resonance spectroscopy metabolomics. Proc Natl Acad Sci. 2021;118(51):e2110633118. doi: 10.1073/pnas.2110633118 [DOI] [PMC free article] [PubMed] [Google Scholar]
- 9.Weng J, Muti IH, Zhong AB, et al. A Nuclear Magnetic Resonance Spectroscopy Method in Characterization of Blood Metabolomics for Alzheimer’s Disease. Metabolites. 2022;12(2):181. doi: 10.3390/metabo12020181 [DOI] [PMC free article] [PubMed] [Google Scholar]
- 10.Lu W, Su X, Klein MS, Lewis IA, Fiehn O, Rabinowitz JD. Metabolite Measurement: Pitfalls to Avoid and Practices to Follow. Annu Rev Biochem. 2017;86:277–304. doi: 10.1146/annurev-biochem-061516-044952 [DOI] [PMC free article] [PubMed] [Google Scholar]
- 11.Maroli AS, Powers R. Closing the gap between in vivo and in vitro omics: using QA/QC to strengthen ex vivo NMR metabolomics. NMR Biomed. Published online August 8, 2021:e4594. doi: 10.1002/nbm.4594 [DOI] [PMC free article] [PubMed] [Google Scholar]
- 12.Chandra K, Al-Harthi S, Sukumaran S, et al. NMR-based metabolomics with enhanced sensitivity. RSC Adv. 2021;11(15):8694–8700. doi: 10.1039/D1RA01103K [DOI] [PMC free article] [PubMed] [Google Scholar]
- 13.Lutz NW, Bernard M. Methodological Developments for Metabolic NMR Spectroscopy from Cultured Cells to Tissue Extracts: Achievements, Progress and Pitfalls. Molecules. 2022;27(13):4214. doi: 10.3390/molecules27134214 [DOI] [PMC free article] [PubMed] [Google Scholar]
Associated Data
This section collects any data citations, data availability statements, or supplementary materials included in this article.