

Summary
A paradox exists in our understanding of motion processing in the primate visual system: neurons in the dorsal motion processing stream often strikingly fail to encode long range and perceptually salient jumps of a moving stimulus. Psychophysical studies suggest that such long range motion, which requires integration over more distant parts of the visual field, may be based on higher order motion processing mechanisms that rely on feature or object tracking. Here we demonstrate that ventral visual area V4, long recognized as critical for processing static scenes, includes neurons that maintain direction selectivity for long range motion even when conflicting local motion is present. These V4 neurons exhibit specific selectivity for the motion of objects, i.e., targets with defined boundaries, rather than the motion of surfaces behind apertures, and are selective for direction of motion over a broad range of spatial displacements and defined by a variety of features. Motion direction at a range of speeds can be accurately decoded on single trials from the activity of just a few V4 neurons. Thus, our results identify a novel motion computation in the ventral stream that is strikingly different from, and complementary to, the well-established system in the dorsal stream, and they support the hypothesis that the ventral stream system interacts with the dorsal stream to achieve a higher level of abstraction critical for tracking dynamic objects.
Keywords: Visual system, monkey, area V4, motion processing, higher-order motion processing, high-density neurophysiology, Neuropixels probe
Graphical Abstract

eTOC Blurb
Bigelow et al., identify a novel motion computation in the primate ventral stream, complementary to the well-established system in the dorsal visual stream, that is sensitive to long range motion and specialized for tracking dynamic objects defined by luminance, texture or chromatic cues over a broad range of spatiotemporal displacements.
Introduction
Decades of studies confirm robust motion direction selectivity in neurons across successive stages of the dorsal visual stream1–6, but equally compelling cases of a dissociation between neural and perceptual responses in critical dorsal stream areas indicate that the process of identifying neuronal correlates of motion perception remains incomplete7–10. This premise is strongly supported by psychophysical studies that have long hypothesized the existence of multiple motion processing systems in the primate brain. Braddick11 proposed a “short-range” process that relies on processing at an early level of the visual cortex and a “long-range” process that relies on higher-order cognitive or interpretive processes. Sperling and colleagues12 proposed a three-system theory: a low-level/first-order (luminance-based) system, a second-order (texture-based) system and a higher order object/feature based system. FMRI and lesion studies13,14 provide evidence that these alternative motion processing mechanisms may reside in distinct brain loci, some outside the dorsal visual pathway. Our goal was to evaluate whether area V4, an intermediate stage in the visual form processing pathway, may contribute to a distinct motion processing system that may be based on feature/object tracking. To do so, we leveraged the long range versus local motion conflict stimulus10 for which a single neuron correlate of perception has not been identified anywhere in the primate brain.
When local, drifting motion within a static aperture is pitted against long range, object motion (the object being a distinct patch of texture, see Videos S3 and S4) with large spatial displacements, a striking case of dissociation between neural responses and perceptual report occurs: neurons in dorsal areas MT and MST are sensitive only to the local motion even though the long range motion is perceptually more salient10,15,16. We hypothesized that ventral visual area V4, an important stage for object form processing, may be involved in the processing of such long range motion. V4 in fact contains many direction selective neurons17–21 and has strong interconnections with dorsal stream areas, including area MT22. To test this hypothesis, and make a direct comparison to area MT, we studied responses of single V4 neurons to a set of long range motion stimuli that included those used by Hedges and colleagues10. We also used high-density Neuropixels probes to characterize the direction sensitivity of V4 neurons at a range of spatiotemporal displacements and for chromatically defined objects. Our results identify a novel motion computation in the ventral stream that is sensitive to both short and long range motion but differentiates between the motion of objects that change position over time versus surfaces that drift in place.
Results
We studied the responses of 115 well-isolated neurons (62 in M1; 53 in M2) in V4 to patches of spatial noise (LRM_noise, where LRM indicates long range motion) or sinusoidal gratings (LRM_sinusoid) that were displaced intermittently across the visual display in eight different directions (Figure 1A). The spatial displacements (dX) ranging from 0.70° to 2.43° (see Figure 2A) were scaled to the estimated RF size, and the temporal displacements (dT) were fixed at 100 ms. These stimuli induce the percept of a moving object (see Videos S1–S4). In this context, “object” simply refers to a foreground stimulus with a boundary that belongs to it and moves with it. This contrasts with a localized drifting motion stimulus behind a static aperture (see Video S5). Long range motion stimuli with noise patches typically evoked stronger peak responses than sinusoids (Δ = 4.4 spikes/s, p < 0.01, paired t-test), but for both types of stimuli, a significant fraction of V4 neurons (19% for LRM_sinusoid and 29% for LRM_noise stimuli) showed direction selective responses to long range motion (Figure 1B; each row shows an example neuron) based on two criteria: responses were significantly modulated by motion direction (one-way ANOVA; p < 0.05) and had a direction index DI ≥ 0.5 (see Star Methods). For comparison, we also studied responses to the stimulus most commonly used to assess sensitivity to motion direction—a sinusoidal grating that drifts locally within a static aperture (see Figure 1B, Local, also Video S5). With these stimuli, only ~10% of V4 neurons showed a statistically significant modulation of responses and DI ≥ 0.5. We also found that DILocal exhibited a weak or no correlation with DILRM_sinusoid and DILRM_noise, respectively (Figure S1AB). Results across the two monkeys were highly consistent (Figure S1D). Unlike prior studies in MT and V123,24, we studied each neuron at one dX value and did not attempt to find the largest dX at which neurons exhibit direction selectivity. When we evaluated how the strength of DI depends on dX across the V4 population, we found that many V4 neurons exhibited moderate to strong selectivity for motion direction over a range of step sizes (0.7° < dX < 2.5°) for long range motion stimuli (Figure 2A). Importantly, V4 neurons exhibited direction selectivity for dX values much larger than the maximum dX values reported for V1 and MT by Churchland et al.23 and, when matched for RF width, well above the mean for V1 and MT reported by Mikami et al.24 (Figure S2).
Figure 1. V4 responses to long range motion stimuli.
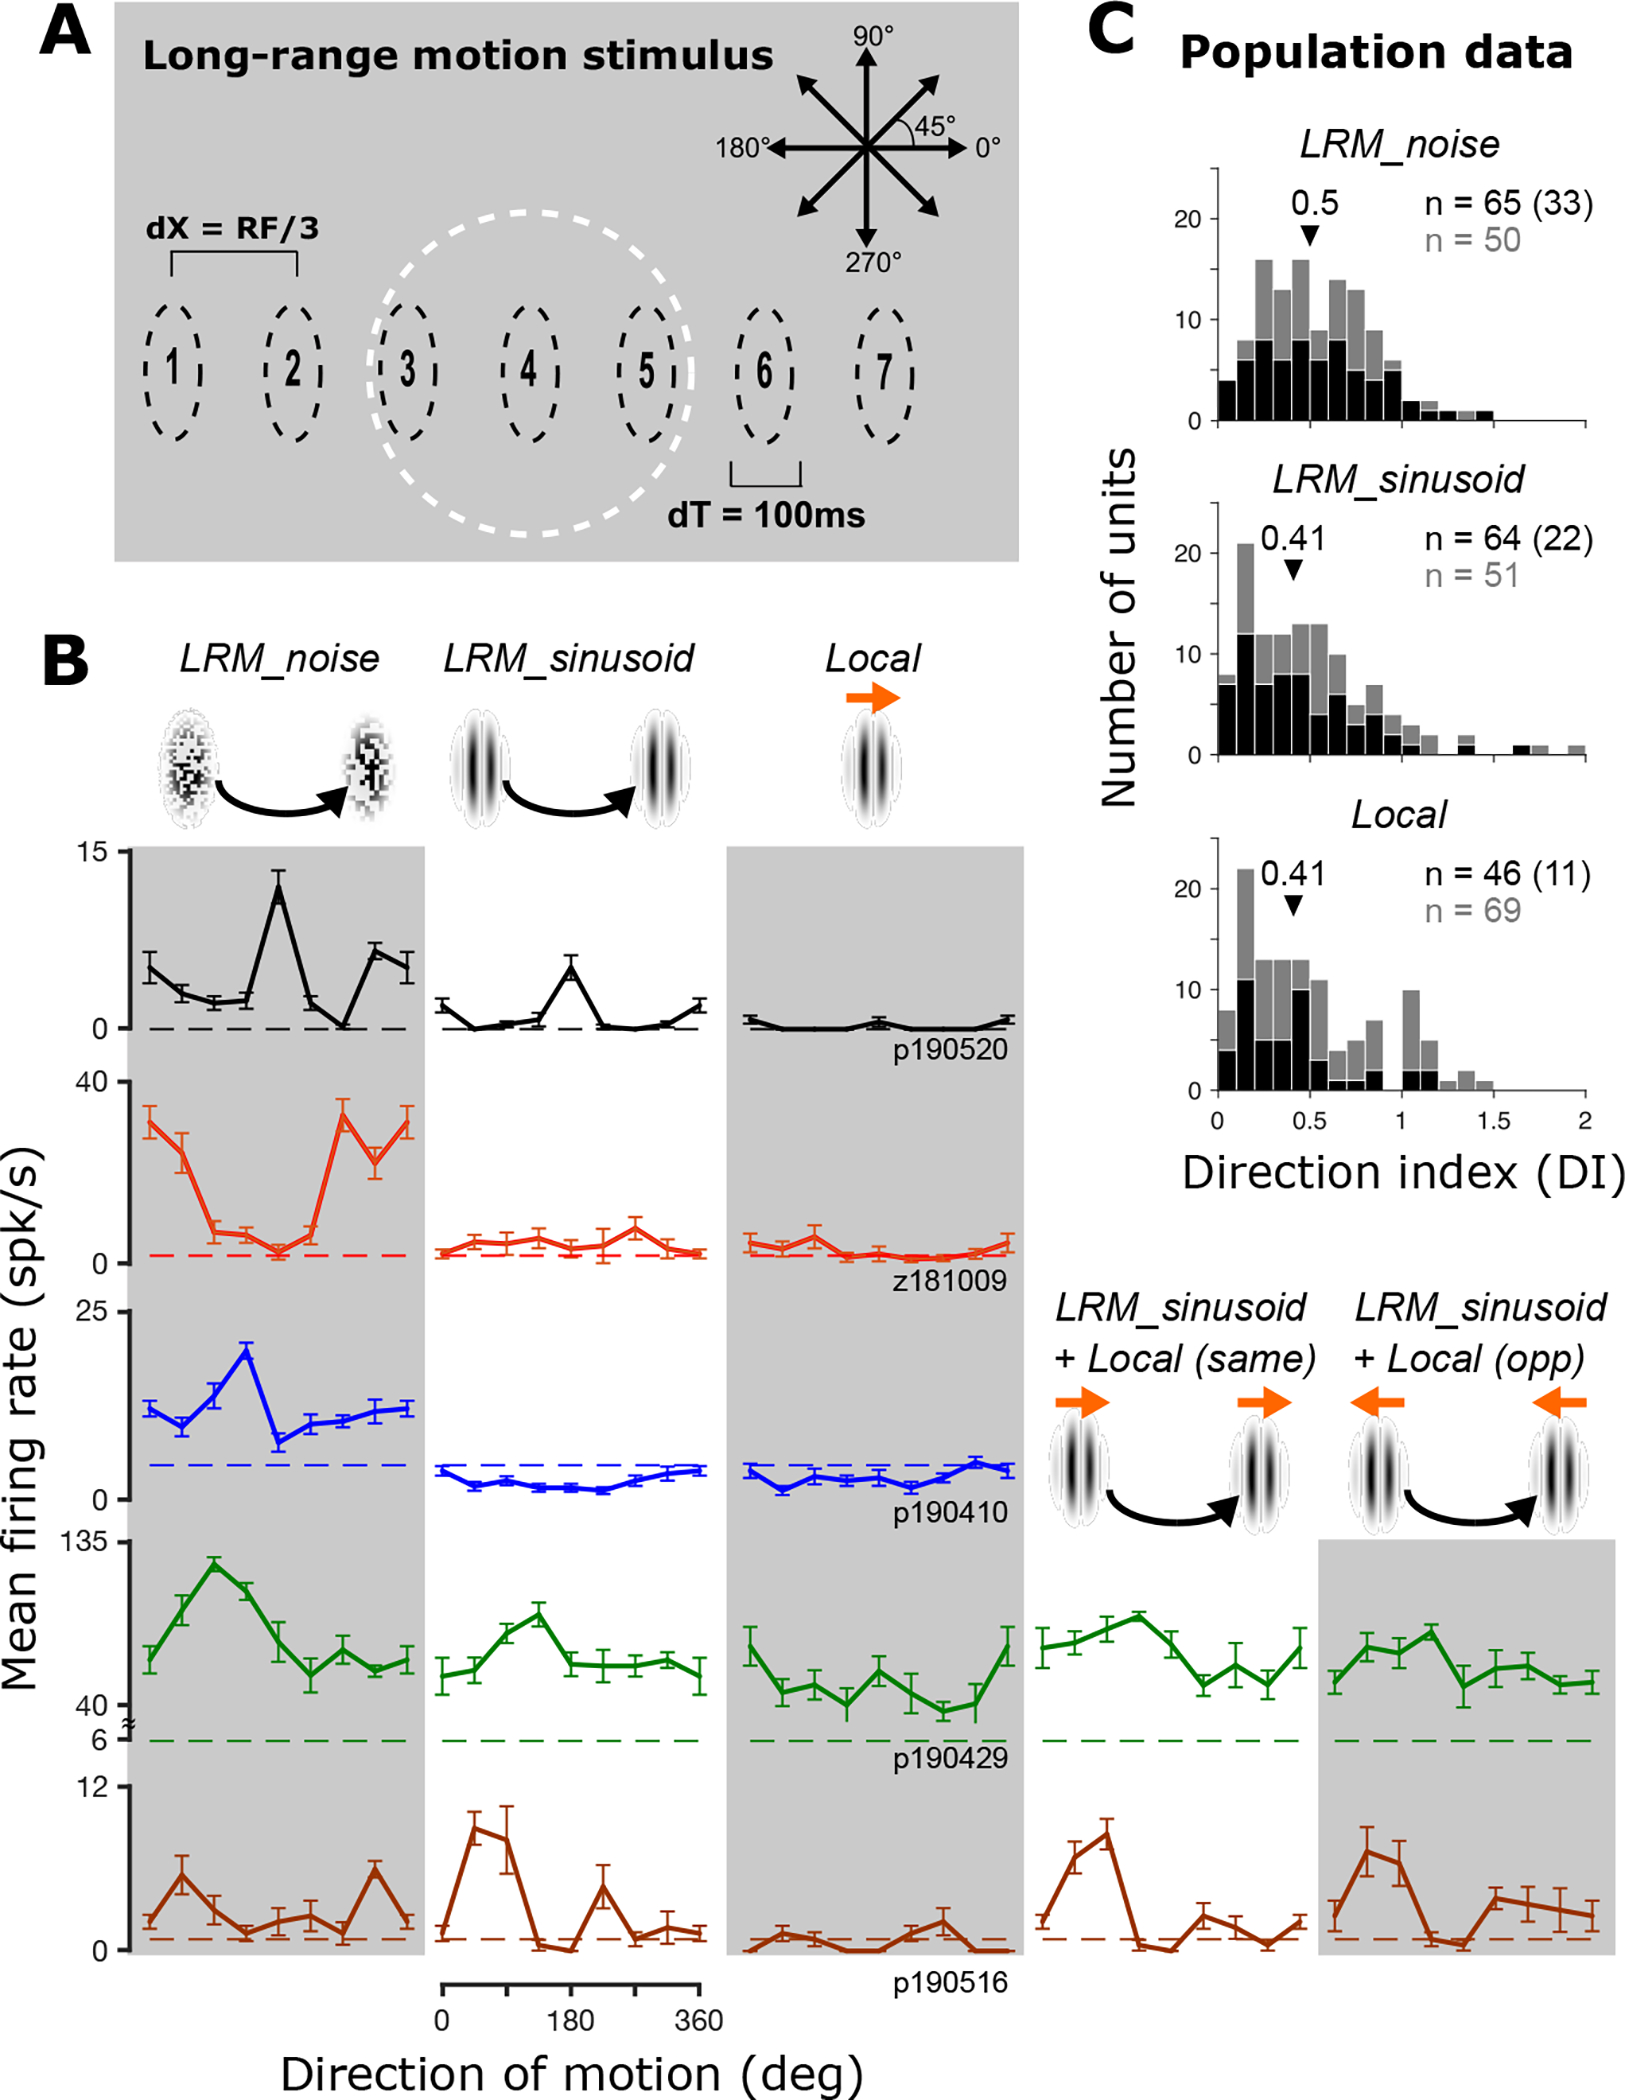
A. Stimulus design. An elliptical patch was displayed in sequence at seven locations centered on the RF (white circle, shown for illustration only). At each location, the stimulus was presented for 100 ms before disappearing and reappearing at the next location instantaneously. Spatial displacements were scaled to a third of estimated RF diameter. Eight directions were tested; opposite directions sampled identical locations. B. Mean responses and SEM of five example neurons (rows) to long range motion (LRM_noise & LRM_sinusoid) and drifting sinusoidal gratings (Local). When LRM was combined with local motion in the same or opposite directions (LRM_sinusoid + Local), tuning for LRM was similar. Dashed lines: baseline. C. Population data. Histograms of DI values for LRM and Local stimuli. Black/gray bars (and corresponding numbers) show neurons with/without statistically significant modulation by motion direction (one-way ANOVA, p < 0.05). Arrows: median DI across the dataset. Numbers in parentheses show neurons with DI ≥ 0.5 and statistically significant modulation. See also Figure S1 and Videos S1–5.
Figure 2. Comparison of MT and V4 data.

A. Size of the spatial displacement (dX) is plotted against DILRM_noise for each of the neurons in Figure 1. Filled symbols denote neurons that exhibit responses significantly modulated by motion direction (one-way ANOVA, p < 0.05). The shaded area represents moderate direction selectivity (DI ≥ 0.5). Red arrow denotes the range (0.25 – 1°) of maximum dX values in V1 and MT23. B. Local dominance histograms for V4 data (top) from this study versus MT data (bottom) reproduced with permission from Hedges et al.10. DI values for LRM_sinusoid and Local were calculated as in Hedges et al.10. For MT, local dominance is centered around 1, suggesting much stronger selectivity for Local than LRM, unlike for V4 data. See also Figure S2.
Prior studies in area MT reveal that neurons signal local motion direction when tested with stimuli that combine both local and long range motion cues10,16. In V4, we found the opposite: many neurons signaled the direction of long range motion despite competing local motion cues (see ‘LRM_sinusoid + Local’, Figure 1B, lower right). These neurons exhibited a strong correlation between responses to long range motion stimuli with local motion combined in the same or opposite directions (Videos S3 and S4). This was the case even when the local drift evoked strong responses when presented in isolation (Figure S1C). To quantify the relative strength of direction tuning in individual neurons for local versus long range motion, we computed a local dominance index10 based on responses to stimuli that combine both. In V4, local dominance was significantly less than 0 (Mann-Whitney U-test, p = 0.008) across the population implying that V4 responses more strongly encoded the direction of long range motion (Figure 2B, top). This is consistent with human perception and quite unlike neurons in areas MT10 (Figure 2B, bottom) and MST15, which signal the local drift instead. Thus, our results identify the first single-neuron correlate of long range motion in the primate brain. They also reveal independence in the strength of direction selectivity for long range motion versus local drift in single V4 neurons (Figure S1A).
As illustrated above, some V4 neurons encode long range but not local motion direction. We wondered whether this was because some neurons are motion sensitive only for larger dX values or because they require motion cues to be accompanied by shifts in position25. The local drift and long range motion stimuli used above differ with regard to the spatiotemporal displacements between successive stimulus frames—small for local drift and large for long range; thus, a lack of correlation between DI values for long range and local drift stimuli could arise if individual V4 neurons are sensitive to different ranges of spatiotemporal displacements. Alternatively, this could arise if V4 neurons differentially encode the two types of motion exemplified by these stimuli—movement of a bounded object in the case of long range motion versus “surface motion” in the case of a grating drifting behind a static aperture, for which any potential object or its boundary remains unknown. To systematically consider these alternatives, we studied responses of 78 neurons to object motion (with a noise patch) at four spatiotemporal displacements from shorter range (dX = 1/36 × RFd [RF diameter], dT = 8.3 ms) to longer range motion (dX = 1/3 × RFd, dT = 100 ms). We varied dX and dT in concert (see Star Methods) to keep motion speed and travel distance constant; thus, the stimulus made either many small steps or fewer large steps in a fixed time window. Many neurons signaled the direction of both longer range (Figure 3C, gray columns) as well as shorter range motion (Figure 3C, white columns). Across the population, many neurons showed direction selective responses over a broad range of dX values (Figure S3B) and the direction tuning was similar for all dX values tested (Figure S3AC). These results suggest that V4 neurons sensitive to long range motion are in fact sensitive to object motion over a broad range of spatiotemporal displacements. As before we found differential sensitivity for object versus surface (local drift behind an aperture) motion: some neurons were direction selective only for surface motion, others only for object motion, and few were strongly direction tuned for both stimulus classes across all dX/dT combinations (see Figure S3D). Overall, however, V4 direction selectivity was stronger for object motion (especially with the smaller dX values) than surface motion (Figure S3D). Because the local motion patch extends beyond the aggregate RF (see Star Methods), differences in sensitivity for object and surface motion are unlikely due to differential stimulation of local RF hotspots.
Figure 3. Direction selectivity for object motion across spatiotemporal scales.

A. Schematic of the Neuropixels probe showing a subset of the 384 contact pairs (black and white squares) along the shank. B. Waveforms of six example neurons (colors) detected at multiple nearby contacts. Numbers indicate the contact associated with the largest amplitude waveforms. C. Mean responses of example neurons as a function of motion direction for Longer range (gray) and Shorter range (white) object motion, and Local gratings (yellow). Corresponding spatial step sizes (dX) are shown. Error bars: SEM. D. Distribution of DI values. Black/gray bars (and n) show neurons with/without statistically significant modulation of responses by motion direction (one-way ANOVA, p < 0.05). Arrows: median DI across the dataset. Numbers in parentheses show neurons with DI ≥ 0.5 and statistically significant modulation. See also Figure S3.
To rule out the possibility that the observed differences in V4 direction selectivity for surface versus object motion were due to stimulus features (gratings for surface versus noise for object), we compared the responses of 58 neurons to object versus surface motion defined by the same sinusoidal grating texture at three different speeds (slow: 5.2°/s, medium: 10.4°/s, and fast: 31.4°/s). Importantly, at each speed, the object and surface motion stimuli were identical in all respects including size, aspect ratio, contrast, spatial frequency, speed and step size of motion. As before, we found differential sensitivity among neurons for object versus surface motion (Figure 4A). To assess similarity in tuning, we computed the correlation between all pairs of tuning curves for individual neurons, within and across object and surface motion at all speeds. Figure 4B (left column) illustrates that tuning curves for object motion at medium speed were better correlated with those for object motion at other speeds (top three rows) than for surface motion at any speed (bottom three rows). This was also true for surface motion tuning curves at medium speed (Figure 4B, right column: median correlation for the bottom three rows is higher than that for the top three rows) and for both types of motion at other speeds (Figure S4). These results support the hypothesis that object and surface motion signals in V4 may arise on the basis of independent mechanisms. Thus, a V4 neuron may exhibit sensitivity for the movement of a bounded object even when it is insensitive to the local drift of a surface behind an aperture. Such a drifting stimulus may also be described as a two-component stimulus with conflicting surface and object motion. Our results support a new motion computation in primate visual cortex, one that determines the direction of motion of a displaced or translating object over a large spatiotemporal range (from short to long), which is reflected in the responses of many V4 neurons.
Figure 4. V4 direction sensitivity for object versus surface motion and chromatic boundaries.

A. Direction tuning curves for an example neuron to Object (left) and Surface (right) motion at three speeds. Error bars: SEM. Dashed lines: baseline activity. B. Population histograms of the correlation between tuning curves for Object (left column)/Surface (right column) motion versus those of other motion types and speeds (rows). Triangles denote median values. Filled bars identify neurons with statistically significant positive correlation (p < 0.05). Correlations within the same motion type (Object × Object or Surface × Surface) was higher than correlation between Object and Surface motion curves at all speeds. C. Direction tuning curves for two example neurons (columns) measured with translating chromatic and achromatic bars (rows) at five luminance contrasts (see legend). Direction selectivity is evident for chromatic bars and noise patches (bottom row) but not achromatic bars. See also Figure S4.
The V4 motion direction signals presented above are based on second-order (non-Fourier) cues because the stimuli used in these paradigms are equiluminant with the background (precluding first-order, i.e., luminance-based motion). To determine whether V4 neurons are also sensitive to object motion defined by equiluminant chromatic boundaries, which is hypothesized to rely on a distinct third-order motion processing system12, we studied the responses of 110 neurons to moving colored (red, green and blue) bars at five luminance contrasts close to the equiluminance point. Several neurons (40/110 = 36%) exhibited strong direction tuning (DI ≥ 0.5 and significant main effect for motion direction based on two-way ANOVA, see Star Methods); tuning for colored bars was similar to that observed with noise patches (see Figure 4C for examples). Importantly, no tuning was evident with achromatic bars at the same luminance contrasts, thereby confirming that the observed tuning was indeed based on chromatic motion detection and not residual luminance in the colored stimuli.
An important difference between object motion and surface motion stimuli is that the different directions of object motion (except those separated by 180°) sample distinct positions in the visual field (Figure 1A, dashed ovals) whereas all directions of surface motion cover the same region. It is therefore critical to test whether directional selectivity for object motion is position invariant and not dependent on spatial heterogeneity or asymmetrical alignment of the stimulus to the RF. To address this question, we characterized the direction selectivity of 31 neurons by presenting object motion stimuli at five spatial locations within the aggregate RF (see Star Methods). We found high levels of consistency in direction tuning across locations among neurons that exhibited direction selective responses at multiple spatial positions (Figure 5). This suggests that object motion direction selectivity is largely consistent across the V4 RF and cannot be explained on the basis of inhomogeneities in the RF substructure.
Figure 5. Position invariance of motion direction selectivity.

Responses of an example V4 neuron to object motion stimuli at five positions within the RF. At each position, object motion was created with three sequential stimulus patches with dX = RFd/6, dT = 50 ms in eight directions. The radial distance between the center stimulus location and the other locations was 1/3 × RFd. This neuron responded strongly at three of the five spatial positions. In all positions, the direction tuning curve was highly consistent and correlation in tuning was 0.68 (see Star Methods). Across 31 neurons studied with this paradigm, 11 exhibited statistically significant direction tuning at two or more locations. For these neurons, the mean aggregate correlation (see Star Methods) in direction tuning across locations was 0.61.
Finally, to evaluate whether motion direction on single trials can be decoded from simultaneously studied V4 neurons, we measured responses of 27 neurons simultaneously to object motion stimuli at four different speeds (4.5, 9.1, 18.2, and 54.8°/s) (Figure 6A–C). We divided the neurons into directional (DI ≥ 0.5, Figure 6A, n = 12) and non-directional (DI < 0.5, Figure 6B, n = 15) sub-groups and identified principal components (PC) based on responses to the second fastest speed (which produced the most robust responses) for each sub-group separately. Projections in PC space revealed a striking, systematic pattern for motion direction that was consistent across all speeds for the directional sub-population (Figure 6AC) but not the non-directional population (Figure 6B, Figure S5A). The contraction in PC space for the lowest speeds reflects weaker driving, but even here the motion direction pattern is consistent. A classifier designed to decode motion direction based on PC projections for the directional sub-groups produced accurate classification performance (C and C45 in Figure 6C) while that based on non-directional neurons yielded chance level performance (Figure S5A). Results were similar when we used different DI thresholds to identify the direction selective sub-population (Figure S5BC). When we attempted to decode object motion direction based on a decoder trained on responses to surface motion and vice versa, performance peaked at ~20% for precise decoding and ~50% for decoding with an error ≤ 45° (Figure S5DE). In this sense, decoding of surface motion from object motion is comparable to performance at the slowest speeds we tested. Classification of speed and motion direction also produced reasonable results: % correct performance of 20–32% from the lowest to highest speeds on average on the test set (80/20 train/test split; 1000 runs; see Star Methods). This is notable considering that chance performance is 3% and only 12 neurons were used for constructing PC projections. In the non-directional sub-groups, however, the same procedure produced 7% correct.
Figure 6. Population decoding of object motion direction.
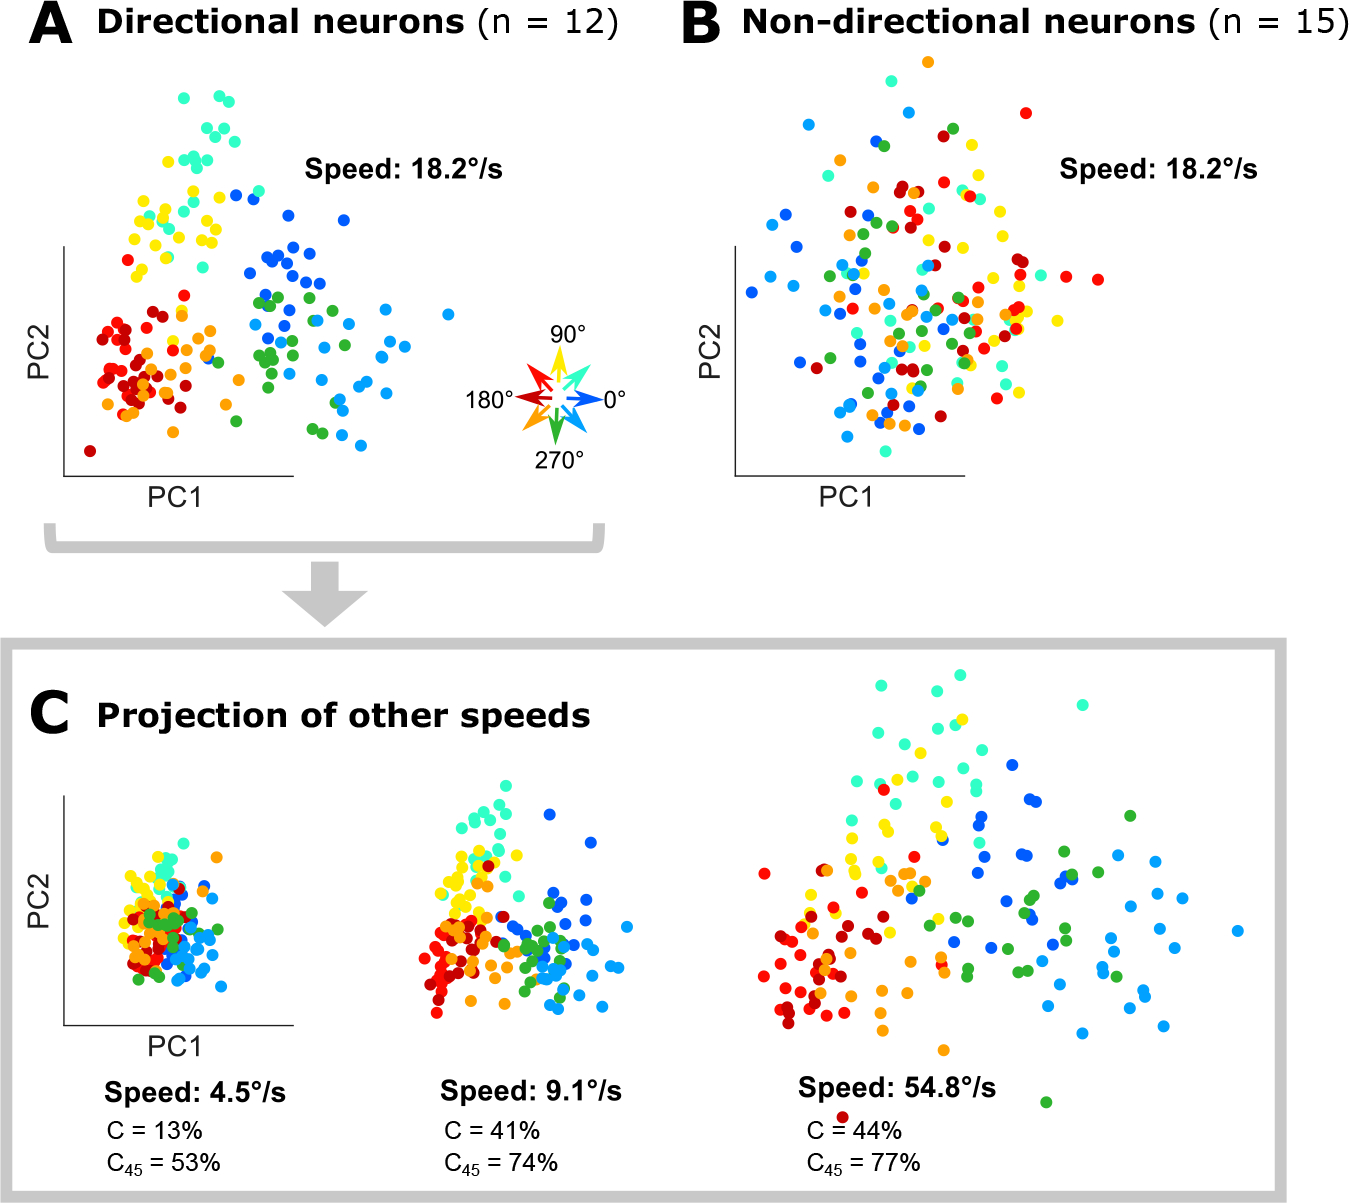
A. Low-dimensional representation (first two PCs) of the activity of the direction selective sub-population of neurons for different object motion directions (colors) for speed = 18.2°/sec; this yields a systematic, robust space for deciphering motion direction. B. The same analysis as in A, based on the activity of non-direction selective neurons produces weak/non-existent patterning. C. Projection of data for other speeds from directional neurons onto the space derived in A. Percent correct performance of a binary decision tree for decoding the object motion direction exactly (C) or within 45° (C45) is reported for each speed. See also Figure S5 for analogous results from non-directional neurons.
Discussion
We report that many neurons in area V4 are sensitive to the direction of motion induced by the intermittent displacement of a visual stimulus and that this sensitivity is not degraded by competing local motion inside the aperture of that stimulus. These direction selective V4 neurons operate over a broader spatiotemporal range than that reported for dorsal stream MT neurons10,23,24 and show a robust sensitivity to second-order motion cues and to chromatic boundaries. Thus, our work identifies a distinct, object motion processing system in the primate ventral stream that is complementary to the well-established and extensively characterized system in the dorsal stream, and it augments prior work demonstrating the emergence of object-based representations26,27 and motion direction tuning maps28 in V4. Our results also provide a neuronal correlate for the hypothesis that motion perception is supported by a computation that assesses feature or object correspondence12,29–36 across time and space in the higher stages of the ventral visual stream10,37.
Our results identify the first single neuron correlate of long range motion in the primate brain. This assertion is supported by two fundamental considerations. First, the spatial displacements used in this study qualify as long range motion. While there is no single spatial displacement cut-off between short and long range motion – it varies with stimulus type and RF eccentricity – Braddick11,38 and Anstis39 hypothesized that short range processes rest on direction selective neurons in the early stages of the visual system. Thus, displacement cut-offs for short range processes may be defined by the maximum displacements (dXmax and dTmax) at which V1 neurons exhibit motion sensitivity. In our study, we used spatial displacements larger than dXmax for V1 neurons matched for RF size. Second, MT neurons are widely considered to be insensitive to long range motion. Using identical stimuli in V1 and MT, Churchland and colleagues23 concluded that there was no evidence for a long range process operating in MT because dX thresholds were similar in the two areas. They reasoned that the higher thresholds in MT versus V1 observed by Mikami et al.24 were due to differences in stimuli used in the two areas. The most concrete evidence for long range motion comes from studies that pit surface (local drift) and object motion against each other. With such stimuli, MT encodes only the local motion10,16 while V4 encodes the jumping object motion. Thus, our results provide the first single neuron correlate of long range motion. Future studies will need to explore larger temporal displacements, a greater range of motion speeds, motion direction trajectories, and the relationship between speed tuning, RF size and spatial integration properties with stimuli previously used in V1 and MT.
A key idea that emerges from our work is the distinction between a moving surface within a stationary aperture (e.g., ripples on a pond or an extended textured surface moving behind occluders) versus a moving object. Decades of research in human and monkey have focused predominantly on the former type of motion, using gratings and dot stimuli that drift within an aperture that remains in place. Neurons in the dorsal visual stream are strikingly sensitive to such local motion and their responses are well explained by traditional short range motion processing models. Real world motion, however, is often associated with changes in position of a bounded object, thus tracking position across time can be a reliable source of motion information. Kwon and colleagues25 have argued that an alternative framework that casts motion perception as a problem in object tracking may be appropriate for natural vision. In this framework, local motion signals and motion information derived from changes in position are integrated to derive object motion and position dynamics. In terms of neuronal correlates, the dorsal stream may be the source of local motion signals, while neurons in V4 that preferentially encode object motion may provide position-based motion signals. Our observations support this integrative framework of motion processing in which the primate ventral stream specializes in encoding of object motion and is complementary to the extensively characterized system in the dorsal system. In this sense, our results are consistent with proposals of modularity in motion processing40. We do note that prior studies in MT have also demonstrated responses to second order motion (but in much lower proportion than we find in V4) including the motion of chromatic boundaries4,41–45.
More broadly, our results challenge the traditional view of functional segregation between the dorsal and ventral streams of visual processing. Despite well-established anatomical inter-connectivity between the streams46, functional segregation of motion and form processing is the common operating assumption, and studies of motion processing seldom target ventral stream area. Consistent with prior studies in human patients47, our results provide the first single neuron correlate for a higher-order motion processing system in the ventral visual stream and provide an explanation for the longstanding conundrum in visual neuroscience that neurons in the dorsal visual stream are largely insensitive to long range motion, which causes strong percepts that have been studied psychophysically for close to a century.
Overall, our work supports the view that the processing of dynamic objects is distributed across the dorsal and ventral streams48 and calls for the use of well-controlled dynamic foreground object stimuli mimicking object motion in natural vision to be used in studies that will complement decades of past work with drifting gratings and dots. Future experiments with dynamic object stimuli could reveal how dorsal and ventral stream regions represent and track such stimuli, how the V4 representations we report here may be built, and how motion perception may be differentially influenced by the perturbations of dorsal and ventral stream neurons.
Star★Methods
RESOURCE AVAILABILITY
Lead contact
Further information and requests for resources should be directed to and will be fulfilled by the lead contact, Anitha Pasupathy (pasupat@u.washington.edu).
Materials availability
This study did not generate new materials.
Data and code availability
Data and code are available at: https://dx.doi.org/10.17632/cs76nk38zj.1. Requests for clarification and additional information will be fulfilled by the lead contact.
EXPERIMENTAL MODEL AND SUBJECT DETAILS
Animal Preparation
Three adult rhesus macaques (Macaca mulatta; M1: 11 year old, 5.8 kg female; M2: 14 year old, 10 kg male; M3: 9.5 year old, 9.5 kg male) participated in this study. Recording chambers were centered over dorsal V4, and included the lunate and superior temporal sulci, as well as the adjoining sulcal banks. Stereotaxic coordinates of V4 were based on structural MRI images for each animal. A craniotomy (~15 mm) was made over V4 prior to recording. All animal procedures conformed to NIH guidelines and were approved by the Institutional Animal Care and Use Committee at the University of Washington.
METHOD DETAILS
Neurophysiology
We used one of two devices–a single electrode, or a high-density Neuropixels probe–to record neural activity in this study. For recordings with a single electrode, each day, we advanced an epoxy-coated tungsten microelectrode (250 μm diameter; FHC) perpendicular to the cortical surface using either an 8-channel microdrive (Gray Matter Research, 8-channel) or oil hydraulic manipulator (Narashige, MO-97A), until we penetrated the dura and observed neural activity. Voltage signals were amplified and bandpass filtered (0.1–8 kHz) and spike waveforms from single neurons were isolated using a 16-channel data acquisition system (MAP system; Plexon Inc). Time stamps of spiking activity, eye position (Eyelink, SR Research), stimulus events (based on photodiode signal) were stored at a 1 kHz sampling for off-line analysis (Offline Sorter, Plexon Inc). Using this method, we targeted a single isolated neuron during each recording session.
For simultaneous study of dozens of nearby neurons, we used a Neuropixels probe (Neuropixels 1.0 [phase 3B] or a sharpened Primate probe [Neuropixels 1010], IMEC). For insertion of the Neuropixels probe, a custom-built metal presser foot was held in place against the dura using a ultracompact micromanipulator (Narishige, MO-903B) to provide tension and stability during guide tube and probe insertion for recording. A short, metal guide tube (27G hypodermic needle, 4 mm in length) was inserted into the dura, penetrating 1–2 mm below dural surface, using a custom-made holder and an oil hydraulic microdrive (MO-97A, Narashige). The Neuropixels probe was then inserted via this dural eyelet into the cortex using a customized probe holder (uMp-NPH; Sensapex) and the oil hydraulic microdrive. The primate Neuropixels probe was directly inserted through the dura into the cortex without a guide tube eyelet. For the acquisition of neural and non-neural signals (eye position and task-related events), we used an assembly consisting of a PXI-based acquisition module (IMEC), multifunction I/O module (PXI-6224, National Instruments) and a remote control module (PXIe-8381, NI) mounted on a PXI Chassis (PXIe-1071, NI)49. Action potential voltage signals from the 384 probe contacts (30 kHz sampling rates) were amplified and filtered (0.3 to 10 kHz) and stored for offline analysis using SpikeGLX (https://billkarsh.github.io/SpikeGLX/). Voltage signals from the photodiode were simultaneously sampled (25 kHz) and stored for offline analysis. Neuronal signals and stimulus events based on photodiode signals which were acquired by dedicated hardware systems were aligned post hoc, by matching square-wave pulse signals, that were stored by both systems but generated by a single custom-built device with a microcontroller board (Arduino R3, Arduino).
For offline analysis of Neuropixels data, all binary data files were merged using custom MATLAB code. Spike waveforms were sorted and high-pass filtered (300 Hz) using an open-source, automatic sorting software (Kilosort2, doi: https://doi.org/10.1101/061481) followed by rigorous manual curation based on firing rate, inter-spike interval (ISI) distributions and waveform attributes with open source software (phy2, https://github.com/cortex-lab/phy). Specifically, automatically sorted clusters were rejected if: (i) firing rate was <1.0 spikes/sec during the recording session, (ii) fewer than 5% of ISIs were over 2 ms, (iii) mode of ISI distribution was < 2 ms, (iv) waveform amplitude exhibited discontinuities across time, (v) nearby units were not well separated based on visual inspection of waveform shape and in PCA space or (vi) the cluster was observed on just one channel. If clusters on nearby channels were similar with regards to waveform amplitude and ISI distribution, we merged clusters and reevaluated isolation quality of waveforms. Our criteria are quite conservative and typically resulted in a rejection of 60% of automatically sorted clusters/neurons; this was critical to ensure that the included putative neural signals were recorded from single, well-isolated units. All subsequent analyses were performed using custom MATLAB code, in conjunction with the Spikes toolbox (Steinmetz; https://github.com/cortex-lab/spikes). Our analysis is limited to cells which remained well isolated throughout the experiment and in which we recorded at least 5 repeats of each stimulus.
Visual Stimulation
Stimuli were presented on a gamma-corrected CRT monitor (100 Hz, ViewSonic VS11135) or a gamma-corrected LCD monitor (120 Hz, BenQ XL2430) positioned directly in front of the animal (51 and 54 cm for M1 and M2, respectively). Both monitors were calibrated using a spectrophotoradiometer (PR650; PhotoResearch). Animals were required to maintain fixation on a 0.1° white spot within a window of radius 1° as we presented visual stimuli in random sequence separated by a 300 ms blank interstimulus interval. Successful fixation of 3–4 seconds (2–8 stimuli based on stimulus duration, see below) were rewarded with drops of liquid. All aspects of task control including stimulus creation and presentation was using Pype, a custom software written in Python (Mazer; https://github.com/mazerj/pype3).
RF characterization
For recordings with a tungsten electrode, for each isolated neuron we identified the RF center manually using a variety of stimuli including a set of 2D shapes known to drive V4 neurons50, sinusoidal and hyperbolic gratings, and colored, oriented bars. RF diameter was estimated as 1° + 0.625 × RF eccentricity based on Gattass et al.51. For Neuropixels recordings, we simultaneously mapped the RFs of neurons across all contacts using an automated RF mapping protocol with either shape or dynamic texture stimuli sampling responses on a 10×10 to 15×15 square grid (0.4–0.5° spacing) centered on a position identified based on initial manual mapping using activity from the most distal and proximal portions of the Neuropixels probe. Responses of each neuron were then fit with a 2D gaussian function to determine the RF center. Stimuli for all subsequent experiments were based on the aggregate RF position defined as the median across all recorded neurons. RF diameter was estimated as above for single electrode recordings based on the aggregate RF eccentricity.
Long range apparent motion stimuli
To test for long range apparent motion tuning in single isolated neurons, we presented sinusoidal grating (LRM_sinusoid) and noise (LRM_noise) patches at seven locations sequentially in eight different directions, aligned to the RF center which was identified based on initial characterization. For directions separated by 180°, the seven spatial locations were identical. We recorded neuronal activity from 115 isolated neurons (M1: 62, M2: 53) using tungsten electrodes (between 5 and 20 repeats, median: 13). Patches were masked with an elliptical, Gaussian-blurred aperture and the height (the long axis of the ellipse) was scaled to 1/3 × RF diameter. For the 115 recorded neurons, RF eccentricity ranged from 1.76° to 10.06° and dX values ranged from 0.70° to 2.43°. The mean luminance of the visual stimulus was equal to the background. On every stimulus presentation and at each of the seven spatial locations, the noise patch was randomly generated to ensure that the LRM_noise stimulus was based on non-Fourier cues. The distance between patches was scaled to 1/3 × RF diameter so that the central three steps were within the RF (see Figure 1A). Stimuli were presented for 100 ms at each location before instantaneously jumping to the next location. The spatial frequency of the sinusoidal grating was chosen as the spatial frequency which drove the highest firing rate in preliminary characterization (between 2 and 6 cycles/degree). We also measured responses to the same sinusoidal patch drifting (Local) at the RF center at 8 Hz for 700 ms. In all cells, we also measured responses to a sinusoidal patch which was displaced intermittently while simultaneously drifting at 8 Hz in either the same or opposite direction (LRM_sinusoid + Local). We tested eight directions of stimulus motion in 45° increments. In all cases, the long axis of the elliptical aperture was oriented orthogonal to the direction of motion. In this and all subsequent experiments we included blank fixation periods (700 ms duration) to assess baseline firing rate of neurons.
These stimuli (used for results in Figure 1) are based on those used by Hedges et al.10 to study MT neurons. In that study, authors combined local and global motion either in the same or opposite directions; dX was scaled based on RF size, and dT was fixed at 100 ms. With these stimuli MT neurons encoded the local motion and not the global motion direction. We used the exact same stimulus construct to study V4 neurons.
Varying dX and dT
In this and following paradigms, neuronal activity was recorded using the Neuropixels probe and all motion stimuli were centered on the aggregate RF location across all recorded neurons. We tested the effects of the size of spatial displacement (dX) on directional tuning in 78 neurons across two sessions in M1 (48 and 30 neurons, respectively), by covarying dX and dT (time per location) from dX = 1/3 × RFd (RF diameter) and dT = 100ms (12 frames) per location to dX = 1/36 × RFd and dT = 8.3 ms (1 frame) per location. Specifically, our dX and dT values were: dX = 1/3, 1/6, 1/12, or 1/36 × RFd and dT = 100, 50, 25, or 8.3 ms, respectively. Specific dX values for one session are provided in Figure 3C. As step size decreased, the number of steps increased to maintain the same travel distance. Thus, stimuli were presented at 7, 13, 25 and 73 locations for the largest to smallest dX values, respectively. Importantly, all dX/dT combinations sampled the aggregate RF center and the larger dX/dT combinations sampled a subset of the spatial locations sampled in the smaller dX/dT conditions. For the two sessions, we recorded activity on 19 and 20 repeats, respectively, of each stimulus condition in random order. For this experiment, we used noise patches, because we found that they evoked stronger responses than sinusoidal gratings in our single neuron experiment described above. The noise patch stimuli rearranged on every step, creating second-order motion cues. Stimulus height was scaled to 1/3 × RFd. Because we simultaneously studied many neurons with partially overlapping RFs, the stimuli started within the RF of some neurons, while for others, the stimulus entered the RF later. We also measured responses to a drifting sinusoidal grating (3 cycles/degree, 8 Hz drift rate) presented at the aggregate RF center which was 1.5 × RFd in diameter. The larger size was to ensure that it overlapped the RFs of the simultaneously recorded neurons.
Chromatic boundaries
To determine if neurons in V4 are direction selective for stimuli defined by equiluminant chromatic boundaries, we measured the activity of 72 neurons across two sessions in M1 (39 neurons and 33 neurons, respectively) to colored oriented bars undergoing object motion at two different speeds (dX = 1/6 RFd, dT = 50 ms or 8.3 ms). The bar height was scaled to 1/3 × RFd. Stimuli were presented against a uniform gray background of 8.0 cd/m2 in one of three colors (red, green, and blue) at equiluminance (8.0 cd/m2), and four other luminances (7.6, 7.8, 8.2, and 8.4 cd/m2). These correspond to the following luminance contrasts: 0, +2.5%, and +5%. We chose to sample the luminance axis finely around the equiluminance point, because the equiluminance point used here corresponds to photometric equiluminance, which may not match the true equiluminance for the animal or the neurons under study. As control, we also presented achromatic bars at all five luminance contrasts to ensure that the responses to the chromatic stimuli are not simply due to the residual luminance contrast due to mismatch in equiluminance. Bars were always oriented orthogonal to the direction of motion. For comparison, we also studied the responses to elliptical noise patch stimuli. Results are based on 5 and 9 stimulus repeats for the two sessions, respectively.
Spatial position tests
To test for heterogeneity in tuning across the receptive fields of direction selective neurons, we recorded activity of 30 neurons in M1 (20 repeats) to brief object motion sequences of noise patches at five different locations within the aggregate RF, positioned at the four vertices and center of a square. The radial distance between the center location (at aggregate RF center) and the other locations was 1/3 × RFd. Each sequence consisted of three sequential noise patches separated by dX = 1/6 RFd, and dT = 50ms in one of eight directions. Stimulus height was scaled to 1/3 × RFd.
Object versus surface motion
To test the hypothesis that neurons are tuned for the translating motion of an object as opposed to motion behind an aperture, e.g., stationary drifting gratings (surface motion), we measured responses of 58 neurons in M3 across two sessions (33 neurons and 25 neurons, 10 and 20 repeats, respectively) to a stimulus set which consisted of sinusoidal patches intermittently displaced across the visual display or drifting in place, i.e., undergoing a phase shift behind a stationary aperture centered on the aggregate RF. In both cases, we sampled eight motion directions. The speed of object motion and surface motion were matched to control for any speed preferences in V4. Patch height was scaled to 1.5 × RFd (aspect ratio = 3:2, SF = 3 cycles/degree), the translation jump size was fixed at 1/12 × RFd. Responses were measured at three object motion speeds corresponding to dT (time per location) = 50 ms, 25 ms, and 8.3 ms, yielding speeds of 5.2°/s (slow), 10.4°/s (medium), and 31.4°/s (fast). The drift rate of the grating was chosen to match these speeds.
Motion direction at different speeds
To determine whether motion direction tuning is consistent across different speeds, we simultaneously recorded from 27 well-isolated neurons in M1 and measured responses to a noise patch undergoing object motion in eight different directions (dX was fixed at 1/6 × RFd or 0.45 degrees of visual angle) at four different speeds, dT = 100 ms, 50 ms, 25 ms, and 8.3 ms resulting in speeds of 4.5°, 9.1°, 18.2°, and 54.8°/s. Stimulus height was scaled to 1/3 × RFd.
QUANTIFICATION AND STATISTICAL ANALYSIS
Analysis of neural data
For data collected with single electrodes, which was optimized for the RF of the neuron under study, we calculated the firing rate over two windows: (i) the entire stimulus presentation from 40ms post stimulus onset to 75 ms after stimulus offset to allow for latency of V4 neurons52 and, (ii) from 40 ms after stimulus entry into the RF until 75 ms after stimulus exit, i.e., 240 ms-575 ms after stimulus onset (estimated time when stimulus is within the RF). Results presented in Figure 1 are based on the latter window. Responses were weaker, as expected, when the larger window is considered but results were consistent. For all control experiments using Neuropixels probes, we calculated the firing rate by counting the number of spikes in a window from 40 ms after stimulus onset to 75 ms after stimulus offset. In this latter case, the stimuli were centered on the aggregate RF and the positioning was not optimized for individual neurons.
We measured the strength of direction selectivity using a directional index (DI) given by
where the preferred direction was identified as the direction maximally deviated from baseline (calculated from no stimulus trials) and the null direction was the opposite direction, i.e., 180° away. The DI values reported in this study are based on baseline subtracted responses. For every neuron we also assessed motion direction selectivity by performing a one-way ANOVA with motion direction as the factor. Statistical significance was assessed at α = 0.05.
For stimuli that combine both local and long range motion cues (‘LRM_sinusoid + Local’, Figure 1B, lower right), we computed local dominance as the relative strength of direction selectivity for local drifting motion versus long range motion. In these trials, each local drifting motion is combined with two long range motion directions (same or opposite) and vice versa. Therefore, we first computed average responses to each local motion direction by averaging across the two long range motion directions and then computed DILocal as above. We followed a similar strategy for computing DILRM. We then computed local dominance as the difference between DILocal − DILRM. Local dominance values > 0 imply stronger direction selectivity for local drift, while values < 0 imply stronger direction selectivity for long range motion. The method and stimuli used for the local dominance computation in this study are the same as those used by Hedges et al.10, thus allowing direct comparison between V4 and MT results.
To assess consistency of direction tuning across multiple spatial locations, we calculated an aggregate correlation metric, r, as below53:
where pi is the mean-subtracted tuning curve at the ith RF location. As with Pearson’s correlation coefficient, the values of the aggregate correlation metric range between −1 and 1; values close to 1 indicate strong consistency in tuning across position.
Principal Components Analysis (PCA) and prediction
To rigorously assess consistency in tuning across speeds, we asked if motion direction can be accurately decoded at a range of speeds on single trials from simultaneously recorded neurons. Based on responses at an intermediate speed (18.2°/sec), we first identified neurons that were direction selective (DI ≥ 0.5) and then performed a PCA based on the single trial responses (eight directions, 20 repeats each) of these neurons (n = 12) to derive a low-dimensional representation. We then projected the responses to all four speeds onto a space defined by the first four PCs (explained variance = 86.8%). For simplicity, we graphically show only the first two principal components in Figure 6 (explained variance = 76%). To assess consistency of tuning across speeds, we created a binary classification decision tree for the eight motion directions (using fitctree in MATLAB) based on the low-dimensional representation of the data for speed = 18.2°/sec and predicted the motion direction across all speeds. In this case chance performance is 12.5%. To determine whether speed and motion can be accurately predicted from V4 responses, we used 80% of the data across all speeds to train the decision tree and tested with the remaining 20% of the data. The 80–20 split was chosen randomly without replacement and repeated 1000 times. Mean performance across 1000 runs is reported. For completeness, we also performed the PCA analysis and classification using data from the non-direction selective neurons (n = 15) and for different DI thresholds (Figure S5). To determine if surface motion direction can also be similarly decoded from V4 responses we used the Varying dX and dT dataset described above. We constructed a low-dimensional representation with surface motion data and attempted to classify object motion direction for dX = RFd/12 and RFd/36. For comparison, we also constructed a low-dimensional representation with object motion data for dX = RFd/12 and classified motion direction for surface motion and object motion with dX = RFd/12.
Statistical analyses
To assess motion direction selectivity, we performed a one-way ANOVA with motion direction as the factor; df1 = 7; The number of stimulus repeats ranges from 5 – 20 across neurons; To assess motion direction selectivity with colored bars, we conducted a two-way ANOVA with motion and color as factors; df1 = 7; df2 = 2. Responses from the five luminance contrasts tested were grouped by color for the two-way ANOVA. Difference in responses between noise and sinusoidal patches was assessed with a one-tailed paired T-test. Difference in DI for local drift versus long range motion based on responses to stimuli that combined both was assessed with Mann-Whitney U-test. Statistical significance was assessed at α = 0.05 for all tests.
Supplementary Material
Video S1. An example of a long range motion stimulus with a sinusoidal grating patch. Related to Figure 1. For our results shown in Figure 1, we tailored the jump size (dX) based on estimated RF size. dT was always 100 ms.
Video S2. An example of a long range motion stimulus with a noise patch. Related to Figure 1. All other details as in Video S1.
Video S3. An example of a long range motion stimulus with local drift in the same direction. Related to Figure 1.
Video S4. An example of a long range motion stimulus with local drift in the opposite direction. Related to Figure 1.
Video S5. A drifting sinusoidal grating patch, i.e., motion behind an aperture. Related to Figure 1.
KEY RESOURCES TABLE.
| REAGENT or RESOURCE | SOURCE | IDENTIFIER |
|---|---|---|
| Experimental models: Organisms/Strains | ||
| Rhesus (Macaca Mulatta) | Washington National Primate Research Center | M1 (Z08115), M2 (Z05360), M3 (Z11111) |
| Software and algorithms | ||
| MATLAB | Mathworks | https://www.mathworks.com/products/matlab.html |
| Python | Python Software Foundation | https://www.python.org |
| Kilosort2 | Pachitariu et al., 2016 | https://github.com/MouseLand/Kilosort |
| Offline Sorter | Plexon Inc | https://plexon.com/products/offline-sorter/ |
| SpikeGLX | Janelia Research Campus | https://billkarsh.github.io/SpikeGLX/ |
| Phy2 | Cortex Lab (UCL) | https://github.com/cortex-lab/phy |
| Other | ||
| CRT monitor | Sony | ViewSonic VS11135 |
| LCD monitor | BenQ | BenQ XL2430 |
| EyeLink | SR Research | https://www.sr-research.com/ |
| MAP Data Acquisition System | Plexon Inc | https://plexon.com/products/map-data-acquisition-system-plexon/ |
| Oil hydraulic microdrive | Narishige | MO-97A |
| Neuropixel probe | IMEC | https://www.neuropixels.org/ |
Highlights.
V4 neurons signal perceptually salient long range motion stimuli that elude MT
V4 neurons preferentially encode moving objects as opposed to drifting surfaces
V4 neurons signal motion defined by chromatic boundaries and 2nd order cues
Results identify a ventral stream motion process specialized for tracking objects
Acknowledgments
The authors thank Amber Fyall for assistance with animal training, Primate Center Instrumentation Shop for hardware support, Greg Horwitz and Eric Shea-Brown for comments on the manuscript and Dina Popovkina for help with the graphical abstract. This work was supported by NEI grant R01 EY018839 to A.P.; NEI grant R01 EY029601 to A.P. and W.B.; NEI R01 EY027023 to W.B.; NEI Center Core grant for Vision Research P30 EY01730 to the UW; NIH/ORIP grant P51 OD010425 to the WaNPRC; NIH grant T32NS099578 to A.B.; NIH grant 5 R90 DA 033461-08 to A.B.
Footnotes
Declaration of Interests
The authors declare no competing interests
Inclusion and Diversity
We support inclusive, diverse and equitable conduct of research.
Publisher's Disclaimer: This is a PDF file of an unedited manuscript that has been accepted for publication. As a service to our customers we are providing this early version of the manuscript. The manuscript will undergo copyediting, typesetting, and review of the resulting proof before it is published in its final form. Please note that during the production process errors may be discovered which could affect the content, and all legal disclaimers that apply to the journal pertain.
References
- 1.Van Essen DC, and Gallant JL (1994). Neural mechanisms of form and motion processing in the primate visual system. Neuron 13, 1–10. 10.1016/0896-6273(94)90455-3. [DOI] [PubMed] [Google Scholar]
- 2.Maunsell JHR, and Newsome WT (1987). Visual Processing in Monkey Extrastriate Cortex. Annual Review of Neuroscience 10, 363–401. 10.1146/annurev.ne.10.030187.002051. [DOI] [PubMed] [Google Scholar]
- 3.Nassi JJ, and Callaway EM (2009). Parallel processing strategies of the primate visual system. Nat Rev Neurosci 10, 360–372. 10.1038/nrn2619. [DOI] [PMC free article] [PubMed] [Google Scholar]
- 4.Albright TD, and Stoner GR (1995). Visual motion perception. Proceedings of the National Academy of Sciences 92, 2433–2440. 10.1073/pnas.92.7.2433. [DOI] [PMC free article] [PubMed] [Google Scholar]
- 5.Born RT, and Bradley DC (2005). Structure and function of visual area MT. Annu Rev Neurosci 28, 157–189. 10.1146/annurev.neuro.26.041002.131052. [DOI] [PubMed] [Google Scholar]
- 6.Orban GA (2008). Higher order visual processing in macaque extrastriate cortex. Physiol Rev 88, 59–89. 10.1152/physrev.00008.2007. [DOI] [PubMed] [Google Scholar]
- 7.Churan J, and Ilg UJ (2001). Processing of second-order motion stimuli in primate middle temporal area and medial superior temporal area. J Opt Soc Am A Opt Image Sci Vis 18, 2297–2306. 10.1364/josaa.18.002297. [DOI] [PubMed] [Google Scholar]
- 8.Pack CC, Gartland AJ, and Born RT (2004). Integration of Contour and Terminator Signals in Visual Area MT of Alert Macaque. J. Neurosci. 24, 3268–3280. 10.1523/JNEUROSCI.4387-03.2004. [DOI] [PMC free article] [PubMed] [Google Scholar]
- 9.Tailby C, Majaj NJ, and Movshon JA (2010). Binocular Integration of Pattern Motion Signals by MT Neurons and by Human Observers. J. Neurosci. 30, 7344–7349. 10.1523/JNEUROSCI.4552-09.2010. [DOI] [PMC free article] [PubMed] [Google Scholar]
- 10.Hedges JH, Gartshteyn Y, Kohn A, Rust NC, Shadlen MN, Newsome WT, and Movshon JA (2011). Dissociation of neuronal and psychophysical responses to local and global motion. Curr Biol 21, 2023–2028. 10.1016/j.cub.2011.10.049. [DOI] [PMC free article] [PubMed] [Google Scholar]
- 11.Braddick O (1974). A short-range process in apparent motion. Vision Research 14, 519–527. 10.1016/0042-6989(74)90041-8. [DOI] [PubMed] [Google Scholar]
- 12.Lu ZL, and Sperling G (2001). Three-systems theory of human visual motion perception: review and update. J Opt Soc Am A Opt Image Sci Vis 18, 2331–2370. 10.1364/josaa.18.002331. [DOI] [PubMed] [Google Scholar]
- 13.Claeys K, Lindsey DT, Schutter E, Hecke P, and Orban GA (2003). The neural correlate of a higher-order feature-tracking motion system revealed by fMRI. Journal of Vision 3, 790. 10.1167/3.9.790. [DOI] [Google Scholar]
- 14.Battelli L, Cavanagh P, Intriligator J, Tramo MJ, Hénaff M-A, Michèl F, and Barton JJS (2001). Unilateral Right Parietal Damage Leads to Bilateral Deficit for High-Level Motion. Neuron 32, 985–995. 10.1016/S0896-6273(01)00536-0. [DOI] [PubMed] [Google Scholar]
- 15.Ilg UJ, and Churan J (2004). Motion Perception Without Explicit Activity in Areas MT and MST. Journal of Neurophysiology 92, 1512–1523. 10.1152/jn.01174.2003. [DOI] [PubMed] [Google Scholar]
- 16.Priebe NJ, Churchland MM, and Lisberger SG (2001). Reconstruction of Target Speed for the Guidance of Pursuit Eye Movements. J. Neurosci. 21, 3196–3206. 10.1523/JNEUROSCI.21-09-03196.2001. [DOI] [PMC free article] [PubMed] [Google Scholar]
- 17.Zeki SM (1978). Uniformity and diversity of structure and function in rhesus monkey prestriate visual cortex. J Physiol 277, 273–290. 10.1113/jphysiol.1978.sp012272. [DOI] [PMC free article] [PubMed] [Google Scholar]
- 18.Desimone R, and Schein SJ (1987). Visual properties of neurons in area V4 of the macaque: sensitivity to stimulus form. J Neurophysiol 57, 835–868. 10.1152/jn.1987.57.3.835. [DOI] [PubMed] [Google Scholar]
- 19.Tolias AS, Keliris GA, Smirnakis SM, and Logothetis NK (2005). Neurons in macaque area V4 acquire directional tuning after adaptation to motion stimuli. Nat Neurosci 8, 591–593. 10.1038/nn1446. [DOI] [PubMed] [Google Scholar]
- 20.Ferrera VP, Rudolph KK, and Maunsell JH (1994). Responses of neurons in the parietal and temporal visual pathways during a motion task. J Neurosci 14, 6171–6186. [DOI] [PMC free article] [PubMed] [Google Scholar]
- 21.Mountcastle VB, Motter BC, Steinmetz MA, and Sestokas AK (1987). Common and differential effects of attentive fixation on the excitability of parietal and prestriate (V4) cortical visual neurons in the macaque monkey. J Neurosci 7, 2239–2255. [DOI] [PMC free article] [PubMed] [Google Scholar]
- 22.Ungerleider LG, Galkin TW, Desimone R, and Gattass R (2008). Cortical connections of area V4 in the macaque. Cereb Cortex 18, 477–499. 10.1093/cercor/bhm061. [DOI] [PubMed] [Google Scholar]
- 23.Churchland MM, Priebe NJ, and Lisberger SG (2005). Comparison of the spatial limits on direction selectivity in visual areas MT and V1. J Neurophysiol 93, 1235–1245. 10.1152/jn.00767.2004. [DOI] [PMC free article] [PubMed] [Google Scholar]
- 24.Mikami A, Newsome WT, and Wurtz RH (1986). Motion selectivity in macaque visual cortex. II. Spatiotemporal range of directional interactions in MT and V1. J Neurophysiol 55, 1328–1339. 10.1152/jn.1986.55.6.1328. [DOI] [PubMed] [Google Scholar]
- 25.Kwon O-S, Tadin D, and Knill DC (2015). Unifying account of visual motion and position perception. Proceedings of the National Academy of Sciences 112, 8142–8147. 10.1073/pnas.1500361112. [DOI] [PMC free article] [PubMed] [Google Scholar]
- 26.Pasupathy A, Popovkina DV, and Kim T (2020). Visual Functions of Primate Area V4. Annu Rev Vis Sci 6, 363–385. 10.1146/annurev-vision-030320-041306. [DOI] [PMC free article] [PubMed] [Google Scholar]
- 27.Roe AW, Chelazzi L, Connor CE, Conway BR, Fujita I, Gallant JL, Lu H, and Vanduffel W (2012). Toward a unified theory of visual area V4. Neuron 74, 12–29. 10.1016/j.neuron.2012.03.011. [DOI] [PMC free article] [PubMed] [Google Scholar]
- 28.Li P, Zhu S, Chen M, Han C, Xu H, Hu J, Fang Y, and Lu HD (2013). A motion direction preference map in monkey V4. Neuron 78, 376–388. 10.1016/j.neuron.2013.02.024. [DOI] [PubMed] [Google Scholar]
- 29.Foster DH (1973). An experimental examination of a hypothesis connecting visual pattern recognition and apparent motion. Kybernetik 14, 63–70. 10.1007/BF00288905. [DOI] [PubMed] [Google Scholar]
- 30.Ullman S (1979). The interpretation of structure from motion. Proc R Soc Lond B Biol Sci 203, 405–426. 10.1098/rspb.1979.0006. [DOI] [PubMed] [Google Scholar]
- 31.Chen L (1985). Topological structure in the perception of apparent motion. Perception 14, 197–208. 10.1068/p140197. [DOI] [PubMed] [Google Scholar]
- 32.Petersik JT (1989). The two-process distinction in apparent motion. Psychological Bulletin 106, 107–127. 10.1037/0033-2909.106.1.107. [DOI] [PubMed] [Google Scholar]
- 33.Cavanagh P (1992). Attention-Based Motion Perception. Science 257, 1563–1565. 10.1126/science.1523411. [DOI] [PubMed] [Google Scholar]
- 34.Sato T (1998). Dmax: Relations to Low- and High-Level Motion Processes. In High-Level Motion Processing: Computational, Neurobiological, and Psychophysical Perspectives (The MIT Press; ), p. 0. 10.7551/mitpress/3495.003.0006. [DOI] [Google Scholar]
- 35.Tse P, Cavanagh P, and Nakayama K (1998). The role of parsing in high-level motion processing. In High-level motion processing: Computational, neurobiological, and psychophysical perspectives. (The MIT Press; ), pp. 249–266. [Google Scholar]
- 36.Prins N (2008). Correspondence matching in long-range apparent motion precedes featural analysis. Perception 37, 1022–1036. 10.1068/p5945. [DOI] [PubMed] [Google Scholar]
- 37.Zhuo Y, Zhou TG, Rao HY, Wang JJ, Meng M, Chen M, Zhou C, and Chen L (2003). Contributions of the visual ventral pathway to long-range apparent motion. Science 299, 417–420. 10.1126/science.1077091. [DOI] [PubMed] [Google Scholar]
- 38.Braddick OJ (1980). Low-level and high-level processes in apparent motion. Philos Trans R Soc Lond B Biol Sci 290, 137–151. 10.1098/rstb.1980.0087. [DOI] [PubMed] [Google Scholar]
- 39.Anstis SM (1980). The perception of apparent movement. Philos Trans R Soc Lond B Biol Sci 290, 153–168. 10.1098/rstb.1980.0088. [DOI] [PubMed] [Google Scholar]
- 40.Glasser DM, and Tadin D (2014). Modularity in the motion system: Independent oculomotor and perceptual processing of brief moving stimuli. Journal of Vision 14, 28. 10.1167/14.3.28. [DOI] [PMC free article] [PubMed] [Google Scholar]
- 41.O’Keefe LP, and Movshon JA (1996). First- and second-order motion processing in superior temporal sulcus neurons of the alert macaque. Society for Neuroscience Abstracts, 716. [Google Scholar]
- 42.O’Keefe LP, and Movshon JA (1998). Processing of first- and second-order motion signals by neurons in area MT of the macaque monkey. Vis Neurosci 15, 305–317. 10.1017/s0952523898152094. [DOI] [PubMed] [Google Scholar]
- 43.Gegenfurtner KR, Kiper DC, Beusmans JM, Carandini M, Zaidi Q, and Movshon JA (1994). Chromatic properties of neurons in macaque MT. Vis Neurosci 11, 455–466. 10.1017/s095252380000239x. [DOI] [PubMed] [Google Scholar]
- 44.Saito H, Tanaka K, Isono H, Yasuda M, and Mikami A (1989). Directionally selective response of cells in the middle temporal area (MT) of the macaque monkey to the movement of equiluminous opponent color stimuli. Exp Brain Res 75, 1–14. 10.1007/BF00248524. [DOI] [PubMed] [Google Scholar]
- 45.Dobkins KR, and Albright TD (1994). What happens if it changes color when it moves?: the nature of chromatic input to macaque visual area MT. J Neurosci 14, 4854–4870. [DOI] [PMC free article] [PubMed] [Google Scholar]
- 46.Felleman DJ, and Van Essen DC (1991). Distributed hierarchical processing in the primate cerebral cortex. Cereb Cortex 1, 1–47. 10.1093/cercor/1.1.1-a. [DOI] [PubMed] [Google Scholar]
- 47.Gilaie-Dotan S, Saygin AP, Lorenzi LJ, Egan R, Rees G, and Behrmann M (2013). The role of human ventral visual cortex in motion perception. Brain 136, 2784–2798. 10.1093/brain/awt214. [DOI] [PMC free article] [PubMed] [Google Scholar]
- 48.Kourtzi Z, Krekelberg B, and van Wezel RJA (2008). Linking form and motion in the primate brain. Trends Cogn Sci 12, 230–236. 10.1016/j.tics.2008.02.013. [DOI] [PubMed] [Google Scholar]
- 49.Putzeys J, Raducanu BC, Carton A, De Ceulaer J, Karsh B, Siegle JH, Van Helleputte N, Harris TD, Dutta B, Musa S, et al. (2019). Neuropixels Data-Acquisition System: A Scalable Platform for Parallel Recording of 10 000+ Electrophysiological Signals. IEEE Trans Biomed Circuits Syst 13, 1635–1644. 10.1109/TBCAS.2019.2943077. [DOI] [PubMed] [Google Scholar]
- 50.Pasupathy A, and Connor CE (2001). Shape Representation in Area V4: Position-Specific Tuning for Boundary Conformation. Journal of Neurophysiology 86, 2505–2519. 10.1152/jn.2001.86.5.2505. [DOI] [PubMed] [Google Scholar]
- 51.Gattass R, Sousa AP, and Gross CG (1988). Visuotopic organization and extent of V3 and V4 of the macaque. J. Neurosci. 8, 1831–1845. 10.1523/JNEUROSCI.08-06-01831.1988. [DOI] [PMC free article] [PubMed] [Google Scholar]
- 52.Zamarashkina P, Popovkina DV, and Pasupathy A (2020). Timing of response onset and offset in macaque V4: stimulus and task dependence. Journal of Neurophysiology 123, 2311–2325. 10.1152/jn.00586.2019. [DOI] [PMC free article] [PubMed] [Google Scholar]
- 53.Pospisil DA, Pasupathy A, and Bair W (2018). “Artiphysiology” reveals V4-like shape tuning in a deep network trained for image classification. eLife 7, e38242. 10.7554/eLife.38242. [DOI] [PMC free article] [PubMed] [Google Scholar]
Associated Data
This section collects any data citations, data availability statements, or supplementary materials included in this article.
Supplementary Materials
Video S1. An example of a long range motion stimulus with a sinusoidal grating patch. Related to Figure 1. For our results shown in Figure 1, we tailored the jump size (dX) based on estimated RF size. dT was always 100 ms.
Video S2. An example of a long range motion stimulus with a noise patch. Related to Figure 1. All other details as in Video S1.
Video S3. An example of a long range motion stimulus with local drift in the same direction. Related to Figure 1.
Video S4. An example of a long range motion stimulus with local drift in the opposite direction. Related to Figure 1.
Video S5. A drifting sinusoidal grating patch, i.e., motion behind an aperture. Related to Figure 1.
Data Availability Statement
Data and code are available at: https://dx.doi.org/10.17632/cs76nk38zj.1. Requests for clarification and additional information will be fulfilled by the lead contact.