Abstract
CYP106A2 (cytochrome P450meg) is a bacterial enzyme originally isolated from B. megaterium, and has been shown to hydroxylate a wide variety of substrates, including steroids. The regio- and stereochemistry of CYP106A2 hydroxylation has been shown to be dependent on a variety of factors, and hydroxylation often occurs at more than one site and/or with lack of stereospecificity for some substrates. Comprehensive backbone 15N, 1H and 13C resonance assignments based on multidimensional nuclear magnetic resonance (NMR) experiments performed with uniform and selective isotopically labeled CYP106A2 samples are reported herein, and broadening and splitting of resonances assigned to regions of the enzyme shown to be affected by substrate binding in other P450 enzymes indicate that substrate binding does not reduce structural heterogeneity as has been observed previously in P450 enzymes CYP101A1 and MycG. Paramagnetic relaxation enhancement (PRE) due to proximity between substrate protons and the heme iron were measured for three different substrates, and the relatively uniform nature of the PREs support the proposal that multiple substrate binding modes are occupied at saturating substrate concentrations.
Keywords: cytochrome P450, nuclear magnetic resonance, paramagnetism, substrate, enzyme conformations, stereochemistry, regiochemistry
Graphical Abstract
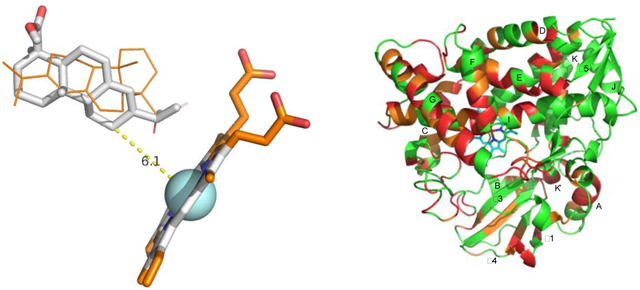
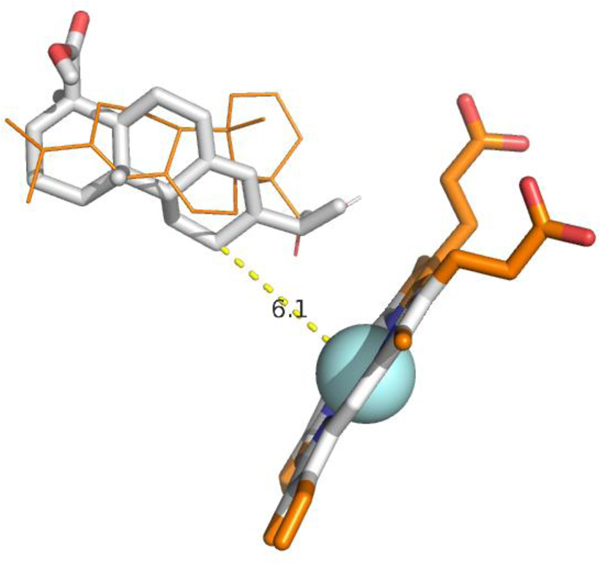
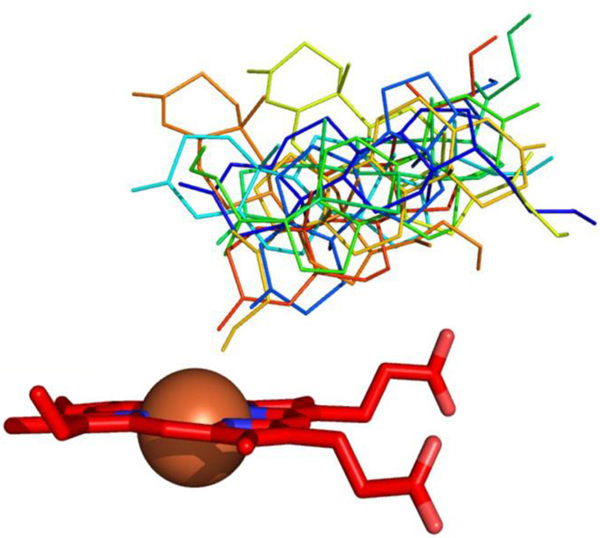
Left) Two equal energy orientations of abietic acid in the CYP106A2 active site. Structure in gray sticks shows distance between hydroxylation site and heme. Structure in orange lines places the carboxylate close to the heme. Right) Structure of CYP106A2 with residues most affected by heterogeneity highlighted in red.
Introduction
The importance of cytochromes P450 in the biosynthesis of natural products and bioremediation processes cannot be overstated. These Feheme containing monooxygenases activate molecular oxygen (O2), and catalyze the oxidative modification of unactivated C-H and C-C bonds, often in a highly regio- and stereoselective manner. As such, these enzymes are commonly found in biosynthetic or catabolic pathways that require oxidative modifications for elaboration or modification of intermediates.3 An early P450 to be isolated was CYP106A2 (cytochrome P450meg), one of several P450s from the soil bacterium Bacillus megaterium.4 Although the natural substrate(s) of CYP106A2 are not known, it was found that the enzyme can act a steroid hydroxylase, with the 15β-position of the steroid ring being a major (but not the only) product.5 Given that CYP106A2 is soluble and readily expressed in bacterial culture, there is obvious interest in the potential of enzyme engineering to improve the regioselectivity of steroid hydroxylation by CYP106A2 for manufacturing purposes. Extensive research by the Bernhardt group has found that not only the nature of the substrate but that of associated redox partners affect the product distributions in hydroxylations catalyzed by CYP106A2, and that site-directed mutagenesis combined with directed evolution can be used to change hydroxylation regiochemical distributions.6–8
We are applying multidimensional NMR methods in order to understand the role of enzyme dynamics and conformational selection in substrate binding and orientation in the P450 enzyme superfamily. In two cases that we have examined in detail, (CYP101A1, a camphor hydroxylase from Pseudomonas, and MycG, a macrolactone hydroxylase-epoxidase from Micromonospora) the substrate-depleted enzymes sample multiple conformational states so that many 1H-15N correlations in TROSY spectra are broadened asymmetrically. Such broadening indicates that multiple conformations exchanging over a range of time scales are contributing to the observed correlation.9 However, upon substrate binding, we observe collapse of most asymmetric multiplets to single correlations. This collapse indicates that substrate binding induces population of a subset of preferred enzyme conformers with low interconversion barriers. We note that both of CYP101A1 and MycG give rise to stereo- and regiospecific oxidations of their respective substrates.10
However, in the case of CYP106A2, we find that substrate binding does not substantially reduce multiplicity of 1H,15N correlations in HSQC spectral maps, suggesting that multiple conformational states separated by relatively high energy barriers are occupied in the substrate-bound enzyme. Practically, this renders difficult the sequential assignment of resonances via multidimensional NMR (critical for more complete characterization of structural and dynamic considerations in the regio- and stereoselectivity of this enzyme), as even in three-dimensional spectra, the overlap of broadened correlations in multiple dimensions increases the ambiguity of through-bond connections. It is likely that these issues have also affected the determination of crystallographic structures of CYP106A2: Unlike most bacterial (soluble) P450s, crystals structures for this enzyme have appeared only recently, and disorder in several regions, particularly near the active site, are apparent in those structures.11, 12
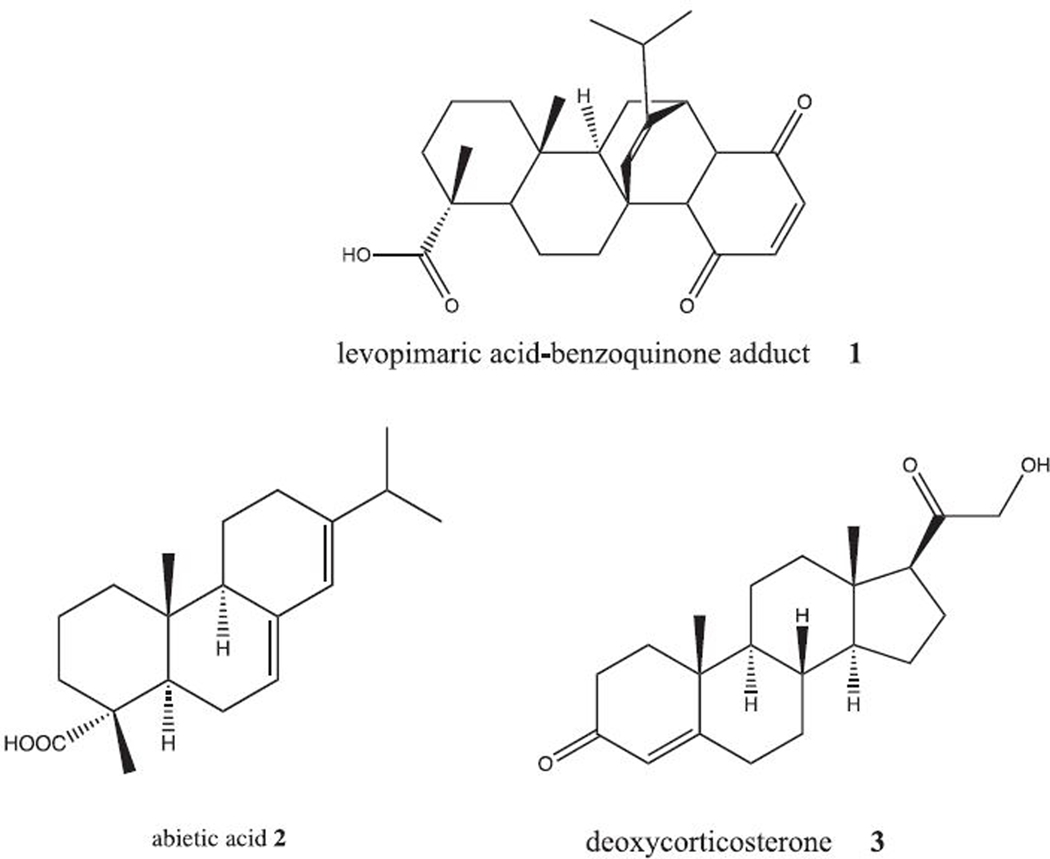
Despite these issues, we now report assignments for ~70% of the backbone amide N-H correlations in CYP106A2, providing insight into those regions of the enzyme that are most affected by conformational heterogeneity. Further insights were obtained from paramagnetic relaxation of substrate 1H resonances due to the ferric heme iron, with paramagnetically induced relaxation of nuclear spins providing comparative average distances from the heme iron. These allow the characterization of possible binding orientation(s) of several known substrates of CYP106A2 (see Scheme I), and relate this to known hydroxylation patterns of the enzyme.
Scheme I.
Experimental
Synthesis of 1 (levopimaric acid-benzoquinone Diels-Alder adduct).13
24 mg of levopimaric acid (BOSci, Shirley, NY) was dissolved along with 10 mg of p-benzoquinone (Sigma-Aldrich) in 0.3 mL benzene in a sealed reaction vial with stirring at room temperature. After 12 h, crystals formed, and 0.1 mL hexanes was added and the mixture briefly sonicated to encourage further crystallization. Crystals of 1 were obtained by filtration after washing with cold 50:50 hexane/benzene solution, m.p. 214 °C. 1 is light-sensitive and so should be stored dark at −20 °C.
Recrystallization of abietic acid 2.
3g of impure 2 (~70%, Fischer Scientific, Waltham, MA) was dissolved to supersaturation in 25mL of diethyl ether by heating the mixture to near boiling, or just under 34°C. (Boiling can lead to phase separation). Once fully dissolved, the amber yellow solution was allowed to cool to room temperature. Faint crystals (the index of refraction of solution and 2 appear to be very similar) could be observed at the bottom of the flask, and so the flask was placed in a sonicating bath for 2 minutes to fragment these crystals into seeds, and then the flask was placed on ice for 1 hour. Once cooled, the flask was swirled to dislodge crystals from the bottom, and the mixture was poured onto a filter paper in a Buchner funnel, vacuumed to dryness and washed with cold diethyl ether. After solvent removal, crystals were scraped from the filter paper into an Eppendorf microcentrifuge tube, yielding 23mg of 2.
Compound 3 (11-deoxycorticosterone) was used as purchased (Sigma-Aldrich) without further purification.
Expression and purification of u-2H,15N,13C CYP106A2.
E. coli strain NCM53314-16 was transformed with a CYP106A2-encoding plasmid, pKKHC106A2, a gift from Professor Rita Bernhardt. This plasmid features a trc promoter and confers ampicillin resistance.17 In order to acclimate transformed cells to perdeuterated media, a stepwise procedure was employed. Fresh transformant colonies (NCM533/pKKHC106A2) were inoculated into 5mL LB starter cultures, incubated at 37°C at 200rpm until visible growth was observed. 5mL of the starter culture was transferred to a pre-warmed flask of 50mL M9 minimal media, and incubated at 37°C, 200rpm, until O.D.600 ≥ 0.5 was reached. 10mL of this culture was transferred to a pre-warmed 250mL 30% D2O-based M9 medium, and then via the same procedure to 70% D2O-based M9 after O.D.600 ≥ 0.5 reached. This culture is incubated at 37°C, 200rpm, until the O.D.600 ≥ 0.25, which may take 4–6 hours after inoculation. Once the 70% culture has reached an appropriate O.D.600, the culture was pelleted in sterile centrifuge tubes using a Beckman-Coulter JA-10 fixed angle rotor, centrifuged at 5000rpm for 30 minutes, 20°C. The pellet was resuspended in 250mL of pre-warmed 99+% D2O-based M9 media and incubated until O.D.600 ≥ 0.8 was reached, and then re-pelleted and resuspended in the final expression media. Note that in all media preparations with D2O concentrations of 98% or higher, filter sterilization is required, as steam sterilization will dilute the D2O with H2O. Due to low cost, 15NH4Cl was included in all of the minimal media preparations at all stages. The final culture, 1.375L of pre-warmed 99+% D2O M9 with u-2H,13C-labeled glucose (CIL) was inoculated with the prior culture’s pellet, incubated at 37°C 200rpm until O.D.600 = 0.6–0.8 is reached, at which point 100mg 5-aminolevulinic acid (5-ALA) and up to 10μM of an appropriate stabilizing ligand (2 for CYP106A2) were added to the culture. (If only 15N,2H labelling was desired, unlabeled glucose was substituted for the labeled material). The temperature was then decreased to 30°C. Reaching this point may take another 4–8 hours, so careful monitoring is essential. Once the culture reaches O.D.600 = 0.8–1.0, isopropyl β-D-1-thiogalactopyranoside (IPTG) is added to 1mM, the culture was supplemented with 0.5g or more of u-13C, u-2H, u-15N Celtone Base Powder (Cambridge Isotope Laboratories, Inc.), and the rotation speed reduced to 150rpm. The culture was allowed to express for 32 hours. The culture, a tan pink to dark salmon color, was pelleted in a JA-10 rotor, 4°C 5000rpm 45min, after which supernatant was decanted and pellets are collected into 50mL conical tubes. The tubes were flash frozen in liquid nitrogen and stored at −80°C. Spent media may be recycled by distillation under nitrogen from CaO and filtration of the distillate through activated charcoal to recover D2O for use in subsequent preparations.
Preparation of selectively 15N- and 13C-proline-u15N labeled CYP106A2.
Selective 15N-labeled amino acid labeling was accomplished as above, except the inorganic nitrogen source was not labeled, and amino acids were added prior to induction to suppress scrambling. The following amounts of each amino acid was added to 1 L of medium prior to induction: (a, autoclaved; f, filter sterilized) Ala 0.50g a, Arg 0.40g a, Asp 0.40g f, Asn 0.40g f, Gln 0.40g f, Glu 0.65g f, Gly 0.55g a, His 0.15g a, Ile 0.23g a, Leu 0.23g a, Lys 0.42g a, Met 0.25g a, Phe 0.13g a, Pro 0.10g a, Ser 2.00g a, Thr 0.23g a, Tyr 0.17g f, Val 0.23g a, Trp 0.05g f, Cys 0.05g f. The desired 15N-labeled amino acid was added in lieu of the unlabeled material in the same amount. Samples prepared with selective labels included 15N-leucine, 15N-valine, 15N-isoleucine, 15N-arginine, 15N-lysine, 15N-tyrosine, 15N-phenylalanine, 15N-glycine and 15N-alanine.
Given the frequency of prolines (20) in the CYP106A2 sequence and the interruptions in the amide NH-based sequential assignment process that proline introduces, a sample was prepared with uniform 2H and 15N labels, and selective 13C labelling of proline. Growth and expression followed a procedure similar to that for the uniformly labeled sample described above, except that unlabeled glucose was used to prepare the medium, and prior to induction, 0.10g/L of 13C-proline is added, allowing time for the amino acid to be fully dissolved before addition of IPTG. This sample was used for the two-dimensional HNCO experiment described below.
Purification of CYP106A2 and preparation of NMR samples.
Isotopically labeled samples of CYP106A2 were purified as follows. A frozen pellet of cells (on average 9–13g per liter of growth) was thawed to room temperature, after which the pellet was resuspended in 50mL low salt buffer A (50mM Tris-HCl pH = 7.4, 1mM DTT, saturating amount of 1) per 5g of pellet. Phenylmethylsulfonyl fluoride (PMSF) was added to a final concentration of 200μM, and a spatula-tip of DNAse I added. The suspension was homogenized using a Dounce homogenizer, and then lysed using a French pressure cell (Thermo Scientific). After 3–4 passes of the resuspension at 10,000psi, the lysate was translucent, with a rusty orange color. The lysate was then centrifuged in a JA-20 rotor at 15,000rpm, 4°C, for 1 hour. The clarified supernatant was decanted into a syringe Luer-locked with a 0.45μm polyvinylidene fluoride (PVDF) filter. Then, the filtrate was applied to a diethylethanolamine (DEAE) anion-exchange gravity column (CV = 50mL) pre-equilibrated in buffer A. Once binding was complete, the column was washed with 2 CV of buffer A. A step-wise gradient of buffer A to buffer B (buffer A + 400mM NaCl) was applied, in which 50mL each of 90:10, 80:20, 75:25, 70:30, 60:40, and 50:50 buffer A to buffer B was used. 4 mL eluent fractions were collected, with deep red fractions obtained between fractions 20–28. Fractions with the highest A417/A280 ratio would be pooled, concentrated to <500μL, and injected onto a Superose™ 6 Increase 10/300 gl size exclusion column (Cytiva, Marlborough, MA) pre-equilibrated with SEC buffer (50mM KPi pH = 7.4, 150mM NaCl, 1mM dithiothreitol (DTT), saturating amount of ligand 1) mounted on an Akta FPLC. A flow rate at 0.45mL/min was used, and fractions were collected in 1min increments. Fractions with the highest A417/A280 ratio were pooled, and concentrated to <500μL. The sample was then applied to a Cytiva HiTrap 5mL desalting column (Cytiva, Marlborough, MA) preequilibrated with NMR buffer (50mM KPi pH 7.4, 100mM KCl, saturating 1, 10% D2O). After exchange, the sample was concentrated via centrifugal concentration in 30,000 MW cutoff Amicon Ultra-15 centrifugal filter units to a final concentration of ~400 μM in a volume of 250μL, and transferred to a gas-tight vial. The sample was kept on ice and the vial purged with a gentle stream of carbon monoxide gas for 15 min. Then it was transferred to an anaerobic chamber, where up to 3μL of freshly prepared 250 mM sodium dithionite (Na2S2O4) in 1M KPi, pH = 7.4 was added to the sample, with mixing by inversion in between additions. The sample’s color changed from a deep, dark, blood red to a bright and much more translucent cherry red upon reduction. The sample was then transferred anaerobically to a Shigemi susceptibility-matched NMR tube. The tube was sealed with Parafilm prior to removal from the anaerobic chamber.
NMR data acquisition and analysis.
All two- and three-dimensional NMR spectra used for sequential backbone resonance assignments in CYP106A2 (1H,15N-TROSY-HSQC, HNCA, HNCACB, 2D-HNCO, 15N-edited 1H-NOESY) were acquired at 25 °C using standard pulse sequences on a Bruker Avance NEO 800 spectrometer at the Landsman Research Facility at Brandeis University equipped with a TCI cryoprobe (1H, {13C,15N}). Typical data collection time for complete three-dimensional data sets range from 24 to 48 h. The spectrometer operates at 800.13 MHz (1H), 201.193 (13C), 81.076 (15N) and 122.83 MHz (2H). All acquisitions were acquired using TROSY modifications for narrow line selection.18 NMR data was processed using TopSpin (Bruker), and sequential assignments performed using SPARKY19 and CCPNmr20 software packages.
Acquisition and analysis of R1 relaxation data.
1H R1 relaxation rates of substrates 1, 2 and 3 were measured in the presence of increasing concentrations of unlabeled ferric CYP106A2 in order to determine paramagnetic contributions R1para to the observed substrate 1H relaxation rates. In turn, R1para can to be used to calculate relative distances between the heme iron and substrate protons for identifying potential binding orientations. A series of standard inversion-recovery T1 relaxation experiments were performed for each sample with measurements first in the absence of CYP106A2, followed by addition of aliquots of the enzyme in molar ratios to substrate of (0.01, 0.02 and 0.025). Stock solutions of substrates 1 and 2 were first prepared in d6-DMSO. These samples were used for NMR experiments required for 1H resonance assignments, which were made by analysis of 1H double-quantum filtered COSY, 1H NOESY, 1H,13C HSQC and 1H,13C heteronuclear multiple bond correlation (HMBC) experiments. For 3, a 100% D2O buffer 50 mM KPi pD 7.4, 1 mM DTT, was saturated with 3 (60 μM). Spectra were processed and relaxation times for substrate protons were calculated using Topspin 3.0 (Bruker BioSpin). Background 1H signals due to added protein were suppressed using convolution difference subtraction prior to peak picking and curve fitting to obtain T1 values. All experiments were performed in triplicate and average T1 times were used for further analysis.
The contribution of paramagnetic effects to the observed relaxation times, T1obs, were obtained using the nonlinear fit routine FindFit (Mathematica, Wolfram Inc.) by fitting to equation (2):
| (1) |
| (2) |
where Eo and So are enzyme and substrate concentrations, respectively. Kd values used in the fits were those determined by Bernhardt et al (53 μM for 1, 63 μM for 2, 60 μM for 3).1, 12 Once values for R1para were obtained, relative distances to the heme iron could be calculated using the Solomon-Bloembergen equation (3):
| (3) |
where μo is the permeability of free space, ge is the electronic g value, μB is the Bohr magneton, γI is the gyromagnetic ratio of 1H, S is the electronic spin, τc is the molecular correlation time, ωI is the 1H frequency in radians, and ωe is the electronic transition frequency. The electronic relaxation time τe is expected to dominate the value of the correlation time, and the measured value for the low spin state of cytochrome P450cam (τe = 5.4 × 10⁻¹¹ s) was used.21
Docking simulations using AutoDockVina and PyRx.
The substrate free homology model of 106A2 was used as a starting point for docking. An energy minimized PDB structure of substrates were generated using ChemDraw3D (Perkin Elmer). Initial docking was performed using the AutoDock Vina plugin for PyRx.22 Docking was restrained to the active site of 106A2 homology model23 using a 20 Å cubic search space.
Restrained MD simulations of 3-CYP106A2 complex.
Parameter and topology files for the complex were generated using the xleap module of Amber 11.24 Potassium ions were used to neutralize the overall charge of the complex. The sander module of Amber 11 was used to perform energy minimization and subsequent distance-restrained molecular dynamics of the complex. The Fe-H distance restraints used were calculated as described above. 2000 steps of minimization were performed with a 20 Å cutoff, followed by three 2000× 2 fs step equilibration runs of vacuum dynamics performed using a continuum dielectric, from 0–40 K, 40–100 K and 100–300 K. After equilibration, 10 ps of production dynamics were performed at 300K. Coordinates were saved every 100 steps. The generated coordinates were examined for restraint violation penalties, and a representative zero-violation structure chosen for further examination.
Results
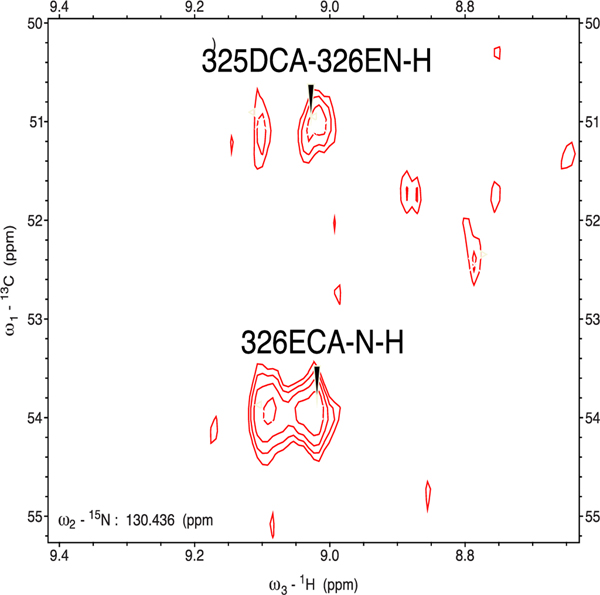
Resonance assignments in reduced carbonmonoxy- and 1-bound CYP106A2 were made using a combination of triple-resonance experiments (HNCA, HNCACB) performed with u-2H,15N,13C-labeled enzyme, a 15N-edited 1H-NOESY experiment using uniformly 2H,15N-labeled material, and multiple samples prepared with selective 15N labeling of amino acid residues by type, including Ile, Leu, Val, Phe, Tyr, Gly, Ala, Arg and Lys. A two-dimensional HNCO experiment performed with a u-2H,15N, (13C-proline) labeled sample was used to identify amide N-H correlations i+1 to prolines. Given the multiplicity of many correlations in the triple-resonance experiments (see Figure 2), the use of type-selective labels to support and/or confirm assignments was particularly useful here.
Figure 2.
Splitting of Cα correlations from Asp 325 and Glu 326 to the amide NH of Glu 326 in the HNCA spectrum of reduced 1-bound carbonmonoxyCYP106A2. E326 lies at the C-terminal end of the K’ helix, which is sensitive to the presence of substrate. Data obtained at 18.8 T (800 MHz 1H) at 25 °C.
The distribution of the type and extent of spectral multiplicity is shown in Figure 3, with a tabular listing provided as Supplementary Material. While there is necessarily some subjectivity with respect to how the appearance a given correlation is judged, we classified correlations as “single”, that is, no apparent asymmetric broadening, “slight”, with a minor shoulder(s) on the primary peak, “doubled”, at least two major components to a single correlation (see Fig. 2), and “broad”, with multiple different contributions to a given correlation.
Figure 3.
Distribution of conformational multiplicity of assigned resonances in reduced carbonmonoxy- and 1-bound CYP106A2. The left-hand structure is rotated ~90° clockwise from Fig. 1 for clarity. Center and right-hand figures are approximately the same orientation as in Fig. 1. Left: Blue- “single”, one major peak observed. Center: Magenta- “slight”, some asymmetry, with one major peak. Right: Orange, “doubled” into at least two major peaks. Red- “broad”, multiple splittings. See Supplementary Material for tabulation of data used to generate color schemes.
Substrate 1, the Diels-Alder adduct of the slash pine resin component levopimaric acid and p-benzoquinone, was chosen to stabilize reduced (diamagnetic) carbonmonoxy-bound u-2H,15N,13C-labled samples for three-dimensional NMR experiments, as it is one of the few substrates known to induce an appreciable shift from low (S=1/2, λmax = 418 nm) to high spin (S=5/2, λmax = 390 nm) heme iron in CYP106A2. This spin shift is taken as an indication of a fairly compact fit of the substrate into the P450 active site (vide infra). It was hoped that this would minimize the conformational space accessible to the enzyme on the 1H chemical shift time scale. Nevertheless, even with 1 bound, considerable broadening and resonance splitting is still observed, consistent with the presence of multiple substrate binding orientations with similar energetics.
It is worth noting the distribution of the broadening effects (Fig. 3). By far the most affected are residues in secondary structures that we have previously noted to be most responsive to substrate binding in CYP101A1 and MycG.25 In both of those enzymes, these include the β-rich region bounded by the A, B and K’ helices, as well as the N-terminal half of the I helix. In the case of CYP101A1, the F and G helices are less affected, while the C-D region is more strongly perturbed. The sensitivity of the C-D loop in CYP101A1 has recently been ascribed to a secondary binding site for camphor in this region.26 For MycG (with the larger substrate) the F and G helices are strongly affected by substrate binding. It is also worth noting that most residues in the F-G loop (which is disordered in all crystal structures of CYP106A2, and was modeled into the structures in Fig. 3) fall into the strongly broadened category.
Equally important is the observations of where there is less noticeable splitting/broadening of correlations in CYP106A2: These include the J and L helices, the “β-meander” that contains the proximal Cys thiolate ligand for the heme iron, and the regions of the β5 sheet that are remote from the active site (Fig. 3 left). In both CYP101A1 and MycG, these regions were relatively unperturbed upon substrate binding and exhibited the highest degree of sequence homology between those two enzymes.
Paramagnetic contributions to 1H relaxation as a probe for relative proton-Fe distances in enzyme-substrate complexes.
Dipolar interactions between nuclear spins and unpaired electron spins are an important contributor to both transverse (T2) and longitudinal (T1) relaxation in paramagnetic molecules. The Solomon-Bloembergen equation (Eq. 3) provides an estimate of the distance between a given nuclear spin and an unpaired electron based on the extracted value of paramagnetic contribution R1para to the observed nuclear spin longitudinal relaxation rate R1 (the inverse of the relaxation time T1). There are obvious caveats to the use of this approach in characterizing the orientation of substrate in the active site of a P450. First, it is assumed in Eq. 3 that the unpaired electron is localized on the iron; given that there is some delocalization of unpaired spin density into the porphyrin π system, this simplification leads to some ambiguity for the distances calculated. Furthermore, the spin state of the paramagnetic center is specified in Eq. 3, and mixing of spin states will complicate the calculation, even if the extent of mixing is known.
Nevertheless, we27 and others28 have found that such measurements can provide useful qualitative information regarding substrate orientation if the Fe-H distances extracted are treated as comparative values (as opposed to absolute distances). That is, the greater the paramagnetic contribution R1para of to the observed relaxation rate R1obs, the more time that 1H spin spends near the heme iron. As such, we measured the 1H relaxation times of the three CYP106A2 substrates under investigation to see if we could obtain any insights into substrate orientation(s) in the active site based on this data.
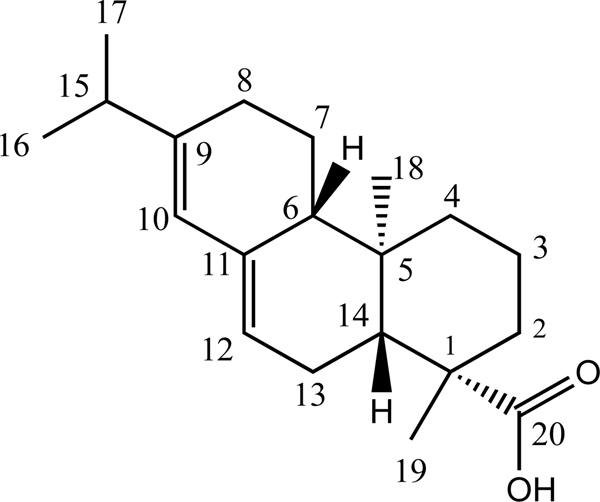
In only one case, that of abietic acid 2, was there a discernable preference for an orientation that placed the site of hydroxylation (C8) significantly closer to the heme iron (5.6 Å) than other positions. However, the two methyl groups C16 and C17 (which overlap in 1H NMR spectra) with a calculated distance of 6 Å, are nearly as close, as is the sp2 hybridized C10 (6.7 Å). Rigid body modeling using the Autodock Vina plugin for PyRx detected no strong orientational preference for binding of 2, with orientations placing the carboxylate (C20) close to the heme with similar energies to that placing the hydroxylation site close (Figure 5).
Figure 5.
Two equal energy binding orientations of equal energy (−5.4 kcal/mol) from AutoDock Vina for substrate 2 into PDB structure 4YT3. Structure in gray sticks shows distance between hydroxylation site (C8) and heme. Structure in orange lines places the carboxylate (C20) close to the heme.
In the case of substrate 1, all the calculated distances range between 9.8 and 12.6 Å, with most falling between 10 and 11.8 Å (see Table S2). As the hydroxylation site for 1 has not been reported, it is not known whether any of the closer distances correspond to the site of hydroxylation. In any case, the range of distances is too small to allow for a confident prediction of regiochemistry of hydroxylation in 1.
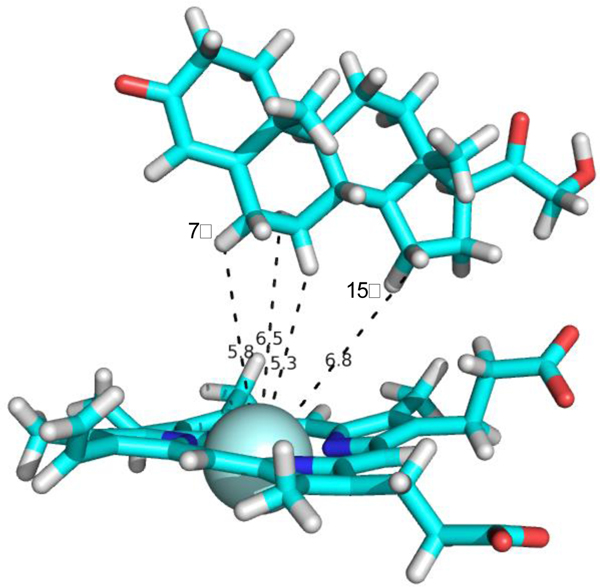
Substrate 3, 11-deoxycorticosterone, is hydroxylated by CYP106A2 at the 7β and 15β positions. Again, the calculated distances for most 1H spins to the heme iron in 3 range between 10–12.3 Å, with the 7β proton at 10.9 Å (7α at 11.1 Å), and the 15β at 12.9 Å (15β at 12.1 Å) (See Table S4 for all calculated distances and steroid atom numbering for 3). AutoDock Vina modeling of 3 into the rigidified CYP106A2 active site yielded nine different orientations (Figure 6) that varied in energy by less than 0.7 kcal/mol, again with no particular orientation of 3 obviously favored. The nominal lowest-energy orientation shown in red in Fig. 6 was chosen as input for an in vacuo molecular dynamics simulation using the calculated Fe-H distances in Table S4 as maximum distance restraints. A typical no-violation structure extracted from that simulation is shown in Figure 7. As can be seen, both hydroxylation sites are accessible to the heme iron, with only a small movement required to position one or the other of the sites appropriately for reaction.
Figure 6.
Nine most energetically favorable orientations of 3 in the rigidified CYP106A2 active site generated using AutoDock Vina. Despite widely different orientations, calculated energies ranged between −7.1 and −7.8 kcal/mol.
Figure 7.
Representative 3-CYP106A2 complex from restrained MD. See text above for details.
Discussion
The observed multiplicity of NMR correlations distributed as shown in Figs. 3 is expected to relate to the distribution of conformational states accessed by the enzyme at a given residue under the conditions of the experiment, with rapidly interconverting conformations contributing to a single observable peak. Narrow peaks suggest rapid interconversion on the 1H chemical shift time scale, which will broaden as interconversion times increase, until slow exchange on the NMR time scale will result in separate correlations. The splitting in the correlations assigned to Glu 326 shown in Fig. 2 (~64 Hz) combined with the line widths of individual peaks (~40 Hz) when fit to a two-state simulation indicates an interconversion rate < 100 s−1 between the ensembles contributing to each peak. We note that Glu 326 lies at the C-terminal end of the K’ helix, which is strongly perturbed by substrate binding both in CYP101A1 and MycG.25, 29 Estrada et al. noted similar slow conformational interconversions in spectra of CYP17A1 with type II inhibitor abiraterone bound, although unlike CYP106A2, the observed heterogeneity appears to be restricted to regions adjacent to the active site.30 As abiraterone is tightly bound in the CYP17A1 active site via a dative covalent bond to the heme iron, it would seem that, at least in that case, the conformational exchange is occurring with inhibitor remaining bound. While this does not preclude the possibility that substrate 1 is exiting and re-entering the active site on a time scale sufficient to account for the observed splitting/broadening of lines, the fact that multiple states are present indicates that more than one substrate-bound conformational ensemble is populated. A reviewer of an earlier version of this paper suggested that it was possible that the heterogeneity observed here is a response to substrate binding, and that in the absence of substrate, interchange may be faster. We will investigate this possibility in future work.
Spin state and substrate binding
Upon substrate binding, P450 enzymes typically exhibit a change in the spin state of the heme iron, from a low spin Fe3+ (S=1/2, λmax = 418 nm) to a high spin form (S=5/2, λmax = 390 nm). The spin state change is accompanied by a redox potential shift that permits the first electron required for O2 activation to be acquired.31 While this spin state change has traditionally been associated with the dissociation of the resting state water/hydroxide axial ligand to the heme iron upon substrate binding, we and others have found evidence that this spin state change is the result of conformational changes in the heme porphyrin itself,32, 33 with partial or complete dissociation of the axial ligand likely an effect rather than the cause of the spin state change.3 In the case of CYP106A2, substrate-induced spin state changes are typically small, and often undetectable by UV-visible spectroscopy: The binding of deoxycorticosterone 3 is detected only by perturbations of heme-CO absorbances in infrared spectra34, while substrate 1 results in a small (< 5%) shift to 390 nm at saturation (Kd ~ 53 μM).1 Given the significantly larger steric bulk of 1 relative to other known CYP106A2 substrates, this supports the notion that spin state changes are the result of direct or indirect interactions between the heme porphyrin and substrate.3, 33 Nevertheless, the fact that NMR spectra of CYP106A2 obtained with 1 bound still exhibits significant multiplicity, particularly for regions near to the active site or that are sensitive to substrate binding, indicates that 1 binds in multiple orientations. It was noted that 1 is oxidized in reconstituted CYP106A2 assays to yield a single product,1 suggesting that the orientation giving rise to the high spin form may also be that which is also most conducive to reaction. Indeed, our recent combined computational/in vitro mutational characterization of CYP101A1 demonstrated that, while substrate (in that case, camphor) could occupy multiple orientations in the active site, both the spin state change and enzyme efficiency tracked remarkably closely with the fraction of time that site of hydroxylation spent close to the heme iron in simulations.10
We have previously suggested that, despite differences in sequence and specific function, the conserved structural features across the P450 superfamily perform similar functions in the different enzymes.25 In particular, the proximal J, K and L helices, along with the portion of the β-meander containing the axial cysteinyl ligand to the heme iron, provide a stable platform required for the monooxygenase activity that members of the superfamily perform. As was the case between CYP101A1 and MycG, despite low overall sequence homology between CYP101A1 and CYP106A2 (30% identity, 44% similarity), these regions display a higher degree of identity (45%) and similarity (60%,) with no gaps in either sequence in these regions (See Supplementary Figure S1).35
Conversely, those regions of CYP106A2 that exhibit the greatest sensitivity to substrate binding modes as described here and shown in Fig. 3 are indeed the same regions that were seen to be responsive to substrate binding in comparisons of solution structural ensembles of CYP101A1 and MycG with and without their respective substrates bound.25 Our current efforts are focused on identifying ligands that might be used to stabilize a single conformational ensemble of CYP106A2. If successful, this will make possible the use of residual dipolar couplings to generate solution ensembles of substrate-free and bound CYP106A2 in a manner similar to our previous work with CYP101A1 and MycG.
Supplementary Material
Figure 1.
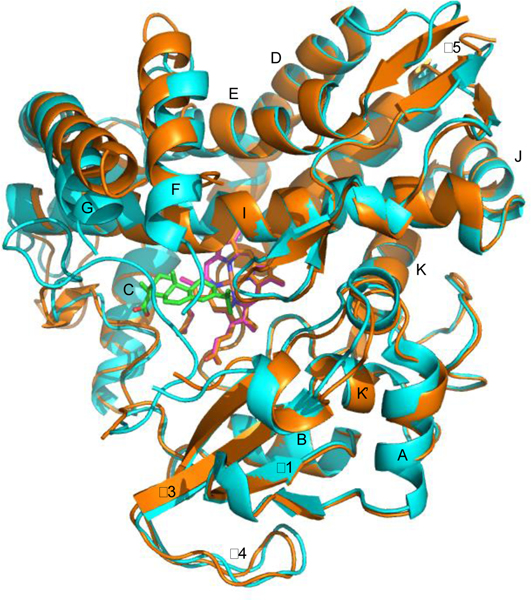
Superposition of crystallographic structures of CYP106A2 with abietic acid bound (5IKI, cyan) and substrate-free (4YT3, orange). Heme is shown in purple, abietic acid in green. Secondary structures are labeled as by Poulos.2 Helix A, P22-N32; β1, V35-V46; B, Y49-S57; C, P94-A106; D, R110-Q129; E, D137-M155; F, L163-F173; G, E183-L208; H, I214-K220; I, D230-D262; J, E265-E272; K,L274-F287; β3 (s1), K293-V298; β4, K299-E311; β3 (s2), G312-W318; K’, M319-D325; β meander, E326-L356, L, G357-K374, β5, K377-S408. 4YT3 is disordered from K67-V82, between the B and C helices. Both structures are disordered in the F-G loop, F176-Q181.
Figure 4.
Carbon atom numbering for abietic acid 2 used in text. CYP106A2 catalyzed hydroxylation is regiospecific at C8, but both stereoisomers are detected. Readers should note that C8 corresponds to C12 in Bleif et al.1
Comprehensive backbone NMR assignments for CYP106A2
Multiple substrate binding modes give rise to heterogeneity in NMR spectra.
Most affected regions are those involved in substrate binding.
Paramagnetic relaxation patterns support multiple substrate binding orientations.
Acknowledgements.
The authors thank Prof. Dr. Rita Bernhardt and her group (Univ. Saarlandes, FRG) for providing expression vectors for CYP106A2 and useful discussions. JB acknowledges a grant from the Humboldt Foundation for supporting a visit to the Bernhardt laboratory. NRW ackowledges partial support from NIH training grant T32-GM007596 to Brandeis University. TCP acknowledges partial support from NIH grant R01-GM130997.
Footnotes
Declaration of interests
The authors declare that they have no known competing financial interests or personal relationships that could have appeared to influence the work reported in this paper.
Publisher's Disclaimer: This is a PDF file of an unedited manuscript that has been accepted for publication. As a service to our customers we are providing this early version of the manuscript. The manuscript will undergo copyediting, typesetting, and review of the resulting proof before it is published in its final form. Please note that during the production process errors may be discovered which could affect the content, and all legal disclaimers that apply to the journal pertain.
References
- 1.Bleif S; Hannemann F; Lisurek M; von Kries JP; Zapp J; Dietzen M; Antes I; Bernhardt R, Identification of CYP106A2 as a Regioselective Allylic Bacterial Diterpene Hydroxylase. ChemBioChem 2011, 12 (4), 576–582. [DOI] [PubMed] [Google Scholar]
- 2.Raag R; Poulos TL, Crystal structure of the carbon monoxide-substrate-cytochrome P450CAM ternary complex. Biochemistry 1989, 28 (19), 7586–92. [DOI] [PubMed] [Google Scholar]
- 3.Pochapsky TC, A dynamic understanding of cytochrome P450 structure and function through solution NMR. Current Opinion in Biotechnology 2021, 69, 35–42. [DOI] [PMC free article] [PubMed] [Google Scholar]
- 4.Berg A; Ingelman-Sundberg M; Gustafsson JA, Purification and characterization of cytochrome P-450meg. J Biol Chem 1979, 254 (12), 5264–71. [PubMed] [Google Scholar]
- 5.Berg A; Gustafsson JA; Ingelman-Sundberg M, Characterization of a cytochrome P-450dependent steroid hydroxylase system present in Bacillus megaterium. Journal of Biological Chemistry 1976, 251 (9), 2831–2838. [PubMed] [Google Scholar]
- 6.Nikolaus J; Nguyen KT; Virus C; Riehm JL; Hutter M; Bernhardt R, Engineering of CYP106A2 for steroid 9α- and 6β-hydroxylation. Steroids 2017, 120, 41–48. [DOI] [PubMed] [Google Scholar]
- 7.Sagadin T; Riehm JL; Milhim M; Hutter MC; Bernhardt R, Binding modes of CYP106A2 redox partners determine differences in progesterone hydroxylation product patterns. Communications Biology 2018, 1 (1), 99. [DOI] [PMC free article] [PubMed] [Google Scholar]
- 8.Nguyen KT; Virus C; Gunnewich N; Hannemann F; Bernhardt R, Changing the Regioselectivity of a P450 from C15 to C11 Hydroxylation of Progesterone. Chembiochem 2012, 13 (8), 1161–1166. [DOI] [PubMed] [Google Scholar]
- 9.Asciutto EK; Young MJ; Madura JD; Pochapsky SS; Pochapsky TC, Solution structural ensembles of substrate-free cytochrome P450cam. Biochemistry 2012, 51, 3383–3393. [DOI] [PMC free article] [PubMed] [Google Scholar]
- 10.Alvarez G; Le T; Wong N; Echave J; Pochapsky TC; Asciutto EK, Hydroxylation Regiochemistry Is Robust to Active Site Mutations in Cytochrome P450cam (CYP101A1). Biochemistry 2022, 61 (17), 1790–1800. [DOI] [PMC free article] [PubMed] [Google Scholar]
- 11.Ki-Hwa K; Chang Woo L; Bikash D; Sun-Ha P; Hyun P; Tae-Jin O; *; Jun Hyuck L; *, Crystal Structure and Functional Characterization of a Cytochrome P450 (BaCYP106A2) from Bacillus sp. PAMC 23377. J. Microbiol. Biotechnol 2017, 27 (8), 1472–1482. [DOI] [PubMed] [Google Scholar]
- 12.Janocha S; Carius Y; Hutter M; Lancaster CRD; Bernhardt R, Crystal Structure of CYP106A2 in Substrate-Free and Substrate-Bound Form. ChemBioChem 2016, 17 (9), 852–860. [DOI] [PubMed] [Google Scholar]
- 13.Herz W; Blackstone RC; Nair MG, Resin acids. XI. Configuration and transformations of the levopimaric acid-p-benzoquinone adduct. The Journal of Organic Chemistry 1967, 32 (10), 2992–2998. [Google Scholar]
- 14.Asciutto EK; Dang M; Pochapsky SS; Madura JD; Pochapsky TC, Experimentally Restrained Molecular Dynamics Simulations for Characterizing the Open States of Cytochrome P450cam. Biochemistry 2011, 50 (10), 1664–1671. [DOI] [PMC free article] [PubMed] [Google Scholar]
- 15.Colthart AM; Tietz DR; Ni Y; Friedman JL; Dang M; Pochapsky TC, Detection of substrate-dependent conformational changes in the P450 fold by nuclear magnetic resonance. Sci Rep 2016, 6, 22035-22035. [DOI] [PMC free article] [PubMed] [Google Scholar]
- 16.Tietz DR; Podust LM; Sherman DH; Pochapsky TC, Solution Conformations and Dynamics of Substrate-Bound Cytochrome P450 MycG. Biochemistry 2017, 56 (21), 2701–2714. [DOI] [PMC free article] [PubMed] [Google Scholar]
- 17.Larson JR; Coon MJ; Porter TD, Alcohol-inducible cytochrome P-450IIE1 lacking the hydrophobic NH2-terminal segment retains catalytic activity and is membrane-bound when expressed in Escherichia coli*. Journal of Biological Chemistry 1991, 266 (12), 7321–7324. [PubMed] [Google Scholar]
- 18.Pervushin K; Riek R; Wider G; Wuthrich K, Attenuated T2 Relaxation by Mutual Cancellation of Dipole- Dipole Coupling and Chemical Shift Anisotropy Indicates an Avenue to NMR Structures of Very Large Biological Macromolecules in Solution. Proceedings of the National Academy of Sciences of the United States of America 1997, 94 (23), 12366–12371. [DOI] [PMC free article] [PubMed] [Google Scholar]
- 19.Goddard TD; Kneller DG SPARKY 3, University of California, San Francisco: 2008. [Google Scholar]
- 20.Skinner SP; Fogh RH; Boucher W; Ragan TJ; Mureddu LG; Vuister GW, CcpNmr AnalysisAssign: a flexible platform for integrated NMR analysis. Journal of Biomolecular NMR 2016, 66 (2), 111–124. [DOI] [PMC free article] [PubMed] [Google Scholar]
- 21.Philson SB; Debrunner PG; Schmidt PG; Gunsalus IC, The effect of cytochrome P-450cam on the NMR relaxation rate of water protons. Journal of Biological Chemistry 1979, 254 (20), 10173–10179. [PubMed] [Google Scholar]
- 22.Trott O; Olson AJ, AutoDock Vina: improving the speed and accuracy of docking with a new scoring function, efficient optimization, and multithreading. Journal of computational chemistry 2010, 31 (2), 455–461. [DOI] [PMC free article] [PubMed] [Google Scholar]
- 23.Lisurek M; Kang M-J; Hartmann RW; Bernhardt R, Identification of monohydroxy progesterones produced by CYP106A2 using comparative HPLC and electrospray ionisation collision-induced dissociation mass spectrometry. Biochemical and Biophysical Research Communications 2004, 319 (2), 677–682. [DOI] [PubMed] [Google Scholar]
- 24.Case DA; Darden TA; Cheatham III TE; Simmerling CL; Wang J; Duke RE; Luo R; Crowley M; Walker RC; Zhang W; Merz KM; Wang B; Hayik S; Roitberg A; Seabra G; Kolossváry I; Wong KF; Paesani FV, Wu X, Brozell SR, Steinbrecher T, Gohlke H, Yang L, Tan C, Mongan J, Hornak V, Cui G, Mathews DH, Seetin MG, Sagui C, Babin V, and Kollman AMBER PA 10, San Francisco, 2008. [Google Scholar]
- 25.Tietz DR; Colthart AM; Pochapsky SS; Pochapsky TC, Substrate recognition by two different P450s: Evidence for conserved roles in a common fold. Scientific Reports 2017, 7, 13581. [DOI] [PMC free article] [PubMed] [Google Scholar]
- 26.Skinner SP; Follmer AH; Ubbink M; Poulos TL; Houwing-Duistermaat JJ; Paci E, Partial Opening of Cytochrome P450cam (CYP101A1) Is Driven by Allostery and Putidaredoxin Binding. Biochemistry 2021, 60 (39), 2932–2942. [DOI] [PMC free article] [PubMed] [Google Scholar]
- 27.Li SY; Tietz DR; Rutaganira FU; Kells PM; Anzai Y; Kato F; Pochapsky TC; Sherman DH; Podust LM, Substrate recognition by the multifunctional cytochrome P450 MycG in mycinamicin hydroxylation and epoxidation reactions. Journal of Biological Chemistry 2012, 287 (45), 37880–37890. [DOI] [PMC free article] [PubMed] [Google Scholar]
- 28.Modi S; Sutcliffe MJ; Primrose WU; Lian L-Y; Roberts GCK, The catalytic mechanism of cytochrome P450 BM3 involves a 6 Å movement of the bound substrate on reduction. Nature Structural & Molecular Biology 1996, 3, 414–417. [DOI] [PubMed] [Google Scholar]
- 29.Dang M; Pochapsky SS; Pochapsky TC, Spring-loading the active site of cytochrome P450cam. Metallomics 2011, 3 (4), 339–343. [DOI] [PMC free article] [PubMed] [Google Scholar]
- 30.Estrada DF; Skinner AL; Laurence JS; Scott EE, Human Cytochrome P450 17A1 Conformational Selection. Journal of Biological Chemistry 2014, 289 (20), 14310–14320. [DOI] [PMC free article] [PubMed] [Google Scholar]
- 31.Sligar SG, Coupling of spin, substrate and redox equilibria in cytochrome P450. Biochemistry 1976, 15, 5399–5406. [DOI] [PubMed] [Google Scholar]
- 32.Karunakaran V; Denisov I; Sligar SG; Champion PM, Investigation of the Low Frequency Dynamics of Heme Proteins: Native and Mutant Cytochrome P450(cam) and Redox Partner Complexes. J. Phys. Chem. B 2011, 115 (18), 5665–5677. [DOI] [PMC free article] [PubMed] [Google Scholar]
- 33.Pochapsky TC; Wong N; Zhuang Y; Futcher J; Pandelia M-E; Teitz DR; Colthart AM, NADH reduction of nitroaromatics as a probe for residual ferric form high-spin in a cytochrome P450. Biochimica et Biophysica Acta (BBA) - Proteins and Proteomics 2017, 1866, 126–133. [DOI] [PMC free article] [PubMed] [Google Scholar]
- 34.Simgen B; Contzen J; Schwarzer R; Bernhardt R; Jung C, Substrate Binding to 15 Beta-Hydroxylase (CYP106A2) Probed by FT Infrared Spectroscopic Studies of the Iron Ligand CO Stretch Vibration. Biochemical and Biophysical Research Communications 2000, 269 (3), 737–742. [DOI] [PubMed] [Google Scholar]
- 35.Wong NR Structural and Dynamic Analyses of Cytochromes P450. Brandeis University, 2022. [Google Scholar]
Associated Data
This section collects any data citations, data availability statements, or supplementary materials included in this article.


