

Abstract
The TREM2-DAP12 receptor complex sustains microglia functions. Heterozygous hypofunctional TREM2 variants impair microglia, accelerating late-onset Alzheimer’s Disease. Homozygous inactivating variants of TREM2 or TYROBP-encoding DAP12 cause Nasu-Hakola disease (NHD), an early-onset dementia characterized by cerebral atrophy, myelin loss, and gliosis. Mechanisms underpinning NHD are unknown. Here, single-nucleus RNA-seq analysis of brain specimens from DAP12-deficient NHD individuals revealed a unique microglia signature indicating heightened RUNX1, STAT3 and TGFβ signaling pathways that mediate repair responses to injuries. This profile correlated with a wound-healing signature in astrocytes and impaired myelination in oligodendrocytes, while pericyte profiles indicated vascular abnormalities. Conversely, single-nuclei signatures in mice lacking DAP12 signaling reflected very mild microglial defects that did not recapitulate NHD. We envision that DAP12 signaling in microglia attenuates wound-healing pathways which, if left unchecked, interfere with microglial physiological functions causing pathology in human. The identification of a dysregulated NHD microglia signature sparks potential therapeutic strategies aimed at resetting microglia signaling pathways.
Introduction
TREM2 is a lipid sensing receptor expressed on multiple myeloid cells, including microglia in the central nervous system (CNS), osteoclasts in the bone, and macrophages in liver, adipose tissue and tumors1. It binds various phospholipids, apoptotic cells and lipidated molecules, such as LDL, HDL and lipidated ApoE1,2. TREM2 pairs with DAP12, a transmembrane adapter that instigates protein-tyrosine phosphorylation of multiple signaling mediators, which ultimately promote cell activation1. The TREM2-DAP12 pathway has recently gained much attention because heterozygous hypofunctional variants of TREM2 increase risk for developing Alzheimer’s disease (AD)3. Studies of AD patients and transgenic mice that mimic key features of AD have demonstrated that AD-associated TREM2 hypofunctional variants impair the ability of microglia to restrain β-amyloid (Aβ) pathology, thus facilitating spreading and neurotoxicity of Aβ plaques and ultimately accelerating the progression of AD4,5. A similar phenotype was observed in mouse models of AD lacking TREM21. Transcriptomic profiling studies in mouse, including single-cell RNA-sequencing (scRNA-seq) and single-nucleus RNA-sequencing (snRNA-seq), have further shown that Aβ pathology stimulates the differentiation of homeostatic microglia into disease-associated microglia (DAM), interferon-responsive (IFN-R) microglia, MHC-II-expressing microglia and proliferating microglia, and that TREM2 signaling is required to sustain this complex microglial response6.
Very rare homozygous loss-of-function mutations in either TREM2 or TYROBP (encoding DAP12) genes have also been reported, which cause an autosomal recessive disease, known as Nasu-Hakola disease (NHD)7. NHD consists of early-onset progressive frontal-type dementia and multiple bone cysts with recurring bone fractures. Homozygous loss-of-function mutations in TREM2 can also cause frontotemporal dementia with no bone pathology8. In contrast to AD, which manifests with aging, NHD progresses quickly. Patients present early symptoms during adolescence and die by their fifth decade. Neuropathological features include generalized cerebral atrophy, particularly in frontal areas, and sclerosing leukoencephalopathy characterized by loss of myelin, axonal spheroids in the white matter, gliosis and thickening of white matter microvessels9,10. Mice deficient in either DAP12 or TREM2 evince much milder pathology than that seen in human NHD: microglia and myelin are diminished in certain brain regions11–13, while neuronal synapse functions and behavior are slightly impaired14. However, many aspects of NHD pathology, such as sclerosing leukoencephalopathy, are not mirrored in mice. Unlike AD, cellular and molecular mechanisms underpinning NHD are poorly understood.
In this study, we defined a high-resolution transcriptional map of NHD brains at the single cell level by performing snRNA-seq analysis of post-mortem specimens from three rare NHD patients carrying homozygous mutations in the TYROBP gene and eleven ancestry-matched controls. Using the same approach, we defined the brain gene expression signatures of 2-year-old wild-type (WT) and DAP12 loss-of-function knock-in mice (KΔ75), which harbor a deletion in the cytoplasmic motif that disrupts signaling15. Analysis of snRNA-seq data showed that DAP12 was exclusively expressed in microglia and border-associated macrophages in both humans and mice; however, the impact of DAP12-deficiency markedly differed between the two. NHD brain specimens exhibited a unique microglia state reflecting activation of RUNX1, signal transducer and activator of transcription 3 (STAT3) and TGFβ; this signature was accompanied by gene signatures of astrocyte activation, pericyte and vascular alterations, and synapse loss. On the contrary, in brains of aged KΔ75 mice, microglia gene expression profiles revealed signs of reduced activation, metabolism and endocytosis, associated with signs of very mild functional deterioration in oligodendrocytes, astrocytes and neurons. The disparity between human and mouse transcriptome data, corroborated by the discrepancy between human and mouse pathology, indicates that the mouse model fails to recapitulate human disease. We envision that the NHD microglia signature reflects a maladaptive response of DAP12-deficient microglia to stimuli received from the brain microenvironment, which leads to exaggerated tissue repair reactions, widespread tissue alterations, astrocytosis, microvessel remodeling, and neuronal loss. The identification of a unique state of STAT3-imprinted microglia in NHD bears on potential therapeutic strategies aimed at modulating the JAK-STAT pathway.
Results
Single nucleus RNA-seq profiling of NHD brains
To gain insights into the pathogenesis of NHD, we examined specimens of brain occipital cortical tissues from three rare patients with NHD by snRNA-seq. The first and third NHD cases (NHD1 and NHD3) were caused by a homozygous single-base substitution in the start codon of TYROBP exon 1 (2T>C), which should abrogate or hinder translation initiation16. The second NHD case (NHD2) had a 1bp deletion (141Gdel) in exon 3 of TYROBP, which was shown to abrogate DAP12 expression10 (Supplementary Table 1). We performed snRNA-seq of the three NHD specimens, together with eleven ancestry-matched control specimens and corrected for batch effects using Harmony, which resulted in efficient integration of all the samples (Extended Data Fig. 1a and Supplementary Table 1). After quality control and doublet removal, 66,324 nuclei with a median of 6,943 UMIs and 3,150 genes per nucleus were retained (Extended Data Fig. 1b and Supplementary Table 1). We performed unsupervised clustering and identified the major cell types based on canonical cell markers: excitatory neurons (Ex_neuron), inhibitory neurons (In_neuron), oligodendrocytes (Oligo), astrocytes (Astro), microglia (Micro), oligodendrocyte precursor cells (OPCs), pericytes (Peri), smooth muscle cells (SMC), endothelial cells (Endo), fibroblasts (Fibro) and a cluster with immune cells (IMM), which may derive from blood contamination in the brain samples (Fig. 1a and Extended Data Fig. 1c). These major cell types were present in all samples (Extended Data Fig. 1d). Among all cell types, TYROBP was solely expressed in the microglia cluster, corroborating exclusive expression in myeloid lineage cells of the brain parenchyma (Fig. 1b). Astrocytes encompassed the most differentially expressed genes (DEGs) between NHD and controls, with more genes upregulated in NHD than downregulated, followed by oligodendrocytes and microglia (Fig. 1c). Similarly, more genes were upregulated than downregulated in vascular cells, including endothelial cells (Fig. 1c). These observations are consistent with astrogliosis, microgliosis and vascular abnormalities previously observed in brains of NHD patients9,10.
Fig. 1. NHD microglia show a unique signature.

a, UMAP plot of NHD and control patients. n=66,324 total nuclei; 11 control and 3 NHD individuals. Ex_neuron, excitatory neurons; In_neuron, inhibitory neurons; Oligo, oligodendrocytes; OPC, oligodendrocyte precursor cells; Astro, astrocytes; Micro, microglia; Endo, endothelial cells; Peri, pericytes; SMC, smooth muscle cells; Fibro, fibroblasts; IMM, immune cells. b, UMAP plot of TYROBP expression. c, Number of upregulated (up) and downregulated (down) DEGs (log2(fold change) > 0.5, FDR-adjusted P value < 0.05, two-part, generalized linear model) between NHD and controls in each cell type. d, UMAP plot of microglia and perivascular macrophages (PVMs) from NHD patients and controls. n=3,217 microglia nuclei and 463 PVM nuclei. e, UMAP plots of expression of feature genes in the microglia-PVM cluster. f, Scatter plot depicting genes differentially expressed (FDR-adjusted P < 0.05, two-part, generalized linear model) in NHD versus control within the microglia cluster. g, Box plots showing average of individual levels of expression for selected DEGs in the microglia cluster. Box center lines, bounds of box, and whiskers indicate median, first and third quartiles, and minima and maxima within 1.5X inter-quartile range (IQR), respectively. P values by two-sided Wilcoxon Rank Sum test. n=11 control and 3 NHD individuals. h, Violin plots showing gene set scores (by UCell) of DEGs derived from various neurodegenerative diseases in control and NHD microglia. AD, Alzheimer’s Disease (refs5,23); HAM, human AD microglia (ref24); VaD, vascular dementia (ref25); MIMS, microglia inflamed in MS (ref26). Gene sets used are listed in Supplementary Table 4. Box center lines, bounds of box, and whiskers indicate median, first and third quartiles, and minima and maxima within 1.5X IQR, respectively. P values by two-sided Wilcoxon Rank Sum test. n=2,124 control and 625 NHD microglia nuclei. i, Venn diagram of overlapping genes commonly upregulated in NHD microglia and two human AD datasets (left), and in NHD microglia as well as two MS-specific microglia subpopulations (right). j, IF staining of SPP1 (red) and IBA1 (green) in NHD and control occipital cortex. DAPI in blue. Scale bar, 10 μm. The experiment was repeated two times.
NHD microglia exhibit a unique signature
Sub-clustering of the Micro cluster identified microglia and perivascular macrophages (PVM) (Fig. 1d,e). Analysis of microglia genes differentially expressed in NHD and controls revealed increased expression of RUNX1 and STAT3 pathway genes in NHD microglia (Fig. 1f and Supplementary Table 3). RUNX1 is a regulator of hematopoiesis that controls proliferation of postnatal microglia in response to injury17. STAT3 related genes upregulated in NHD included: IL-4R; IL-21R; ITGAV, Fyn binding protein (FYB1) and LIMK2 that control cell adhesion and actin cytoskeleton18,19; protein tyrosine phosphatases (PTPN1 and PTPN2) that regulate STAT3 phosphorylation20; hepcidin antimicrobial peptide (HAMP), which controls iron metabolism21; and receptor tyrosine kinase-like orphan receptor 2 (ROR2), which acts as a co-receptor for WNT5A22. NHD microglia also upregulated expression of TGFβ pathway genes such as TGFBR1 and SMAD3 (Fig. 1f). Gene ontology enrichment of DEGs in NHD and control microglia corroborated terms related to IL6-JAK-STAT3 signaling, myeloid leukemia (linked to RUNX1) and regulation of interferon gamma response (linked to PTPN1and IL4R; Extended Data Fig. 2a). The majority of the top DEGs were consistently upregulated among the three NHD patients (Fig. 1g). However, we also noted some variability among the three NHD patients, which may in part reflect differential impacts of the distinct TYROBP mutations and/or individual variations. To rule out confounding factors that may drive the differences, we plotted individual-wise average expression of top DEGs against age and sex of the individuals and found that upregulation of the DEGs was independent of age or sex (Extended Data Fig. 2b,c). Overall, these results indicated that NHD microglia exhibit a unique injury-responsive profile driven by RUNX1, STAT3 and TGFβ signaling.
To find similarities among microglia profiles in human neurodegeneration and neuroinflammation, we compared the NHD microglia signature with those reported in AD5,23,24, vascular dementia (VaD)25 and multiple sclerosis (MS)26, using geneset score analysis by UCell. Little similarity was observed between NHD and other diseases (Fig. 1h and Supplementary Table 4). Only two genes, namely SPP1 and BMP2K, were upregulated in both NHD and AD from ref23 (Fig. 1i). Eight genes, including SPP1, were upregulated in both NHD and foamy microglia found in the active lesion of MS26 (Fig. 1i). Immunofluorescence (IF) staining for SPP1 in occipital cortex sections from NHD patients corroborated marked expression in rare, localized foci (Fig. 1j). We conclude that NHD microglia signature has limited overlap with microglia signatures in other neurodegenerative diseases.
Signatures of NHD microglia and IL-10 macrophages overlap
Since DEGs augmented in NHD microglia were enriched in genes related to tissue repair pathways, we compared the NHD microglia signature with signatures of cytokine polarized macrophages, which play roles in inflammation or resolution of inflammation and tissue repair, depending on the stimulation27. LPS and IFN-γ elicit polarization through NF-κB and STAT1 signaling; IL-4 and IL-13 induce polarization through STAT6 signaling; IL-10 induces STAT3 signaling27. We re-analyzed a publicly available scRNA-seq dataset of human monocyte-derived macrophages polarized to these three states (GSE199378). Clustering analysis of this dataset validated that macrophages stimulated by respective cytokines are distinguished by unique signatures (Fig. 2a,b and Extended Data Fig. 3a–e). We selected the top 100 DEGs in each treatment cluster and calculated the macrophage polarization score in NHD microglia by UCell (Fig. 2c). The IL-10-induced macrophage signature score was enriched in human microglia and was significantly higher in NHD than control microglia (Fig. 2c). To corroborate this result, we extracted the DEGs upregulated in NHD microglia compared to controls and performed gene set enrichment (GSEA) analysis on a microarray dataset of human monocyte-derived macrophages polarized to the three states (GSE61298)28. The NHD microglia signature enrichment score was indeed highest in the IL-10 stimulation group, lower in the LPS plus IFN-γ stimulation group, and minimal in the IL-4 and IL-13 treatment group (Extended Data Fig. 3f–h). Immunohistochemistry (IHC) analysis for CD163, a marker upregulated in IL-10-induced macrophages27, corroborated a trend of increased CD163 expression in NHD compared to controls (Fig. 2d,e). To validate that a DAP12 signaling defect can enhance the STAT3 pathway, we evaluated STAT3 signaling in bone marrow-derived macrophages from WT mice and KΔ75 mice that lack DAP12 signaling. Macrophages were examined after CSF1 starvation to mimic a stress-inducing environment. STAT3 phosphorylation and total STAT3 were assessed by flow cytometry at baseline and after stimulation with IL-10, which induces STAT3 signaling. KΔ75 macrophages exhibited significantly more phosphorylated STAT3 and total STAT3 than did WT macrophages (Extended Data Fig. 3i–m), corroborating that DAP12 deficiency augments STAT3 pathway in stressed macrophages.
Fig. 2. NHD microglia signature in part overlaps with IL-10-primed macrophage signature.

a, UMAP plot of human monocyte-derived macrophages stimulated with cocktails of LPS+IFNγ, IL4+IL13, or IL10 from GSE199378. b, Dot plot showing top 10 marker genes for each stimulation in a. c, Violin plot showing gene set scores (by UCell) of LPS+IFNγ, IL4+IL13 or IL10 induced macrophage signatures in microglia from NHD patients and controls. Box center lines, bounds of box, and whiskers indicate median, first and third quartiles, and minima and maxima within 1.5X IQR, respectively. P value by two-sided Wilcoxon Rank Sum test. Box plots embedded show the first and third quartiles and median. n=2,124 control and 625 NHD microglia nuclei. d, Representative images of IHC staining of CD163 in NHD and control brains. Scale bar, 100μm. e, Quantification of percentage of CD163+ area in d. P value by two-tailed unpaired t test. Data are presented as mean ± s.e.m. n=3 control and 3 NHD samples. f, Heatmap depicting Pearson correlation of top 20 ligands driving NHD microglia signature predicted by NicheNet. g, Circos plot showing ligand target interactions predicted by NicheNet. The top half circle in orange represents targets expressed by microglia. The bottom half shows predicted ligands expressed in cells as color coded in the legend. h, Violin plots showing FGF2 expression in various cell types from NHD patients and controls. P value by two-sided Wilcoxon Rank Sum test. Dot represents mean ± s.d. A full list of P values and number of nuclei is provided in Supplementary Table 2.
To further investigate regulators that may drive the transcriptional profile of NHD microglia, we performed NicheNet analysis, which predicted fibroblast growth factor 2 (FGF2) as the top ligand driving upregulation of DEGs in NHD microglia (Fig. 2f,g). FGF2 was mainly expressed in astrocytes and upregulated in NHD (Fig. 2h). FGF2 can signal through STAT3 and has been shown to regulate microglia reactivity and phagocytic activity29. We conclude that the unique NHD microglia signature partly overlaps with IL-10-primed macrophage signature and may represent a dysregulated response to signals released by other brain cells, such as FGF2 from astrocytes.
NHD pericyte signature indicates vascular abnormalities
Re-clustering of brain vascular cells yielded identification of endothelial cells (Endo), pericytes (Peri), smooth muscle cells (SMC), and two subtypes of fibroblasts, meningeal fibroblasts (M. FB) and perivascular fibroblasts (P. FB)30 (Fig. 3a,b). Pericytes and endothelial cells bore the highest number of DEGs in NHD versus controls (Fig. 3c and Supplementary Table 3). Pericytes wrap around the vessel wall, secrete extracellular matrix (ECM) proteins, including collagens, and regulate blood vessel permeability, contraction, and vascular tube remodeling. Interestingly, NHD pericytes expressed more transcripts for phosphodiesterases (PDE7B, PDE10A, PDE4D) than did controls (Fig. 3d–f). PDEs catalyze the breakdown of cAMP, a mediator of pericyte relaxation31, while PDE inhibitors induce smooth muscle relaxation and vasodilation32; thus, increased PDE activity in NHD pericytes may indicate contracted and dysfunctional vasculature. Moreover, NHD pericytes upregulated genes linked to ECM more so than did controls, including type IV collagen (COL4A2) and proteases degrading ECM proteins (ADAMTS4 and ADAMTS9) (Fig. 3d–f). Supporting these observations, Elastica-Goldner staining of brain cortical samples showed altered vascular basement membrane matrix deposition in NHD patients (Fig. 3g), which was consistent with thickening of vessel walls reported in NHD9.
Fig. 3. NHD pericyte signature indicates vascular abnormalities.

a, UMAP plot of vascular cell sub-clustering. Endo, endothelial cells. Peri, pericytes. SMC, smooth muscle cells. M.FB, meningeal fibroblasts. P.FB, perivascular fibroblasts. n=730 Endo, 287 Peri, 187 SMC, 225 M.FB and 193 P.MB nuclei. b, Dot plot showing expression of marker genes for each subcluster. c, Number of upregulated (up) and downregulated (down) DEGs (log2(fold change) > 0.5, FDR-adjusted P value < 0.05, two-part, generalized linear model) in each sub-cluster in NHD versus controls. d, Volcano plot depicting DEGs (log2(fold change) > 0.25, FDR-adjusted P value < 0.05, two-part, generalized linear model) in pericytes between NHD and controls. e, Box plots showing average of individual levels of expression for selected DEGs in the pericyte cluster. Box center lines, bounds of box, and whiskers indicate median, first and third quartiles, and minima and maxima within 1.5X IQR, respectively. P value by two-sided Wilcoxon Rank Sum test. f, Pathways enriched in genes upregulated in NHD pericytes. P values calculated based on the cumulative hypergeometric distribution. g, Elastica-Goldner staining of blood vessels in NHD and control brain sections. Scale bar, 50μm. The experiment was repeated twice.
The endothelial cell cluster of NHD samples evinced a marked signature of upregulated genes that was absent in controls (Extended Data Fig. 4a and Supplementary Table 3). This signature included the IFN-induced gene DDX60L, as well as other genes with poorly understood function, such as ZCCHC2, MCTP1 and DEPP1 (Extended Data Fig. 4b, c). Additional DEGs corroborated the exposure of endothelial cells to IFN, reactive oxygen species, and hypoxia, such as PARP14, a member of the Poly (ADP-ribose) polymerase (PARP) family33, the chemokines CXCL10 and CXCL11, and guanylate binding proteins GBP2 and GBP4 (Extended Data Fig. 4b). However, these IFN- and hypoxia-responsive genes were evident in two of the three NHD cases; thus, further investigation is needed to see whether this signature is common in NHD.
NHD astrocyte signatures reflect a wound healing response
Genes indicative of astrocyte responses to tissue injury, remodeling and wound healing, including Coagulation factor III (F3), Tenascin (TNC), CD44, Neuropilin 1 (NRP1), and FGF234–36, were upregulated in NHD astrocytes (Fig. 4a,b and Supplementary Table 3). The top DEGs consistent among the three NHD patients are shown in Fig. 4c. Protein-protein interactions predicted by STRING analysis confirmed networks of tissue repair factors involving FGF2, F3, NRP1, and fibronectin (FN1) and further suggested the interactions of molecules mediating reactive astrocytosis, including Oncostatin M receptor (OSMR)37, SOCS3, CD44, as well as the transcriptional repressor BCL638 (Fig. 4d). Comparison of the NHD astrocyte signature with those of other neurodegenerative and neuroinflammatory diseases revealed common upregulation of GFAP in NHD, AD and MS (Extended Data Fig. 5a,b and Supplementary Table 4). IHC corroborated more abundant level of GFAP in NHD versus control astrocytes, validating the extensive astrocytosis reported in NHD39 (Fig. 4e,f).
Fig. 4. NHD astrocyte signatures reflect a wound healing response.

a, Volcano plot showing DEGs (log2(Fold Change) > 0.25, FDR-adjusted P value < 0.05, two-part, generalized linear model) in NHD versus controls within the astrocyte cluster. Red designates genes involved in response to wounding. b, Pathways enriched in genes upregulated (log2(Fold Change) > 0.5, FDR-adjusted P value < 0.05, two-part, generalized linear model) in NHD astrocytes. q values calculated by FDR. c, Box plots showing average of individual levels of expression for selected DEGs in astrocytes. Box center lines, bounds of box, and whiskers indicate median, first and third quartiles, and minima and maxima within 1.5X IQR, respectively. P value by two-sided Wilcoxon Rank Sum test. n=11 control and 3 NHD individuals. d, Protein-protein interaction network of top 100 upregulated genes in NHD astrocytes. Node color represents pathways. Node size reflects degree of interaction. e, Representative images of IHC staining of GFAP in NHD and control brains. Scale bar, 100μm. f, Quantification of percentage of GFAP+ area in e. Data are presented as mean ± s.e.m. P value by two-tailed unpaired t test. n=3 control and 3 NHD samples. g, UMAP plot of NHD and control oligodendrocyte lineage cells. Oligo, oligodendrocytes. OPC, oligodendrocyte precursor cells. n=13,694 Oligo, 1,885 OPC and 71 transition nuclei. h, Heatmap showing average gene expression of top downregulated oligodendrocyte genes in NHD versus controls. Color scale represents row z-score. i, Box plots showing average of individual levels of expression for selected oligodendrocyte genes downregulated in NHD. Box center lines, bounds of box, and whiskers indicate median, first and third quartiles, and minima and maxima within 1.5X IQR, respectively. P value by two-sided Wilcoxon Rank Sum test. n=11 control and 3 NHD individuals. j, Representative images of IHC staining of MBP in NHD and control brains. Scale bar, 100μm. k, Quantification of percentage of MBP+ area in j. Data are presented as mean ± s.e.m. P value by two-tailed unpaired t test. n=3 control and 3 NHD samples.
Sub-clustering of the oligodendrocyte lineage cells yielded clusters of oligodendrocytes, oligodendrocyte precursor cells (OPCs), and a transitional cluster (Fig. 4g and Extended Data Fig. 5c). Differential expression analysis revealed reduced expression of genes associated with myelin components in all three NHD patients compared to controls, including myelin basic protein (MBP) and Anilin (ANLN)40 (Fig. 4h,I and Extended Data Fig. 5d). We validated massive demyelination by IHC staining for MBP, which was consistent with a previous report9 (Fig. 4j,k). Genes upregulated in NHD oligodendrocytes encoded ion channels (KCNH8 and CLIC4), GPCRs (ADGRB3), and histone modifiers (KDM6A) that are essential for oligodendrocyte maturation and CNS myelination (Extended Data Fig. 5d,e). Additionally, upregulation of the cholesterol biosynthesis pathway was noted in one NHD case (Extended Data Fig. 5f,g). Comparison of genes up- and down-regulated in NHD with those in MS41 exposed a modest overlap in upregulated genes (Extended Data Fig. 5h,I and Supplementary Table 4), which may reflect a compensatory activation of residual oligodendrocytes in response to demyelination.
NHD neurons present signatures of diminished activity
Sub-clustering of the neuronal nuclei yielded 5 subclusters of excitatory neurons and 6 subclusters of inhibitory neurons with no obvious nuclei distribution changes between NHD and controls (Extended Data Fig. 6a,b). More genes were downregulated than upregulated in NHD neurons in comparison to controls, suggesting less neuronal activity (Extended Data Fig. 6c). The top pathway enriched in genes downregulated in both excitatory and inhibitory neurons in NHD pointed to peptide chain elongation (Extended Data Fig. 6d,e). This was further reflected by significantly curtailed expression of ribosomal genes in all NHD neuronal subclusters (Extended Data Fig. 6f). In addition, genes involved in pathways related to synaptic transmission, such as synaptic vesicle endocytosis and transmission across chemical synapses, were expressed at low levels in NHD neurons. (Extended Data Fig. 6d,e). Mitigated ribosomal and synaptic activities in NHD may reflect reduced neuronal activity and/or neuronal loss. A heatmap of average gene expression validated downregulation of genes involved in synaptic activity, such as SYP (synaptophysin) and NSG2 (neuronal vesicle trafficking associated 2), in NHD (Extended Data Fig. 6g).
SnRNA-seq of brains of aged mice lacking DAP12 signaling
To examine if we could gain further insights into the pathogenesis of NHD from mouse models, we performed snRNA-seq on cortical samples from DAP12 signaling deficient KΔ75 mice15. We chose to analyze mice at two years of age, as previous analyses of TREM2-deficient models of NHD at younger ages showed very limited transcriptional and pathological changes5,13. snRNA-seq of four KΔ75 and four WT mice yielded 60,851 nuclei after quality control, which were partitioned in 35 clusters that were projected by uniform manifold approximation and projection (UMAP) (Extended Data Fig. 7a,b). Major cell types were manually identified based on cluster markers and previous studies42 (Fig. 5a and Extended Data Fig. 7c). These included: excitatory neurons (Ex_neuron; Slc17a7), inhibitory neurons (In_neuron; Gad1, Gad2), oligodendrocytes (Oligo; Plp1, Cldn11), astrocytes (Astro; Gja1, Aqp4), microglia (Micro; Csf1r, C1qa), oligodendrocyte precursor cells (OPCs; Pdgfra, Vcan), leptomeningeal cells (VLMC; Dcn, Slc6a13), arachnoid barrier cells (ABC; Mgp, Slc47a1), endothelial cells (Endo; Flt1, Cldn5), and pericytes (PC; Vtn, Rgs5). We corroborated the expression of Tyrobp in the microglia cluster (Fig. 5b). Cell type abundance was comparable between WT and KΔ75 mice (Fig. 5c and Extended Data Fig. 7d,e and Supplementary Table 5), suggesting that a primary defect of DAP12 in microglia does not markedly impact the number of glial cells in mice.
Fig. 5. Microglia profile of aged KΔ75 mice is distinct from that of NHD.

a, UMAP plot of cortical samples from 2-year-old KΔ75 and WT mice. n=60,851 nuclei; 4 animals per genotype. Ex_neuron, excitatory neurons; In_neuron, inhibitory neurons; Oligo, oligodendrocytes; Astro, astrocytes; Micro, microglia; OPC, oligodendrocyte precursor cells; VLMC, vascular leptomeningeal cells; ABC, arachnoid barrier cells; Endo, endothelial cells; PC, pericytes. b, UMAP plot showing expression of Tyrobp in microglia cluster. c, Scatter plot depicting differential cell type abundance calculated by MASC56. Data are represented as the MASC odds ratio (OR) of a nucleus being in that cluster for WT versus KΔ75 (with 95% confidence interval (CI)), against the −log(P value) of the association. Center of bar corresponds to OR. No cluster was significant, with FDR-adjusted P value > 0.05 using Benjamini-Hochberg correction. A full list of P values and number of nuclei is provided in Supplementary Table 5. d, UMAP plot of sub-clustered myeloid population (Micro cluster in Fig. 5a). HM, homeostatic microglia; AM, age-associated microglia; IFN-R, interferon responsive microglia; MHCIIhi-BAM, MHCII-high-expressing border-associated macrophages (BAM); MHCIIlo-BAM, MHCII-low-expressing BAM. n=2,179 myeloid nuclei; 4 animals per genotype. e, Dot plot showing marker genes for each myeloid subcluster. f, Venn diagram comparing genes upregulated in AM and DAM43. Genes upregulated by both DAM and AM are shown in the box; the top 5 genes unique for each cluster are shown on the sides. g, Venn diagram comparing genes upregulated in AM and WAM (white matter-associated microglia)44; genes upregulated by both WAM and AM are shown in the box. h, UMAP plot of myeloid subclusters in WT and KΔ75 mice. n=1,011 WT myeloid nuclei; 1,168 KΔ75 myeloid nuclei. i, Donut plots showing nuclei contribution from each sample to AM and IFN-R subclusters. Numbers represent the percentage of nuclei contributed by either WT or KΔ75 within each subcluster. j, IF staining of CD11c (red) and IBA1 (green) in corpus callosum of WT and KΔ75 mice. DAPI in blue. Scale bar, 20 μm. k, Quantification of CD11c+IBA1+ volume as a percentage of total IBA1+ volume in j. Data are presented as mean ± s.e.m. P value by two-tailed unpaired t test. n=4 WT and 3 KΔ75 mice.
Microglia profile of aged KΔ75 mice is distinct from NHD
Sub-clustering of myeloid lineage cells in aged mice led to identification of a major cluster of homeostatic microglia (HM) and four small clusters, which included age-associated microglia (AM), interferon-responsive microglia (IFN-R), as well as MHCII-high and MHCII-low border associated macrophages (MHCIIhi-BAM and MHCIIlo-BAM) (Fig. 5d,e). All of these clusters expressed Tyrobp (Extended Data Fig. 8a). The AM cluster signature partially overlapped with microglia signatures observed in models of Aβ pathology43 and white matter aging44 (Fig. 5f,g), with heightened expression of genes controlling lipid metabolism (Lpl, Apoe), lysosomal activation (Cstb, Cstz) as well as other marker genes such as Itgax (CD11c)6. The IFN-R cluster resembled those previously reported in various conditions6,45 (Extended Data Fig. 8b). The AM cluster was markedly reduced and the IFN-R cluster was slightly diminished in the KΔ75 mice (Fig. 5h and Extended Data Fig. 8c). Similarly, the AM cluster was mostly contributed by WT samples, while the other clusters were composed of WT and KΔ75 samples almost equally. (Fig. 5i and Extended Data Fig. 8d). IF of brain sections validated that fewer KΔ75 than WT microglia expressed CD11c, a marker of activation (Fig. 5j,k). Thus, the development of AM microglia in aged mice is partially dependent on DAP12 signaling.
To further characterize the molecular impact of DAP12 dysfunction on microglia in aged mice, we examined DEGs between KΔ75 and WT in the HM cluster, which was the most abundant (Supplementary Table 6). Genes differentially expressed in KΔ75 versus WT homeostatic microglia were mainly downregulated (Extended Data Fig. 8e), indicating reduced reactivity of microglia deficient in DAP12 signaling. The most significantly downregulated genes included those controlling lysosome functions, like Hexb, and those controlling lipid metabolism, such as Mylip, Abca1, Lpcat2, and Zfp69 (Extended Data Fig. 8e,f). Mylip and Abca1 are target genes of the transcription factor LXR, critical for regulation of lipid homeostasis. MYLIP is an E3-ubiquitin ligase that modulates LDLR expression and cholesterol uptake. ABCA1 mediates cholesterol efflux and lipidation of ApoE, which controls lipid accumulation in microglia. LPCAT2 (lysophosphatidylcholine acyltransferase 2) localizes to lipid droplets, participates in phosphatidylcholine synthesis, and is diminished in microglia from mice with AD-like pathology5. Lastly, ZFP69 is a transcription factor that regulates body fat storage and is involved in diabetes46. Pathway analysis of downregulated genes further highlighted reduced expression of genes controlling endocytosis and lysosomal function in KΔ75 versus WT microglia (Extended Data Fig. 8g). We conclude that lack of DAP12 signaling reduces the number of age-associated microglia, and modestly impairs lipid metabolism and endolysosomal functions in homeostatic microglia. Overall, this profile is quite distinct from that of NHD.
KΔ75 brains show mild oligodendrocyte and astrocyte defects
To investigate whether dysfunctional microglia in KΔ75 mice has secondary ramifications on myelination, we extracted oligodendrocyte lineage cells from the snRNA-seq data and sub-clustered them into OPCs, differentiation-committed oligodendrocyte precursors (COPs), myelin-forming oligodendrocytes (MFOLs), mature oligodendrocytes (MOLs), and reactive oligodendrocytes (ROLs), based on cluster markers and previous classification5,47 (Fig. 6a,b and Extended Data Fig. 9a,b). We noted several genes in MFOL were downregulated in KΔ75 versus WT mice, which were mainly involved in myelination (Fig. 6c,d and Supplementary Table 6). These included Ugt8a and Pllp (Plasmolipin)48, which contribute to the synthesis of lipid and protein myelin components; Npc149 and Cldn11, which support formation and maintenance of myelin. The number of ROLs, which are characterized by expression of Serpina3n and C4b5, was dramatically reduced in KΔ75 versus WT mice (Fig. 6e); moreover, ROL-defining genes were less abundantly expressed in KΔ75 than WT oligodendrocytes (Extended Data Fig. 9c). We also observed that the signature of recently reported disease-associated oligodendrocytes (DOL)50, whose signature largely overlaps with the ROL signature, was reduced in KΔ75 mice (Extended Data Fig. 9d,e). IF of corpus callosum corroborated reduced expression of Serpina3n, a marker for ROLs, in Olig2+ oligodendrocytes in KΔ75 mice (Fig. 6f,g). Despite the transcriptomic data, we did not detect obvious demyelination by IF of MBP staining in the corpus callosum (Extended Data Fig. 9f,g). Thus, deficiency of DAP12 signaling in microglia has very limited consequences on myelination, ranging from undetectable (this study) to mild hypomyelination observed in previous studies11,12.
Fig. 6. KΔ75 mice exhibit mild oligodendrocyte and astrocyte defects.

a, UMAP plot of sub-clustered oligodendrocyte lineage cells (Oligo and OPC populations in Fig. 5a). n=10,607 Oligo nuclei and 1,688 OPC nuclei. COP, differentiation-committed oligodendrocyte precursors; MFOL, myelin-forming oligodendrocytes; MOL, mature oligodendrocytes; ROL, reactive oligodendrocytes. b, Dot plot showing marker genes for each subcluster in the oligodendrocyte lineage. c, Scatter plot showing average expression against fold change of DEGs (log2(fold change) > 0.5, adjusted P value < 0.05, two-sided Wilcoxon Rank Sum test, Bonferroni correction) in KΔ75 versus WT within the MFOL cluster. d, Pathways enriched in genes downregulated in MFOL in KΔ75 versus WT. q-values calculated based on Banjamini-Hochberg. e, Donut plot showing nuclei contribution from each sample in the ROL cluster. Numbers represent the percentage of nuclei from either KΔ75 or WT. f, IF staining of Serpina3n (red) and Olig2 (green) in corpus callosum of WT and KΔ75 mice. DAPI in blue. Scale bar, 10 μm. g, Quantification of number of Serpina3n+Olig2+ cells as a percentage of Olig2+ cells in f. Data are presented as mean +/− SEM. P value by two-tailed unpaired t test. n=4 WT and 3 KΔ75 mice. h, UMAP plot of sub-clustered astrocytes (Astro cluster in Fig. 5a). n=3,258 Astro nuclei. i, Dot plot showing expression of marker genes for each astrocyte subcluster. j, Scatter plot depicting differential cell type abundance calculated by MASC56. Data are represented as the MASC OR of a nucleus being in that cluster for WT versus KΔ75 (with 95% CI), against the −log(P value) of the association. Center of bar corresponds to OR. Red labeled clusters were significant with FDR-adjusted P value < 0.05 using Benjamini-Hochberg correction. A full list of P values and number of nuclei is provided in Supplementary Table 5. k, Violin plots showing expression of reactive astrocyte marker genes in KΔ75 and WT. n=1,356 WT astrocytes and 1,902 KΔ75 astrocytes. P value by two-sided Wilcoxon Rank Sum test. l, IF staining of GFAP (green) in corpus callosum of WT and KΔ75 mice. DAPI in blue. Scale bar, 10 μm. m, Quantification of percentage of GFAP+ volume in l. Data are presented as mean ± s.e.m. P value by two-tailed unpaired t test. n=4 WT and 3 KΔ75 mice.
Astrocytes encompassed 10 major distinct subclusters identified after sub-clustering (Fig. 6h). Broadly, clusters 0–7 were regarded as homeostatic astrocytes, while cluster 8 encompassed reactive astrocytes with high Gfap and Vim expression (Fig. 6i and Extended Data Fig. 9h,i). Pathways enriched in cluster 8 included gliogenesis and cell junction organization (Extended Data Fig. 9j). Cluster 9 was enriched for IFN-responsive genes (Fig. 6i), while cluster 10 only contained a few nuclei and was omitted for further analysis. By comparing subcluster composition between the two genotypes, we found that the reactive astrocyte cluster 8 was significantly diminished in KΔ75 brains (Fig. 6j). Accordingly, reactive genes such as Gfap, C4b, Apoe and Cd9 were less abundantly expressed in KΔ75 than in WT astrocytes (Fig. 6k). Reduced GFAP expression in KΔ75 astrocytes was validated by IF staining (Fig. 6l,m). We also noted that cluster 7 was more well represented in KΔ75 than in WT astrocytes (Fig. 6j), which is distinguished by Crym (Extended Data Fig. 9k); yet the functions of this cluster remain unknown. We conclude that microglia defects in KΔ75 mice have limited ramifications on the differentiation and/or functions of astrocytes, unlike astrocytosis observed in NHD.
Transcriptional profiles of KΔ75 and WT neurons are similar
To investigate the effects of impaired microglia activation on neurons, we sub-clustered broadly neuronal nuclei into excitatory and inhibitory neurons (Extended Data Fig. 10a–c). Differential expression analysis of the two main neuronal subtypes yielded virtually no transcriptional differences between KΔ75 and WT neurons (Extended Data Fig. 10d and Supplementary Table 6). This result is consistent with previous reports showing no gross behavioral abnormalities11. Although aberrant sensorimotor gating in Tyrobp−/− mice has been reported11,14, this may not be reflected in detectable transcriptional changes.
Discussion
The impact of TREM2-DAP12 signaling in microglia functions has recently captured considerable attention because of its genetic link with AD. Heterozygous hypomorphic variants of TREM2 cause a subtle defect in microglial response to Aβ pathology that, over a lifetime, accelerates AD progression4,5. On the other hand, homozygous inactivating mutations of TREM2 or DAP12 cause an early-onset dementia, NHD9, which emerges during adolescence and leads to death by the fifth decade. NHD neuropathology lesions include leukoencephalopathy characterized by loss of myelin and intense astrogliosis in the white matter, rather than Aβ plaques and neurofibrillary tangles typical of AD. The first snRNA-seq analysis of NHD brain specimens presented here demonstrates that a complete defect in DAP12 signaling is associated with a unique transcriptome profile of microglia indicative of enhanced RUNX1, STAT3 and TGFβ signaling pathways that mediate tissue repair functions. This microglia profile is associated with astrocyte signatures of wound healing responses and oligodendrocyte signatures of reduced myelination, while pericytes adopt profiles indicative of dysregulated ECM deposition.
Why does total lack of DAP12 function lead to such unique molecular profiles in microglia and consequent brain pathology? Our data clearly show that DAP12 is expressed in microglia and PVMs. We envision that in these cells, DAP12 signaling may modulate RUNX1, STAT3 and TGFβ pathways elicited by soluble factors secreted by other brain cells, for instance, astrocyte-secreted FGF2 and IL-6 family cytokines such as oncostatin M, LIF, and IL-6, or IL-10. In a preliminary validation of this model, stressed bone marrow derived KΔ75 macrophages elicited more STAT3 and underwent more STAT3 activation upon stimulation with IL-10 than did WT counterparts. While DAP12 was previously reported to attenuate TLRs signaling by interfering with their ability to activate the MAPK pathway51, future studies will be required to understand how DAP12 can attenuate the RUNX1, STAT3 or TGFβ pathways. Unrestricted signaling of these pathways may dysregulate the ability of microglia to phagocytose apoptotic cells and myelin debris, enhance pro-fibrotic functions, ultimately resulting in neuronal loss, demyelination and compensatory astrogliosis (Extended Data Fig. 10e). DAP12 serves as an adaptor protein for multiple receptors in addition to TREM252; TREM2 signals through both DAP12 and DAP1053. Thus, the transcriptomic profiles in DAP12-deficient cells and tissues likely differ from those of TREM2-deficient cells and tissues. Nevertheless, as homozygous loss-of-function mutations in both DAP12 and TREM2 lead to NHD, we envision that major transcriptomic changes documented in the absence of DAP12 would also be present in or relevant to individuals with complete loss of TREM2 function. In contrast to total TREM2-DAP12 deficiency, a more subtle defect of TREM2-DAP12 signaling in individuals carrying TREM2 heterozygous variants associated with AD may cause modest microglia dysfunction that facilitates plaque accumulation over an extended period of time in AD susceptible individuals.
In addition to glial changes, we also observed notable changes in pericytes that line the blood vessels. These cells exhibited signatures indicating dysregulated secretion of ECM components and contractility, consistent with the narrowing of capillary lumens and thickening of microvessel walls in NHD brains observed in this study and previous reports9. Given that DAP12 is expressed not only in microglia but also in PVMs that have been implicated in vascular remodeling54, the observed vascular abnormalities may reflect functional impairment of DAP12-deficient PVMs (Extended Data Fig. 10e). Dysfunctional vasculature in the white matter and consequential demyelination can amplify tissue damage and reactive glial responses.
Our study highlights a remarkable difference in the phenotype of DAP12-deficiency in humans and mice. The snRNA-seq profile of KΔ75 mice detected fewer age-associated microglia, which was validated by IF, together with modest signs of impaired functions of astrocytes and oligodendrocytes. Consistent with limited transcriptomic alterations, previous imaging studies reported very mild hypomyelination and rarer neuronal synapses in DAP12-deficient mice11,12,14, which were not detectable in our study. Altogether, mild microglia defects in KD75 mice were insufficient to drive demyelination, astrocytosis or cognitive impairment, in contrast to NHD. The mild defects seen in mice lacking DAP12 signaling may reflect a compensation by other signaling pathways, such as those mediated by FcRγ, which may be effective in mice but not humans. Cumulatively, the DAP12-deficient mice appear inadequate to recapitulate human NHD. Reiterating the inconsistency of DAP12-deficient phenotypes between human and mouse models, DAP12-deficiency was shown to attenuate learning behavior deficits associated with amyloid accumulation rather than aggravating them55. Perhaps, challenge of DAP12-deficient mice with certain insults may be necessary to recapitulate human pathology, as suggested by previous studies in the context of demyelination13.
NHD microglia transcriptional profile showed some overlap with macrophages generated in vitro by exposure to IL-10, a cytokine that elicits STAT3 signaling, or TGFβ. This observation may have bearing on therapeutic intervention. Specifically, if dysregulated STAT3 activation is confirmed in functional studies, NHD patients may benefit from inhibitors of the JAK/STAT pathway to re-equilibrate microglial signaling pathways and delay disease progression.
Online Methods
Mice
WT mice (C57BL/6 J) were purchased from Jackson Laboratory. KΔ75 mice (C57BL/6 J) were generated as previously described15 and a gift from Wayne M. Yokoyama (Washington University in St. Louis). All mice were bred and housed in specific-pathogen-free conditions. The Institutional Animal Care and Use Committee at Washington University in St. Louis approved all protocols used in this study. Mice were housed under a 12-hour light/dark cycle at temperature 20–26°C and humidity 30–70% with sufficient ventilation. KΔ75 mice were co-housed with WT controls. Four male WT and four male KΔ75 mice at two years of age were used for snRNA-seq. All mice used for validation experiments were male. Investigators were not blinded to experimental groups, but all samples and data were processed in a high-throughput or automated fashion.
Human samples
Postmortem human brain samples were obtained from the Brain Research Institute (BRI) at Niigata University and Mihara Memorial Hospital (Isesaki, Japan). Postmortem frozen occipital cortical tissues from three NHD patients and eleven controls were analyzed by snRNA-seq. Both sexes were included for both groups. Characteristics of donors of the human tissues at the time of collection are provided in Supplementary Table 1. Pre-mortem consent was obtained from each subject, with approval from the institutional review board (IRB) of the institutions. All samples were approved by an IRB of Washington University in St. Louis and determined as not Human Subject Research (HSR) under the IRB ID #201808019. Because the project evaluates post-mortem brain tissues, this activity is not considered to meet federal definitions under the jurisdiction of an IRB and therefore falls outside the purview of the Human Research Protection Office (HRPO).
Isolation of nuclei from frozen brain tissue
Flash frozen brain tissue was homogenized in a Dounce homogenizer in Lysis Buffer (10 mM Tris-HCl, pH 7.4, 10 mM NaCl, 3 mM MgCl2, and 0.025% NP-40), and incubated on ice for 15 min. The suspension was filtered through a 30-μm filter to remove debris and pelleted at 500g for 5 min at 4 °C. Nuclei were washed and filtered twice with Nuclei Wash (1% BSA in PBS with 0.2 U μl−1 RNasin (Promega)). Nuclei pellets were resuspended in 500 μl nuclei wash and 900 μl 1.8 M sucrose. This 1,400 μl mixture was carefully layered on top of 500 μl 1.8 M sucrose and centrifuged at 13,000g for 45 min at 4 °C to separate the nuclei from myelin debris. The nuclei pellet was resuspended in nuclei wash at 1,000 nuclei μl−1 and filtered through a 40-μm FlowMi Cell Strainer.
Single-nucleus RNA sequencing
Isolated mouse and human nuclei were subjected to droplet-based 5′ end massively parallel single-nucleus RNA sequencing using Chromium Single Cell 5′ Reagent Kits (v2) per the manufacturer’s instructions (10x Genomics). The libraries were paired-end sequenced at 150bp read length using an Illumina NovaSeq sequencer with a 300 cycle S4 flowcell at the McDonnell Genome Institute. Sample demultiplexing, barcode processing and single-cell counting was performed using the Cell Ranger Single-Cell Software Suite (5.0.0, 10x Genomics). Cellranger count was used to align samples to the reference genome provided by 10X Genomics (mm10-2020-A for mouse, GRCh38-2020-A for human) with “include introns = TRUE”.
Processing data with Seurat package and quality control
The Seurat package (v4.0.3) in R was used for subsequent analysis57. For quality control, nuclei with low UMI and gene number and nuclei with mitochondrial content >5% were removed. Cutoffs for UMI and gene number were determined on the basis of histograms showing cell density as a function of UMI or gene counts per nucleus. Nuclei that are duplets or multiplets were filtered out by two steps. First, nuclei with high UMI and gene number were filtered out. Then, nuclei with more than one cell-type marker gene expressed were removed.
For human NHD brain snRNA-seq, a cutoff of 1,000–100,000 UMI and 700–12,000 genes was applied. After filtering, 66,324 nuclei with a median of 6,943 UMIs and 3,150 genes per nucleus were remained across all samples. Raw counts were normalized with SCTransform (sctransform package 0.3.2)58 and variables, including mitochondrial gene percentage and batch covariate, were regressed out. Principal component analysis was performed using the top 2,000 most variable genes and the top 30 principal components were selected for dimensionality reduction using the Uniform Manifold Approximation and Projection (UMAP) algorithm. Sample variability and batch effects were corrected using Harmony package (0.1.0) in R. The corrected Harmony embeddings were then used to perform unsupervised clustering using the Seurat package, at a resolution of 3.
For KΔ75 mouse brain snRNA-seq analysis, a cutoff of 800–100,000 UMI and 600–10,000 genes was applied. After filtering, a total of 60,851 individual nuclei across all genotypes remained, with a median of 11,119 UMIs and 3,823 genes per nucleus for downstream analysis. Data were log normalized and regressed on mitochondrial gene percentage. Samples were batch corrected using FindIntegrationAnchors function and Canonical Correlation Analysis (CCA) in the Seurat package. Principal component analysis was performed using the top 2,000 most variable genes and the top 20 principal components were selected for dimensionality reduction using the UMAP algorithm. Clustering was performed using a resolution of 0.8.
Finding markers
For identifying markers for each cluster, we performed differential expression of each cluster against all other clusters, identifying positive markers for that cluster, using FindAllMarkers() function in the Seurat package with min.pct=0.1, logfc.threshold=0.25. For human NHD snRNA-seq, FindAllMarkers() function was applied with MAST algorithm (1.18.0)59, with metadata (sex, age and post-mortem interval (PMI)) included as covariates in the model. For mouse snRNA-seq, the default Wilcoxon Rank Sum test was used. Nuclei from broad cell types (microglia, astrocytes, microglia, oligodendrocytes, neurons and vascular clusters) were taken and re-clustered to further analyze sub-clusters in each cell type.
Analysis of gene differential expression
For differential expression analyses in human snRNA-seq, raw RNA counts were normalized and log-transformed using the NormalizeData() function in Seurat. Differential expression of genes between conditions was done using FindMarkers() function in Seurat with MAST algorithm59 in R with log-normalized RNA counts. Sex, age and PMI were included as covariates in the model. log2(fold change) of average expression and the percentage of cells (pct) expressing the genes in each condition were generated. Lists of DEGs are compiled in Supplementary Table 3. These gene lists were used as inputs for downstream pathway and geneset score analyses.
For differential expression analyses in mouse snRNA-seq, raw RNA counts were normalized and log-transformed using the NormalizeData() function in Seurat. Differential expression of genes between genotypes was done using FindMarkers() function in Seurat using a Wilcoxon Rank Sum test with default parameters. log2(fold change) of average expression and the percentage of cells (pct) expressing the genes in each condition were generated. Lists of DEGs are compiled in Supplementary Table 6. These gene lists were used as inputs for downstream pathway and geneset score analyses.
Individual-level average gene expression was calculated using AverageExpression() function in Seurat. Bot plots were plotted using ggplot2 (3.3.5) in R. Heatmaps were plotted using heatmap.2 in gplots package (3.1.3).
Gene set analysis
Gene set scores were calculated using the UCell package (1.3.1)60 in R, which is based on the Mann-Whitney U statistic and not affected by dataset composition. Gene sets listed in Supplementary Table 4 were used as inputs for this analysis. Gene signatures of human AD microglia and astrocytes were obtained from Mathys et al.23, Zhou et al.5 and Srinivasan et al.24. Gene signature of microglia in vascular dementia was obtained from McKay et al.25. Gene signatures of MS microglia and astrocytes were obtained from Absinta et al.26. Gene signatures of MS oligodendrocytes were obtained from Absinta et al.26 and Jäkel et al.41.
Venn diagrams were plotted using BioVenn package (1.1.3) in R.
Cell type abundance analysis
Differential cell type abundance analysis was done using MASC package56 (0.0) in R. The sample from which the nuclei were from was included as a random effect. P values were adjusted by Benjamini-Hochberg correction.
Pathway analysis
Gene ontology analysis was performed using Metascape61. Gene set enrichment analysis (GSEA) was performed using Hallmark pathways from the MSigDB/GSEA resource.
NicheNet analysis
Ligand-target interactions were mined from the snRNA-seq data using the NicheNet algorithm (nichenetr 1.0.0)62. Briefly, microglia were defined as receiver cells and astrocytes and oligodendrocytes were defined as sender cells. NicheNet analysis was performed using DEGs in microglia as calculated previously between NHD and control as input with default settings. Circos plot was computed based on calculation of interaction scores between possible ligand-target combinations. Top predicted ligands were plotted as a heatmap.
Protein-protein interaction network
Gene list of top 100 DEGs in NHD astrocytes was used as input for STRING analysis (version 11.5, string-db.org) using default parameters. The protein interaction result was then imported into Cytoscape (3.9.0) for network analysis and visualization. Gene Ontology in Biological Process analyzed by STRING was used in color coding for interacting nodes in the network plot.
Re-analysis of public datasets
For macrophage polarization scRNA-seq dataset, raw feature matrix was downloaded from GSE199378 and processed using Seurat package as described above. For quality control, cells with mitochondrial content > 20% were removed. Cells with a UMI cutoff of 1,500–30,000 and gene number > 1,000 were retained. Raw counts were normalized with SCTransform and mitochondrial gene percentage was regressed out. The first 20 principal components were used for clustering using Seurat with a resolution of 0.6. Two unidentifiable clusters were removed. Cluster markers were identified with FindAllMarkers() function in Seurat using log-transformed RNA counts.
Gene set enrichment analysis (GSEA) on macrophage polarization was done using Phantasus (1.17.4)63. Data from GSE61298 were imported into Phantasus and collapsed using “Max probe”. Average gene expression was calculated using “Create Calculated Annotation” function and the top 12,000 highly expressed genes were retained for differential expression analysis by Limma. GSEA was plotted using GSEA plot function and genes were ranked by t.
To generate WAM signature (white matter-associated microglia)44, processed Seurat object was kindly provided by the authors. WAM signature genes were generated using FindAllMarkers() function in Seurat on the “WAM” cluster.
Immunofluorescence
Mice were anesthetized with ketamine/xylazine and perfused with ice-cold PBS containing 1 U/ml of heparin. Left brain hemispheres were fixed in 4% PFA overnight at 4°C, rinsed in PBS, and incubated overnight at 4°C in 30% sucrose before freezing in a 2:1 mixture of 30% sucrose and optimal cutting temperature compound. Serial 40 μm coronal floating sections were cut on a Cryostat (Leica CM1860) and kept in cryoprotectant (30% sucrose, 30% ethylene glycol, PBS) at −20°C.
Floating sections were blocked with 3% BSA and 0.25% Triton X-100 in PBS, and stained with anti-CD11c (rabbit polyclonal, 1:500, Cell Signaling Technology, #97585), anti-IBA1 (goat polyclonal, 1:500, Abcam, ab5076), anti-Serpina3n (goat polyclonal, 1:200, R&D, AF4709), anti-OLIG2 (rabbit polyclonal, 1:500, EMB Millipore, AB9610), anti-GFAP (Alexa Fluor 488-labeled mouse IgG1, 1:1000, Thermo Fisher Scientific, #53-9892-82) and anti-MBP (rat IgG2a, 1:1,000, EMB Millipore, MAB386) overnight at 4°C followed by staining with anti-rabbit IgG Alexa Fluor 555 (donkey, 1:2,000; Abcam, ab150074), anti-goat IgG Alexa Fluor 647 (donkey, 1:2,000, Abcam, ab150131) and/or DAPI (1μg/ml, Sigma, D9542). Images were acquired using a Nikon A1Rsi confocal microscope and NIS-Elements AR 5.20.01. Extraction of parameters were performed in Imaris 8.3.1 or Imaris 9.8.0 (Bitplane).
For human SPP1 staining, double-label immunofluorescence was performed on the occipital sections as described previously64 using antibodies against SPP1 (goat polyclonal, 1:100, R&D systems, AF1433) and IBA1 (rabbit polyclonal, 1:2,000, FUJIFILM Wako, 019-19741). Sections were autoclaved at 120 °C in 10 mM citrate buffer (pH = 6) for 10 min for antigen retrieval. Secondary antibodies used were Alexa Fluor 488 donkey anti-goat IgG (1:1,000, Invitrogen, A-11055) and Alexa Fluor 568 donkey anti-rabbit IgG (1:1,000, Invitrogen, A10042). The sections were treated with an Autofluorescence Eliminator Reagent (Millipore), then mounted under glass coverslips using Vectashield mounting medium with 4,6-diamidino-2-phenylindole (DAPI) nuclear stain (Vector Laboratories). The sections were analyzed using a confocal laser scanning microscope (LSM700, Carl Zeiss).
Neuropathologic analysis
Post-mortem brains were fixed with 10% buffered formalin, and multiple tissue blocks were embedded in paraffin. Histological examination was performed on 4-μm-thick sections using hematoxylin and eosin, and Elastica-Goldner stains.
Immunohistochemistry
Immunohistochemistry was performed on the frontal and occipital sections as described previously64 using antibodies against CD163 (mouse monoclonal, 1:400, Leica Biosystems, NCL-L-CD163), GFAP (rabbit polyclonal, 1:400, Invitrogen, PA5-16291), and MBP (rabbit polyclonal, 1:400, abcam, ab40390). Sections were autoclaved at 120 °C in 10 mM citrate buffer (pH = 6) for 10 min for antigen retrieval for anti-CD163 antibody. Bound antibodies were visualized by the peroxidase-polymer-based method using a Histofine Simple Stain MAX-PO kit (Nichirei, Tokyo, Japan) with diaminobenzidine as the chromogen. Immunostained sections were counterstained with hematoxylin. Images were acquired with an NanoZoomer 2.0-HT Digital slide scanner c9600 (Hamamatsu Photonics, Japan).
Image analysis
To quantify colocalization of CD11c and IBA1 signals in corpus callosum (CC), we first created surfaces using the “skip automatic function, edit manually” option in Imaris and manually selected the CC area on the top and bottom sections to build the CC surface. We then used the “masked channel” function to create new channels that selectively contain signals of protein of interest inside the CC surface. Then “batch colocalization” of Matlab function was run on the newly generated channels and colocalization channels were created. The volumes of signal of interest in each image were determined using “Surface” function in Imaris. Ratios of double positive volumes over single positive volumes (CD11c+IBA1+/IBA1+) were then calculated. Autofluorescence was masked by creating a surface on an empty channel.
For measurement of Serpina3n+Olig2+ oligodendrocytes, oligodendrocyte nuclei were determined using the surfaces function of Imaris on Olig2 channel. After Olig2+ surfaces were defined, the perinuclear region was defined as within 2 μm of the Olig2+ surface. This was accomplished by using the ‘distance from surfaces’ function on the Olig2+ surfaces to assign a value to each voxel representing the distance to the nearest Olig2+ surface. The intensity of Serpina3n within these surfaces was determined by taking the mean of voxel intensity values of Serpina3n channel within the Olig2+ surfaces. Serpina3n+Olig2+ oligodendrocytes were counted as the number of Olig2+ surfaces with Serpina3n mean intensity above 10.
To quantify MBP signal intensity in CC, we first built the CC surface in Imaris as stated above. Then “Intensity Sum” of MBP channel was extracted from every image, three images per mouse. Z-stack size was the same in all images acquired.
Quantification of IHC images was done in Fiji/ImageJ (2.1.0/1.53c). DAB channel was extracted using “Colour Deconvolution” with “H DAB”. Percent area coverage was determined by batch processing, setting as a threshold a fixed intensity across all images. Percentage area was calculated by measuring “Area fraction” with “Limit to threshold”.
Flow cytometry
Bone marrow derived macrophages (BMDMs) were collected from tibia of WT or KΔ75 mice. Isolated bone marrow cells were cultured in RPMI, supplemented with 10% heat-inactivated FBS, penicillin-streptomycin, GlutaMax and pyruvate in a 10-mm petri dish. Cells were differentiated with 10% L-cell conditioned medium (LCCM) for 10 days. On day 10, BMDMs were plated into non-tissue culture treated 6-well plates without LCCM overnight. The next day, BMDMs were collected for stimulation with 20ng/ml IL-10 for 15 min at 37 °C. At the end of the stimulation, cells were fixed in 2% paraformaldehyde for 15 min at 22 °C, followed by permeabilization with ice-cold 90% methanol on ice for 30 min. Cells were then stained with primary antibodies in 0.5% BSA PBS for 1h at 22 °C. Primary antibodies used were pSTAT3 (1:100, D3A7, rabbit, Cell Signaling Technology, #9145) and STAT3 (1:100, 124H6, mouse, Cell Signaling Technology, #9139). After washing with PBS twice, cells were stained in secondary antibodies: anti-rabbit IgG Alexa Fluor 555 (donkey, 1:1,000; Abcam, ab150074) and anti-mouse IgG(H+L) Alexa Fluor 555 (goat, 1:1,000, Invitrogen, A21424). Samples were acquired on a BD FACSCalibur Flow Cytometer and data were analyzed using FlowJo (10.8.1).
Statistics and reproducibility
snRNA-seq data were analyzed using the MAST algorithm of the Seurat package in R, which implements a two-part hurdle model, or a Wilcoxon Rank Sum test. P values were adjusted based on Bonferroni correction. For human snRNA-seq, sex, age and PMI were included as covariates for the model. All statistical analyses for validation assays were performed using GraphPad Prism (v9.3.0) with unpaired Student’s t-test. P values lower than 0.05 were considered statistically significant. Probability value was noted in each figure. All statistical tests used are stated in figure legends. Experiments were repeated two or more times. P values in violin and box plots were calculated using stat_compare_means() function of ggpubr package (0.4.0) in R using Wilcox test. P values in cell type abundance analysis were calculated with MASC package in R and adjusted by Benjamini-Hochberg correction.
Extended Data
Extended Data Fig. 1. Cluster characterization of NHD and control samples.

a, UMAP plots of NHD and control samples before (left) and after (right) batch correction by Harmony. n=66,324 total nuclei; 11 control and 3 NHD individuals. b, Bar graphs of total nuclei number, median of number of genes and median of number of UMIs of each sample sequenced. c, Heatmap showing cell type markers. d, Nuclei frequency of all cell types in each sample.
Extended Data Fig. 2. Characterization of NHD microglia subclusters.

a, Pathways enriched in genes upregulated in NHD microglia compared to controls, using GSEA analysis (left, q value by FDR adjustment) or Metascape analysis (right, P value by hypergeometric distribution). b, PCA plot of NHD and control microglia demarcated by sex. c, Average expression of top DEGs (log2(Fold Change) > 0.5, FDR-adjusted P < 0.05, two-part, generalized linear model) upregulated in NHD microglia plotted against age at death. Trend line calculated for control samples only.
Extended Data Fig. 3. NHD microglia signature overlaps with IL-10-induced macrophage signature.

a, UMAP plot of human monocyte-derived macrophages stimulated with cocktails of LPS+IFNg, IL-4+IL-13 or IL-10 from GSE199378, designated by treatment. b, Venn diagram showing little overlap among signatures of polarized macrophages. c-e, Violin plot showing gene set scores (by UCell) of the designated macrophage polarization signatures (top 100 genes upregulated under each condition) in the macrophage polarization dataset; c, LPS+IFNg polarization, n=8,232 nuclei; d, IL-4+IL-13 polarization, n=6,741 nuclei; e, IL-10 polarization, n=6,890 nuclei. Box center lines, bounds of box, and whiskers indicate median, first and third quartiles, and minima and maxima within 1.5X IQR, respectively. P value by two-sided Wilcoxon Rank Sum test. f-h, GSEA plots showing enrichment of NHD microglia signature in signatures of polarized macrophages stimulated by LPS and IFNg (f), IL-4 (g) and IL-10 (h) from GSE6129828. P values by permutation. NES, normalized enrichment score. i, Histogram of phospho-STAT3 (pSTAT3) staining of bone marrow derived macrophages (BMDMs) from WT and DAP12 KD75 mice, stimulated with 0ng/ml or 20ng/ml IL-10 for 15min after starvation overnight. Data are representative of two independent experiments. j, Quantification of pSTAT3 mean fluorescence intensity (MFI) in i. P value by two-way ANOVA. Data are presented as mean ± s.e.m. n=3 independent cell culture wells per genotype per experiment; two independent experiments. k, Histogram of total STAT3 staining in BMDM from WT and DAP12 KD75 mice, treated as in i. Data are representative of two independent experiments. l, Quantification of STAT3 mean fluorescence intensity in k. P value by two-way ANOVA. Data are presented as mean ± s.e.m. n=3 independent cell culture wells per genotype per experiment; two independent experiments. m, Gating strategy for BMDMs from WT and KD75 mice. Numbers indicate the percentage of cells within the gate.
Extended Data Fig. 4. The NHD endothelial cell signature shows altered function.

a, Volcano plot depicting genes differentially expressed (log2(Fold Change) > 0.25, FDR-adjusted P < 0.05, two-part, generalized linear model) in NHD versus control endothelial cells. b, Box plots showing average individual expression levels for selected DEGs in endothelial cells. Box center lines, bounds of box, and whiskers indicate median, first and third quartiles, and minima and maxima within 1.5X IQR, respectively. P values by two-sided Wilcoxon Rank Sum test. n=11 control and 3 NHD individuals. c, Heatmap showing average gene expression of top DEGs in endothelial cells per sample.
Extended Data Fig. 5. Comparison of NHD astrocyte and oligodendrocyte signatures with those in other neurodegenerative diseases.

a,b, Venn diagram revealing overlapping genes commonly upregulated in NHD astrocytes and two human AD datasets (a), and in NHD astrocytes and AIMS (astrocytes inflamed in MS) (b). c, Dot plot showing marker genes for each oligodendrocyte subcluster. d, Volcano plot depicting genes differentially expressed in NHD and control oligodendrocytes (log2(fold change) > 0.25, FDR-adjusted P < 0.05, two-part, generalized linear model). e, Box plots showing average of individual levels of expression for selected genes upregulated in NHD oligodendrocytes. Box center lines, bounds of box, and whiskers indicate median, first and third quartiles, and minima and maxima within 1.5X IQR, respectively. P values by two-sided Wilcoxon rank-sum test. n=11 control and 3 NHD individuals. f, Heatmap showing average gene expression of top DEGs (log2(fold change) > 0.25, FDR-adjusted P < 0.05, two-part, generalized linear model) in oligodendrocytes from each sample. g, Pathways enriched in genes upregulated in NHD oligodendrocytes. P values calculated based on the cumulative hypergeometric distribution. h,i, Venn diagram revealing genes differentially expressed in NHD oligodendrocytes as well as in two human MS datasets. h, upregulated genes. i, downregulated genes.
Extended Data Fig. 6. NHD neurons present signatures of diminished activity.

a, UMAP plot of neuron sub-clustering. n=36,336 total neuronal nuclei; 3 NHD and 11 controls. Ex, excitatory neurons; In, inhibitory neurons. b, Nuclei frequency of neuronal subclusters in each sample. c, Number of upregulated (up) and downregulated (down) genes differentially expressed in (log2(fold change) > 0.5, FDR-adjusted P < 0.05, two-part, generalized linear model) NHD and controls in each neuronal subcluster. d,e, Pathways enriched in genes downregulated in NHD in excitatory neurons (d) or inhibitory neurons (e). P values calculated based on the cumulative hypergeometric distribution. f, Violin plots showing percentage of reads that map to ribosomal genes split by disease condition. Differences between NHD and controls in all subclusters are significant by two-sided Wilcoxon Rank Sum test. Each dot represents the mean ± s.d. A full list of P values and number of nuclei is given in Supplementary Table 2. g, Heatmap showing average expression of genes in synaptic vesicle endocytosis pathway per condition per cluster.
Extended Data Fig. 7. Cluster characterization of 2-year-old KΔ75 and WT cortical samples.

a, Bar graphs of total nuclei number, median of number of genes and median of number of UMIs of each sample sequenced. b, UMAP plot of 2-year-old KΔ75 and WT cortical samples grouped by clusters, which were manually assigned to each cell type. n=60,851 total nuclei; 4 animals per genotype. c, UMAP plots showing expression of cluster markers. d, Nuclei distribution of all samples in each cluster. e, UMAP plot of all nuclei from KΔ75 and WT samples. n=26,492 WT nuclei and 34,359 KΔ75 nuclei; 4 animals per genotype.
Extended Data Fig. 8. KΔ75 microglia sub-clustering in detail.

a, UMAP plot showing expression of Tyrobp in myeloid clusters. b, Venn diagram highlighting similarities between IFN-R and the interferon responsive signature from ref45. Overlapping genes are shown in the box. c, Scatter plot depicting differential cell type abundance calculated by MASC. Data are represented as the MASC OR of a nucleus being in that cluster for WT versus KΔ75 (with 95% CI), against the −log(P value) of the association. Center of bar corresponds to OR. Red labeled cluster was significant with FDR-adjusted P value < 0.05 using Benjamini-Hochberg correction. A full list of P values and number of nuclei is provided in Supplementary Table 5. d, Donut plots showing nuclei contribution from each sample to each myeloid subcluster. Numbers represent the percentage of nuclei from each sample within the designated subcluster. e, Volcano plot showing DEGs (log2(fold change) > 0.5, adjusted P < 0.05, two-sided Wilcoxon Rank Sum test, Bonferroni correction) within the HM cluster from KΔ75 and WT mice. f, Heatmap showing average gene expression of top DEGs from e in HM cluster. g, Pathways enriched in genes downregulated in KΔ75 HM vs. WT HM. q values calculated based on Benjamini-Hochberg.
Extended Data Fig. 9. KΔ75 oligodendrocyte and astrocyte sub-clustering in detail.

a, UMAP plots showing cluster marker expression in each oligodendrocyte sub-cluster. b, Violin plots showing expression of reactive oligodendrocyte genes in each sub-cluster. c, Violin plots showing expression of reactive oligodendrocyte genes in the ROL clusters from KΔ75 and WT mice. d, Violin plots showing the DOL signature score (by UCell) in each oligodendrocyte sub-cluster. DOL signature was extracted from ref50. Box center lines, bounds of box, and whiskers indicate median, first and third quartiles, and minima and maxima within 1.5X IQR, respectively. P values by two-sided Wilcoxon Rank Sum test. n=8,398 MFOL, 1,643 OPC, 754 MOL, 74 COP and 51 ROL nuclei. e, Violin plots showing DOL signature score (by UCell) in ROL from KΔ75 and WT mice. f, Representative IF images of MBP (red) in corpus callosum of 2-year-old WT and KΔ75 mice. Scale bar, 30 mm. g, Quantification of MBP intensity in f. P value by two-tailed unpaired t test. Bars at mean. n=4 WT and 3 KΔ75 mice. h, UMAP plot showing expression of Vim and Gfap in astrocyte subcultures. i, Violin plots showing expression of reactive astrocyte genes in each sub-cluster. j, Pathways enriched in astrocyte cluster 8 marker genes. q-values calculated based on Benjamini-Hochberg. k, UMAP plot showing expression of Crym in astrocyte subclusters.
Extended Data Fig. 10. Transcriptional profiles of KΔ75 and WT neurons are similar.
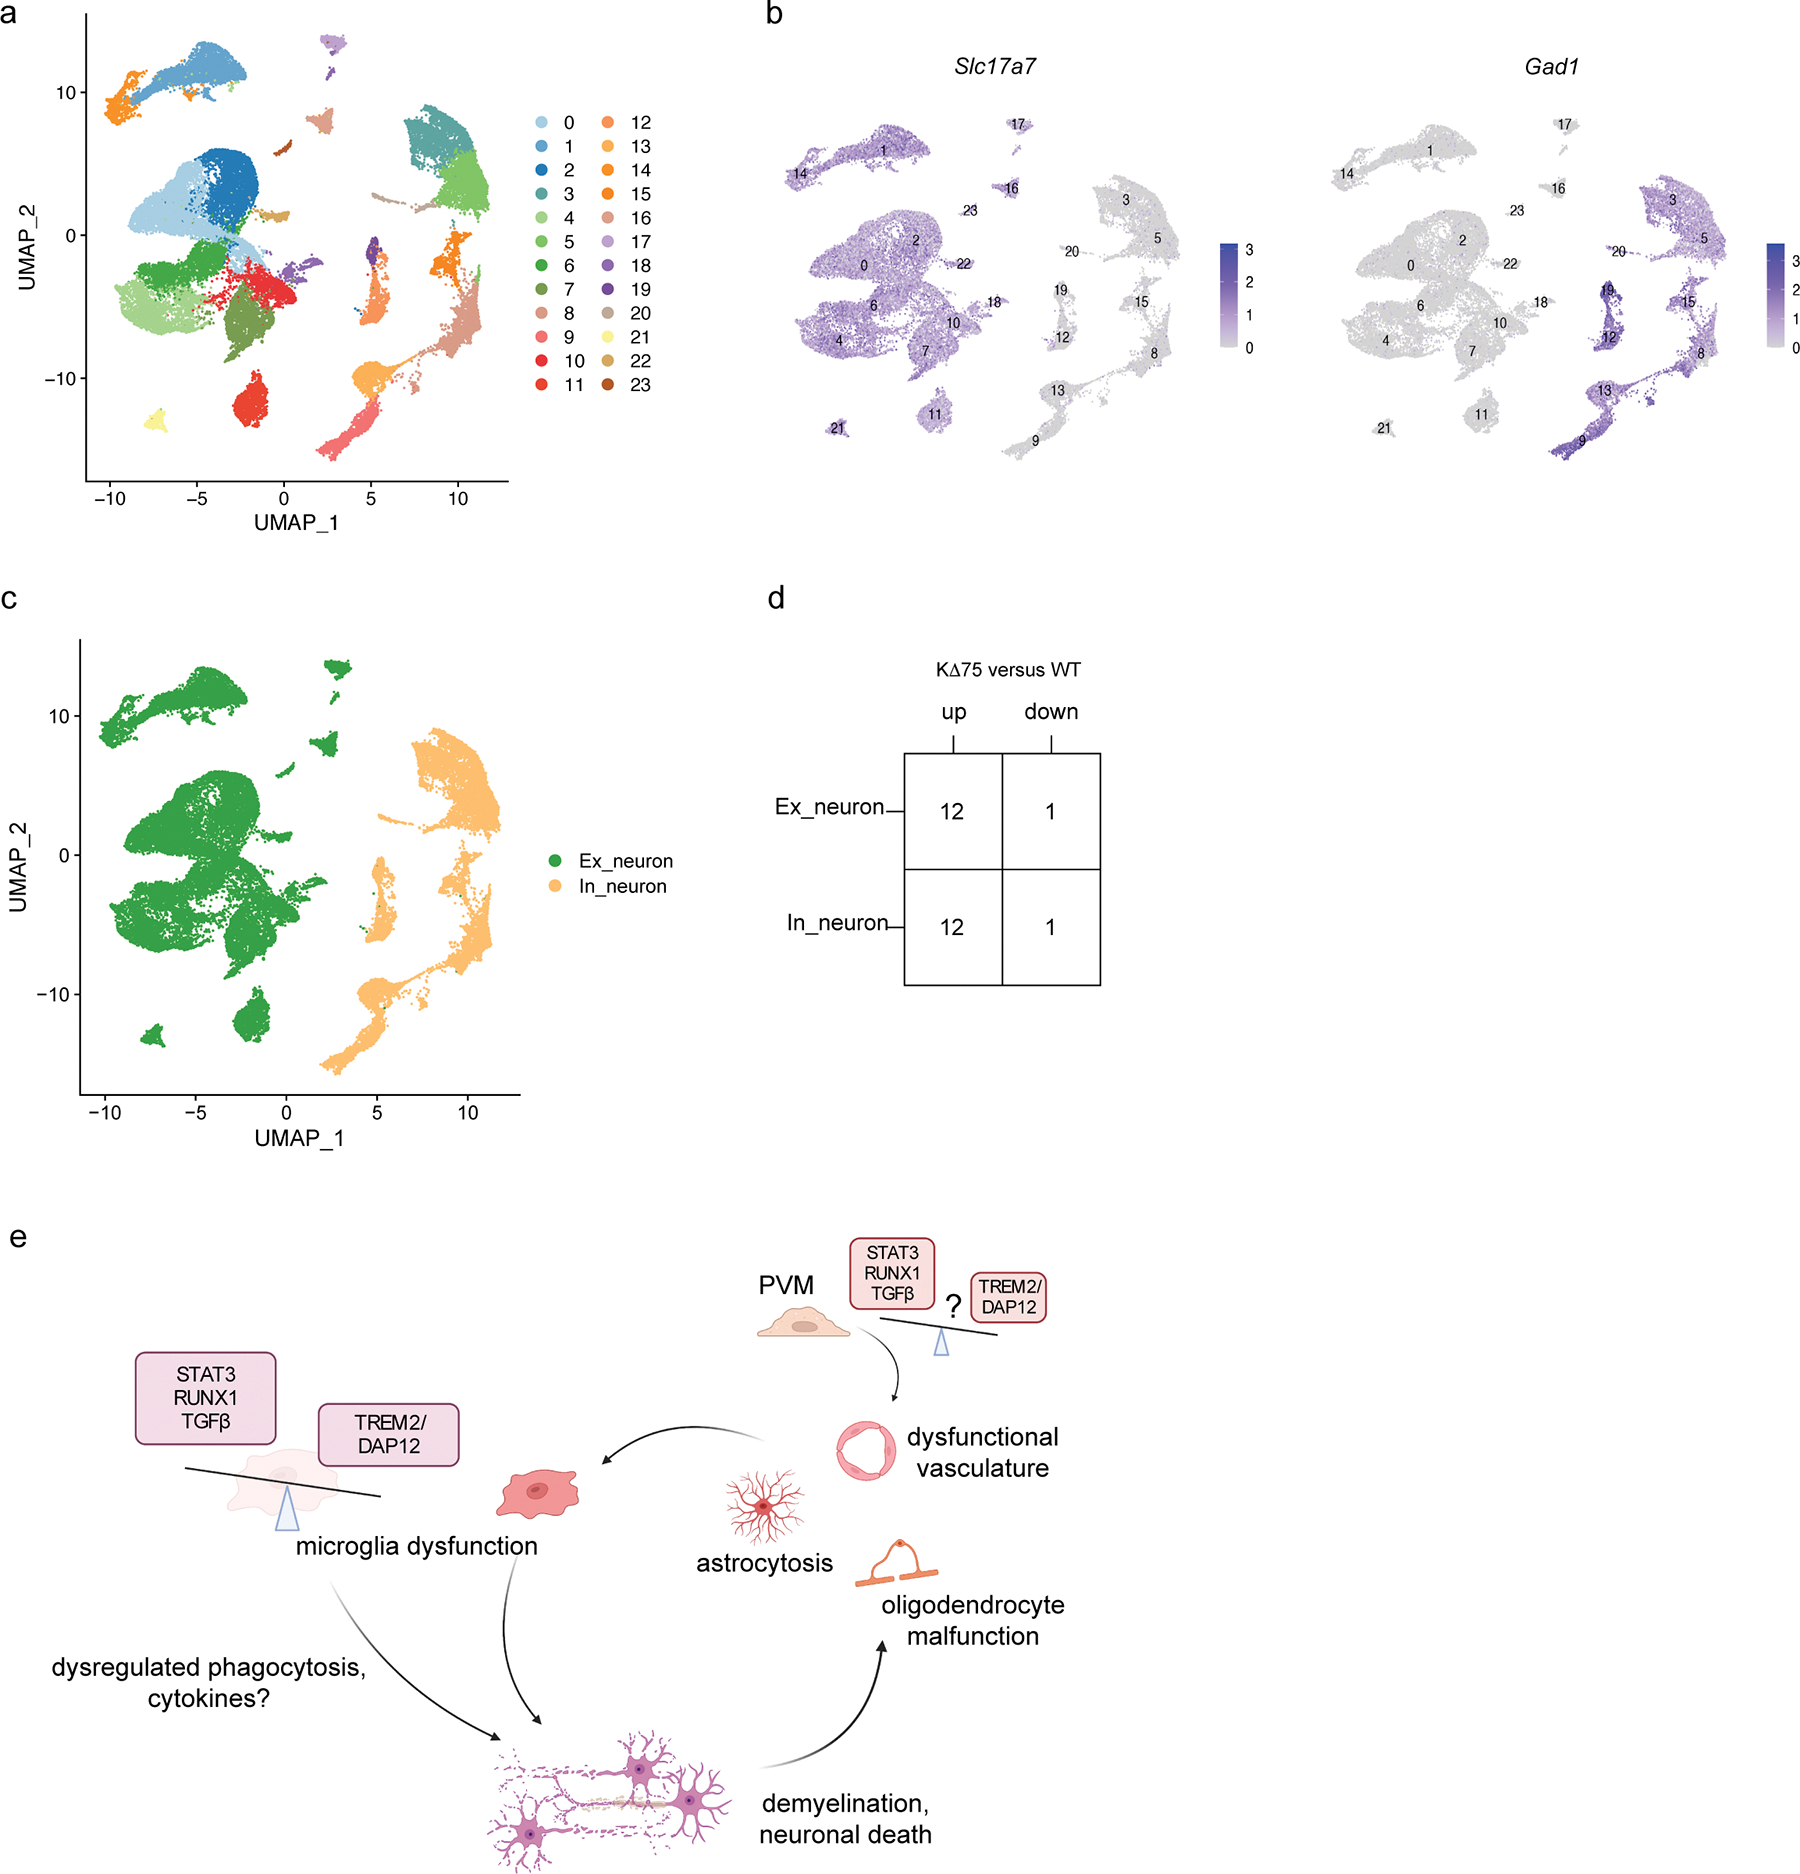
a, UMAP plot of neuron sub-clustering. n=40,657 total neuronal nuclei; 4 animals per genotype. b, UMAP plot showing expression of Slc17a7 and Gad1. c, UMAP plot of neuron sub-clustering grouped by excitatory neurons (Ex_neuron) and inhibitory neurons (In_neuron). d, Number of upregulated (up) and downregulated (down) DEGs (log2(fold change) > 0.5, adjusted P < 0.05, non-parametric two-sided Wilcoxon rank sum test, Bonferroni correction) in excitatory and inhibitory neurons in KΔ75 versus WT mice. e, Model of NHD pathogenesis. A genetic defect in DAP12 or TREM2 leads to imbalance between TREM2/DAP12 signaling pathway and pathways driven by STAT3, RUNX1 and TGFb in microglia. This imbalance results in demyelination through unknown mechanisms, which may include dysregulated phagocytosis and secretion of cytokines. Accumulation of myelin and cellular debris leads to progressive and extensive tissue damage that includes astrocytosis, oligodendrocyte malfunction and dysfunctional vasculature, which further activates microglia. In addition, perivascular macrophages may directly alter vascular function, leading to its dysregulation. Created with BioRender.com.
Supplementary Material
Acknowledgements
We thank E. Vivier (Aix Marseille Université) and W. M. Yokoyama (Washington University in St. Louis) for providing the KΔ75 mice, R. Cho (Cell Signaling Technology) for kindly providing STAT3 and pSTAT3 antibodies, L. L. Lanier (University of California at San Francisco) for providing DAP12 antibody, V. Peng and M. Terekhova for advice on bioinformatic analyses, S. Brioschi for great scientific discussions and M. Tano for technical help. M. Tada was supported by the Japan Society for the Promotion of Science (JSPS, KAKENHI, 22H02995). A. K. was supported by the Strategic Research Program for Brain Sciences from Japan Agency for Medical Research and Development (AMED, JP21wm0425019) and the Collaborative Research Project of the Brain Research Institute, Niigata University, Japan. M. Takao was supported by AMED (JP21wm0425019). M.C. was supported by the NIH (RF1 AG051485, R21 AG077244, P01 AG078106, and RF1 AG059082), Cure Alzheimer’s Fund, Fred and Ginger Haberle Charitable Fund at Texas Communities Foundation and Centene.
Footnotes
Competing Interests Statement
M.C. is a member of the Vigil Neuro scientific advisory board (SAB), is consultant for Cell Signaling Technology, has received research grants from Vigil Neuro during the conduct of the study and has a patent to TREM2 pending. The remaining authors declare no competing interests.
Code Availability
All software used in this study is published and cited either in the main text or Methods. No custom code was used for data processing or analysis. All the codes used in the analysis for NHD snRNA-seq can be found at https://github.com/yingyue-zhou/NHD_snRNA.
Data Availability
snRNA-seq differential expression gene lists with statistics are available as Supplementary Tables 3 and 6. All requests for human snRNA-seq data are promptly reviewed by the Brain Research Institute at Niigata University and Mihara Memorial Hospital (Isesaki, Japan) to verify if the request is subject to any intellectual property or confidentiality obligations. Human-related data not included in the paper were generated as part of clinical trials and may be subject to patient confidentiality. Any data and materials that can be shared will be released via a Material Transfer Agreement. Raw and processed mouse and human snRNA-seq data have been deposited to the Gene Expression Omnibus (GEO) database under accession number GSE190015. Processed data, UMAP coordinates and annotations for the human NHD snRNA-seq have also been made freely available to download and visualize at the University of California Santa Cruz Cell Browser (https://nhd-brain.cells.ucsc.edu). scRNA-seq data and microarray data on macrophage polarization were downloaded from GEO under accession number GSE199378 and GSE61298, respectively. Please contact the corresponding authors for additional information. Source data for Figures 2, 4, 5 and 6 are provided with the paper.
References
- 1.Ulland TK & Colonna M TREM2 - a key player in microglial biology and Alzheimer disease. Nat Rev Neurol 14, 667–675 (2018). [DOI] [PubMed] [Google Scholar]
- 2.Li R-Y et al. TREM2 in the pathogenesis of AD: a lipid metabolism regulator and potential metabolic therapeutic target. Molecular Neurodegeneration 17, 40 (2022). [DOI] [PMC free article] [PubMed] [Google Scholar]
- 3.Efthymiou AG & Goate AM Late onset Alzheimer’s disease genetics implicates microglial pathways in disease risk. Molecular Neurodegeneration 12, 43 (2017). [DOI] [PMC free article] [PubMed] [Google Scholar]
- 4.Song WM et al. Humanized TREM2 mice reveal microglia-intrinsic and -extrinsic effects of R47H polymorphism. Journal of Experimental Medicine jem.20171529 (2018) doi: 10.1084/jem.20171529. [DOI] [PMC free article] [PubMed] [Google Scholar]
- 5.Zhou Y et al. Human and mouse single-nucleus transcriptomics reveal TREM2-dependent and TREM2-independent cellular responses in Alzheimer’s disease. Nature Medicine 26, 131–142 (2020). [DOI] [PMC free article] [PubMed] [Google Scholar]
- 6.Chen Y & Colonna M Microglia in Alzheimer’s disease at single-cell level. Are there common patterns in humans and mice? Journal of Experimental Medicine 218, e20202717 (2021). [DOI] [PMC free article] [PubMed] [Google Scholar]
- 7.Paloneva J et al. Mutations in Two Genes Encoding Different Subunits of a Receptor Signaling Complex Result in an Identical Disease Phenotype. The American Journal of Human Genetics 71, 656–662 (2002). [DOI] [PMC free article] [PubMed] [Google Scholar]
- 8.Chouery E et al. Mutations in TREM2 lead to pure early-onset dementia without bone cysts. Human Mutation 29, E194–E204 (2008). [DOI] [PubMed] [Google Scholar]
- 9.Paloneva J et al. CNS manifestations of Nasu-Hakola disease: a frontal dementia with bone cysts. Neurology 56, 1552–1558 (2001). [DOI] [PubMed] [Google Scholar]
- 10.Sasaki A et al. Variable expression of microglial DAP12 and TREM2 genes in Nasu-Hakola disease. Neurogenetics 16, 265–276 (2015). [DOI] [PubMed] [Google Scholar]
- 11.Kaifu T et al. Osteopetrosis and thalamic hypomyelinosis with synaptic degeneration in DAP12-deficient mice. J. Clin. Invest. 111, 323–332 (2003). [DOI] [PMC free article] [PubMed] [Google Scholar]
- 12.Nataf S et al. Brain and Bone Damage in KARAP/DAP12 Loss-of-Function Mice Correlate with Alterations in Microglia and Osteoclast Lineages. The American Journal of Pathology 166, 275–286 (2005). [DOI] [PMC free article] [PubMed] [Google Scholar]
- 13.Poliani PL et al. TREM2 sustains microglial expansion during aging and response to demyelination. J. Clin. Invest. 125, 2161–2170 (2015). [DOI] [PMC free article] [PubMed] [Google Scholar]
- 14.Roumier A et al. Impaired Synaptic Function in the Microglial KARAP/DAP12-Deficient Mouse. J. Neurosci. 24, 11421–11428 (2004). [DOI] [PMC free article] [PubMed] [Google Scholar]
- 15.Tomasello E et al. Combined Natural Killer Cell and Dendritic Cell Functional Deficiency in KARAP/DAP12 Loss-of-Function Mutant Mice. Immunity 13, 355–364 (2000). [DOI] [PubMed] [Google Scholar]
- 16.Kondo T et al. Heterogeneity of presenile dementia with bone cysts (Nasu-Hakola disease): three genetic forms. Neurology 59, 1105–1107 (2002). [DOI] [PubMed] [Google Scholar]
- 17.Zusso M et al. Regulation of Postnatal Forebrain Amoeboid Microglial Cell Proliferation and Development by the Transcription Factor Runx1. J Neurosci 32, 11285–11298 (2012). [DOI] [PMC free article] [PubMed] [Google Scholar]
- 18.Griffiths EK & Penninger JM ADAP-ting TCR signaling to integrins. Sci STKE 2002, re3 (2002). [DOI] [PubMed] [Google Scholar]
- 19.Zheng B et al. VEGFR2 Promotes Metastasis and PD-L2 Expression of Human Osteosarcoma Cells by Activating the STAT3 and RhoA-ROCK-LIMK2 Pathways. Front Oncol 10, 543562 (2020). [DOI] [PMC free article] [PubMed] [Google Scholar]
- 20.Simoncic PD, Lee-Loy A, Barber DL, Tremblay ML & McGlade CJ The T cell protein tyrosine phosphatase is a negative regulator of janus family kinases 1 and 3. Curr Biol 12, 446–453 (2002). [DOI] [PubMed] [Google Scholar]
- 21.Matak P et al. Activated macrophages induce hepcidin expression in HuH7 hepatoma cells. Haematologica 94, 773–780 (2009). [DOI] [PMC free article] [PubMed] [Google Scholar]
- 22.Katoh M & Katoh M STAT3-induced WNT5A signaling loop in embryonic stem cells, adult normal tissues, chronic persistent inflammation, rheumatoid arthritis and cancer (Review). Int J Mol Med 19, 273–278 (2007). [PubMed] [Google Scholar]
- 23.Mathys H et al. Single-cell transcriptomic analysis of Alzheimer’s disease. Nature 570, 332–337 (2019). [DOI] [PMC free article] [PubMed] [Google Scholar]
- 24.Srinivasan K et al. Alzheimer’s Patient Microglia Exhibit Enhanced Aging and Unique Transcriptional Activation. Cell Rep 31, 107843 (2020). [DOI] [PMC free article] [PubMed] [Google Scholar]
- 25.McKay EC et al. Peri-Infarct Upregulation of the Oxytocin Receptor in Vascular Dementia. J Neuropathol Exp Neurol 78, 436–452 (2019). [DOI] [PMC free article] [PubMed] [Google Scholar]
- 26.Absinta M et al. A lymphocyte–microglia–astrocyte axis in chronic active multiple sclerosis. Nature 597, 709–714 (2021). [DOI] [PMC free article] [PubMed] [Google Scholar]
- 27.Martinez FO, Sica A, Mantovani A & Locati M Macrophage activation and polarization. Front Biosci 13, 453–461 (2008). [DOI] [PubMed] [Google Scholar]
- 28.Ohradanova-Repic A et al. Extracellular Purine Metabolism Is the Switchboard of Immunosuppressive Macrophages and a Novel Target to Treat Diseases With Macrophage Imbalances. Front Immunol 9, 852 (2018). [DOI] [PMC free article] [PubMed] [Google Scholar]
- 29.Noda M et al. FGF-2 released from degenerating neurons exerts microglial-induced neuroprotection via FGFR3-ERK signaling pathway. J Neuroinflammation 11, 76 (2014). [DOI] [PMC free article] [PubMed] [Google Scholar]
- 30.Garcia FJ et al. Single-cell dissection of the human brain vasculature. Nature 603, 893–899 (2022). [DOI] [PMC free article] [PubMed] [Google Scholar]
- 31.Kelley C, D’Amore P, Hechtman HB & Shepro D Vasoactive hormones and cAMP affect pericyte contraction and stress fibres in vitro. J Muscle Res Cell Motil 9, 184–194 (1988). [DOI] [PubMed] [Google Scholar]
- 32.Gerthoffer WT, Solway J & Camoretti-Mercado B Emerging targets for novel therapy of asthma. Curr Opin Pharmacol 13, 324–330 (2013). [DOI] [PMC free article] [PubMed] [Google Scholar]
- 33.Parthasarathy S & Fehr AR PARP14: A key ADP-ribosylating protein in host–virus interactions? PLOS Pathogens 18, e1010535 (2022). [DOI] [PMC free article] [PubMed] [Google Scholar]
- 34.Eddleston M et al. Astrocytes are the primary source of tissue factor in the murine central nervous system. A role for astrocytes in cerebral hemostasis. J Clin Invest 92, 349–358 (1993). [DOI] [PMC free article] [PubMed] [Google Scholar]
- 35.Wiese S, Karus M & Faissner A Astrocytes as a Source for Extracellular Matrix Molecules and Cytokines. Frontiers in Pharmacology 3, (2012). [DOI] [PMC free article] [PubMed] [Google Scholar]
- 36.Matthies AM, Low QEH, Lingen MW & DiPietro LA Neuropilin-1 Participates in Wound Angiogenesis. Am J Pathol 160, 289–296 (2002). [DOI] [PMC free article] [PubMed] [Google Scholar]
- 37.Hara T et al. Interactions between cancer cells and immune cells drive transitions to mesenchymal-like states in glioblastoma. Cancer Cell 39, 779–792.e11 (2021). [DOI] [PMC free article] [PubMed] [Google Scholar]
- 38.Moulson AJ, Squair JW, Franklin RJM, Tetzlaff W & Assinck P Diversity of Reactive Astrogliosis in CNS Pathology: Heterogeneity or Plasticity? Frontiers in Cellular Neuroscience 15, (2021). [DOI] [PMC free article] [PubMed] [Google Scholar]
- 39.Satoh J-I et al. Immunohistochemical characterization of microglia in Nasu-Hakola disease brains. Neuropathology 31, 363–375 (2011). [DOI] [PubMed] [Google Scholar]
- 40.Erwig MS et al. Anillin facilitates septin assembly to prevent pathological outfoldings of central nervous system myelin. Elife 8, e43888 (2019). [DOI] [PMC free article] [PubMed] [Google Scholar]
- 41.Jäkel S et al. Altered human oligodendrocyte heterogeneity in multiple sclerosis. Nature 566, 543–547 (2019). [DOI] [PMC free article] [PubMed] [Google Scholar]
- 42.Ximerakis M et al. Single-cell transcriptomic profiling of the aging mouse brain. Nature Neuroscience 22, 1696–1708 (2019). [DOI] [PubMed] [Google Scholar]
- 43.Keren-Shaul H et al. A Unique Microglia Type Associated with Restricting Development of Alzheimer’s Disease. Cell 169, 1276–1290.e17 (2017). [DOI] [PubMed] [Google Scholar]
- 44.Safaiyan S et al. White matter aging drives microglial diversity. Neuron 109, 1100–1117.e10 (2021). [DOI] [PubMed] [Google Scholar]
- 45.Ellwanger DC et al. Prior activation state shapes the microglia response to antihuman TREM2 in a mouse model of Alzheimer’s disease. Proc Natl Acad Sci U S A 118, e2017742118 (2021). [DOI] [PMC free article] [PubMed] [Google Scholar]
- 46.Scherneck S et al. Role of Zinc Finger Transcription Factor Zfp69 in Body Fat Storage and Diabetes Susceptibility of Mice. in Sensory and Metabolic Control of Energy Balance (eds. Meyerhof W., Beisiegel U. & Joost H-G.) 57–68 (Springer, 2010). doi: 10.1007/978-3-642-14426-4_6. [DOI] [PubMed] [Google Scholar]
- 47.Marques S et al. Oligodendrocyte heterogeneity in the mouse juvenile and adult central nervous system. Science 352, 1326–1329 (2016). [DOI] [PMC free article] [PubMed] [Google Scholar]
- 48.Yaffe Y et al. The myelin proteolipid plasmolipin forms oligomers and induces liquid-ordered membranes in the Golgi complex. J. Cell. Sci. 128, 2293–2302 (2015). [DOI] [PubMed] [Google Scholar]
- 49.Yu T & Lieberman AP Npc1 acting in neurons and glia is essential for the formation and maintenance of CNS myelin. PLoS Genet. 9, e1003462 (2013). [DOI] [PMC free article] [PubMed] [Google Scholar]
- 50.Kenigsbuch M et al. A shared disease-associated oligodendrocyte signature among multiple CNS pathologies. Nat Neurosci 25, 876–886 (2022). [DOI] [PMC free article] [PubMed] [Google Scholar]
- 51.Peng Q, Long CL, Malhotra S & Humphrey MB A Physical Interaction Between the Adaptor Proteins DOK3 and DAP12 Is Required to Inhibit Lipopolysaccharide Signaling in Macrophages. Sci. Signal. 6, (2013). [DOI] [PMC free article] [PubMed] [Google Scholar]
- 52.Turnbull IR & Colonna M Activating and inhibitory functions of DAP12. Nat Rev Immunol 7, 155–161 (2007). [DOI] [PubMed] [Google Scholar]
- 53.Wang S et al. TREM2 drives microglia response to amyloid-β via SYK-dependent and -independent pathways. Cell 185, 4153–4169.e19 (2022). [DOI] [PMC free article] [PubMed] [Google Scholar]
- 54.Lapenna A, De Palma M & Lewis CE Perivascular macrophages in health and disease. Nat Rev Immunol 18, 689–702 (2018). [DOI] [PubMed] [Google Scholar]
- 55.Haure-Mirande J-V et al. Deficiency of TYROBP, an adapter protein for TREM2 and CR3 receptors, is neuroprotective in a mouse model of early Alzheimer’s pathology. Acta Neuropathol 134, 769–788 (2017). [DOI] [PMC free article] [PubMed] [Google Scholar]
Methods-only References
- 56.Fonseka CY et al. Mixed-effects association of single cells identifies an expanded effector CD4+ T cell subset in rheumatoid arthritis. Sci Transl Med 10, eaaq0305 (2018). [DOI] [PMC free article] [PubMed] [Google Scholar]
- 57.Butler A, Hoffman P, Smibert P, Papalexi E & Satija R Integrating single-cell transcriptomic data across different conditions, technologies, and species. Nature Biotechnology 36, 411–420 (2018). [DOI] [PMC free article] [PubMed] [Google Scholar]
- 58.Hafemeister C & Satija R Normalization and variance stabilization of single-cell RNA-seq data using regularized negative binomial regression. Genome Biology 20, 296 (2019). [DOI] [PMC free article] [PubMed] [Google Scholar]
- 59.Finak G et al. MAST: a flexible statistical framework for assessing transcriptional changes and characterizing heterogeneity in single-cell RNA sequencing data. Genome Biology 16, 278 (2015). [DOI] [PMC free article] [PubMed] [Google Scholar]
- 60.Andreatta M & Carmona SJ UCell: Robust and scalable single-cell gene signature scoring. Comput Struct Biotechnol J 19, 3796–3798 (2021). [DOI] [PMC free article] [PubMed] [Google Scholar]
- 61.Zhou Y et al. Metascape provides a biologist-oriented resource for the analysis of systems-level datasets. Nature Communications 10, 1523 (2019). [DOI] [PMC free article] [PubMed] [Google Scholar]
- 62.Browaeys R, Saelens W & Saeys Y NicheNet: modeling intercellular communication by linking ligands to target genes. Nat Methods 17, 159–162 (2020). [DOI] [PubMed] [Google Scholar]
- 63.Zenkova D et al. phantasus: Visual and interactive gene expression analysis. (2022) doi: 10.18129/B9.bioc.phantasus. [DOI] [PMC free article] [PubMed] [Google Scholar]
- 64.Takeuchi R et al. Heterogeneity of cerebral TDP-43 pathology in sporadic amyotrophic lateral sclerosis: Evidence for clinico-pathologic subtypes. Acta Neuropathologica Communications 4, 61 (2016). [DOI] [PMC free article] [PubMed] [Google Scholar]
Associated Data
This section collects any data citations, data availability statements, or supplementary materials included in this article.
Supplementary Materials
Data Availability Statement
snRNA-seq differential expression gene lists with statistics are available as Supplementary Tables 3 and 6. All requests for human snRNA-seq data are promptly reviewed by the Brain Research Institute at Niigata University and Mihara Memorial Hospital (Isesaki, Japan) to verify if the request is subject to any intellectual property or confidentiality obligations. Human-related data not included in the paper were generated as part of clinical trials and may be subject to patient confidentiality. Any data and materials that can be shared will be released via a Material Transfer Agreement. Raw and processed mouse and human snRNA-seq data have been deposited to the Gene Expression Omnibus (GEO) database under accession number GSE190015. Processed data, UMAP coordinates and annotations for the human NHD snRNA-seq have also been made freely available to download and visualize at the University of California Santa Cruz Cell Browser (https://nhd-brain.cells.ucsc.edu). scRNA-seq data and microarray data on macrophage polarization were downloaded from GEO under accession number GSE199378 and GSE61298, respectively. Please contact the corresponding authors for additional information. Source data for Figures 2, 4, 5 and 6 are provided with the paper.