

Abstract
The T cell repertoire of healthy mice and humans harbors self-reactive CD4+ conventional T (Tconv) cells capable of inducing autoimmunity. Using T cell receptor profiling paired with in vivo clonal analysis of T cell differentiation, we identified Tconv cell clones that are recurrently enriched in non-lymphoid organs following ablation of Foxp3+ regulatory T (Treg) cells. A subset of these clones was highly proliferative in the lymphoid organs at steady state and exhibited overt reactivity to self-ligands displayed by dendritic cells, yet were not purged by clonal deletion. These clones spontaneously adopted numerous hallmarks of T follicular helper (Tfh) cells including expression of Bcl6 and PD-1, exhibited an elevated propensity to localize within B cell follicles at steady state, and produced IFN-γ in non-lymphoid organs following sustained Treg cell depletion. Our work identifies a naturally occurring population of self-reactive Tfh-like cells and delineates a previously unappreciated fate for self-specific Tconv cells.
Editor summary:
Savage & colleagues identify a population of CD4+ T cells within the endogenous repertoire that exhibit hallmarks of overt self-reactivity, spontaneously adopt a Tfollicular helper phenotype, and are enriched in non-lymphoid organs following sustained Treg cell depletion.
INTRODUCTION
T cells expressing αβ T cell receptors (TCRs) recognize short peptide antigens complexed with MHC molecules displayed on the surface of antigen presenting cells. Some developing αβ T cells express TCRs that recognize self-peptide/MHC complexes with high sensitivity, raising the possibility that such T cells could trigger autoimmune responses directed at self-constituents. Many T cells exhibiting overt reactivity to self-ligands are removed from the conventional T cell repertoire by deletion or differentiation into alternative T cell lineages1,2. However, substantial evidence suggests that these processes are imperfect. Analysis of CD8+ T cells reactive to an endogenous3 or model self-antigen4 demonstrated that self-specific T cells are not completely purged from the pre-immune repertoire. Consistent with these findings, studies using self-peptide/HLA class I tetramers demonstrated that tetramer-binding T cells can be detected in healthy human subjects5. Seminal work in mice demonstrated that inducible depletion of CD4+ Foxp3+ regulatory T (Treg) cells results in fatal autoimmunity in conventionally housed mice6,7, germ-free mice8, and germ-free mice raised on a peptide-free diet9. Thus, previous work demonstrates that the peripheral T cell repertoire harbors self-reactive Tconv cells with pathogenic potential, and that Foxp3+ Treg cells are required to restrain these cells.
Extensive evidence indicates that MHC class II (MHC-II)-restricted CD4+ T conventional (Tconv) cells play a key role in the pathogenesis of autoimmune disease. In humans, distinct human leukocyte antigen (HLA) class II alleles are associated with elevated risk for many autoimmune diseases, suggesting a key role for CD4+ T cells in promoting pathology10. In mice, adoptive transfer of CD4+ Tconv cells - but not CD8+ Tconv cells - into lymphopenic mice in the absence of Treg cells is sufficient to induce multi-organ autoimmunity11 and colitis12,13. Lastly, disruption of Qa-1-restricted ligand recognition by CD8+ regulatory T cells in mice leads to spontaneous emergence of autoantibodies and CD4+ Tconv cells displaying a Tfh phenotype14. Thus, despite multi-layered tolerance mechanisms, the immune repertoire of mice and humans harbors self-reactive CD4+ Tconv cells capable of inducing or promoting autoimmunity under settings of immune dysregulation.
With the above concepts in mind, it is critical to define the nature of self-reactive CD4+ Tconv cells that populate the peripheral repertoire. Previous studies in mice estimated that 1–4% of CD4+ and CD8+ conventional T cells undergo TCR-dependent proliferation following Treg cell ablation15,16, and showed that self-reactive cells originate from both the antigen-experienced and naive-phenotype conventional T cell pools15. To date, at least two phenotypic subsets of antigen-experienced CD4+ Tconv cells have been defined in the secondary lymphoid organs of unprimed healthy mice housed in specific pathogen-free conditions. Multiple studies have defined a population of T-bet-expressing “innate memory” CD4+ T cells that exhibit hallmarks of antigen experience and can contribute to host defense against pathogens via rapid production of IFN-γ17–19. Additionally, Kalekar et al. defined a population of “anergic-phenotype” CD44hi FR4hi CD73hi CD4+ Tconv cells that display hallmarks of T cell anergy, and can serve as precursors of peripherally induced Treg cells20. However, the extent to which these populations define the full landscape of putative self-reactive Tconv cell subsets remains unknown, and it remains unclear whether these populations contribute to autoimmune reactions or inflammatory disease under settings of immune dysregulation.
Within this framework, there remain significant gaps in our understanding of self-specific Tconv cells that populate the endogenous repertoire. Specifically, there is a key need for clonal studies in which different facets of the biology of individual self-specific CD4+ T cell clones can be defined, including developmental trajectory in the thymus, differentiation and function in the periphery, and the nature of ligands recognized by these cells. Here, we utilized TCR sequencing to identify putative self-reactive CD4+ Tconv clones within the endogenous repertoire that are enriched in non-lymphoid organs following sustained Treg cell ablation. Through the study of monoclonal TCR “retrogenic” mice, we demonstrate that multiple recurrent Tconv cell clones identified in this screen exhibit common properties at steady state, including widespread activation and ex vivo reactivity to self-ligands displayed by splenic dendritic cells, adoption of a Bcl6hi PD-1hi phenotype, and an elevated propensity to localize within B cell follicles. Thus, our collective work identifies a naturally occurring population of overtly self-reactive Tfh-like CD4+ T cells that populate the endogenous repertoire of healthy mice and infiltrate non-lymphoid organs when released from Treg cell-mediated suppression.
RESULTS
Treg ablation drives enrichment of recurrent Tconv clones
To identify putative self-reactive CD4+ Tconv cell clones in the endogenous repertoire, we surveyed the TCRs expressed by CD4+ Tconv cells that infiltrate select non-lymphoid organs following sustained Treg cell ablation. We reasoned that Tconv clones enriched in target organs in this setting were likely to include self-reactive clones that are mobilized and expanded upon release from Treg cell-mediated suppression. To do this, we used male mice expressing the Foxp3DTR-EGFP allele6 plus a fixed transgenic TCRβ chain (TCRβtg)21,22. The Foxp3DTR-EGFP allele drives expression of the human diphtheria toxin receptor (DTR) and the enhanced green fluorescent protein (EGFP) reporter on Foxp3-expressing cells, enabling inducible ablation of Treg cells via administration of diphtheria toxin (DT) and identification of CD4+ Tconv cells lacking EGFP expression, respectively. By fixing the TCRβ chain using the TCRβtg, a complete survey of the TCRαβ repertoire can be obtained via deep sequencing of transcripts encoding TCRα chains22–25. Seven male Foxp3DTR-EGFP TCRβtg mice were subjected to sustained Treg cell ablation by periodic DT administration, and CD4+ Foxp3neg Tconv cells were isolated at the endpoint from various non-lymphoid organs, including the prostate and salivary glands (Fig. 1a,b). Samples from five mice were then subjected to deep sequencing of transcripts encoding TCRα chains using the iRepertoire platform.
Fig. 1 |. Recurrent CD4+ Tconv clones are detected in non-lymphoid organs of Treg cell-depleted mice.
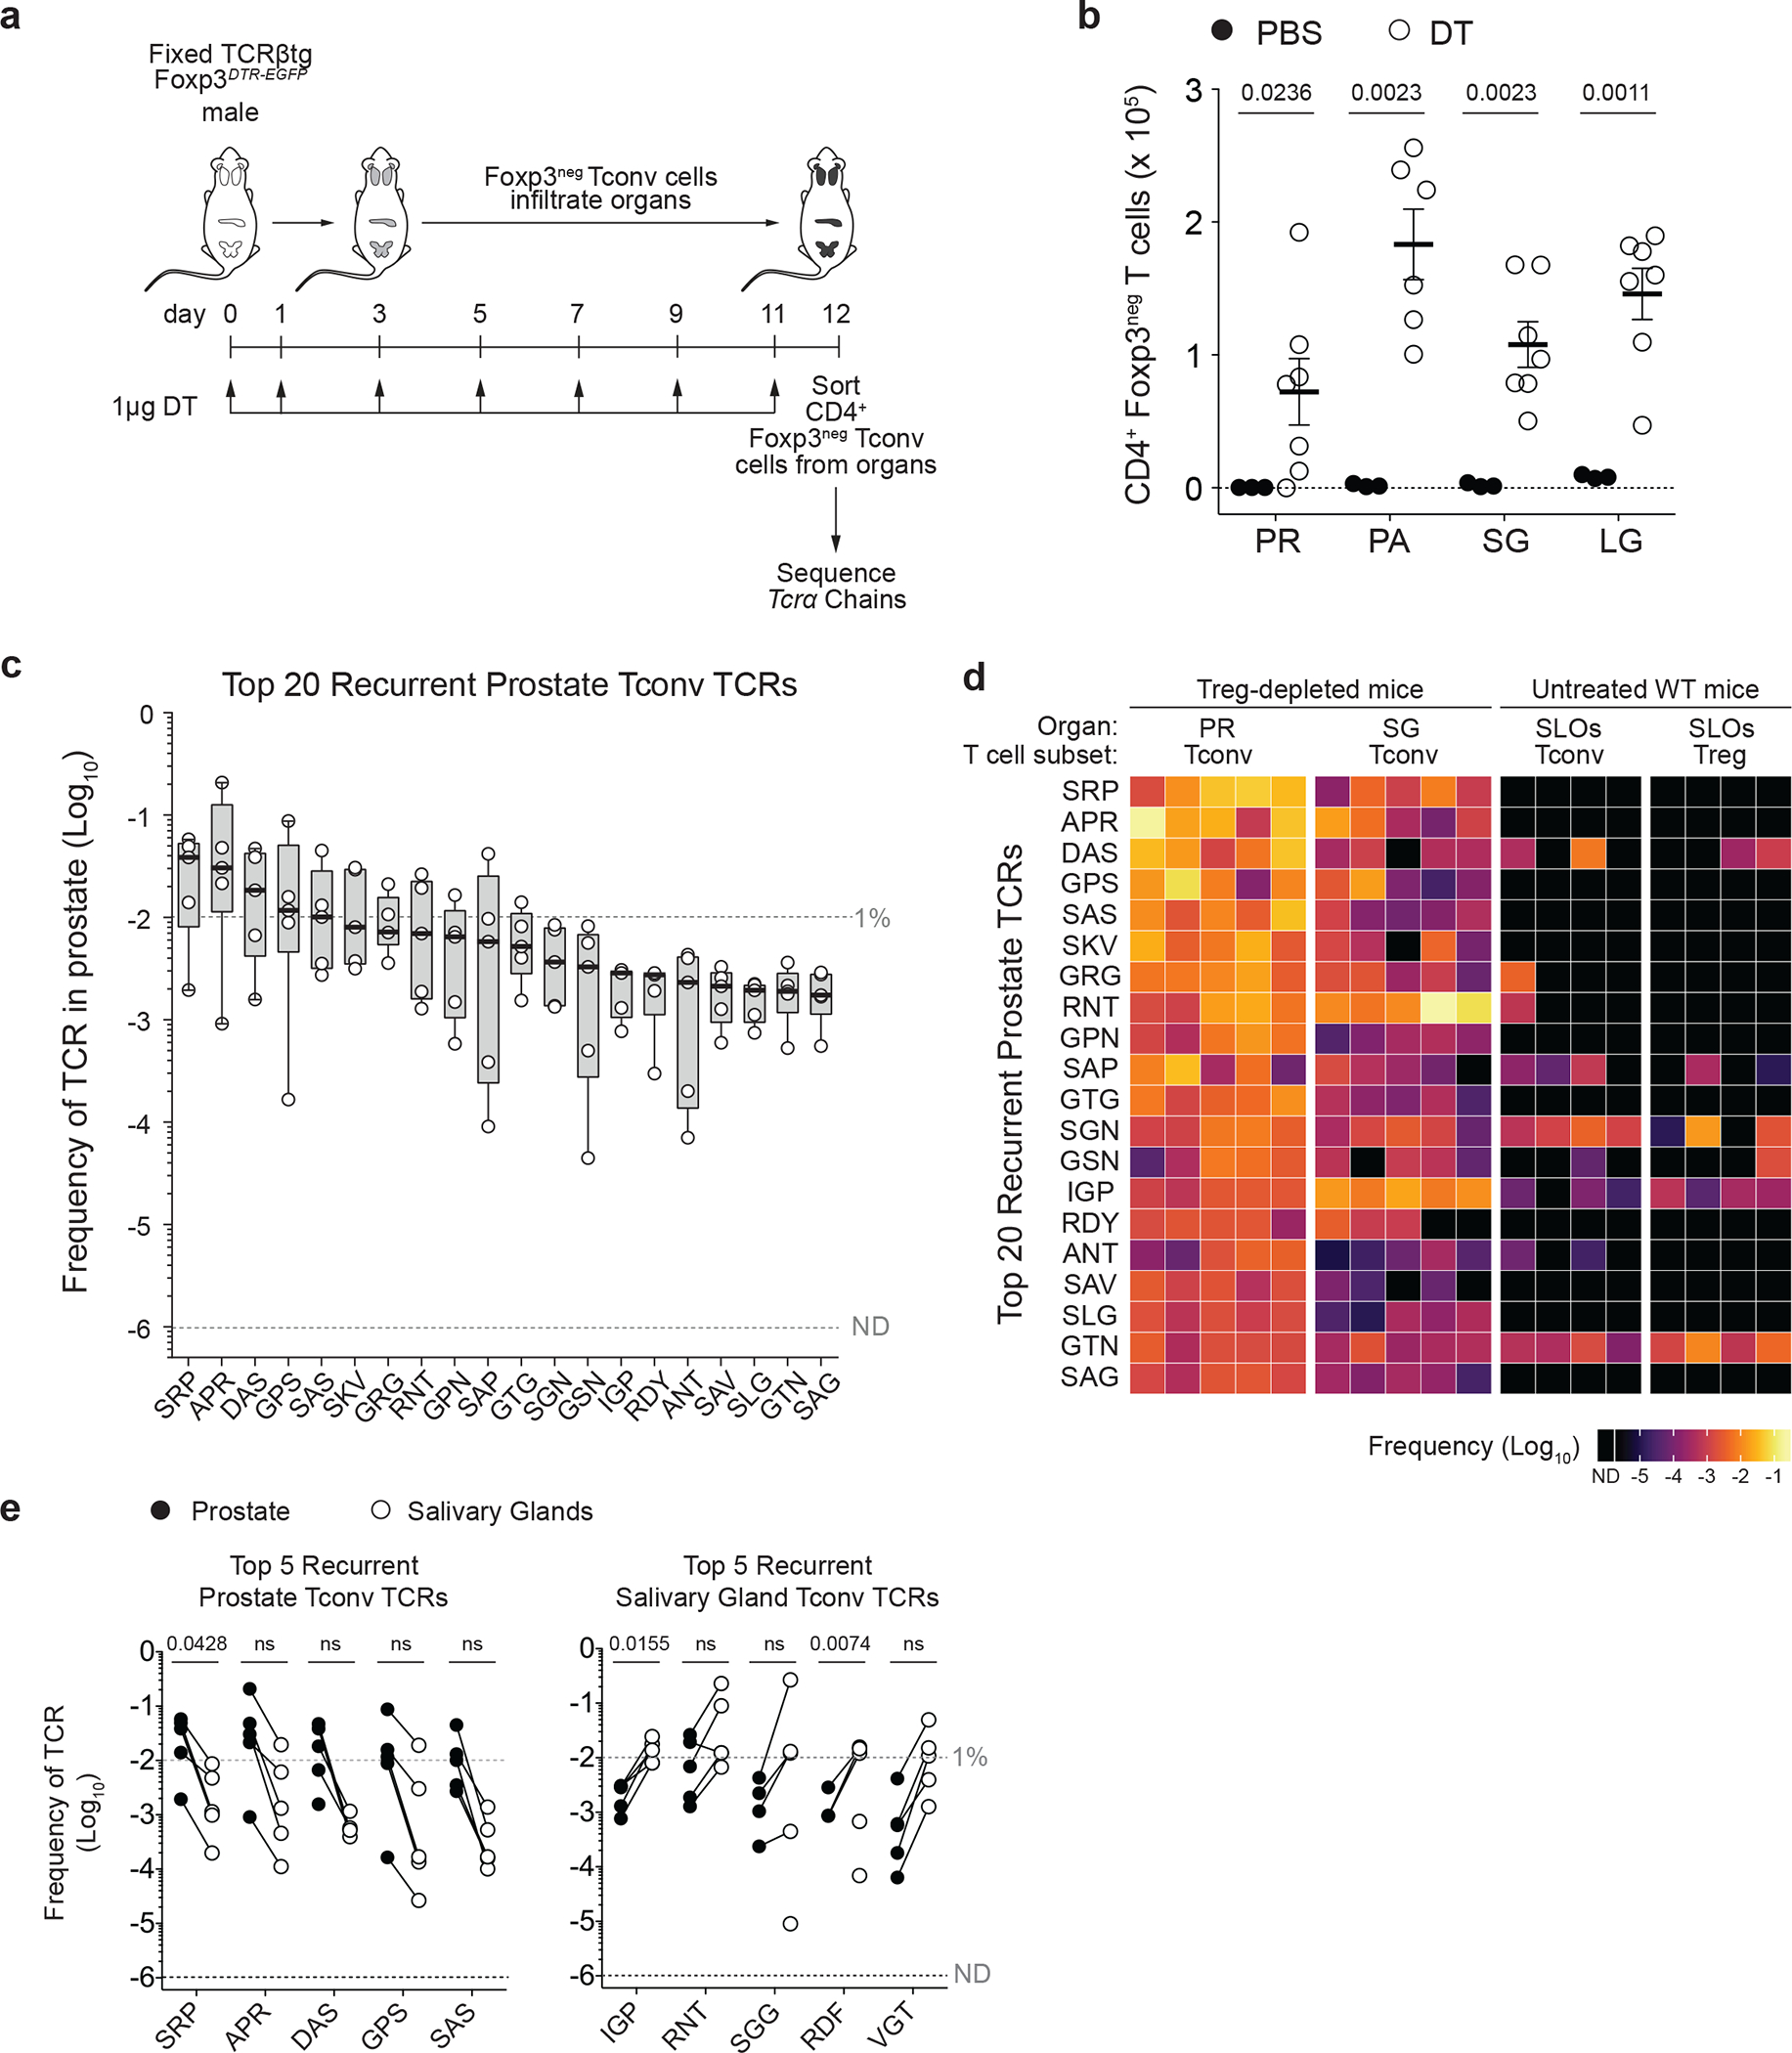
a, Schematic. CD4+Foxp3neg Tconv cells were purified from select non-lymphoid organs of 6–8 week-old male TCRβtg Foxp3DTR-EGFP mice subjected to sustained Treg ablation via diphtheria toxin (DT) administration. Samples from five mice were subjected to Tcra sequencing using the iRepertoire platform (see Methods).
b, Absolute numbers of CD4+Foxp3neg Tconv cells recovered from the prostate (PR), pancreas (PA), salivary glands (SG), and lacrimal glands (LG) of Treg cell-depleted mice (open circles; n = 7) and PBS-treated mice (closed circles; n = 3). Error bars represent means ± SEM.
c, Box plots displaying the frequency of the top 20 most abundant recurrent TCRα sequences expressed by Tconv cells in the prostate of Treg cell-depleted mice (n = 5). Full TCRα sequence information is listed in Supplementary Table 2. Boxes represent interquartile ranges (IQRs; Q1-Q3 frequencies), bold lines represent median, whiskers represent maximum and minimum values.
d, Heat map displaying the 20 TCRα sequences from c and their corresponding frequency in four groups of samples: Tconv cells from the PR (n = 5) or SG (n = 5) of Treg-depleted Foxp3DTR-EGFP males, plus Tconv (n = 4) or Treg (n = 4) cells from the pooled secondary lymphoid organs (SLOs) of untreated wild-type Foxp3GFP males. Data from the latter two groups are from ref22. ND = not detected.
e, Left, frequency of the five most abundant Tconv TCRα chains from the PR of Treg-depleted mice (closed circles) and their frequency amongst Tconv cells from the SG of the same mice (open circles). Right, the same plots for the five most abundant Tconv TCRα chains from the SG of Treg-depleted mice. Paired samples from the same mouse are indicated by a connecting line. n = 5.
Data pooled from three independent experiments. Symbols represent individual mice. In b, two-sided p values were calculated using Welch’s t-tests with Holm-Šídák’s test for multiple comparisons. In e, two-sided p values were calculated using paired t-tests. ns, p ≥ 0.05, not significant. Source data contain exact p values and group sizes.
We focused our study on the analysis of TCRα chains expressed by CD4+ Tconv cell clones isolated from the prostate, based on the availability of additional reference data sets for prostate-associated Tconv cells (described below). TCRα sequences of salivary gland-infiltrating Tconv cells from Treg-depleted mice served as a comparative control. We isolated an average of ~7.22 × 10⁴ cells per prostate and ~1.08 × 10⁵ cells per salivary gland, and obtained an average of ~8.96 × 10⁵ in-frame Tcra sequence reads per sample (Supplementary Table 1). Collectively, the prostatic repertoire contained 17,154 distinct TCRα clonotypes (defined by the amino acid sequence of the predicted TCRα complementarity determining region 3 (CDR3α), of which 265 TCRα clonotypes were recurrently detected across all five prostate samples sequenced (Supplementary Table 1). For TCRα nomenclature, a recurrent TCRα clonotype is denoted using a three-letter code that reflects the amino acids at positions 3–5 of the CDR3α. For example, a clonotype with CDR3α sequence AVSRPGGGSNYKLT is denoted “SRP”.
Quantification revealed that the 20 most prevalent prostate-associated Tconv cell clones found recurrently in all five prostate samples (Fig. 1c) accounted for ~23.9% ± 6.7% of all Tconv cells within the prostate, suggestive of TCR-dependent enrichment of select clones. By quantifying the frequency of these clones in other reference data sets from male TCRβtg mice, we found that these clonotypes were typically found at low frequencies amongst Tconv cells and Treg cells from the secondary lymphoid organs (SLOs) of healthy mice (collectively accounting for 1.18% ± 0.10% of Tconv cell clones and 0.43% ± 0.15% of Treg cell clones from the SLOs, Fig. 1d and ref22), and were rare or not detected amongst Tconv cells in the prostates of Aire-deficient mice (totaling ~1.53% ± 1.77% of all Tconv cells within Aire−/− prostates, Extended Data Fig. 1 and ref22) and in the prostate tumors of TRAMP mice (totaling ~0.93% ± 1.23% of all Tconv cells within the prostate, Extended Data Fig. 1 and Supplementary Table 1). These findings demonstrate that the recurrent Tconv clones that infiltrate the prostate following Treg cell ablation did not simply reflect the influx of the most abundant Tconv cell clones within the endogenous repertoire, and were distinct from the Tconv cell clones observed in other settings of prostatic T cell infiltration. Notably, the most abundant prostate-associated Tconv clones observed following Treg cell depletion were also detected in the salivary glands of the same mice, albeit at lower frequencies (Fig. 1e). Likewise, the most abundant Tconv cell clones isolated from the salivary glands in this setting were also found in the prostates at lower frequencies (Fig. 1e). In all, our collective data demonstrate that Treg cell ablation drives the recurrent enrichment of select Tconv cell clones into the prostate, that the observed clonotype enrichment is unique to the setting of Treg cell depletion, and that recurrent organ-infiltrating clones are also detected in distal target organs.
Select Tconv clones exhibit hallmarks of self-reactivity
To gain insight into the biology of the prostate-associated Tconv cell clones defined above, we generated a series of TCR “retrogenic” (TCRrg) mice expressing distinct TCRα chains paired with the fixed TCRβtg, as previously described25,26. Using this approach, donor Tcra−/− Cd4-Cre bone marrow cells expressing the fixed TCRβtg and transduced with a TCRα- and Thy1.1-encoding construct are engrafted into irradiated mice, leading to the generation of a minor population of monoclonal Thy1.1+ TCRrg T cells that can be readily identified amongst replete populations of B cells and host-derived T cells (Extended Data Fig. 2). We selected 13 recurrent prostate-associated Tconv clones for further study, with an emphasis on clones that utilized unique combinations of TRAV and TRAJ segments (Supplementary Table 2). We assessed antigen reactivity of these T cell clones using two approaches. First, we analyzed the extent to which TCRrg cells expressing a given TCR displayed hallmarks of activation and prior antigen experience in TCRrg hosts. Second, we FACS-purified CD4+ T cells from TCRrg mice, labeled cells with the proliferation dye CellTrace Violet (CTV), and examined the proliferation of labeled cells following in vitro co-culture with primary splenic dendritic cells (DCs) in the presence of interleukin-2 (IL-2).
Analysis of primary TCRrg mice expressing each of the 13 TCRs revealed that clones could be broadly classified into three categories. In the first category (denoted as “Group 1” clones), three of 13 clones were phenotypically naive in primary TCRrg mice (Fig. 2a,b; Extended Data Fig. 3; Supplementary Table 2). Group 1 clones also failed to proliferate over background when assayed for reactivity to endogenous ligands displayed by splenic DCs in vitro (Fig. 2c,d; Extended Data Fig. 4). Moreover, addition of prostatic protein extracts from wild-type or Treg cell-depleted male mice to the co-culture system failed to induce T cell proliferation of Group 1 clones (Extended Data Fig. 4c,d). TCRrg T cells expressing Group 1 TCRs were not intrinsically dysfunctional, as addition of microbeads coated with anti-CD3/anti-CD28 antibodies was sufficient to induce proliferation (Extended Data Fig. 4c,d). In the second category of clones (denoted as “Group 2” clones), six of 13 clones exhibited variable patterns of low-level proliferation in the in vitro culture system (Extended Data Fig. 4a,b) and appeared phenotypically naïve in most SLOs when expressed in TCRrg mice (data not shown).
Fig. 2 |. Multiple recurrent prostate-infiltrating CD4+ Tconv clones exhibit hallmarks of steady-state activation and reactivity to MHC-II-restricted self-ligands.
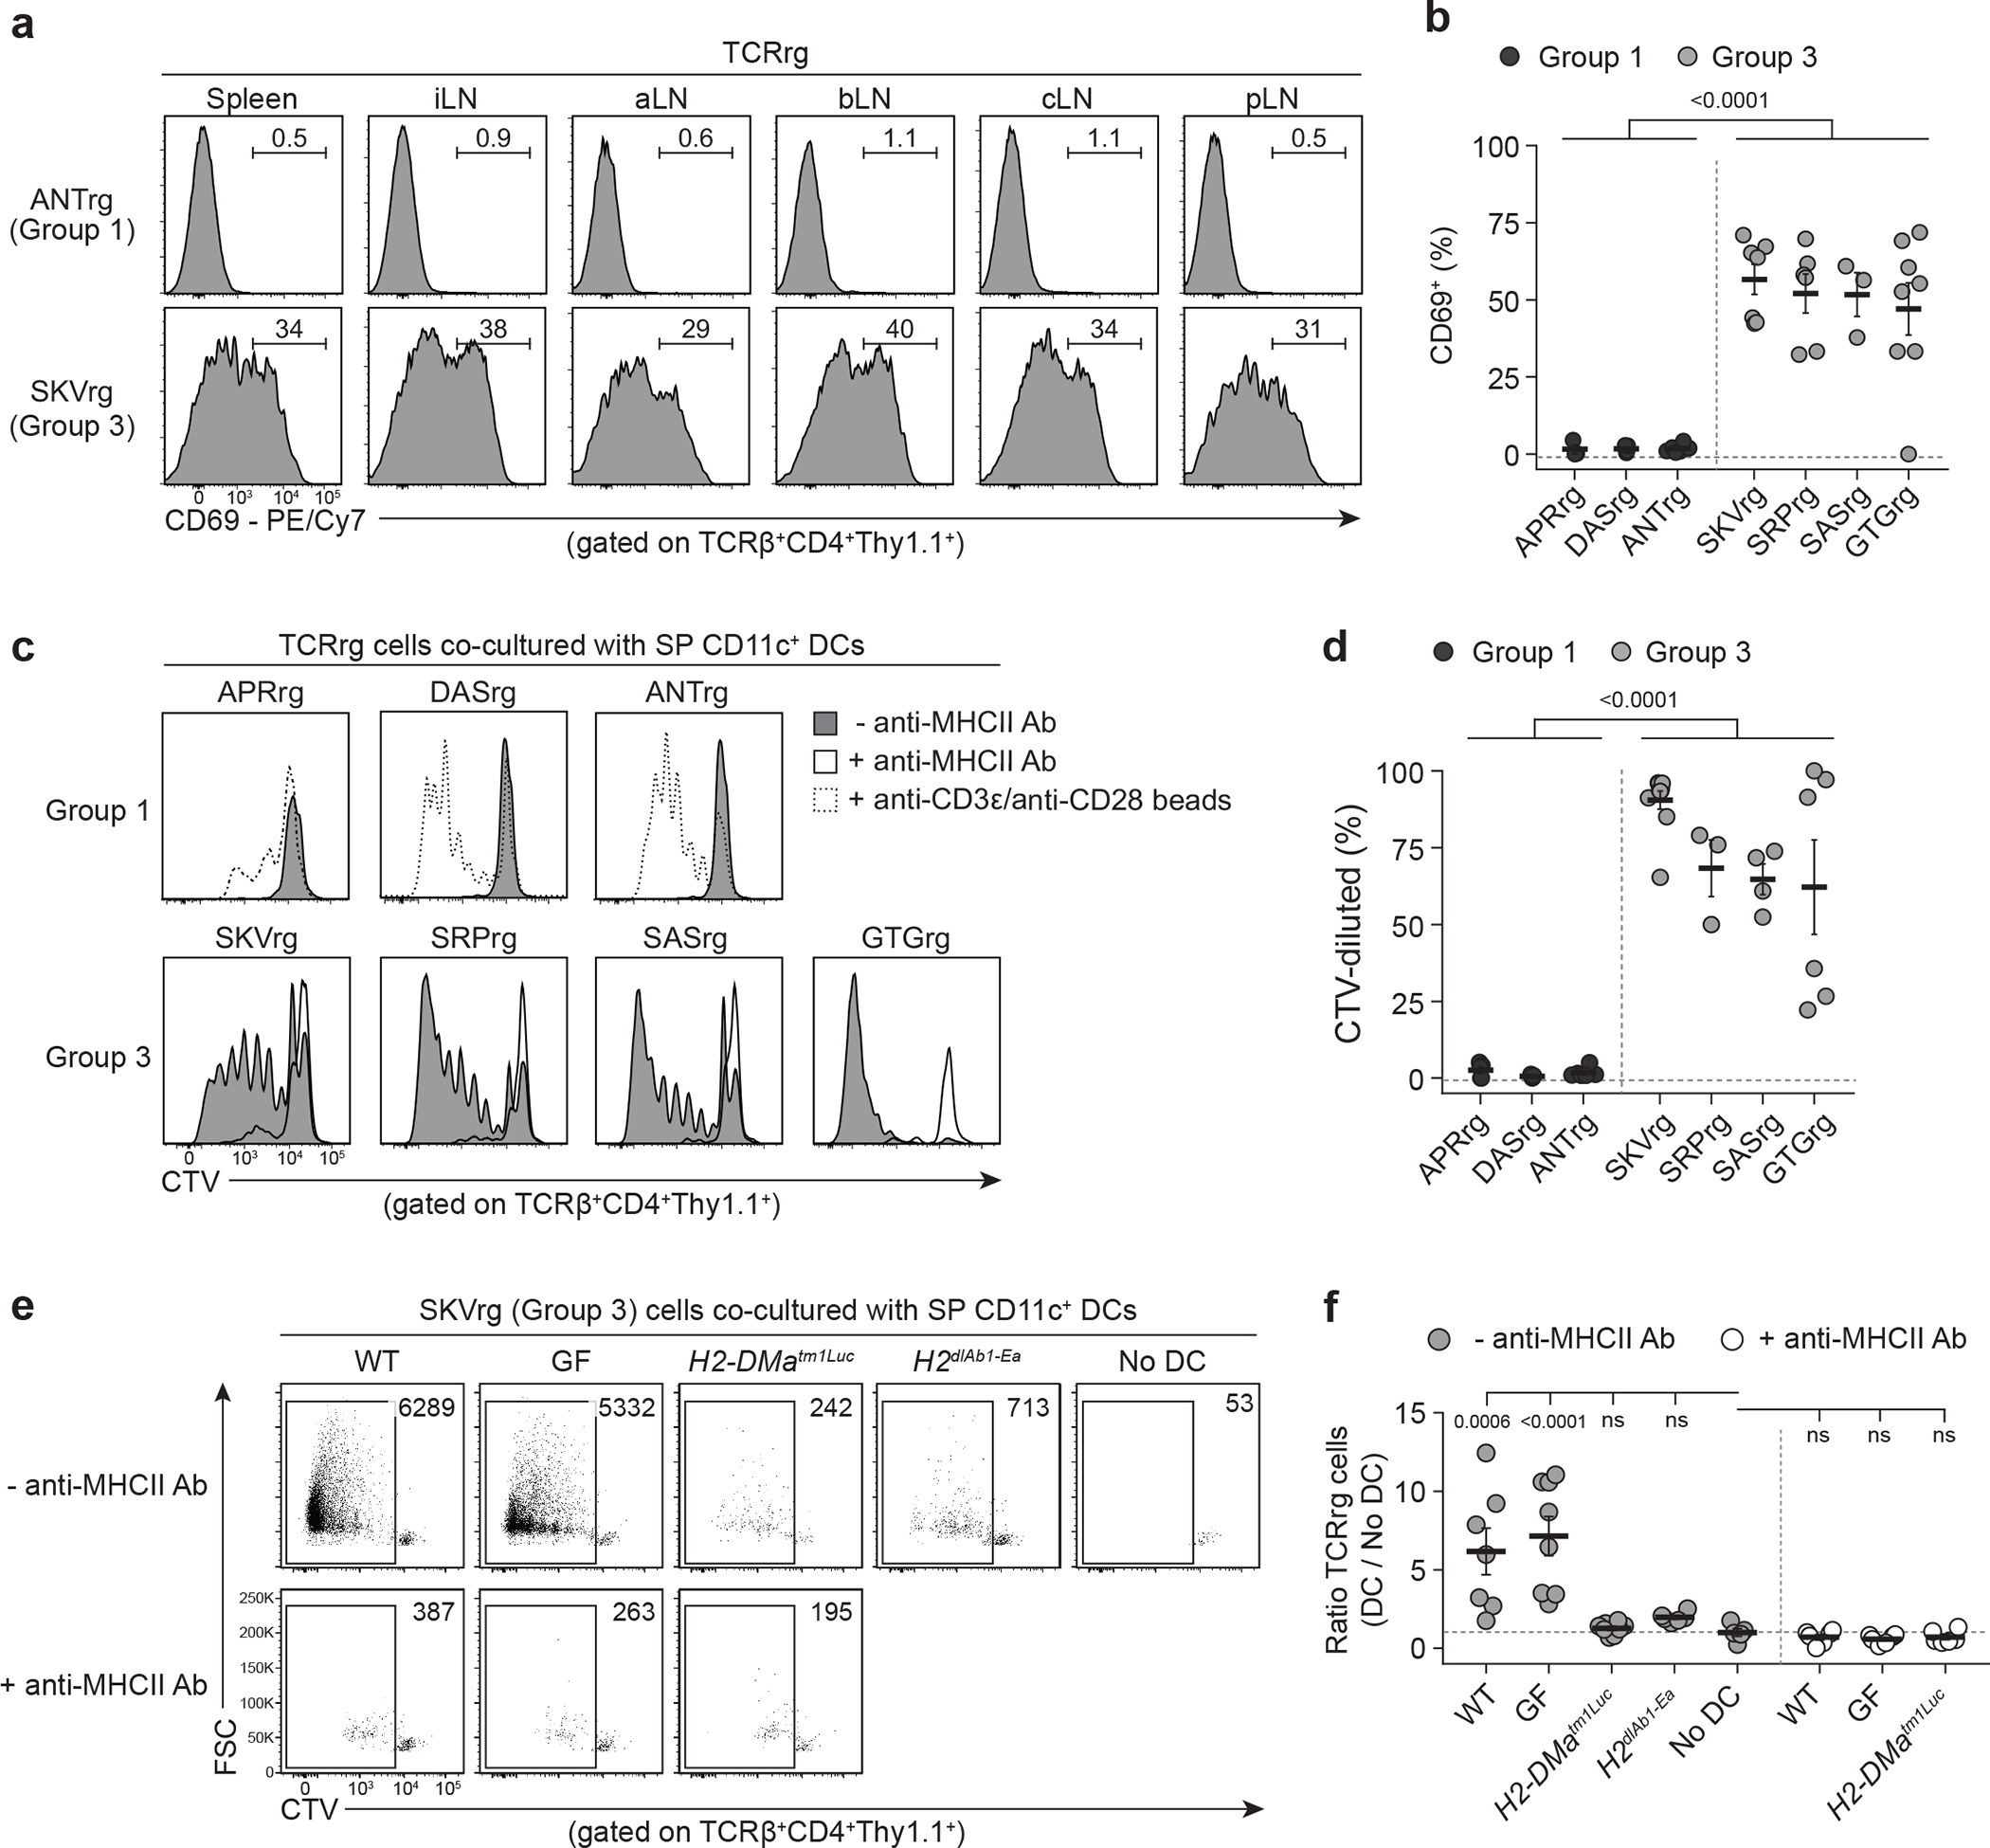
Three Group 1 and four Group 3 TCRs were cloned and expressed as TCRrg mice (see Methods).
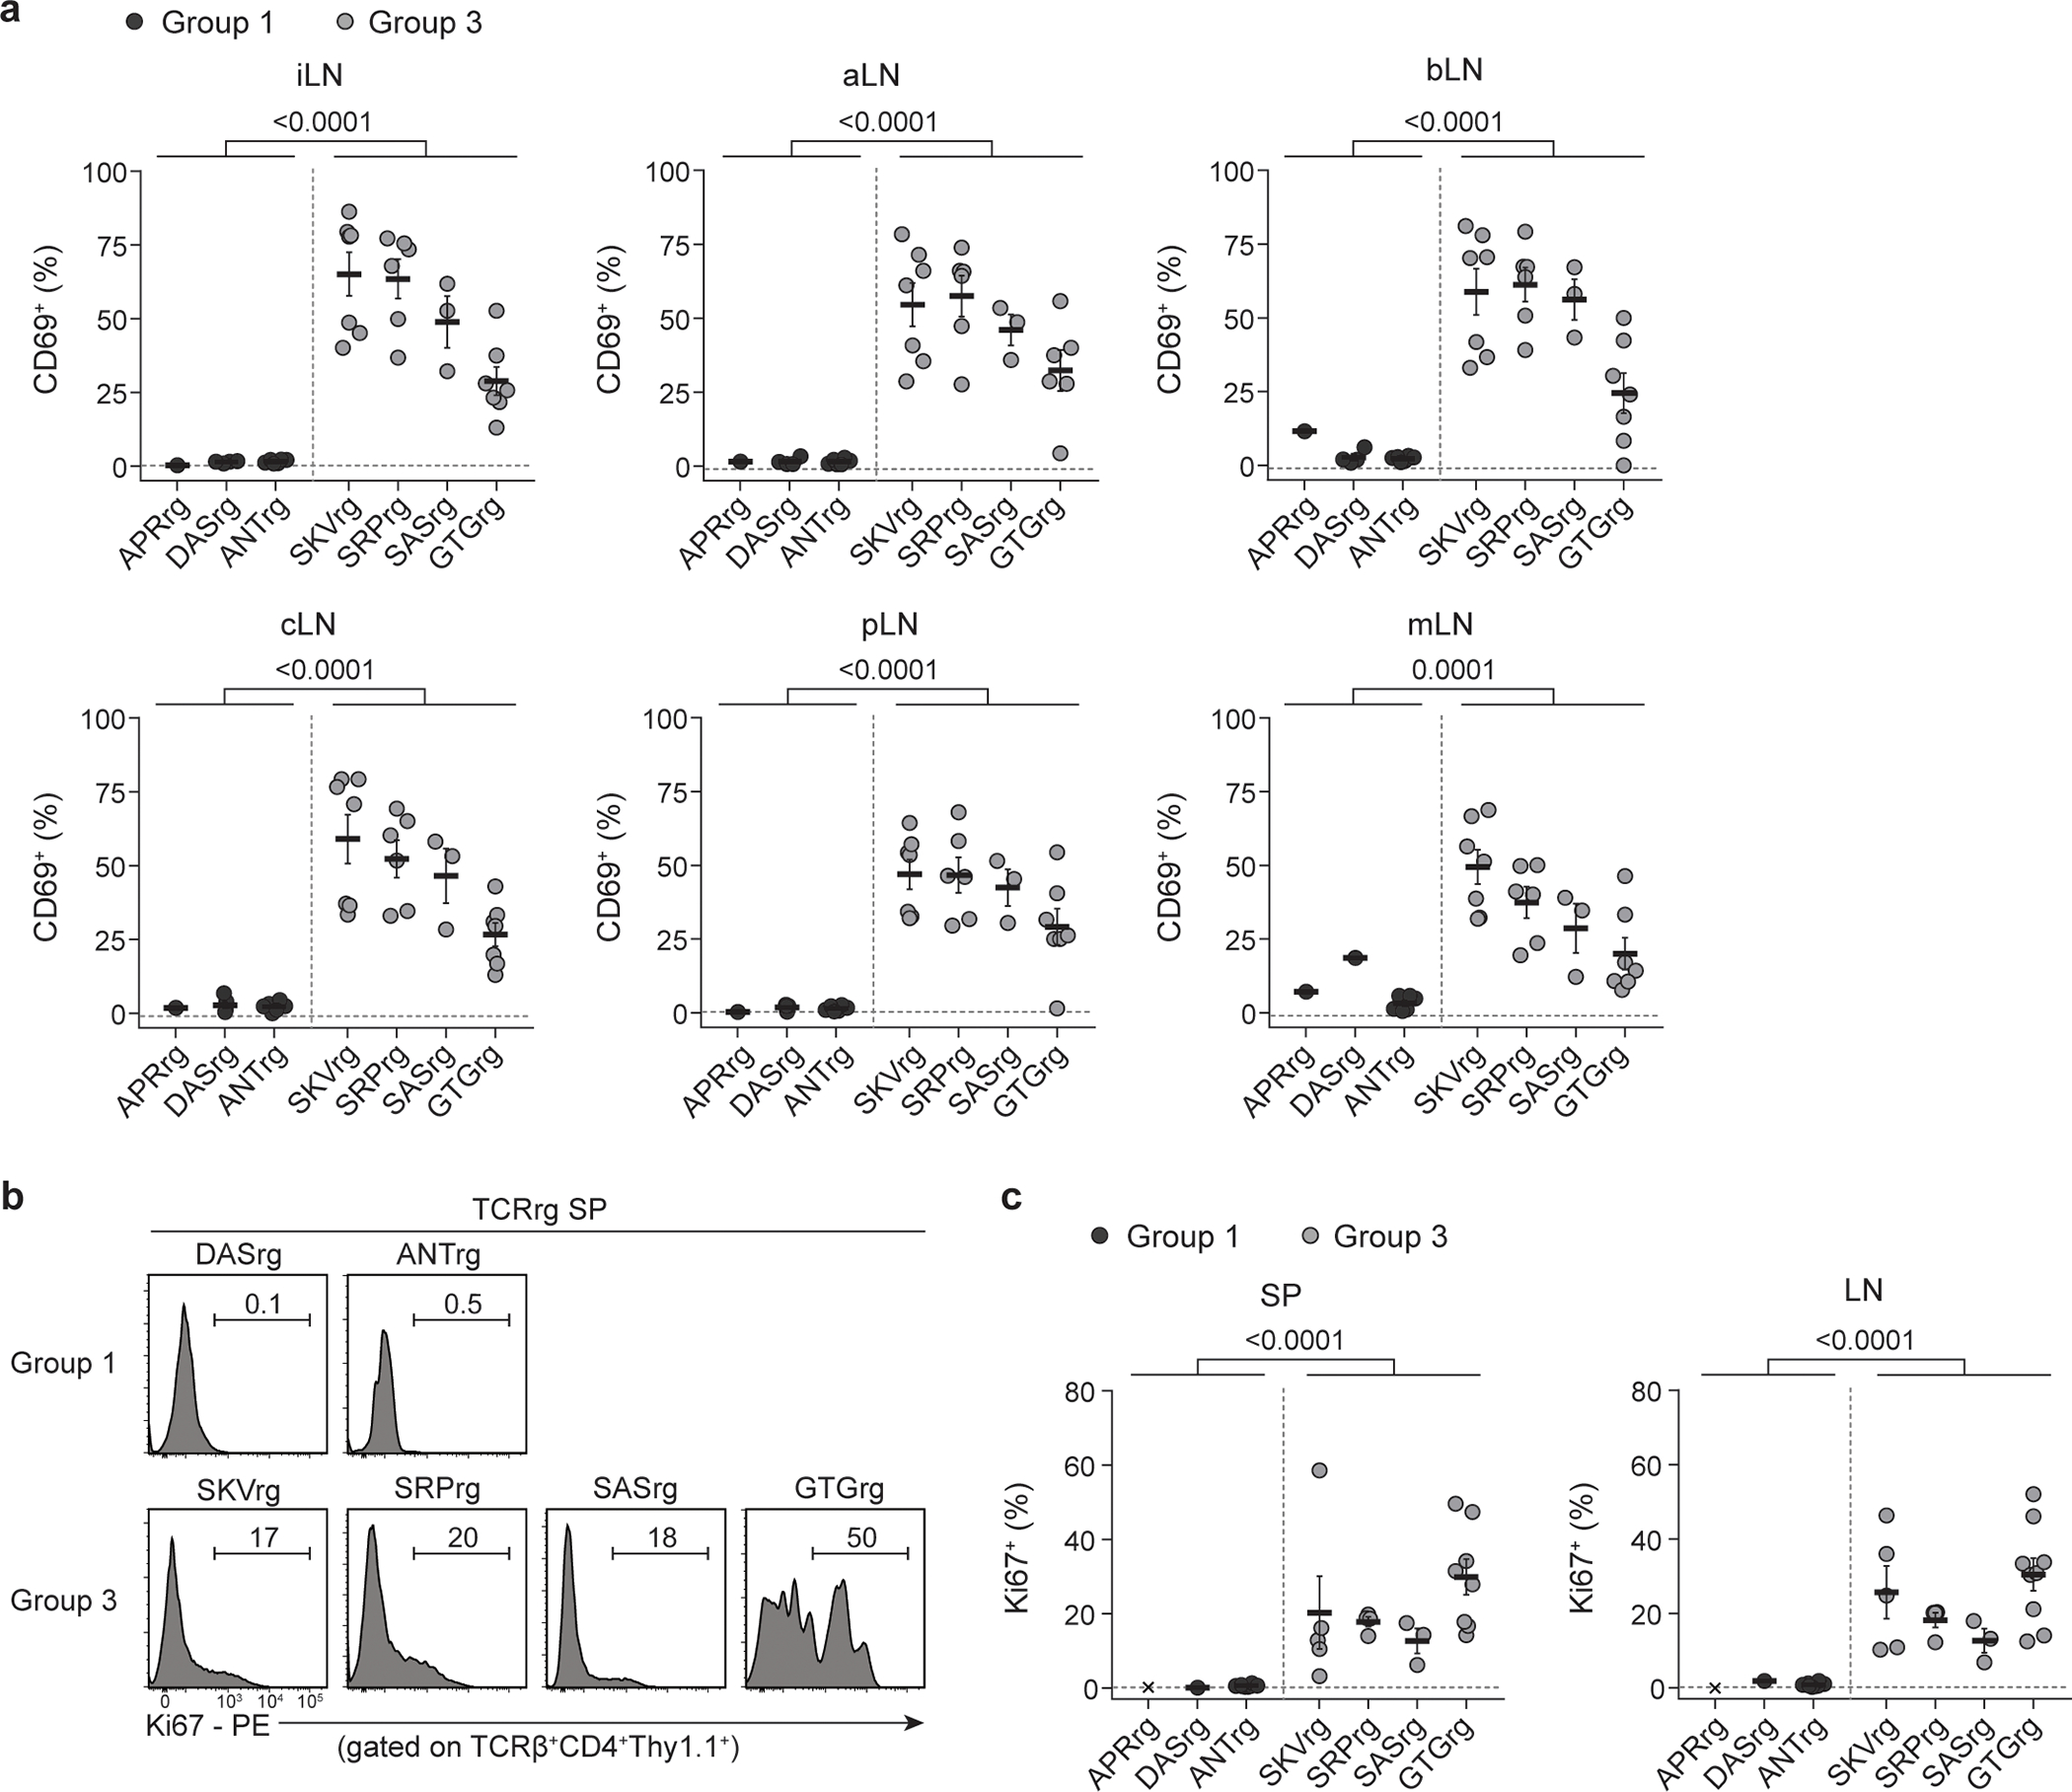
a, Histograms of CD69 expression by Group 1 ANT (top) and Group 3 SKV (bottom) TCRrg T cells from the spleen and inguinal (iLN), axillary (aLN), brachial (bLN), cervical (cLN), and para-aortic (pLN) lymph nodes of TCRrg mice.
b, Summary plot from a showing the percentage of splenic Group 1 (black symbols) and Group 3 (gray symbols) TCRrg T cells expressing CD69 (n = 3–8 per TCRrg). Data pooled from eleven independent experiments.
c, TCRrg T cells were labeled with CellTraceViolet (CTV) and co-cultured with splenic CD11c+ dendritic cells (DCs) and mouse recombinant IL-2 (mrIL-2) ± anti-MHCII blocking antibody for 5 days. Histograms of CTV dilution are shown. TCRrg cells co-cultured with anti-CD3ε/anti-CD28 MACSiBead particles served as positive controls (dashed histograms).
d, Summary plot from c depicting the percentage of CTV-diluted Group 1 and Group 3 TCRrg T cells (n = 3–10 per TCRrg). Data pooled from eight independent experiments. Each symbol represents an individual co-culture.
e, Forward scatter (FSC) vs. CTV fluorescence for Group 3 SKV TCRrg cells co-cultured with splenic CD11c+ DCs as in c. DCs from the following strains were used: WT, C57BL/6; GF, germ-free C57BL/6; H2-DM-deficient H2-DMatm1Luc; I-Ab-deficient H2dlAb1-Ea.
f, Summary plot from e depicting recovery of Group 3 SKV TCRrg cells, displayed as a ratio of TCRrg cell number within each DC-containing culture divided by the mean of TCRrg cell number within cultures lacking DCs in a given experiment (n = 5–8 per condition). Data pooled from two independent experiments. Symbols represent individual cultures.
Bold lines and error bars represent means ± SEM. For b and d, two-sided p values were calculated using Mann-Whitney U-test for pooled Group 1 clones versus pooled Group 3 clones. For f, two-sided p values were calculated for the comparison of an experimental group to the “No DC” control using ordinary one-way ANOVA with Dunnett’s test for multiple comparisons. ns, p ≥ 0.05, not significant. Source data contain exact p values and group sizes.
Strikingly, four of the 13 recurrent Tconv cell clones exhibited hallmarks of overt reactivity to widespread self-ligands. These clones were denoted as “Group 3” clones, and included SRP, SKV, SAS, and GTG (Supplementary Table 2). In TCRrg mice expressing these TCRs, a large fraction of TCRrg CD4+ T cells expressed CD69 and Ki67 throughout all SLOs analyzed (Fig. 2a,b; Extended Data Fig. 3). In addition, co-culture with splenic DCs in the presence of IL-2 induced robust MHC class II (MHC-II)-dependent proliferation of Group 3 clones without addition of exogenous antigens (Fig. 2c,d; Extended Data Fig. 4a,b). Group 3 clones failed to proliferate following co-culture with splenic DCs from H2-DMa−/− mice (Fig. 2e,f), which predominantly present MHC-II molecules complexed with the invariant chain-derived CLIP peptide due to deficiencies in peptide exchange27, indicating that the observed reactivity is peptide-dependent. Lastly, Group 3 clones proliferated robustly upon co-culture with splenic DCs isolated from germ-free mice (Fig. 2e,f), indicating that the ligands recognized by Group 3 clones are not derived from commensal bacteria. Taken together, our observations in vivo and in vitro indicate that Group 3 clones exhibit overt reactivity to MHC-II-restricted self-ligands. We therefore embarked on a more focused clonal analysis of the biology of Group 3 Tconv cell clones.
Group 3 clones adopt features of T-follicular helper cells
To gain a better understanding of the biology of Group 3 clones, we employed a two-step approach in which Group 3 T cells were analyzed by RNA sequencing and the expression of gene products of interest was validated by flow cytometry (Fig. 3; Extended Data Fig. 5). For transcriptional profiling, we generated TCRrg mice expressing the Group 3 SAS TCR, purified CD4+ T cells from the pooled SLOs, and subjected these samples to RNA sequencing (Extended Data Fig. 5a). In parallel, we analyzed CD4+ T cells from TCRrg mice expressing the Group 1 ANT TCR, for which T cells are phenotypically naïve and quiescent in the periphery (Fig. 2a,b). We first performed gene set enrichment analysis (GSEA)28 in which the genes upregulated in SAS relative to ANT T cells were compared with previously defined sets of genes upregulated by various T helper subsets29–36, many of which were defined following in vitro polarization or active in vivo immunization. This failed to identify a statistically significant gene set enrichment (Extended Data Table 1), highlighting the unique nature of Group 3 SAS T cells. However, curation of differentially expressed genes revealed that Group 3 SAS T cells were enriched for numerous transcripts encoding factors that are commonly expressed by T-follicular helper (Tfh) cells, which provide help to B cells during germinal center reactions37–39 (Fig. 3a,b). These transcripts included the canonical Tfh genes Pdcd1 (encoding PD-1), Cxcr5, Icos, Tox240, Bcl6 (encoding the Tfh lineage-defining transcription factor Bcl6)41, and Il21 (encoding the Tfh signature cytokine IL-21). In addition, Group 3 SAS T cells were enriched for transcripts encoding the gene Eomes (Fig. 3a,b), which encodes a transcription factor involved in the differentiation of effector and memory T cells.
Fig. 3 |. Group 3 clones express common hallmarks of T follicular helper cells.
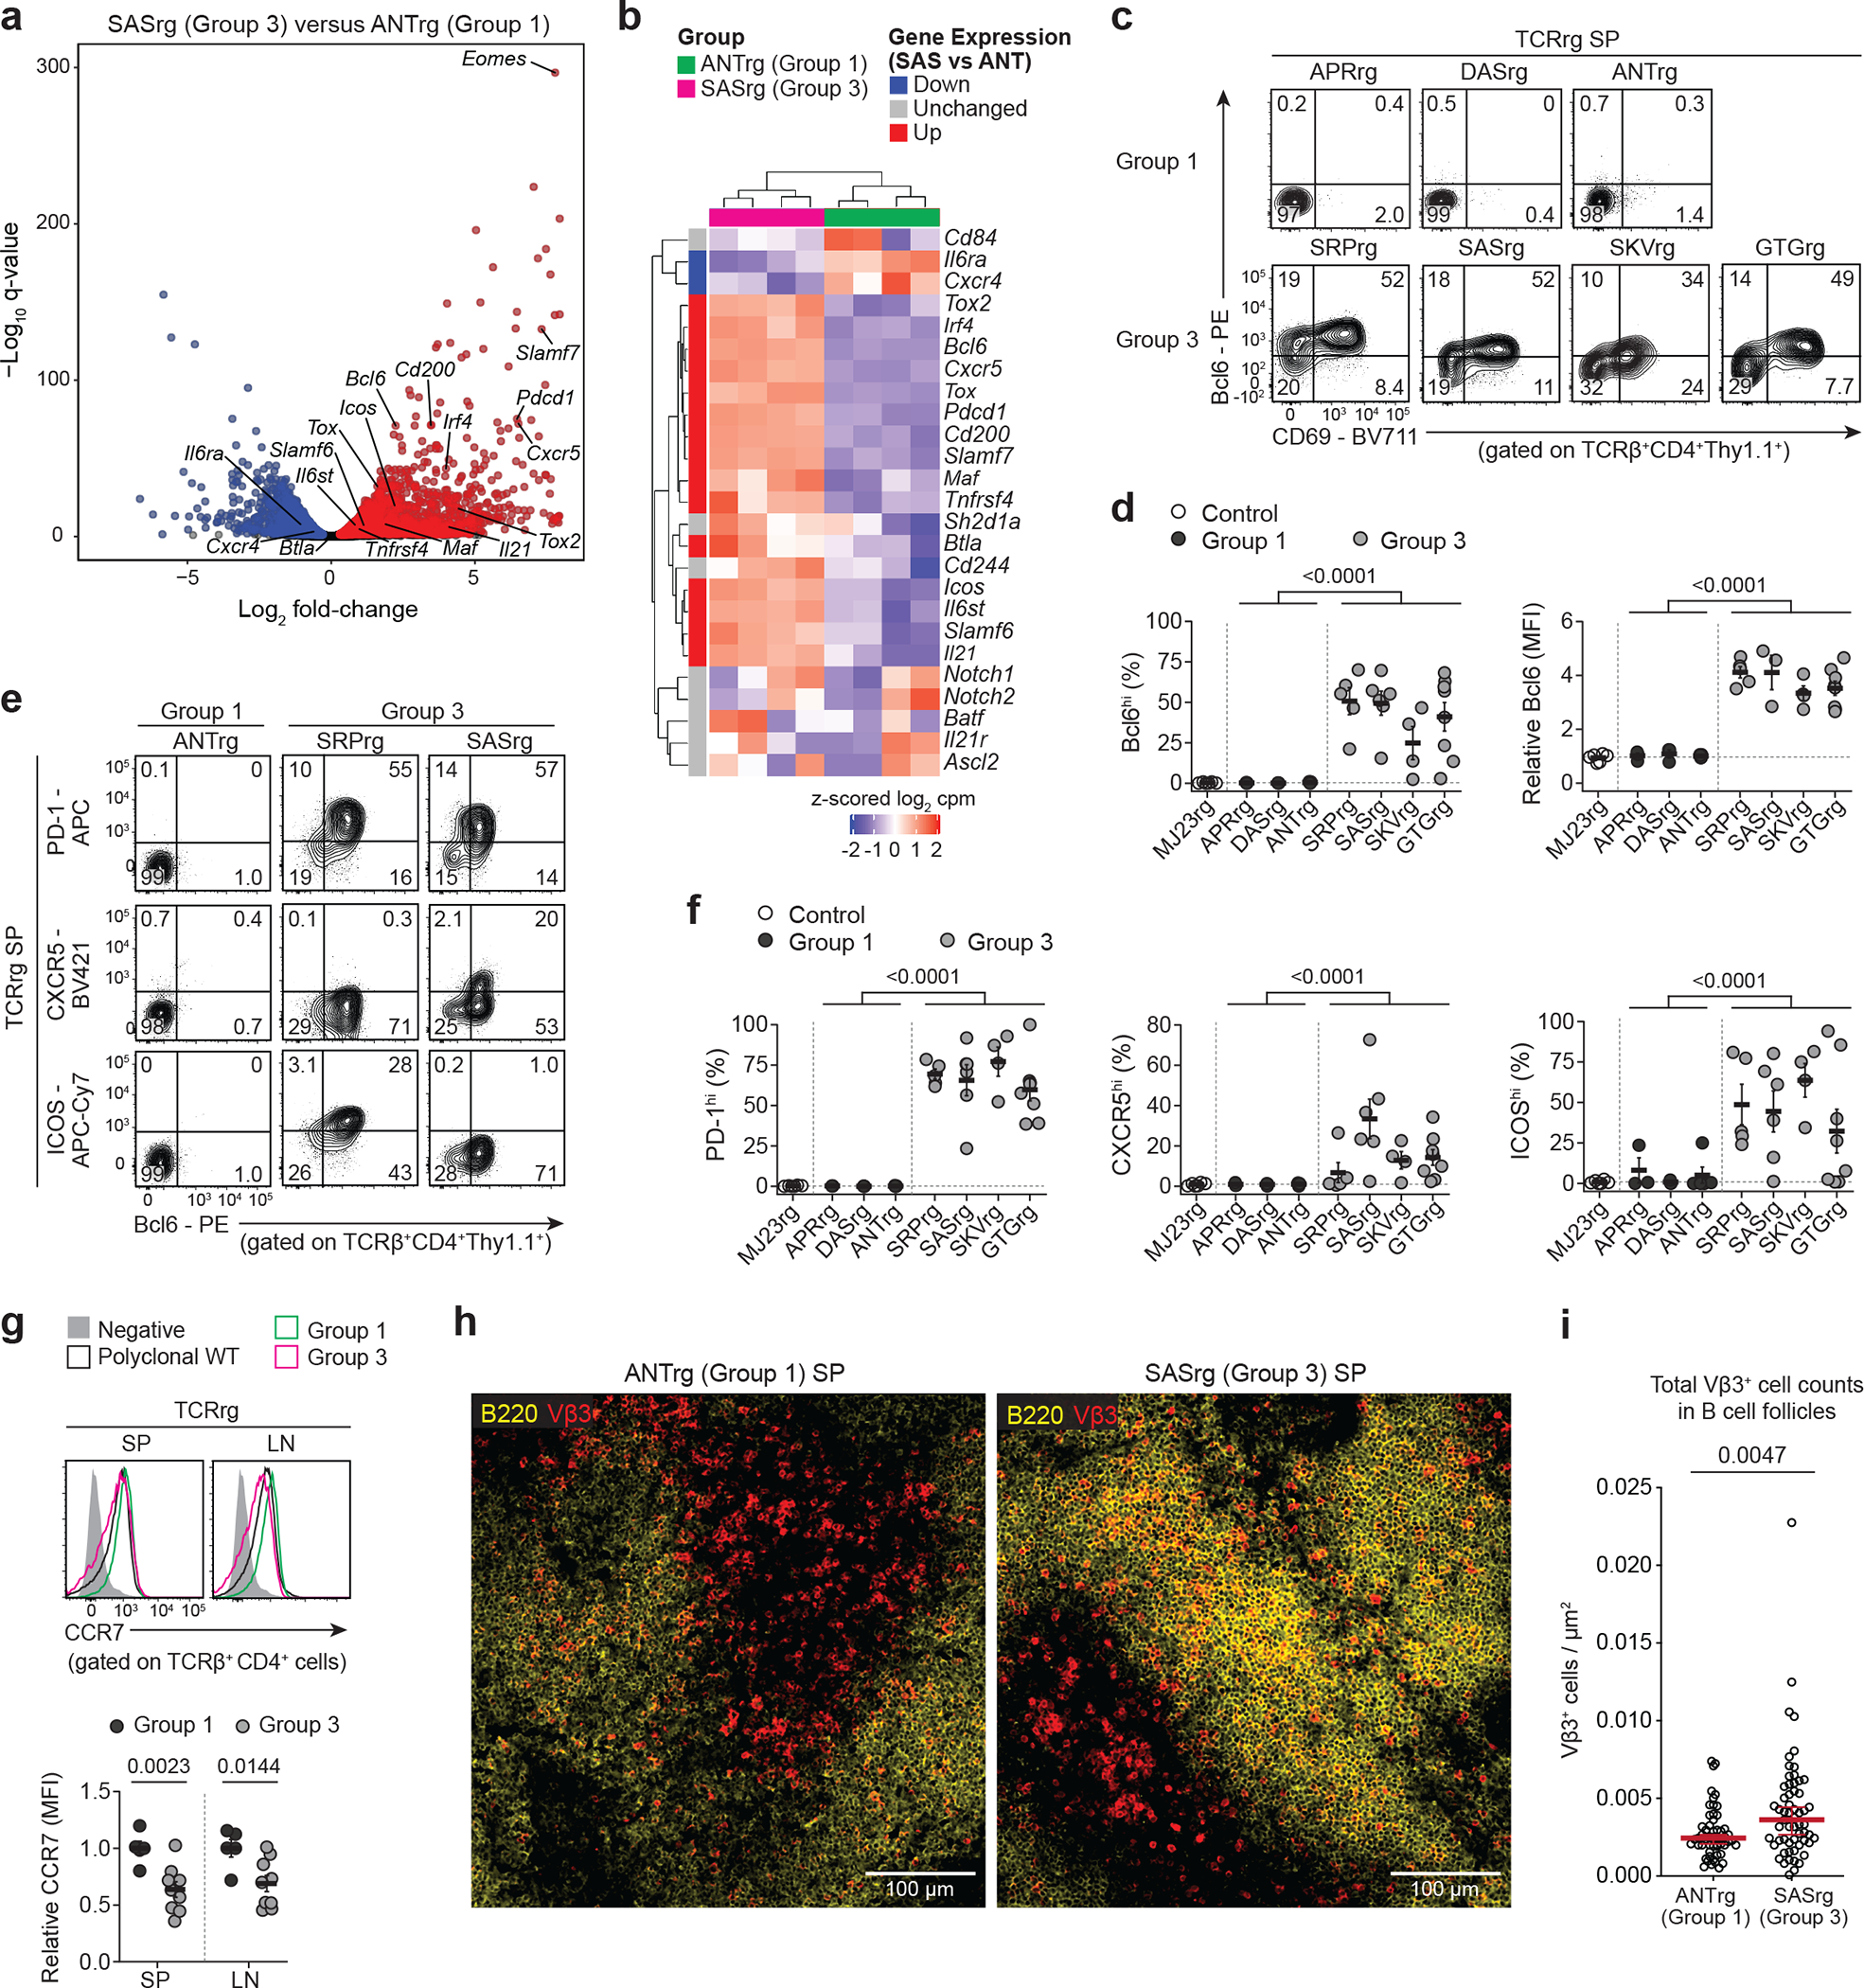
a,b, Comparative RNA-Seq analysis of Group 3 SASrg and Group 1 ANTrg T cells. CD4+ TCRrg cells were purified from the pooled SLOs of TCRrg mice (n = 4 mice per TCR) and subjected to bulk RNA sequencing.
a, Volcano plot depicting differential gene expression for SASrg vs. ANTrg cells. The –log10 q-value versus log2 fold-change is depicted for genes with average log2 CPM ≥ −1. Blue and red dots denote genes over-represented in ANTrg and SASrg T cells, respectively, with a false discovery rate (FDR) of 5%. Data pooled from two independent experiments. Select genes from b are indicated, as is Eomes.
b, Heat map of gene expression for a curated list of 25 genes implicated in Tfh differentiation and function37–40. SASrg cells were enriched for the gene set shown (two-sided Fisher’s exact test, p = 4 × 10⁻⁸).
c-f, Flow cytometry of select Tfh-associated proteins by Group 1 and Group 3 TCRrg T cells. Female MJ23rg mice served as comparative controls. n ≥ 3 per TCR. Data pooled from six independent experiments.
c, Representative plots of Bcl6 vs. CD69 expression by the indicated TCRrg cells from the spleen (SP).
d, Summary plots of data from c showing the percentage of Bcl6hi TCRrg cells (left) and the relative Bcl6 MFI, normalized to the MFI of MJ23rg cells (n = 3–8 per TCRrg).
e, Representative plots of PD-1, CXCR5, or ICOS expression vs. Bcl6 expression by TCRrg cells expressing indicated TCRs.
f, Summary plots of data from e and additional analyses showing the percentage of TCRrg cells expressing the indicated markers (n = 3–8 per TCRrg).
g, Top, representative histograms of CCR7 expression by Group 1 or Group 3 TCRrg T cells from the SP. T cells from WT mice are also shown. Bottom, summary plot depicting relative CCR7 MFI, normalized to the average MFI in Group 1 TCRrg cells in a given experiment (n = 5–9 per group). Data pooled from two independent experiments.
h, Representative immunofluorescence microscopy of splenic ANTrg and SASrg T cells in the spleen (SP), identified by TCR Vβ3 staining (see Methods and refs25,58,59). Yellow, B220; red, TCR Vβ3. 20x magnification.
i, From h and other samples, quantification of Vβ3+ T cell density within B cell follicles, identified as regions of interest (ROI) rich in B220+ cells. T cell density was quantified in blinded fashion as described in Methods. Each symbol depicts the Vβ3+ cell density within individual ROIs. n = 56–59 ROIs per TCR, across 4 spleens per TCR. Medians ± 95% confidence intervals are denoted. Two-sided p values were calculated using Mann-Whitney U-test.
In all panels but i, means ± SEM are indicated. For g, two-sided p values for each anatomical site were calculated using Welch’s t-test. For all other panels, two-sided p values were calculated using Mann-Whitney U-tests for pooled Group 1 clones versus pooled Group 3 clones. ns, p ≥ 0.05, not significant.
Using this transcriptional signature as a guide, we analyzed the expression of select gene products by Group 3 and Group 1 T cells via flow cytometry. Notably, splenic TCRrg T cells expressing Group 3 TCRs uniformly expressed elevated amounts of Bcl6 and PD-1 proteins (Fig. 3c–f), consistent with the transcriptional data. In addition, Group 3 T cells exhibited diminished expression of CCR7 protein (Figure 3g), an additional hallmark of Tfh cells38. Expression of CXCR5 and ICOS proteins was also observed on Group 3 clones, but the fraction of TCRrg cells expressing these markers varied from mouse to mouse (Fig. 3e,f). Comparatively, Group 1 clones lacked expression of Bcl6, PD-1, CXCR5, and ICOS (Fig. 3c–f), and maintained high expression of CCR7 (Fig. 3g), consistent with their naïve phenotype. Thus, Group 3 clones adopt some canonical features of Tfh cells at steady state.
Given the data showing that Group 3 T cells display hallmarks characteristic of T-helper cells with the potential to enter B cell follicles, we performed immunofluorescence analysis of spleens from lymphoreplete TCRrg mice expressing the Group 1 ANT TCR or Group 3 SAS TCR to define the localization of such clones at steady state. In TCRrg mice expressing the Group 1 ANT TCR, TCRrg T cells were preferentially positioned in the T cell zones and were found at low densities in the B cell follicles (Figure 3h,i). In contrast, TCRrg T cells expressing the Group 3 SAS TCR were frequently found at elevated densities in some regions of the B cell follicles, in addition to the T cell zones (Fig. 3h,i). These data indicate that self-specific Group 3 SAS T cells exhibit a heightened propensity to localize within the B cell follicles at steady state. Despite this, we found that the frequency and Tfh-like phenotype of Group 3 SAS T cells were not significantly impacted following cell transfer to B cell-depleted hosts (Extended Data Fig. 6), indicating that B cells are dispensable for maintenance of Group 3 SAS T cells and their Tfh-like phenotype.
Group 3 clones do not produce common cytokines at homeostasis
Based on our data showing that Group 3 clones exhibit widespread activation at steady state and mimic common hallmarks of Tfh cells, we hypothesized that Group 3 T cells may be poised to exert common Tfh cell effector functions. However, we found that TCRrg T cells expressing Group 3 TCRs did not produce IL-21 or other canonical T helper cell effector cytokines (including IFN-γ, IL-4, IL-17, and IL-10) following in vitro stimulation with PMA and ionomycin (Fig. 4a,b). Moreover, Bcl6-expressing Group 3 clones did not express additional lineage-defining transcription factors such as T-bet, GATA-3, and RORγt (Fig. 4c). Examination of the B cell compartment in TCRrg mice expressing Group 3 TCRs revealed that the elevated abundance of Group 3 T cells in these mice was not sufficient to promote spontaneous germinal center (GC) formation or expansion (as measured by the prevalence of CD38lo GL-7hi B cells, Fig. 4d, top panels; Fig. 4e, top) or the emergence of Bcl6-expressing non-GC B cells (Fig. 4d, bottom; Fig. 4e, bottom). Thus, despite adopting multiple hallmarks of Tfh cells, self-specific Group 3 T cells failed to exhibit common Tfh-associated effector functions in unchallenged mice.
Fig. 4 |. T cells expressing Group 3 TCRs do not produce common T-helper effector cytokines or promote spontaneous germinal center formation.
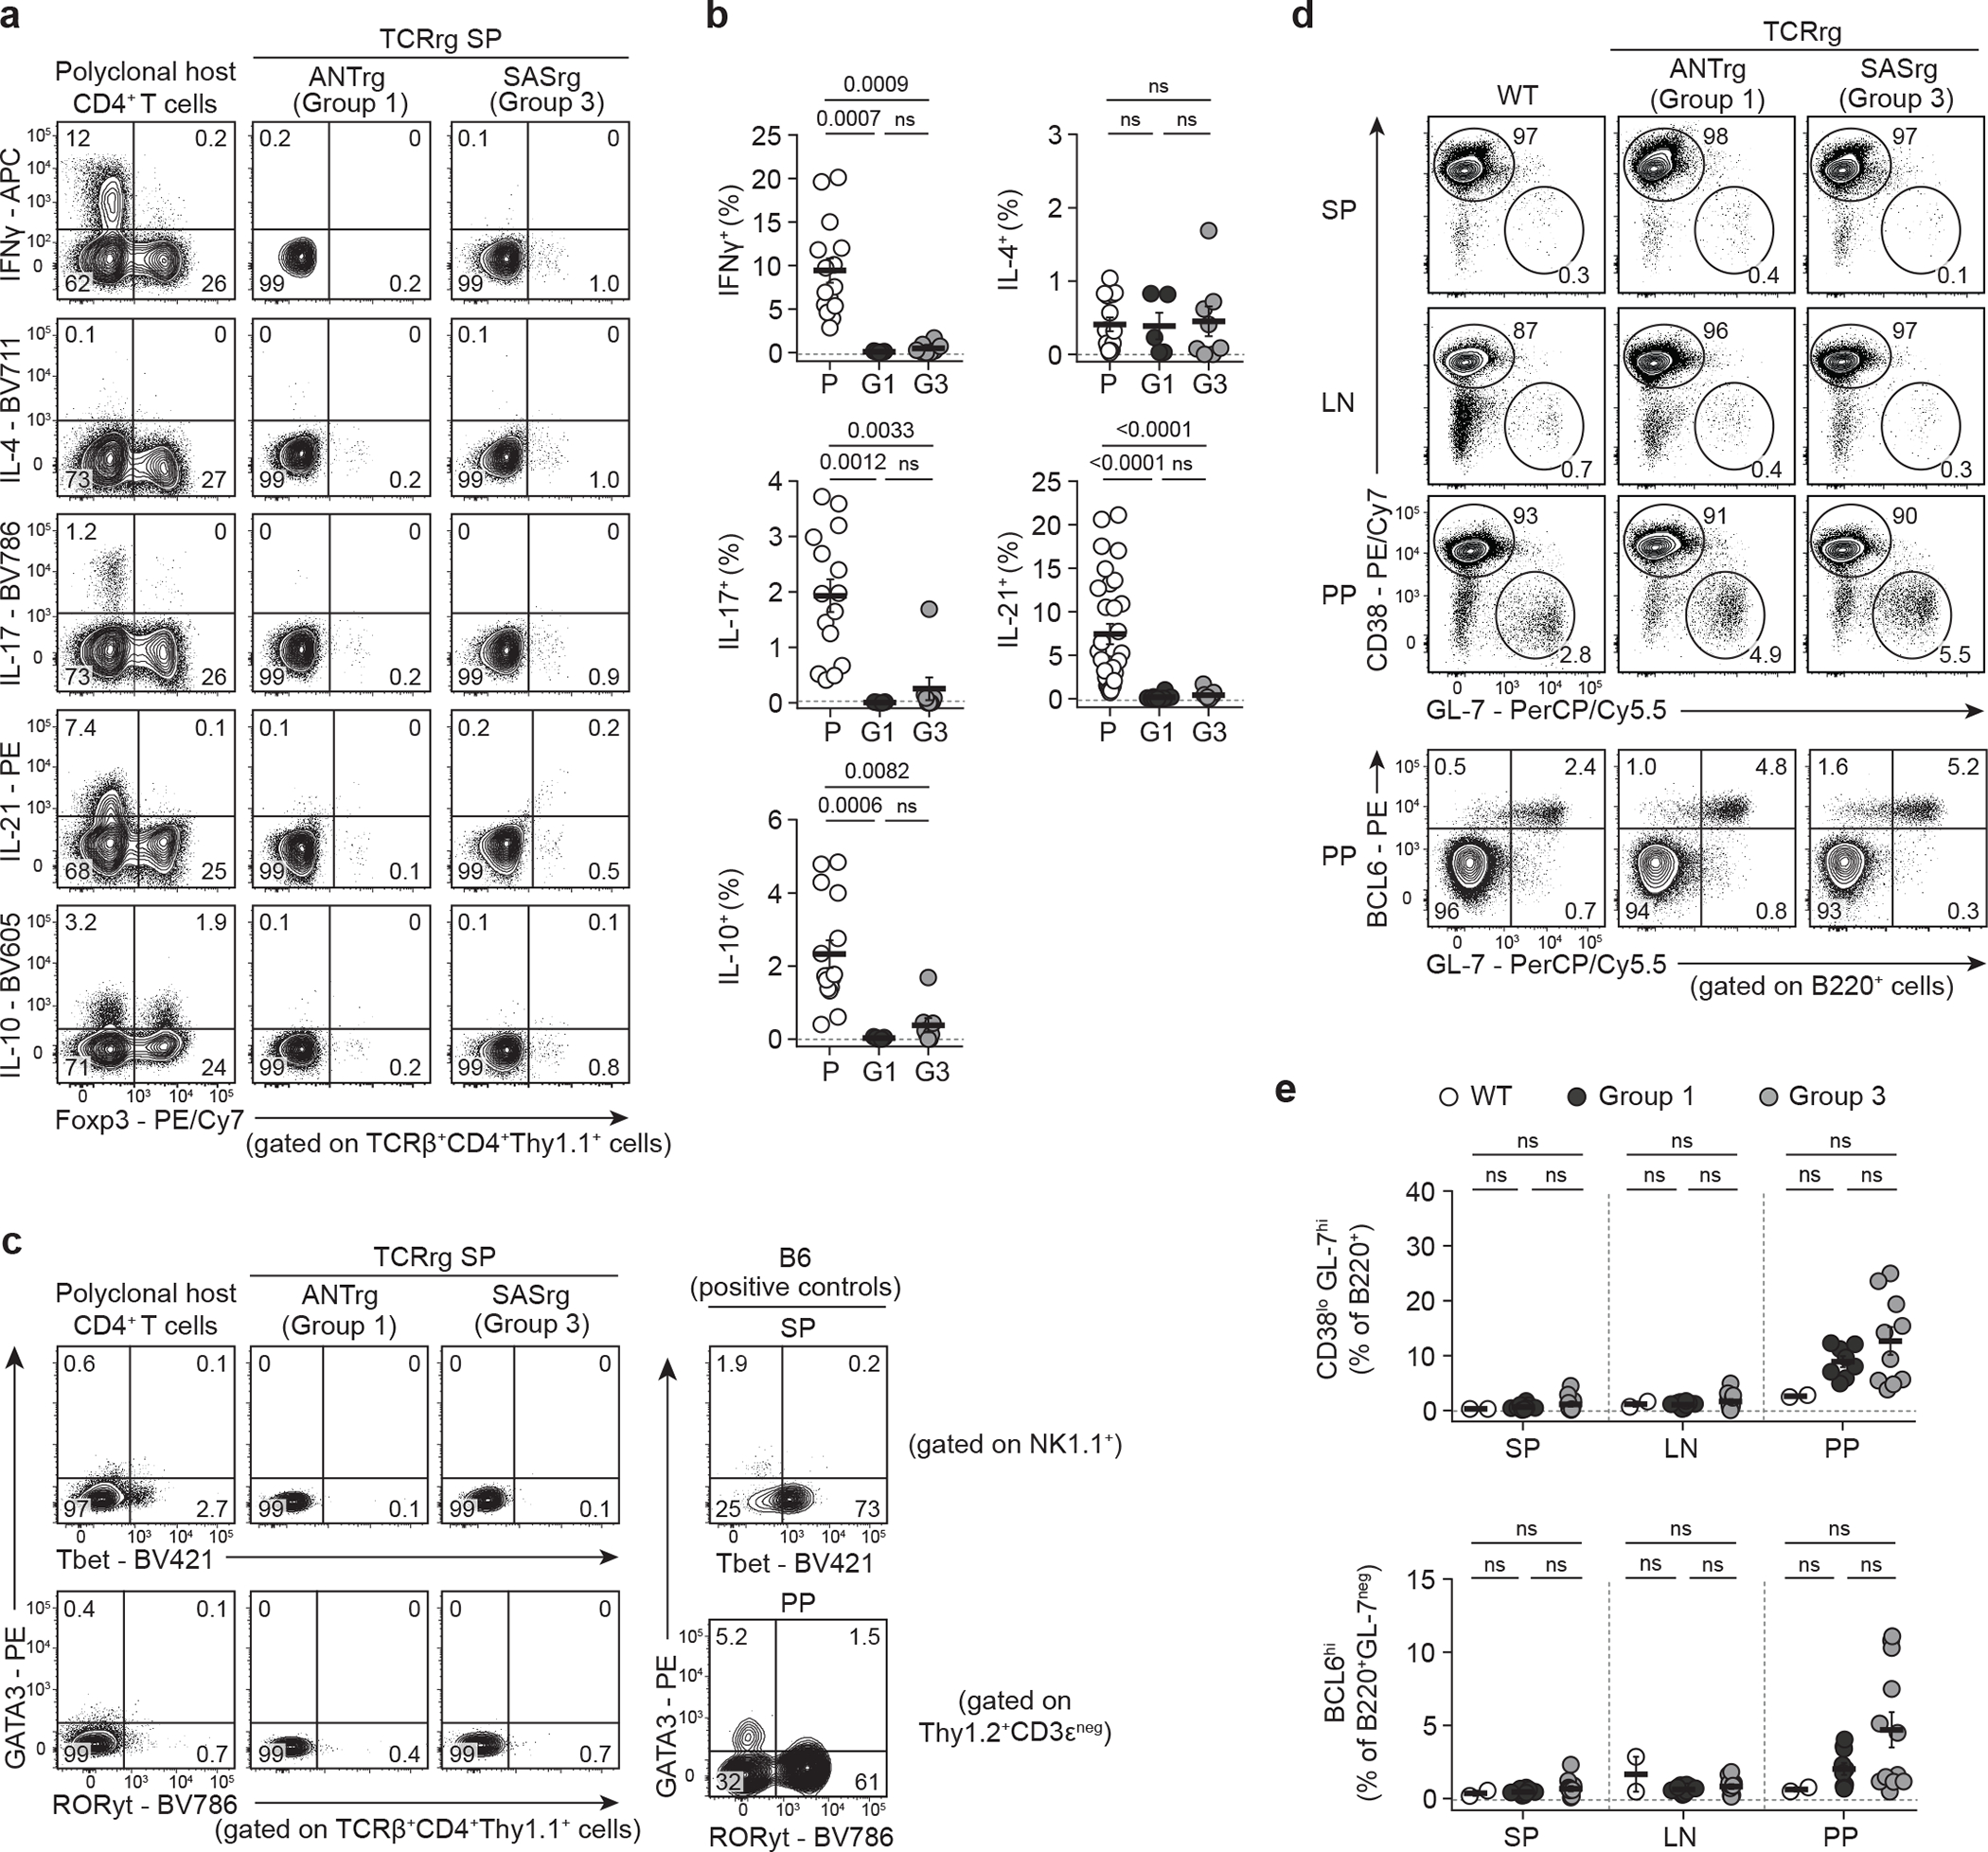
Three Group 1 and four Group 3 TCRs were expressed as TCRrg mice (see Methods).
a, T cells were stimulated with PMA and ionomycin and analyzed by flow cytometry. Analysis of IFN-γ, IL-4, IL-17, IL-21, and IL-10 vs. Foxp3 expression by splenic Group 1 ANTrg and Group 3 SASrg T cells. Polyclonal host CD4+ T cells served as positive controls. SP, spleen.
b, Summary plots of data from a showing the percentage of splenic Group 1 (G1, black symbols) and Group 3 (G3, gray symbols) TCRrg cells or polyclonal host CD4+ T cells (P, white symbols) expressing the indicated cytokine (n = 5–30 per group). Data pooled from at least three independent experiments.
c, Left, GATA3 vs. Tbet (top row) or RORγt (bottom row) expression by splenic Group 1 ANTrg and Group 3 SASrg T cells. Polyclonal host CD4+ T cells served as controls. Top right, splenic NK1.1+ cells served as controls for Tbet expression. Bottom right, Thy1.2+CD3εneg innate-like cells from Peyer’s patches (PP) served as controls for GATA3 and RORγt expression.
d, Flow analysis of CD38 vs. GL-7 expression (top rows) or Bcl6 vs. GL-7 expression (bottom row) by B220+ B cells isolated from the SP, pooled lymph nodes (LN), or PP of Group 1 ANTrg or Group 3 SASrg mice. B6.SJL mice (WT) served as controls.
e, Summary plots of data from d showing the percentage of CD38loGL-7hi cells amongst B220+ B cells (top) and the percentage of Bcl6+ cells amongst B220+GL-7neg B cells (bottom) at various sites of Group 1 (black symbols; n = 10) and Group 3 (gray symbols; n = 12) TCRrg mice. B cells from B6.SJL mice (WT, white symbols) served as controls (n = 2). Data pooled from six independent experiments. Each symbol depicts cells from an individual mouse.
Bold lines and error bars represent means ± SEM. For each anatomical site, two-sided p values were calculated using Kruskal-Wallis tests with Dunn’s tests for multiple comparisons. ns, p ≥ 0.05, not significant. Source data contain exact p values and group sizes.
Group 3 clones produce IFN-γ following Treg cell ablation
To better define the functionality of Group 3 T cell clones when released from Treg cell-mediated control, we characterized the phenotype and cytokine production by these cells following systemic Treg cell ablation (Fig. 5). TCRrg mice expressing Group 1 TCRs (ANT or DAS) or Group 3 TCRs (SAS or SKV) were generated in lymphoreplete Foxp3DTR-EGFP hosts. TCRrg T cells also expressed the Foxp3DTR-EGFP allele, allowing ablation of all Treg cells in this setting. Following sustained DT-mediated Treg cell depletion, we found that Group 3 T cell clones were enriched in the prostate and salivary glands (Fig. 5) and produced the effector cytokine IFN-γ at these non-lymphoid sites (Fig. 5). In the same setting, Group 1 T cell clones remained phenotypically naïve and were not expanded following Treg cell depletion (Fig. 5). Of note, Group 3 T cells in the setting of sustained Treg cell ablation were largely Bcl6-negative (Fig. 5), indicating that not all Group 3 T cells are committed to a Bcl6-expressing phenotype. These experiments provide additional evidence that self-specific Group 3 clones are expanded in non-lymphoid organs following systemic Treg cell ablation, and may contribute to the effector T cell response driving autoimmune pathology.
Fig. 5 |. Following Treg cell ablation, Group 3 clones are enriched in non-lymphoid organs and produce IFN-γ.
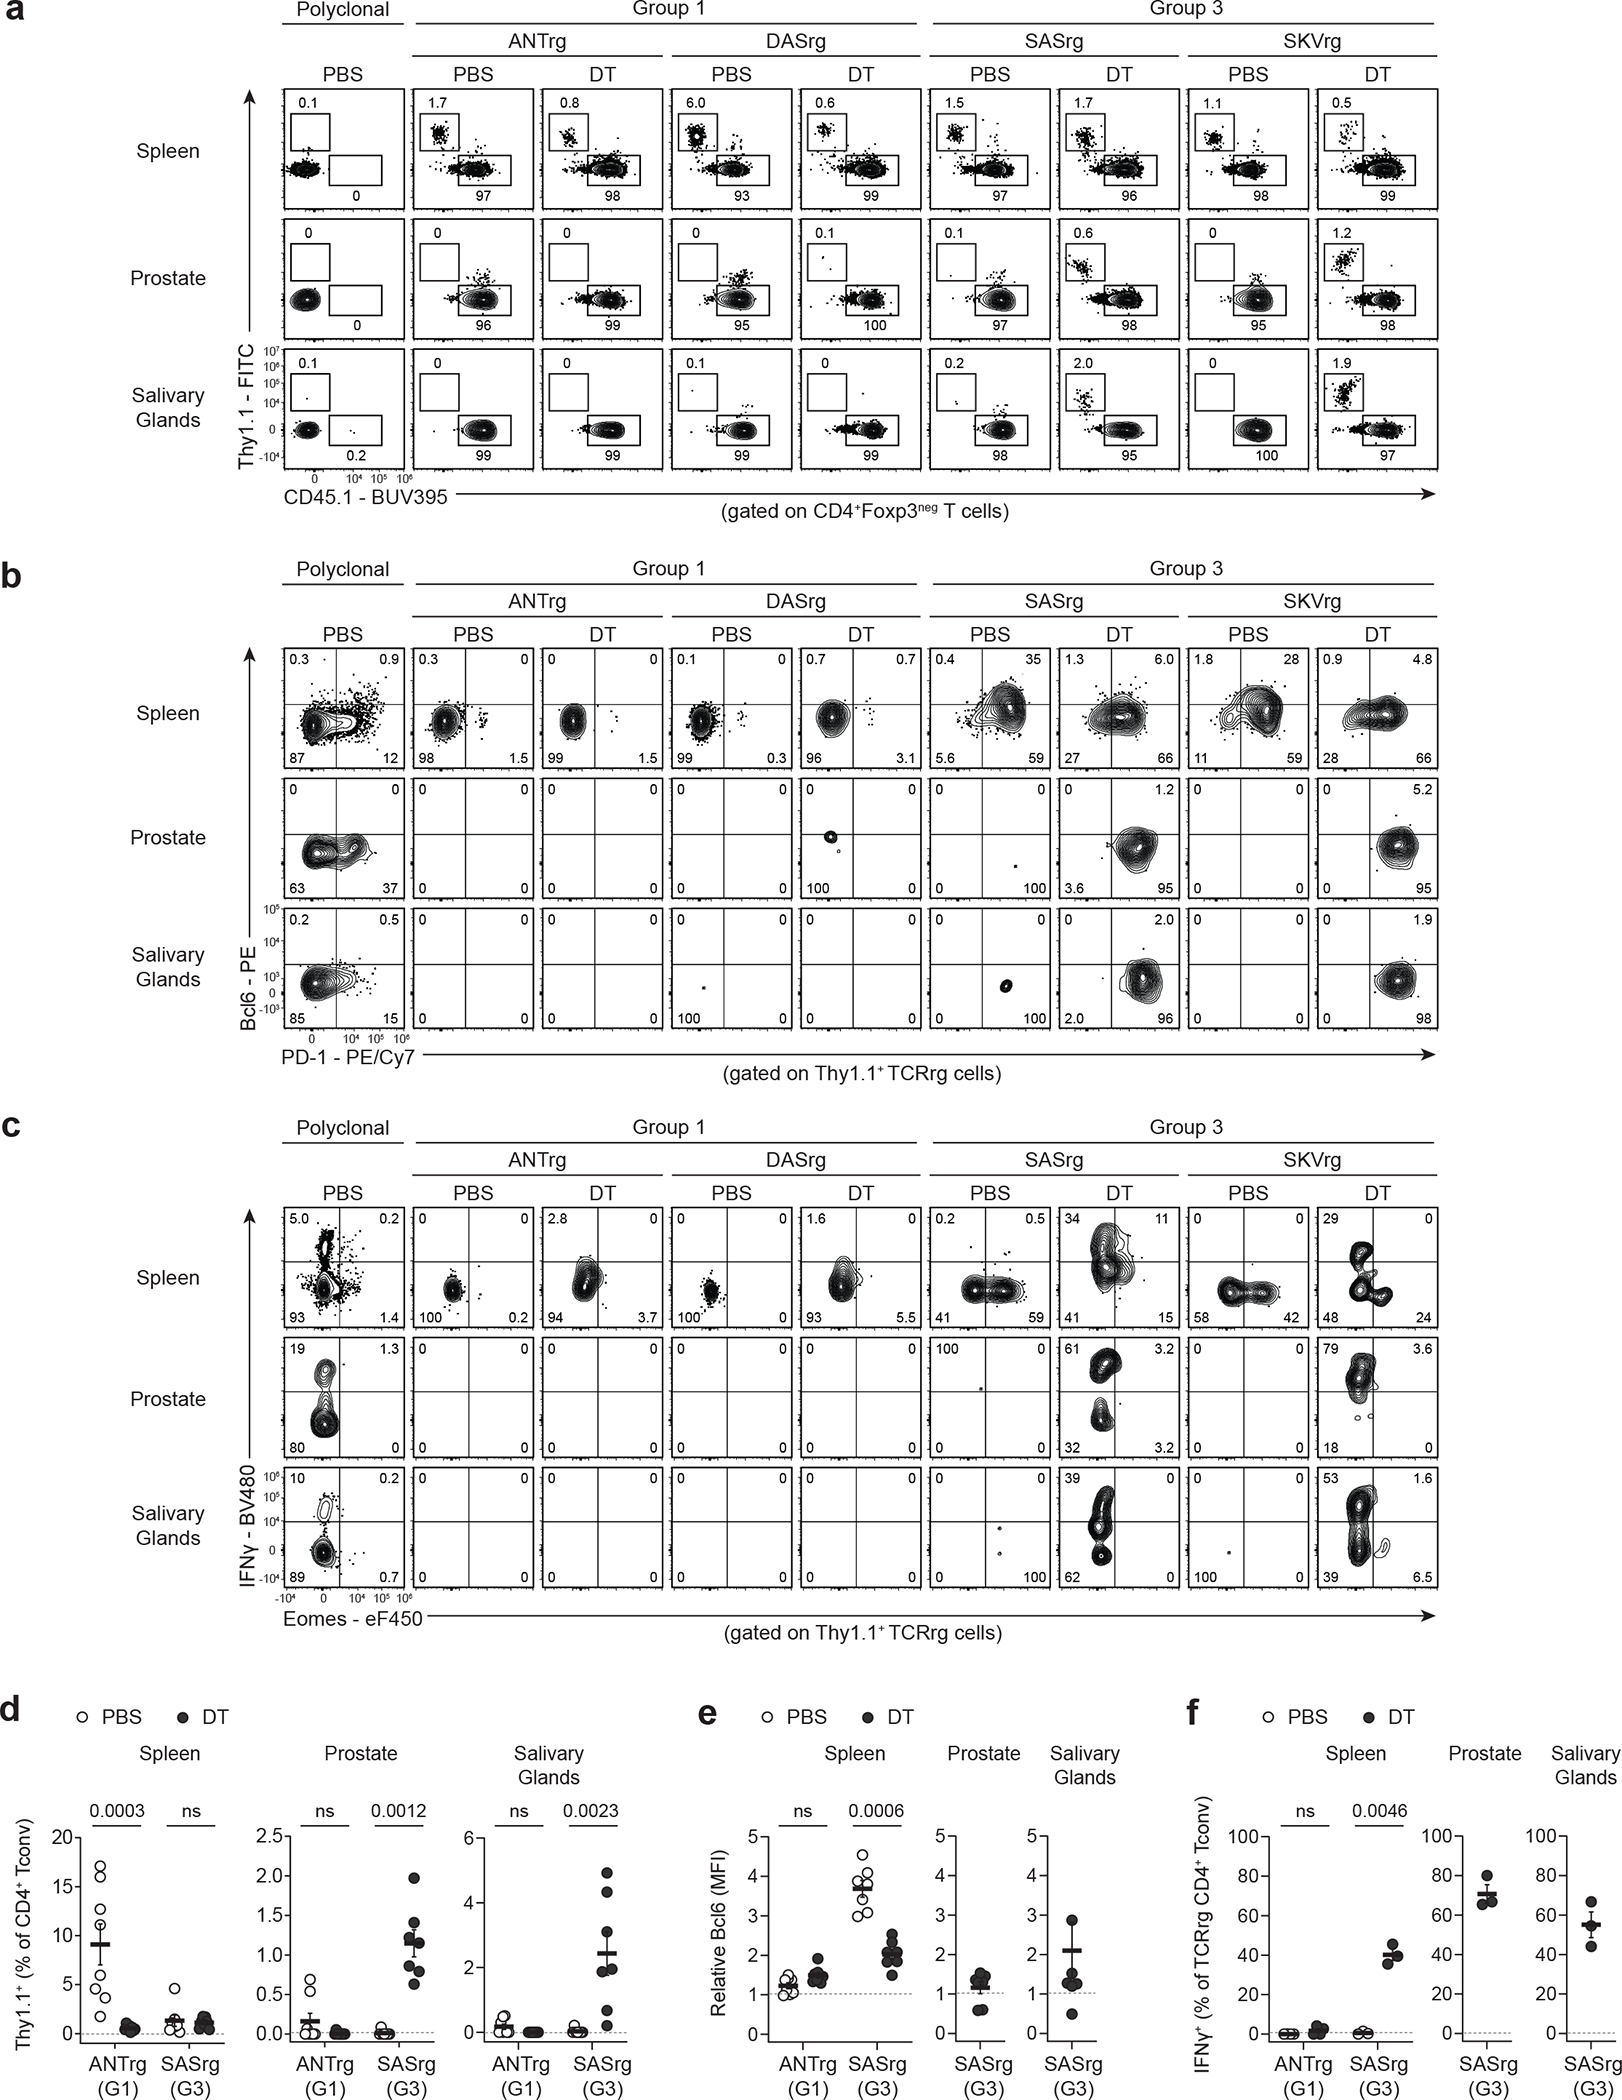
Two Group 1 TCRs (ANT and DAS) and two Group 3 TCRs (SAS and SKV) were expressed as TCRrg mice in Foxp3DTR-EGFP hosts. Mice were treated with PBS or subjected to sustained Treg cell ablation via administration of DT. At day 12, TCRrg T cells were phenotyped via flow cytometry. Polyclonal CD4+ Tconv cells from PBS-treated wild-type mice served as staining controls (leftmost column). Data pooled from two independent experiments. Each symbol depicts cells from an individual TCRrg mouse.
a, Direct flow analysis depicting Thy1.1 vs. CD45.1 expression by CD4+Foxp3neg T cells in the spleen, prostate, and salivary glands of the indicated mice. The percentages of Thy1.1+ TCRrg Tconv cells and CD45.1+ host cells are indicated.
b, Gating on Thy1.1+ TCRrg Tconv cells in a, flow analysis of Bcl6 vs. PD-1 expression.
c, Cells from TCRrg mice were first cultured with PMA and ionomycin, then analyzed by flow cytometry. Flow analysis of IFN-γ vs. Eomes expression for Thy1.1+ TCRrg Tconv cells.
d, Summary plots of data from a showing the frequency of Group 1 ANTrg and Group 3 SASrg Tconv cells at the indicated sites of PBS-treated (open circles) or DT-treated (closed circles) mice (n = 7–8 per condition).
e, Summary plots of data from b depicting relative mean fluorescence intensity (MFI) of Bcl6 expression for ANTrg and SASrg Tconv cells from the indicated sites of PBS- or DT-treated mice (n = 7–8 per condition). Bcl6 MFI was normalized by dividing the MFI of TCRrg cells by that of host polyclonal CD4+ Tconv cells at the matched organ site from PBS-treated controls.
f, Summary plots of data from c showing the percentage of ANTrg and SASrg Tconv cells that express IFN-γ at the indicated sites (n = 3–4 per condition).
Bold lines and error bars represent means ± SEM. For d and e, two-sided p values were calculated using Mann-Whitney U-tests with Holm-Šídák’s tests for multiple comparisons. For f, two-sided p values were calculated using Welch’s t-test with Holm-Šídák’s test for multiple comparisons. ns, p ≥ 0.05, not significant. Source data contain exact p values and group sizes.
Group 3 thymocytes exhibit hallmarks of self-reactivity
To gain insight into the developmental stages at which the Tfh-like phenotype is established, we leveraged our TCRrg system to analyze the thymic development of Group 3 clones by assessing common markers of thymocyte selection and Tfh cell differentiation in monoclonal TCRrg mice, using Group 1 clones as comparative controls. Of note, the TCRrg mice generated in our studies utilize a conditional retroviral construct in which the TCRα chain is expressed under the control of a Cd4-driven Cre-loxP system26,42, thereby recapitulating the natural timing of TCRαβ upregulation at the CD4+CD8+ “double-positive” (DP) stage of thymic development43.
We found that TCRrg thymocytes expressing Group 3 TCRs expressed elevated densities of PD-1, which has been shown to be upregulated by agonist-signaled thymocytes destined for negative selection26 or Treg cell differentiation44 (Fig. 6a,b). Furthermore, Group 3 clones were characterized by downregulation of the CD4 and CD8α co-receptors at the DP stage of thymic maturation, a process termed “DP dulling” that is considered a readout of agonist ligand sensing26,45. We also found that Group 3 clones expressed high densities of CD5 (Fig. 6c,d), a surrogate marker of reactivity to positively selecting self-ligands26,46. Despite these signs of elevated TCR signaling by Group 3 clones, expression of the Treg cell-defining transcription factor Foxp3 was not commonly observed for thymocytes expressing Group 3 TCRs (Fig. 6a,b). Given that thymic Treg cell differentiation occurs optimally at low clonal frequencies21,47,48, we also examined Treg cell development in low-frequency TCRrg mice expressing the Group 3 TCR SKV, and found that a negligible fraction of SKVrg thymocytes expressed Foxp3 when present at lower clonal frequencies (Extended Data Fig. 7b,c). These results, paired with TCR sequencing data showing that Group 3 clones are found at low frequencies (or not detected) in the Treg cell repertoire of healthy mice (Figure 1d, rightmost columns), suggest that Treg cell differentiation is not a common fate for Group 3 clones. By comparison, Group 1 clones readily upregulated CD69 and TCR at the DP stage, indicative of efficient positive selection, but failed to display the high densities of CD5 and PD-1 evident in Group 3 clones (Fig. 6).
Fig. 6 |. In the thymus, Group 3 Tconv clones display hallmarks of elevated self-reactivity.
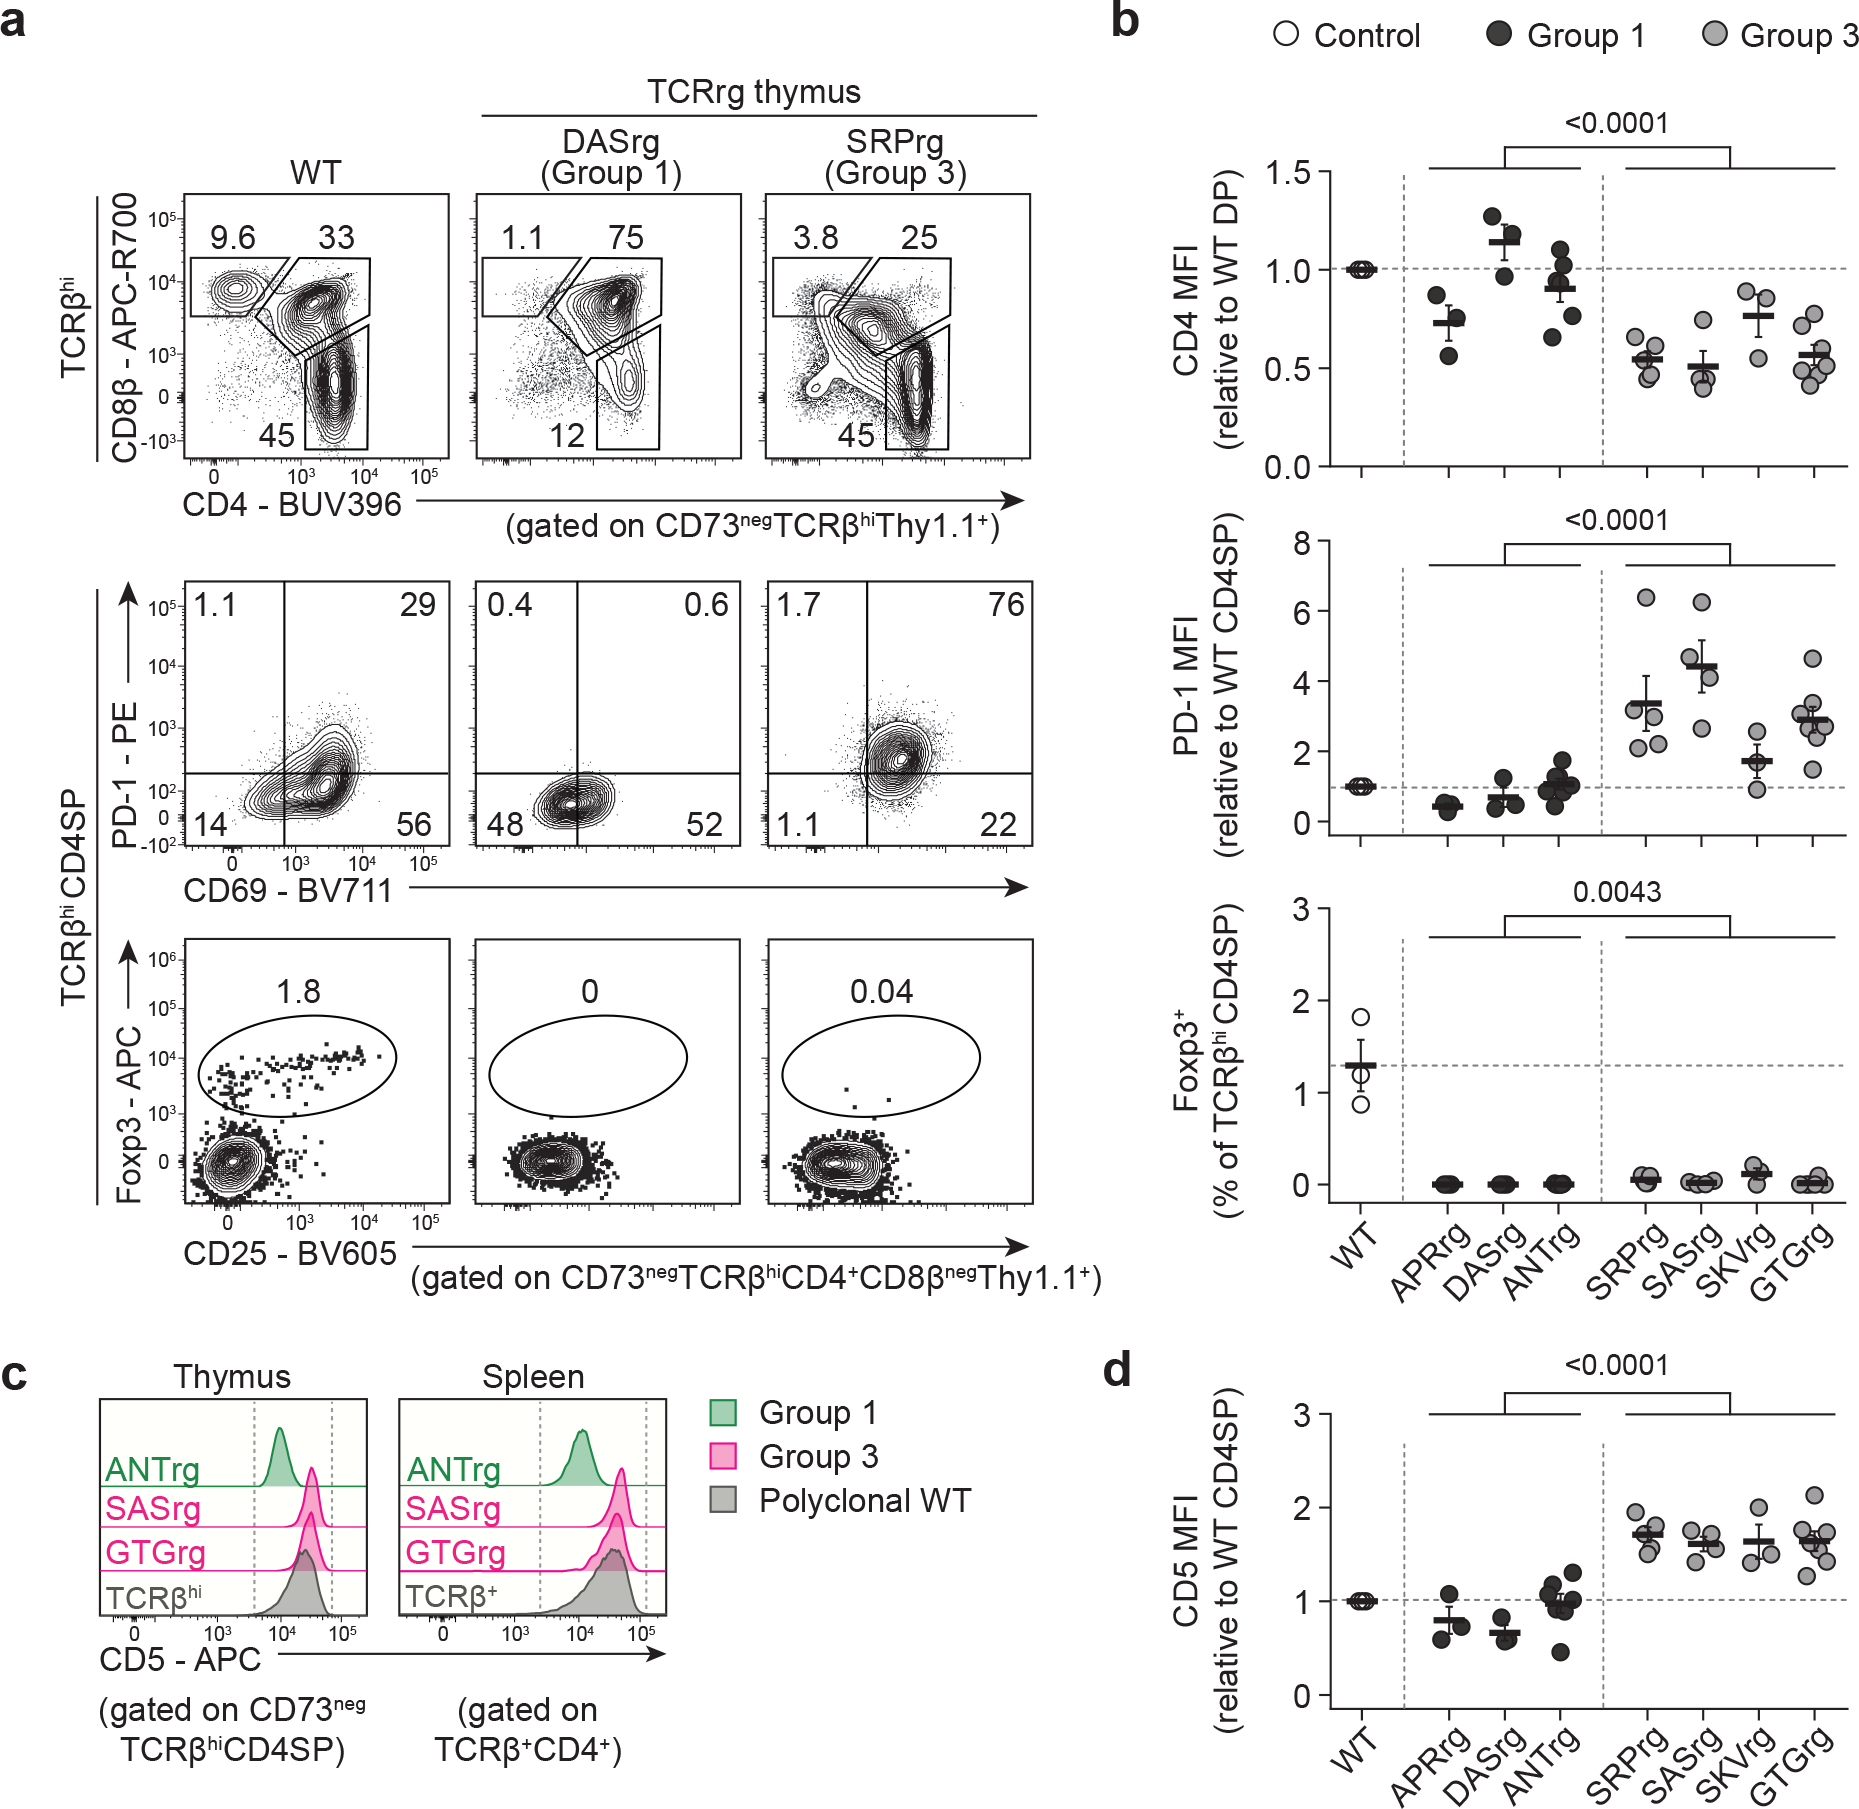
Three Group 1 and four Group 3 TCRs were expressed as TCRrg mice. Thymic TCRrg T cells were phenotyped using flow cytometry, gating on CD73neg cells to distinguish newly developed thymocytes from recirculating mature T cells60.
a, Top row, representative flow analysis of CD8α vs. CD4 expression by Group 1 DASrg and Group 3 SRPrg thymocytes. Gating on CD4+CD8αneg single-positive (CD4SP) TCRrg cells in top row, expression of PD-1 vs. CD69 (middle row) and Foxp3 vs. CD25 (bottom row) are shown. Thymocytes from B6 mice (WT) served as comparative controls. Cells were gated on TCRβhi thymocytes that have upregulated the TCR following positive selection.
b, Summary plots of data from a and additional analyses of Group 1 clones (black symbols), Group 3 clones (gray symbols), and WT control cells (open symbols). Top, CD4 mean fluorescence intensity (MFI), normalized to the MFI of CD4+CD8α+ double-positive (DP) thymocytes from WT controls (n = 3–7 per TCRrg, n = 3 per WT group). Middle, PD-1 MFI, normalized to the MFI of CD4SP thymocytes from WT controls (n = 3–7 per condition). Bottom, percentage of TCRrg CD4SP thymocytes expressing Foxp3 (n = 3–7 per condition). Data are pooled from five independent experiments. Each symbol depicts cells from an individual mouse. MFI ratios were calculated for samples within the same experiment.
c, Histograms of CD5 expression by thymic CD4SP and splenic TCRrg cells expressing the indicated TCRs. T cells from WT controls (gray) served as comparative controls.
d, Summary plot of data from c depicting CD5 MFI for the indicated Group 1 (black symbols) and Group 3 (gray symbols) clones, normalized to MFI of WT CD4SP thymocytes in a given experiment (n = 3–7 per TCRrg, n = 3 per WT group). Data pooled from five independent experiments.
Bold lines and error bars represent means ± SEM. Two-sided p values were calculated using Mann-Whitney U-tests for pooled Group 1 clones versus pooled Group 3 clones. ns, p ≥ 0.05, not significant. Source data contain exact p values and group sizes.
We also assessed whether Group 1 and Group 3 TCRrg thymocytes upregulated other markers expressed by Tfh-like Group 3 clones in the periphery. Nearly all thymocytes (Group 1, Group 3, or polyclonal) at the CD4+CD8+ stage expressed Bcl6, while a minor fraction of Group 3 thymocytes (but not Group 1 thymocytes) at the CD4 single-positive stage showed low-density Bcl6 expression (Extended Data Fig. 8). Additionally, a negligible fraction (<2%) of Group 3 thymocytes expressed Eomes and CXCR5 (Extended Data Fig. 8). Thus, our collective data indicate that thymocytes expressing Group 3 TCRs exhibit multiple hallmarks of elevated TCR signaling, but do not efficiently adopt a uniform PD-1hi Bcl6+ Eomes+ phenotype in the thymus of TCRrg mice.
Group 3 thymocytes upregulate Tfh markers in the periphery
We then performed experiments to analyze the kinetics with which Group 3 T cells adopt a Tfh-like phenotype following initial seeding in the periphery. To model this, we enriched CD4 single-positive thymocytes expressing the Group 3 SAS TCR or the Group 1 ANT TCR, transferred these cells intravenously into wild-type recipients, and assessed the fate of donor cells at days 4 and 11 post-transfer. At day 4, Group 3 SAS T cells displayed high densities of the proliferation marker Ki67, low amounts of CCR7, and high densities of numerous markers including PD-1, Bcl6, CXCR5, and Eomes (Extended Data Fig. 9). At day 11, SAS T cells were largely Ki67-negative and were found at lower frequencies relative to day 4, suggesting that a fraction of SAS T cells died following an initial proliferative phase. Notably, the extent of expression of Tfh-like markers at day 11 was further accentuated compared to day 4 (Extended Data Fig. 9). By comparison, donor TCRrg thymocytes expressing the Group 1 ANT TCR were identified in the spleen at very low frequencies at both time points and maintained a naïve, non-proliferative phenotype (Extended Data Fig. 9). Thus, our results demonstrate that CD4 single-positive thymocytes expressing Group 3 TCRs proliferate and rapidly adopt a Tfh-like phenotype in the spleen of lymphoreplete mice following peripheral transfer. While culling of Group 3 SAS T cells occurs to some extent, collective evidence from TCR profiling (Figure 1), analysis of primary TCRrg mice (Figure 2), and T cell transfer studies (Extended Data Fig. 9) indicate that at least some Group 3 T cells evade deletion and populate the peripheral repertoire.
Endogenous Tconv cells display hallmarks of Group 3 clones
Using the phenotypic guideposts established above, we aimed to identify polyclonal CD4+ T cells within the endogenous repertoire that display similar phenotypic hallmarks of Group 3 clones. In addition to high-density expression of PD-1 and Bcl6, a more extensive flow cytometric analysis of Group 3 SAS T cells revealed additional characteristics of these cells, including intermediate-density expression of CD44, low-density expression of Nrp1, and high-density expression of CD69, CD62L, and CD200 (Fig. 7a). We also found that splenic Group 3 SAS T cells expressed high amounts of Eomes (Fig. 7a), consistent with the transcriptional analysis in Fig. 3a.
Fig. 7 |. The endogenous CD4+ Tconv repertoire harbors T cells displaying hallmarks of Group 3 clones.
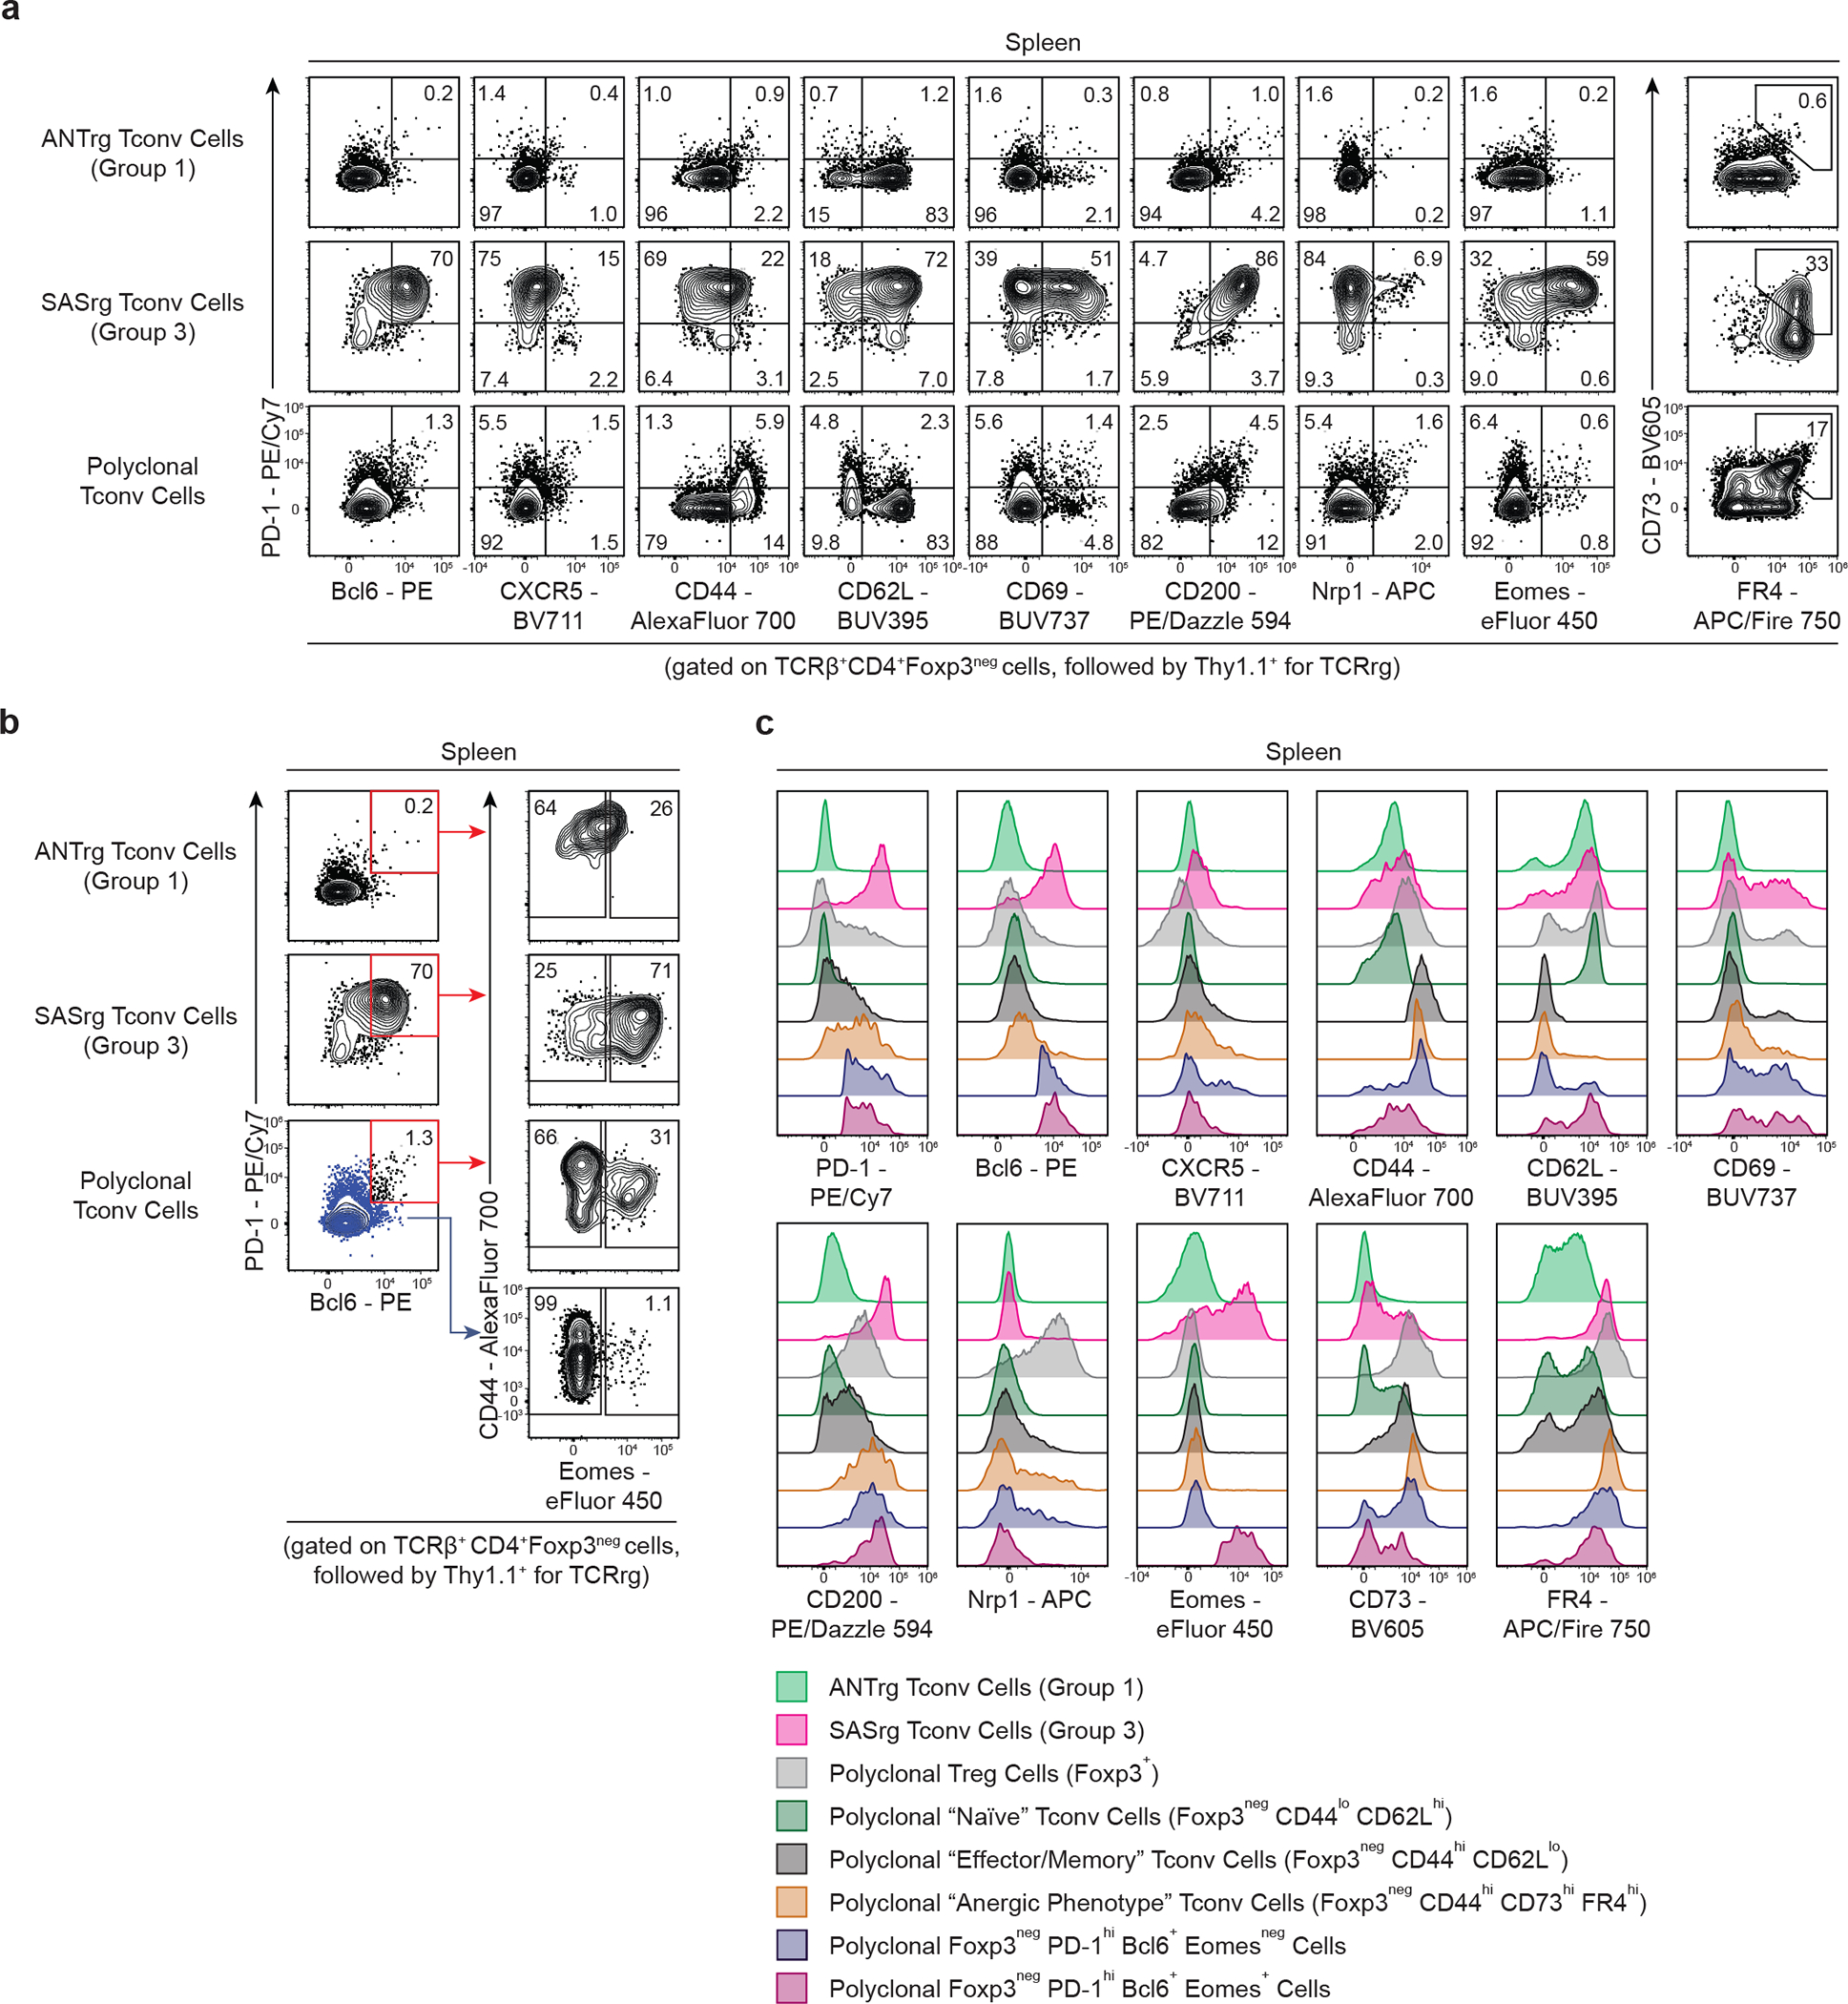
a, Flow cytometric analysis of Group 1 ANTrg cells, Group 3 SASrg T cells, and polyclonal Tconv cells with respect to common features of Group 3 clones. Representative plots of PD-1 expression vs. expression of the indicated markers are shown for the indicated T cells. Plots of CD73 vs. FR4 expression are depicted in the far right column. Splenic CD4+ Tconv cells from B6 mice served as polyclonal controls.
b, Gating strategy for the identification of polyclonal CD4+Foxp3neg Tconv cells from B6 mice displaying common features of Group 3 clones. Plots of PD-1 vs. Bcl6 and CD44 vs. Eomes expression are shown for the indicated T cells. Group 3-like cells were identified by gating on PD-1hiBcl6+ (red gate) cells, followed by Eomes+ cells. PD-1loBcl6neg cells from B6 mice served as comparative controls (blue dot plot and arrow).
c, Histograms depicting expression of various markers, including Tfh-associated markers (PD-1, Bcl6, and CXCR5), markers of T cell antigen experience (CD44, CD62L, CD69, CD200), and other relevant phenotypic markers (Nrp1, Eomes, CD73, and FR4) by the following cell populations: Group 1 ANTrg and Group 3 SASrg T cells, polyclonal Treg cells (Foxp3+), polyclonal “naïve” Tconv cells (Foxp3negCD44loCD62Lhi), polyclonal “effector/memory” Tconv cells (Foxp3negCD44hiCD62Llo), polyclonal “anergic phenotype” Tconv cells (Foxp3negCD44hiCD73hiFR4hi), polyclonal Foxp3negPD-1hiBcl6+Eomesneg cells, and polyclonal Group 3-like Foxp3negPD-1hiBcl6+Eomes+ cells.
We found that combined use of PD-1, Bcl6, and Eomes was sufficient to identify a measurable population of polyclonal CD4+ T cells from wild-type mice that phenotypically mirror Group 3 SAS T cells (Fig. 7b,c). PD-1+ Bcl6+ Eomes+ Tconv cells comprised 0.52% ± 0.14% and 0.15% ± 0.027% of Tconv cells in the spleen and skin-draining lymph nodes, respectively. Notably, PD-1+ Bcl6+ Eomes+ Tconv cells were phenotypically distinct from previously defined populations of antigen-experienced CD4+ T cells, including CD44hi CD62Llo “memory-phenotype” Tconv cells19 and CD44hi CD73hi FR4hi “anergic phenotype” Tconv cells20,49 (Fig. 7c). These findings demonstrate that polyclonal T cells exhibiting numerous features of Group 3 clones can be readily identified within the endogenous repertoire, and that such cells are phenotypically distinct from previously defined subsets of self-reactive CD4+ T cells.
DISCUSSION
Our work identifies a previously undefined class of self-specific CD4+ Tconv cells that exhibit overt reactivity to widespread self-ligands, bypass central tolerance to some extent, adopt numerous hallmarks of Tfh cells in the periphery, and are recurrently enriched in non-lymphoid organs following Treg cell ablation. While much is known about the biology of Tfh cells reactive to foreign peptides elicited by immune challenge, our data highlight the existence of a naturally occurring Tfh-like (nTfh) population of Tconv cells and provide insight into the properties of such cells. The findings that nTfh clones exhibit hallmarks of elevated TCR signaling in the thymus and undergo MHC-II-dependent proliferation upon co-culture with splenic DCs from germ-free mice strongly suggest that these clones are overtly reactive to self-ligands. Thus, our studies delineate a previously unappreciated cell fate for CD4+ T cells reactive to self-peptide/MHC-II ligands, showing that in addition to deletion, Foxp3+ Treg cell differentiation, and acquisition of an anergic phenotype, self-reactive Tconv cells can also adopt a Tfh-like phenotypic signature in the absence of immune challenge. In the thymus, Group 3 nTfh clones exhibit numerous hallmarks of TCR signaling beyond those associated with positive selection, including expression of high densities of PD-1 and CD5 and evidence of DP dulling. Although it is possible that some cells expressing Group 3 TCRs are culled by deletion in the thymus and periphery, our data suggest that at least some nTfh cells bypass central tolerance and populate the peripheral repertoire, as evidenced by the detection of Group 3 clones in the periphery of TCRrg mice and in the non-lymphoid organs of Treg cell-ablated mice. Peripheral transfer experiments using TCRrg thymocytes expressing a Group 3 TCR demonstrate that peripheral cues can drive the rapid expansion and/or induction of cells displaying a PD-1+ Bcl6+ Eomes+ Tconv cell phenotype. Additional studies will be needed to define the extent to which thymic signals are required for the full acquisition of the nTfh phenotype.
Multiple lines of evidence point to CD4+ T helper cells as a key lynchpin of B cell tolerance. CD4+ T cells with a T follicular helper (Tfh)-like phenotype are found at elevated frequencies in the blood of human subjects with systemic lupus erythematosus and other autoimmune diseases50–53, suggesting a role for heightened Tfh cell activity in human autoimmunity. In mice, the deletion of anergic auto-reactive B cells requires the provision of FasL and CD40L by T cells54,55, although the nature of T cells providing such signals remains undefined. T cell-intrinsic loss-of-function mutations in the E3 ubiquitin ligase Roquin trigger the development of spontaneous germinal center formation and autoantibody production in mice56, demonstrating that intrinsic dysregulation of the T helper compartment can be sufficient to trigger spontaneous B cell autoimmunity. Conditional deletion of CTLA-4 on Foxp3-expressing cells in BALB/C mice is associated with development of spontaneous germinal center reactions and expansion of Tfh cells and T follicular regulatory cells57. As discussed above, a loss-of-function mutation in Qa-1 that disrupts CD8+ regulatory T cell activity leads to the spontaneous emergence of autoantibodies and expansion of Tfh-like effector cells14. This cumulative evidence points to the existence of self-reactive CD4+ T cells that play a key role in B cell tolerance and must be properly regulated to prevent spontaneous autoimmunity. In the above-cited cases, it remains unknown whether the Tconv effector cells that arise are derived from pre-existing Tfh-like precursors, and whether the T cells are reactive to self-ligands, microbe-derived ligands, or environmental antigens. Based on the key features of the Group 3 nTfh clones described here, we hypothesize that cells of this class may give rise to the expanded Tfh-phenotype cells observed in some settings of immune dysregulation.
It is important to note that the self-specific nTfh cells identified here display some similarities to a population of “anergic phenotype” CD4+ Tconv cells exhibiting a CD73hi FR4hi phenotype described previously in mice20,49, including high-density expression of PD-1 and CD5 and negligible production of common T helper effector cytokines such as IL-2. However, there are numerous phenotypic differences between these two cell populations that suggest that the subsets are distinct. Specifically, Group 3 nTfh clones are distinguished from anergic-phenotype cells by expression of the Tfh-defining transcription factor Bcl6, high-density expression of numerous markers including Eomes, CD62L, and CD69, and intermediate densities of CD44. Of note, the transcriptional analysis of anergic-phenotype cells performed by Kalekar et al. revealed elevated expression of Bcl620, suggesting that purified polyclonal cells exhibiting a CD73hi FR4hi phenotype may be heterogeneous and contain some contaminating nTfh-like cells, given that some nTfh-like cells can also express high densities of CD73 and FR4. Moreover, it should also be noted that self-specific nTfh cells are distinct from “memory-phenotype” CD4+ Tconv cells19, which are defined by a CD44hi CD62Llo phenotype and therefore differ from CD44int CD62Lhi nTfh cells.
Lastly, it remains unknown whether self-specific Tfh-like cells represent a distinct class of functionally compromised self-reactive T cells, or whether such cells serve a dedicated function in immune regulation. Based on the evidence that Tfh-like Group 3 clones are maintained within the peripheral repertoire and reproducibly adopt a Tfh-like phenotype at baseline, we hypothesize that these cells serve a unique non-redundant function in regulating B cell biology, either at homeostasis or during the course of an immune response. Future work using more advanced genetic tools will be needed to define the functional requirement for nTfh cells in various aspects of homeostasis, immune tolerance, and inflammation.
METHODS
Mice
C57BL/6J (B6; stock no. 000664), B6.SJL-Ptprca Pepcb/BoyJ (B6 CD45.1/.1; stock no. 002014), B6.129S7-Rag1tm1Mom/J (Rag1−/−; stock no. 002216), B6.129S2-Tcratm1Mom/J (Tcrα−/−; stock no. 002116 or 002115;), B6.129(Cg)-Foxp3tm3(DTR/GFP)Ayr/J (Foxp3DTR-EGFP; stock no. 016958), B6.Cg-Foxp3tm2Tch/J (Foxp3EGFP; stock no. 006772), B6.129S2-H2dlAb1-Ea/J (MHCII−/−; stock no. 003584 or 003374), B6.C(Cg)-Cd79atm1(cre)Reth/EhobJ (Mb1Cre; stock no. 020505), and C57BL/6-Gt(ROSA)26Sortm1(HBEGF)Awai/J (Rosa26LSL-DTR; stock no. 007900) mice were obtained from The Jackson Laboratory. B6.CgTg(CD4-cre)1Cwi (Cd4Cre; model no. 4196) mice were obtained from Taconic. TCR Vβ3 transgenic (TCRβtg) mice expressing a fixed TCRβ chain of sequence Vβ3-(TRBV26-ASSLGSSYEQY) were generated in a C57BL/6J background at the University of Chicago Transgenics Core Facility, as previously described21. TCRβtg and Foxp3DTR-EGFP mice were interbred to obtain TCRβtg Foxp3DTR-EGFP mice. Cd4Cre, Tcra−/−, and TCRβtg mice were interbred to obtain Cd4Cre Tcra−/− TCRβtg mice. Cd4Cre Tcra−/− TCRβtg and Foxp3DTR-EGFP mice were interbred to obtain Cd4Cre Tcra−/− TCRβtg Foxp3DTR-EGFP mice. B6 CD45.1/.1 and Foxp3DTR-EGFP mice were interbred to obtain CD45.1/.2 Foxp3DTR-EGFP mice. B6 CD45.1/.1 and Rag1−/− mice were interbred to obtain CD45.1/.1 Rag1−/− mice. Mb1Cre and Rosa26LSL-DTR mice were interbred to obtain Mb1Cre x Rosa26LSL-DTR mice. H2-DM−/− mice on a C57BL/6J background were a generous gift from L. K. Denzin at Rutgers University. C57BL/6J mice housed under germ-free conditions (GF) were generously provided to us by E. B. Chang and B. Jabri at the University of Chicago. All mice were bred and maintained at the University of Chicago under specific-pathogen-free conditions (with the exception of germ-free mice). All mice were housed in rooms with a 12-h light:12-h dark cycle. Animal chow (Teklad 2919 for breeders, Teklad 2018 for all others) was provided freely and changed at least weekly. All experimental procedures were approved by the Institutional Animal Care and Use Committee at the University of Chicago.
Preparation of cell suspensions
Spleen, lymph nodes, and thymi were isolated and mechanically dissociated through 70-μm filters (Corning) in RPMI (Gibco) supplemented with 10% fetal bovine serum (FBS; Gemini Bio-Products) and 1% penicillin and streptomycin (Gibco), referred to as “cRPMI-10”. For the isolation of lymphocytes from non-lymphoid organs, whole male genitourinary tracts were isolated and prostate lobes were separated by microdissection. Prostate lobes, salivary glands, pancreas, and lacrimal glands were injected and digested with pre-warmed RPMI containing 0.4 mg mL−1 Liberase TL (Roche) and 0.2 mg mL−1 DNase I (Roche) for 30 min at 37°C. Digested prostate was mechanically disrupted with frosted microscope slides, while salivary glands, pancreas, and lacrimal glands were mechanically dissociated through 70-μm filters in cRPMI-10. Following dissociation, each tissue sample was centrifuged at 700 × g for 5 min, resuspended in 5 mL of cRPMI-10, overlaid on 5 mL of Histopaque 1119 (Sigma), and centrifuged at 700 × g for 10 min at 20°C with no brake. Viable lymphocytes were isolated from the interface, then washed and resuspended in cRPMI-10.
Antibodies and flow cytometry
Typically, cell suspensions were incubated in staining buffer (phosphate-buffered saline with 2% FBS, 0.1% NaN3, 5% normal rat serum, 5% normal mouse serum, 5% normal rabbit serum, and 10 μg mL−1 2.4G2 FcR blocking antibody) for 20 min on ice (all sera from Jackson Immunoresearch). Fluorochrome-labelled monoclonal antibodies (clones denoted in parenthesis) against B220* (RA3–6B2), CD3ε* (145–2C11), CD4* (GK1.5 or RM4–5), CD5 (53–7.3), CD8α* (53–6.7), CD8β* (YTS156.7.7), CD11b* (M1/70), CD11c* (N418), CD25 (PC61), CD38 (90), CD44 (IM7), CD45.1 (A20), CD45.2 (104), CD62L (MEL-14), CD69 (H1.2F3), CD73 (TY/11.8), CD200 (OX-90), CXCR5 (L138D7), F4/80* (BM8), FR4 (12A5), GL-7 (GL7), ICOS (C398.4A), Neuropilin-1 (12C2), NK1.1* (PK136), PD-1 (RMP1–30), TCRβ* (H57–597), Thy1.1 (OX-7), and Thy1.2 (53–2.1) were purchased from BioLegend, eBioscience, or BD Biosciences unless otherwise noted. Intracellular staining of Bcl6 (1:50 dilution; K112–91), Eomes (Dan11mag), Ki67 (SolA15), Tbet (1:20 dilution; 4B10), GATA3 (TWAJ), RORγt (Q31–378), and Foxp3 (FJK-16s) was performed using the Foxp3 Staining Buffer Set (eBioscience) at 4°C overnight. Asterisks denote antibodies used at a 1:300 dilution in staining buffer. All other antibodies were used at a dilution of 1:100 unless otherwise indicated. For FACS, cells were sorted using a FACSAria II or FACSAria IIIu running FACSDiva (BD Biosciences). Flow cytometry data was acquired on an LSRFortessa or LSRFortessa X-20 running FACSDiva version 8.0.2 (BD Biosciences), or on an Aurora spectral cytometer running SpectroFlo 2.2.0.4 (Cytek Biosciences), and analyzed using FlowJo software (Tree Star). Doublets were excluded to remove dead cells when possible. Unless otherwise noted, TCR “retrogenic” cells were sorted via FACS as CD8α−CD45.1negThy1.1+ cells and identified in flow cytometry analyses as TCRβ+CD4+CD8αnegThy1.1+CD45.1neg cells.
TCR sequencing and analysis
Cell populations of interest were FACS sorted into TRI Reagent (Sigma), frozen in dry ice, and stored at −80°C prior to use. RNA was isolated following a standard chloroform extraction and isopropanol precipitation protocol. Briefly, chloroform was added to each TRI reagent suspension, then vortexed and incubated for 3 min at 20°C. Samples were centrifuged at 12,000 × g for 15 min at 4°C, and the upper aqueous phase was extracted into a new tube, while avoiding the interface. RNA was precipitated by adding isopropanol along with 20 μg glycogen, then mixed and stored at −80°C for at least 30 min. Precipitated RNA was pelleted by centrifugation at 12,000 × g for 10 min at 4°C, and the pellet was washed with 70–75% ethanol, then air-dried and resuspended in molecular grade RNase-free water. Purified RNA was subjected to TCRα sequencing using the Amp2Seq service from iRepertoire, a platform based on semi-quantitative multiplex PCR coupled with Illumina sequencing. This approach allows analysis of the complete TCRα repertoire, regardless of variable-region usage. Typically, >8 × 10⁵ sequence reads were obtained per sample.
For each TCRα peptide sequence, the sum of the corresponding cDNA sequence reads was divided by the total TCRα sequence reads within a given sample to obtain the frequency of each TCRα peptide sequence per sample. “Recurrent” clones were defined as TCRα clonotypes for which the frequency was non-zero across all five samples sequenced for a given non-lymphoid organ. Typically, the most abundant TCRα clonotypes within a site of interest were determined by ranking recurrent TCRα sequences by median frequency in decreasing order.
TCR construct design and cloning
The recombined Trav chain sequences of interest were obtained from cDNA sequence reads acquired by the iRepertoire sequencing platform. The Trav chain and the Trac constant region were synthesized into pUC57 plasmids (Genscript) and cloned into a conditional retroviral vector, pMGflThy1.126, as described below. The pMGflThy1.1 vector is designed such that expression is conditional on Cre-mediated excision of a lox-flanked STOP inserted 5’ of the TCRα coding segment. Downstream of the TCRα coding segment is an IRES followed by mouse Thy1.1, such that positively infected cells could be distinguished by staining for the retrovirally encoded Thy1.1 protein and detected by flow cytometry. The Trav and Trac segments were PCR amplified using the Phusion high-fidelity polymerase (New England Biolabs) with dNTPs in 5X Phusion HF buffer (New England Biolabs). Primers were designed using the NEBuilder Assembly Tool (New England Biolabs) and obtained from IDT. The pMGflThy1.1 vector was digested with restriction enzymes AgeI and NotI (New England Biolabs) for 12 hr at 37°C. PCR products as well as the AgeI- and NotI-digested pMGflThy1.1 vector were gel purified using a QIAquick Gel Extraction Kit (QIAGEN). Purified Trav and Trac products were assembled together with the purified AgeI- and NotI-digested pMGflThy1.1 vector using the Gibson Assembly Master Mix (New England Biolabs) for 60–90 min at 50°C. Assembled product was transformed into high-efficiency 5-alpha competent E. coli (New England Biolabs), and plasmids carrying the correct insert were purified using an EndoFree Plasmid Maxi Kit (QIAGEN). Plasmid preparations were sequenced to verify the TCR insert. Sequence alignment and proper in-frame sequence expression was confirmed using Snapgene, version 4.0.8 (GSL Biotech). Primers used are denoted in Supplementary Table 3.
Retrovirus production, infection, and primary TCR retrogenic mice generation
Conditional retrovirus was produced using Plat-E cells after the Tcra genes were inserted into the conditional retroviral vector, pMGflThy1.1 (described above and in ref26). Tcra constructs were transfected into Plat-E packaging cells using lipofectamine (Life Technologies). Harvested retroviral supernatant was filtered through a 0.45 μm filter, frozen in a dry ice and ethanol bath, and stored at −80°C prior to use.
TCR Vβ3 transgenic Cd4-Cre Tcra−/− mice (Foxp3wt) were retro-orbitally injected with 150 mg kg−1 5-Fluorouracil (Fresenius Kabi) 3 days prior to bone marrow harvest. Bone marrow was harvested by first cutting the epiphysis on each end of the femur bones, then by flushing the marrow out of each open end using a 30-gauge needle and syringe through a 40-μm filter. After harvest, bone marrow was cultured for 2 days in X-vivo 10 medium (Lonza) supplemented with 15% FBS (Gemin Bio-Products), 1% penicillin and streptomycin (Gibco), 100 ng mL−1 mouse SCF, 10 ng mL−1 mouse IL-3, and 20 ng mL−1 mouse IL-6 (all from BioLegend). Cultures were maintained at 37°C with 5% CO2 in a CO2 incubator (Sanyo Electric). Stimulated cells were infected with Tcra-encoding retrovirus in the presence of 4 μg mL−1 polybrene (EMD Millipore) by centrifugation at 900 × g for 90 min at 37°C. After 24 hr of additional culture in X-vivo 10 medium (supplemented as described above), transduced bone marrow cells were harvested and mixed with 5 × 10⁶ freshly harvested “filler” bone marrow cells from CD45.1/.1 Rag1−/− mice prior to injection. 24 hr prior to injection, recipient mice (CD45.1/.1) were lethally irradiated with 850–900 rads from an irradiator with an X-ray source. 24 hr after irradiation, recipient mice were retro-orbitally injected with the mixture of infected and filler CD45.1/.1 Rag1−/− bone marrow to generate “primary TCR retrogenic” mice. Typically, primary TCR retrogenic mice were analyzed 6–8 weeks after bone marrow reconstitution. Prior to analysis, proper expression of the transduced TCRα chains by donor cells was confirmed by staining peripheral blood leukocytes with antibodies specific for CD45.1, Thy1.1, TCRβ, and CD4.
Generation of low-frequency TCR retrogenic mixed bone marrow chimeras
Bone marrow cells were harvested, infected, and cultured as described above. Prior to injection, infected bone marrow cells were harvested from culture and mixed at varying ratios with 5 × 10⁶ freshly harvested “filler“ bone marrow cells isolated from B6 CD45.1/.1 mice, such that infected bone marrow constituted approximately 20%, 14% or 8% of total inoculum. 24 hr prior to injection, recipient mice (B6 CD45.1/.1) were sub-lethally irradiated with 500 rads from an irradiator with an X-ray source. 24 hr after irradiation, recipient mice were retro-orbitally injected with the mixture of infected and filler B6 CD45.1/.1 bone marrow to generate low-frequency “TCR retrogenic” mixed bone marrow chimeric mice. Typically, chimeric mice were analyzed 6–8 weeks after reconstitution. Prior to analysis, proper expression of the transduced TCRα chains by donor cells was confirmed by staining peripheral blood leukocytes with antibodies specific for CD45.1, Thy1.1, TCRβ, and CD4.
In vitro T cell stimulation assays
All experiments were performed in RPMI containing 10% FBS (Atlanta Biologicals), 1% penicillin and streptomycin, 0.1% β-mercaptoethanol (Gibco), and 100 U mL−1 recombinant mouse interleukin-2 (IL-2) (Miltenyi Biotec), unless absence of IL-2 was specified. In addition, all cell cultures were maintained in 384-well clear round bottom ultra-low attachment spheroid microplates (Corning) at 37°C with 5% CO2 in a CO2 incubator (Sanyo Electric). Pooled spleen and lymph nodes were isolated from primary TCR retrogenic hosts, enriched for CD4+ T cells using the mouse CD4+ T Cell Isolation Kit (Miltenyi Biotec), and stained with antibodies against CD8β, CD45.1, and Thy1.1 prior to FACS sorting. T cells expressing the TCRα chains of interest (“TCR retrogenic cells”) were isolated by FACS sorting CD4-enriched lymphocytes for CD8βnegCD45.1negThy1.1+ cells. Isolated TCR retrogenic cells were labeled using the CellTrace Violet (CTV) Cell Proliferation Kit (Invitrogen) following manufacturer’s protocol, with slight modifications. In brief, sorted cells were resuspended in pre-warmed phosphate-buffered saline containing 0.625 μM CTV and incubated for 20 min at 37°C. The reaction was quenched by the addition of 10 mL cold cRPMI-10, then washed with cRPMI-10. To obtain splenic dendritic cells (DCs), spleens were isolated from various genetic mouse strains (B6 CD45.1/.1, GF, H2-DM−/−, and MHCII−/−), injected and digested with pre-warmed RPMI containing 0.4 mg mL−1 Liberase TL (Roche) and 0.2 mg mL−1 DNase I (Roche) for 20 min at 37°C, mechanically dissociated through a 100-μm filter (Corning), and enriched for CD11c+ cells using the mouse CD11c MicroBeads UltraPure kit (Miltenyi Biotec). In select instances in which DCs from other anatomical sites were used, the same procedures were followed for cells isolated from the indicated sites. 1–2.5 × 10⁴ of CTV-labeled TCR retrogenic cells were co-cultured in vitro with 5 × 10⁴ CD11c+ DCs for 5 days. When specified, anti-MHC-II blocking antibody (clone M5/114.15.2, BD Biosciences) or IgG2b, κ isotype control antibody (BD Biosciences) was added to indicated cultures at a final concentration of 5 μg mL−1. As a positive control, CTV-labeled TCR retrogenic T cells were co-cultured with anti-CD3ε/anti-CD28 MACSiBead particles at a 1:1 ratio using the mouse T Cell Activation/Expansion Kit (Miltenyi Biotec) following manufacturer’s protocol. For all experiments, dilution of CTV and total T cell number were assessed by flow cytometry on day 5.
Preparation of protein lysates
In select instances in which protein lysates were included in the culture of in vitro T cell stimulation assays, protein extracts were prepared as previously described58. Briefly, prostates of 8-week-old male mice (B6 or Foxp3DTR-EGFP mice depleted of Treg cells for 12 days) were isolated and incubated separately in phosphate-buffered saline (PBS) for 5 min at 20°C, then centrifuged at 10,000 × g for 5 min at 4°C. The supernatant (i.e. secreted fraction) was removed, while the remaining pellet was resuspended in PBS and dissociated using a PowerGEN 1000 homogenizer generator (Fisher) and a hard tissue probe (Omni International). The dissociated suspension was centrifuged at 16,000 × g for 5 min at 4°C, and the supernatant (i.e. lysate fraction) was transferred into a new tube. The total protein content was quantified by the Bradford assay using the Bio-Rad Protein Assay Dye Reagent (Bio-Rad Laboratories) and a spectrophotometer. The protein lysates were flash frozen in liquid nitrogen and stored at −80°C prior to use. Protein lysates were added to the indicated cultures at a final concentration of 0.1 mg mL−1.
Immunofluorescence microscopy
Spleens were isolated from primary TCRrg hosts, briefly rinsed in phosphate-buffered saline (PBS) at 4°C, and immediately frozen in embedding medium for optimal cutting temperature (Tissue-Tek OCT, Sakura Finetek) using cryomold trays placed on dry ice, then stored at −80°C prior to use. Frozen spleen samples were serially sectioned at a thickness of 6 μm using a cryostat (University of Chicago Human Tissue Resource Center). Tissue sections were fixed in 4% paraformaldehyde for 10 min, washed with PBS, and incubated in solution containing 10% normal donkey serum (Jackson ImmunoResearch) and 1:200 dilution of anti-mouse Fc antibody (BD Biosciences). Sections were then stained with anti-mouse/human B220-BV421 (clone RA3–6B2) and anti-mouse TCR Vβ3-PE (clone KJ25). Following staining, tissue sections were mounted onto glass microscope slides using ProLong Gold Antifade Mountant (Invitrogen) and visualized 24–48 h later by confocal microscopy. Images were acquired using the SP8 laser scanning confocal microscope (Leica Microsystems) with 20x/0.7 multi-immersion objective, at 12-bit depth and 1,024 by 1,024-pixel size, running Leica Application Suite X61. Images were processed for despeckling and background fluorescence subtraction using Fiji (version 2.3.0/1.53q, open-source software)62.
Following image processing, regions of interest (ROIs) focused on B cell follicles (B220+ areas) or T cell zones (B220neg CD4+) were defined as squares with length and width equal to 256 pixels (116.36 μm). All ROIs were defined by a single reviewer blinded to sample identity. Vβ3+ cells were counted in each ROI by a separate individual, also blinded to sample identity.
Analysis of cytokine production
For assessment of cytokine production by intracellular staining, cells were cultured in RPMI (Gibco) containing 10% FBS (Gemini Bio-Products), 50 ng mL−1 PMA, and 500 ng mL−1 Ionomycin in U-bottom 96-well plates (Corning) for 1 hr at 37°C, followed by addition of 2 μM monensin (eBioscience) for another 4 hr at 37°C. Cells were then permeabilized using the Foxp3 Staining Buffer Set (eBioscience), and stained for intracellular cytokines at 4°C overnight. Fluorochrome-labeled monoclonal antibodies (clones denoted in parenthesis) against IFN-γ (XMG1.2), IL-4 (11B11), and IL-10 (JES5–16E3) were purchased from BD Biosciences, IL-17 (TC11–18H10.1) was purchased from BioLegend, and IL-21 (mhalx21) from eBioscience. All antibodies were used at a dilution of 1:100. Flow cytometry data was acquired on an LSRFortessa or LSRFortessa X-20 (BD Biosciences), or on an Aurora spectral cytometer running SpectroFlo 2.2.0.4 (Cytek Biosciences), and analyzed using FlowJo software (Tree Star).
Systemic Treg cell ablation
Diphtheria toxin (Sigma) was reconstituted at 5 μg mL−1 in sterile molecular grade water following manufacturer’s protocol and stored at −80°C prior to use. Diphtheria toxin aliquots were frozen and thawed once and 50 μg kg−1 of diphtheria toxin was injected intraperitoneally on days 0 and 1, then every other day until day 12. Mice were monitored for signs of terminal autoimmune disease and were sacrificed once moribund.
B cell depletion
InVivoPlus anti-mouse CD20 (clone MB20–11, IgG2c, BioXCell) was resuspended in sterile phosphate-buffered saline (PBS) to a final concentration of 250 μg per 200 μL, as described in reference63. In parallel, InVivoPlus rat IgG2a control antibody, anti-trinitrophenol (clone 2A3, BioXCell), was also diluted in PBS to a final concentration of 250 μg per 200 μL. Mice were injected once intraperitoneally with 250 μg of anti-CD20 or isotype control solution and monitored daily for one week.
RNA-seq, quality control and quantification
Sample processing, sequencing, and analysis
Spleen and lymph nodes were isolated from primary TCR “retrogenic” (TCRrg) mice 17–25 weeks after bone marrow reconstitution and processed for sorting as described above (see Methods, In vivo adoptive T cell transfer). At least 1 × 10⁴ TCRrg CD4+ T cells were FACS sorted from each sample using a FACSAriaII cell sorter (BD Biosciences) and resuspended in TRI Reagent (Sigma). TCRrg T cells were selected by gating on Dumpneg (B220negCD11bnegCD11cnegF4/80neg), followed by CD4+CD8βneg, then by Thy1.1+CD45.1neg. Biological samples containing at least 1 × 10⁵ TCRrg CD4+ T cells were subjected to RNA sequencing. Total RNA was isolated following a standard chloroform extraction and isopropanol precipitation protocol as described above (see Methods, TCR sequencing and analysis). RNA quality and quantity was assessed using the Agilent bio-analyzer. Strand-specific RNA-seq libraries were prepared using the TruSEQ mRNA RNA-seq library protocol (Illumina). Library quality and quantity was assessed using the Agilent bio-analyzer. Sequencing of RNA-seq libraries was performed on the NovaSeq 6000, running 100 bp paired-end reads (PE100) and generating approximately 60 million reads per sample. Raw reads were aligned to reference genome mm10 using the STAR aligner64. ENSEMBL genes were quantified using FeatureCounts65. Differential expression statistics (fold-change and p-value) and normalized expression values were computed using edgeR66,67 using the exactTest() function. P-values were adjusted for multiple testing using the false discovery rate (FDR) correction of Benjamini and Hochberg68. Significant genes were determined based on a FDR threshold of 5% (0.05).
Gene Set Enrichment Analysis
Gene Set Enrichment Analysis (GSEA) was performed on normalized Log2 [counts per million] values from RNA-seq data. q values were determined using the Broad Institute GSEA program’s default settings, implementing the Signal2Noise test coupled to a Benjamini–Hochberg p value correction algorithm (see ref28).
Enrichment against custom gene list
Up- and down-regulated genes were compared to a custom list of 25 genes that have been implicated in T follicular helper cell differentiation, maintenance, and function, curated from the literature37–40. Enrichment log ratios and p-values were computed using Fisher’s Exact test, with the set of all expressed genes as a background.
Data visualizations
Principle component analysis on log-scaled normalized expression (log2 counts per million, or CPM) was run in R, and scatterplot of PC1 vs PC2 was plotted in R. Volcano plot of -log10 q-value vs log2 fold-change for genes with average log2 CPM ≥ −1 was plotted in R. Heatmap of z-scored log2 CPM values for custom genes was plotted in R.
Sample size determination and randomization
No statistical methods were used to predetermine sample sizes. All experiments used sample sizes consistent with those reported in previous publications (see refs25,69,70). For all experiments, the exact sample size is shown in the figure panels and listed in the figure legends.
For generation of TCRrg mice, donor mice of the appropriate genotype were randomly selected for bone marrow isolation and retroviral transduction with a Group 1 or Group 3 TCR. Recipient mice were age-matched to donor mice but were otherwise randomized to TCRrg bone marrow treatment. Unless otherwise noted, all mice were used at 6 to 24 weeks of age. Both female and male mice were used, as noted in figured legends. Experiments involving FACS isolation and transfer or stimulation of TCRrg cells did not require randomization, as cells were harvested from all available TCRrg mice and pooled by TCR. Recipient mice in adoptive transfer studies were randomized to treatment condition. In all other settings, including Treg cell depletion and B cell depletion, mice in each cage were randomly assigned to each treatment group. Littermate controls were used whenever possible to control for age, potential effects of the microbiota, and rare polymorphisms in various mouse lines on the B6 background.
Blinding and data exclusion
For the RNA sequencing experiments in Fig. 3 and Extended Data Fig. 5, sequencing data acquisition and quality control were conducted by researchers blinded to sample identity. In Fig. 3, immunofluorescence microscopy (IF) images were collected, processed, and analyzed by researchers blinded to sample identity. Data resulting from IF were unblinded at time of analysis by the co-first authors. For all other experiments, data collection and analysis were not performed blind to the conditions of the experiments, as investigators used mouse ages and genotypes to establish experimental groups.
Mice displaying signs of pathology unrelated to experimental approaches were excluded from analysis to ensure that any immunological changes were appropriately attributed to experimental manipulations. Samples for which one or more flow cytometry antibodies were inadvertently omitted from the staining mix were excluded from analysis due to an inability to property gated on cells of interest. In Fig. 5, one outlier was excluded from analysis per the Grubbs’ test. Otherwise, all collected data were included in analyses.
Statistical analysis
Prism (GraphPad) was used for data analysis and determination of statistical significance. Student’s t-tests (two-tailed), Welch’s t-tests, or Mann-Whitney U-tests were used for the comparison of two groups, correcting for multiple comparisons using the Holm-Šídák method when appropriate. For the comparison of paired groups, the paired t-test was used. For comparison of multiple groups, ordinary one-way ANOVA or Kruskal-Wallis tests were employed, coupled with Dunnett’s test or Dunn’s test when appropriate. Tests were used as indicated in the figure legends. While data distribution was largely assumed to be normal, the Shapiro-Wilk normality test was employed for experiments with large sample sizes to determine the appropriateness of nonparametric versus parametric tests. *p < 0.05; **p < 0.01; ***p < 0.001; ****p < 0.0001, unless otherwise specified. p ≥ 0.05 was considered not to be statistically significant.
Extended Data
Extended Data Fig. 1. Recurrent CD4+ Tconv clones detected in the prostate of Treg cell-depleted mice are found at low frequencies amongst Tconv and Treg subsets of other reference data sets.
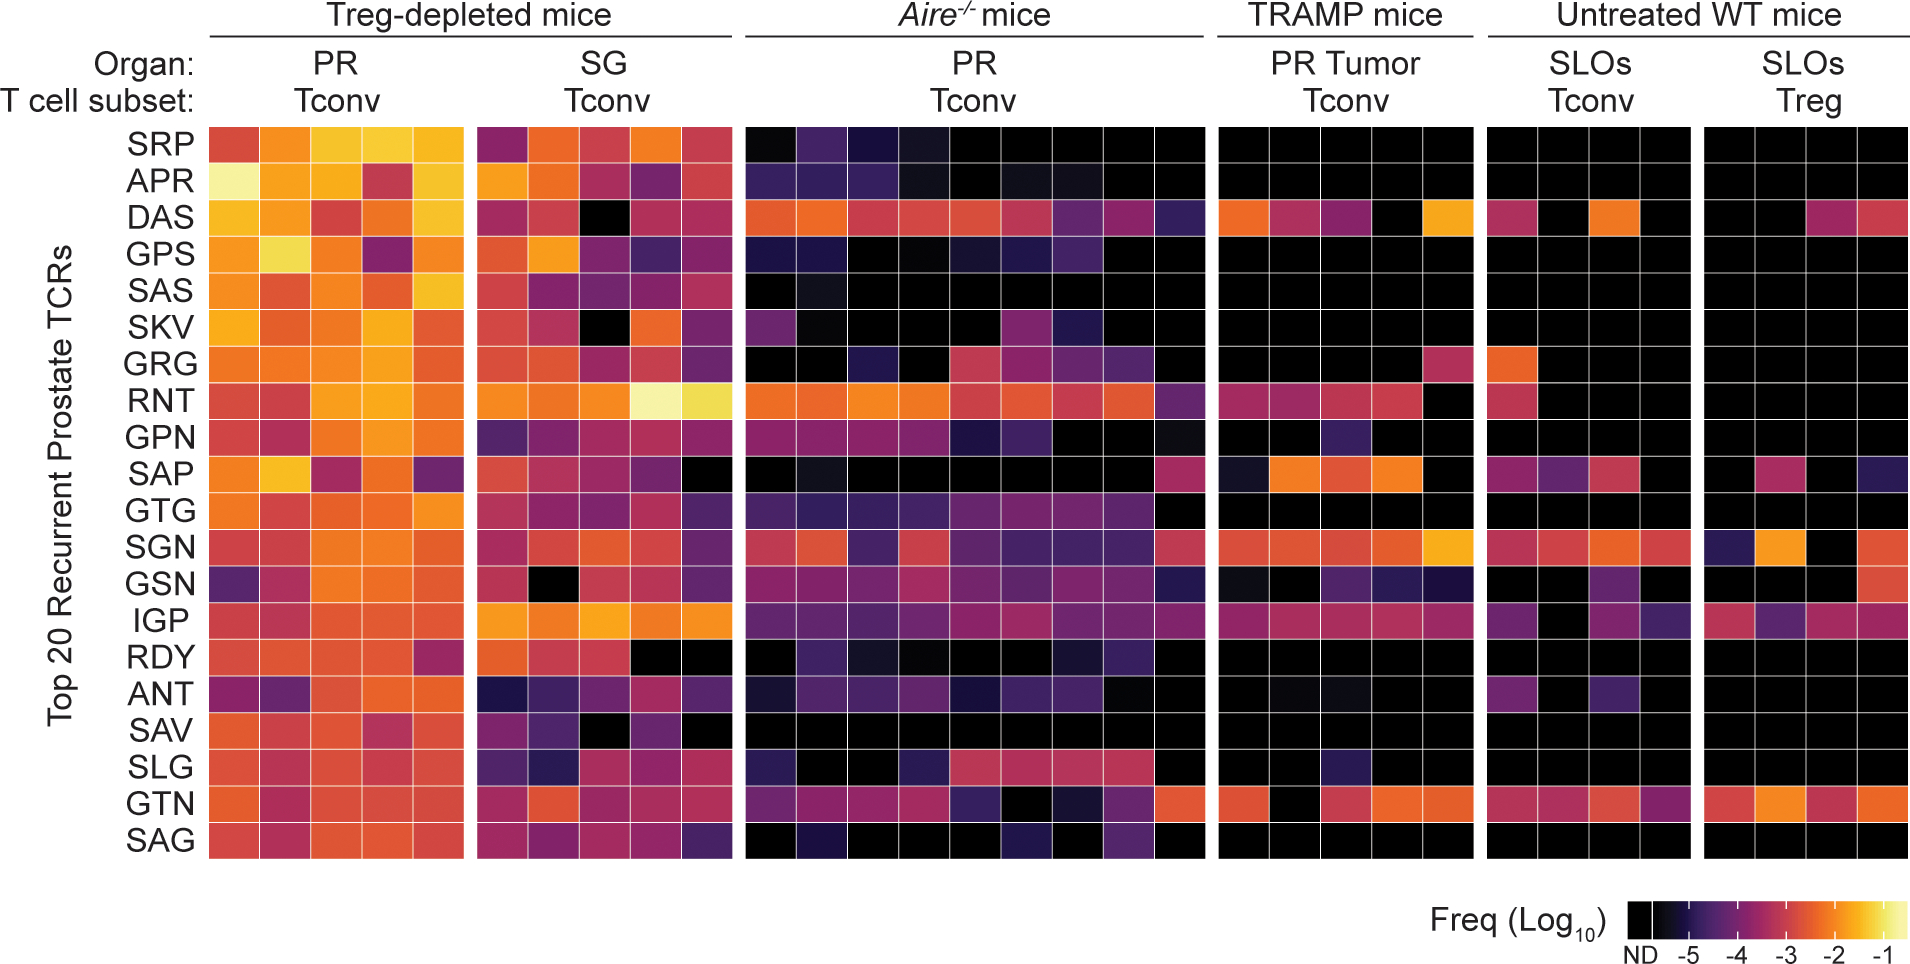
Heat map displaying the 20 TCRα sequences from Figure 1C and their corresponding log10 frequency in six groups of samples, as indicated. From left to right, these groups are Tconv cells from the prostate of Treg-depleted Foxp3DTR-EGFP males (n = 5), Tconv cells from the salivary glands of Treg-depleted Foxp3DTR-EGFP males (n = 5), Tconv cells from the prostate of untreated Aire−/− males (n = 9), Tconv cells from the prostate of untreated TRAMP males (n = 5), Tconv cells from the pooled secondary lymphoid organs (SLOs) of untreated wild-type Foxp3GFP males (n = 4), and Treg cells from the SLOs of untreated wild-type Foxp3GFP males (n = 4). Data from the latter two groups and Aire−/− group are taken from ref22. Each column represents one biological sample. ND = not detected.
Extended Data Fig. 2. Representative flow cytometric analysis of TCRrg mice expressing Group 1 vs. Group 3 TCRs.
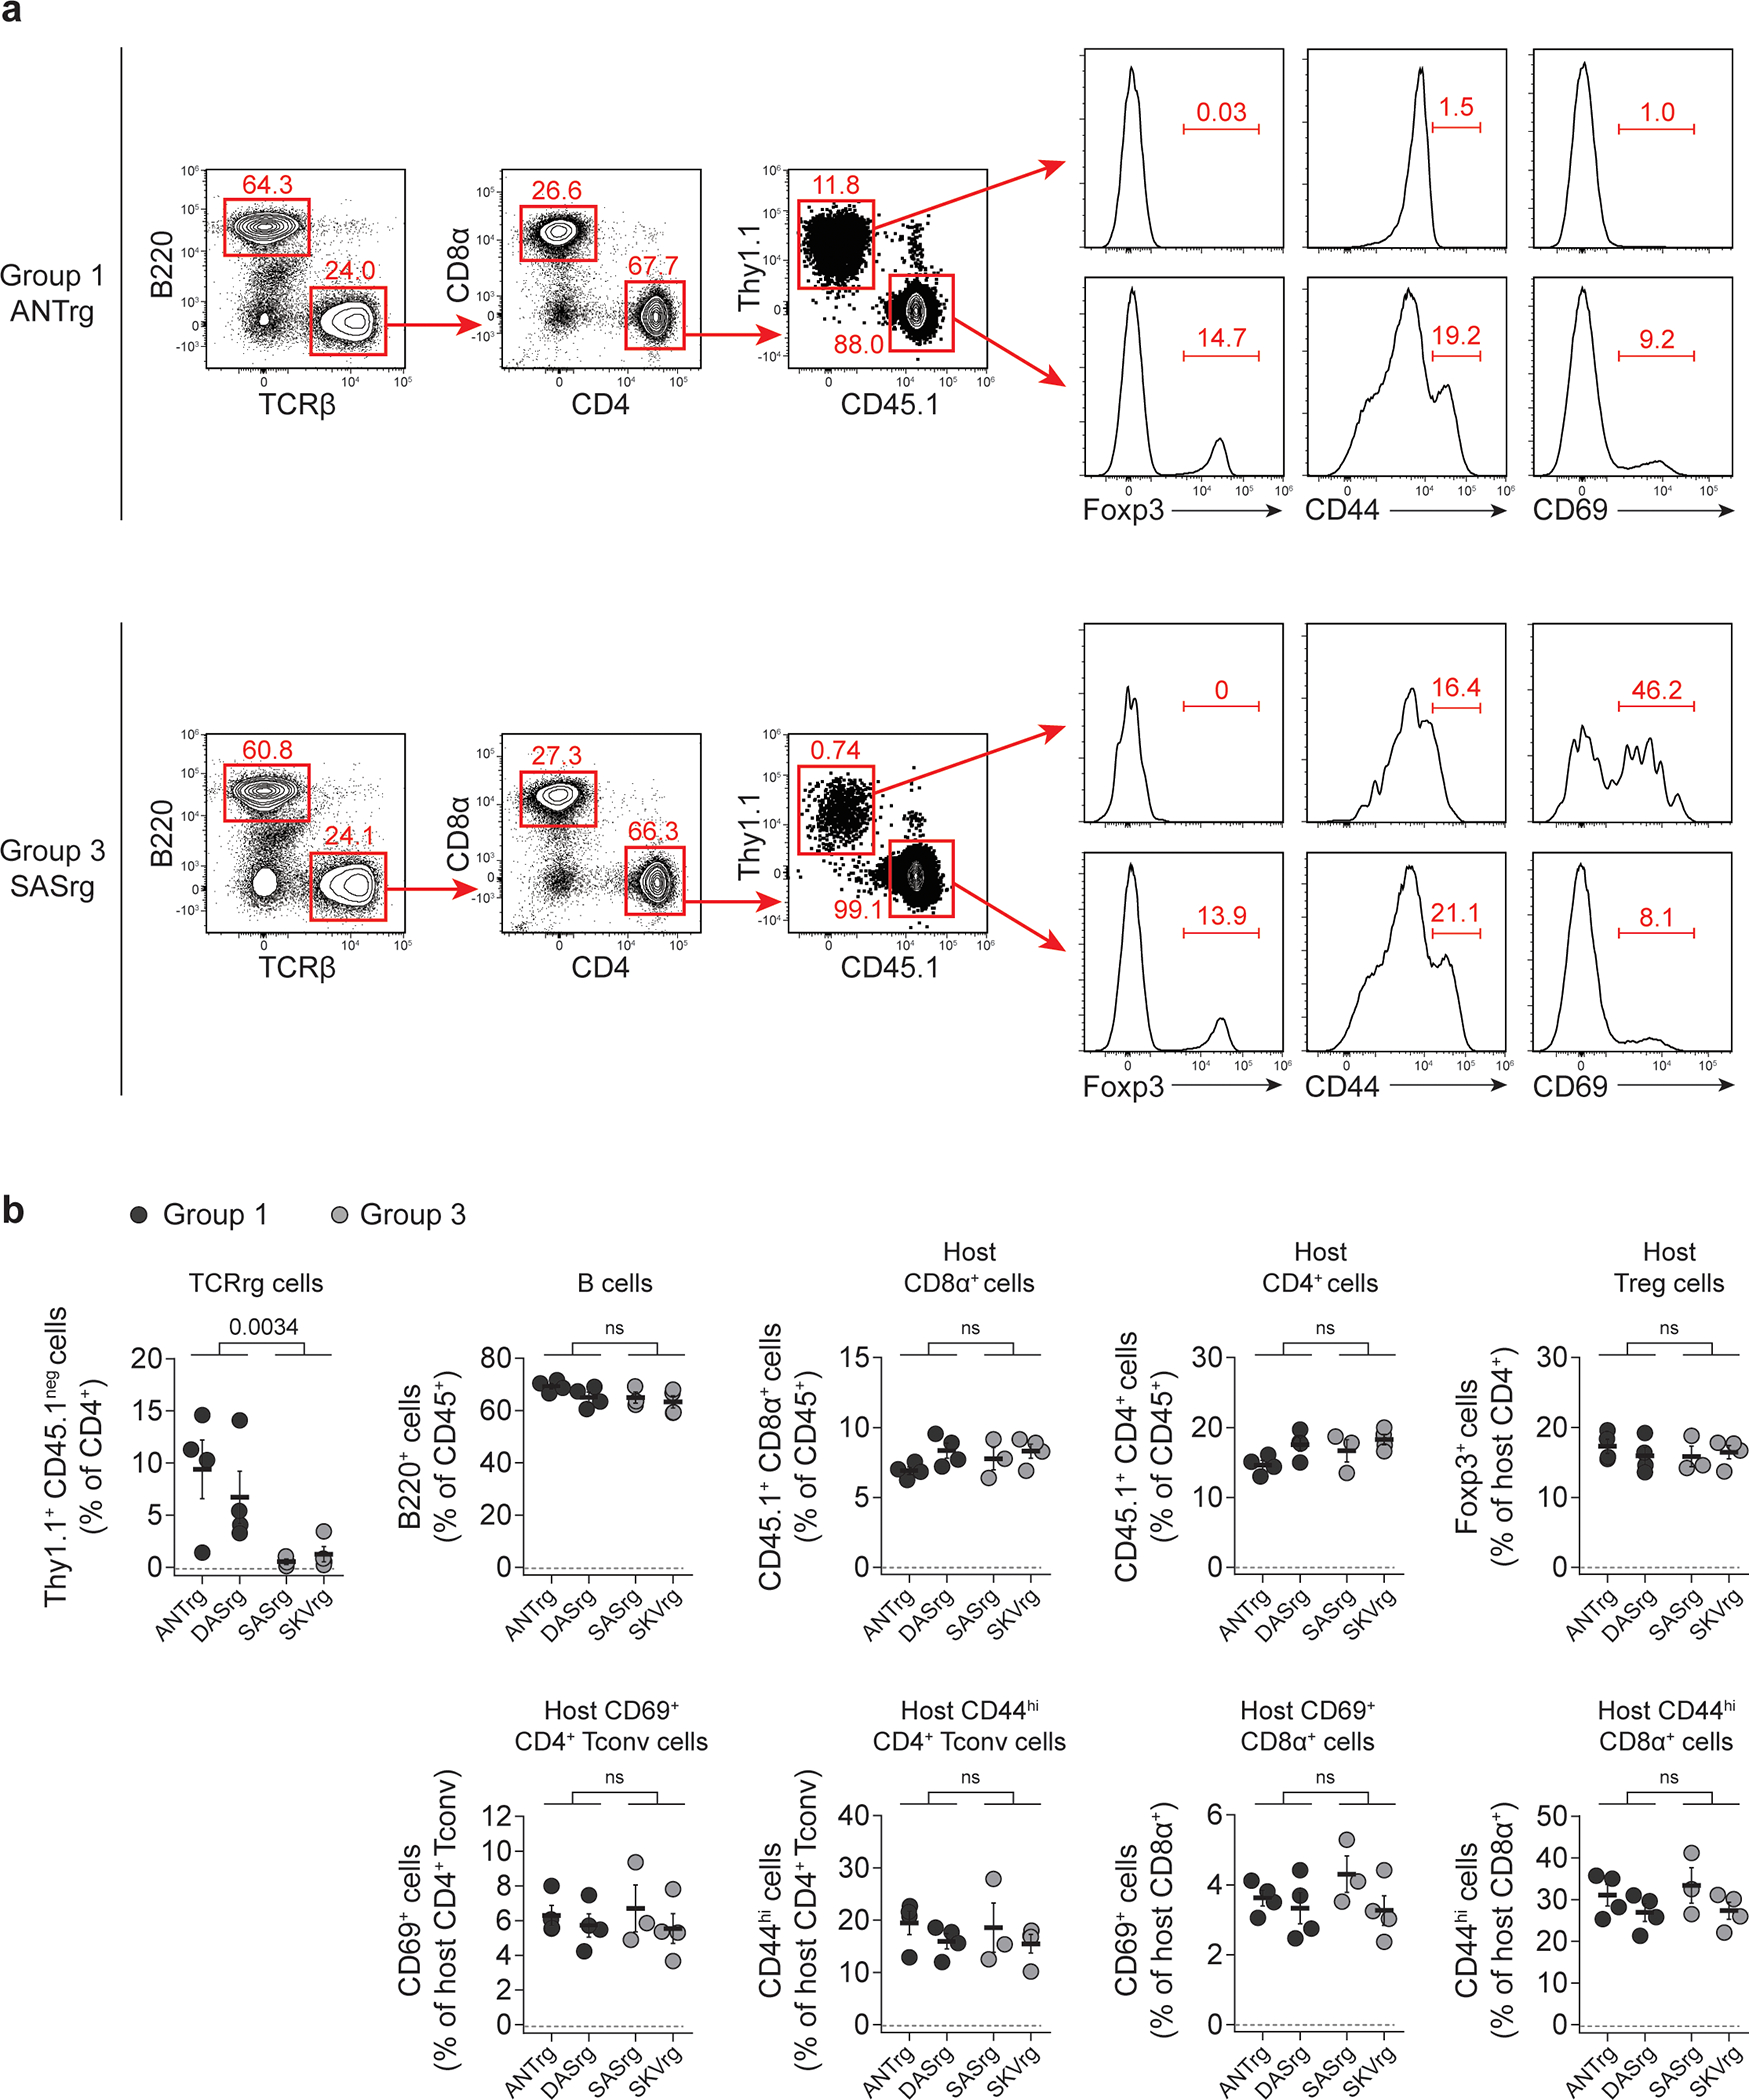
Two Group 1 TCRs (ANT and DAS) and two Group 3 TCRs (SAS and SKV) were expressed as TCRrg mice. >6 weeks after bone marrow reconstitution, TCRrg T cells were directly phenotyped using flow cytometry.
a, Representative gating strategy schematic and flow cytometric analysis of Foxp3, CD44, and CD69 expression by splenic Group 1 (top) and Group 3 (bottom) TCRrg T cells (top row, TCRβ+CD4+Thy1.1+) or respective host T cells (TCRβ+CD4+CD45.1+). T cells were selected by gating on TCRβ+B220neg, followed by CD4+CD8βneg, then by Thy1.1+CD45.1neg (for TCRrg T cells) or Thy1.1negCD45.1+ (for host T cells).
b, Summary plot of data from a showing the frequency of splenic Group 1 (black symbols) and Group 3 (gray symbols) TCRrg T cells (TCRβ+CD4+Thy1.1+) within TCRβ+CD4+ gate. Summary plot of data from a showing the frequency of B cells (B220+) within CD45.1+ gate. Summary plot of data from a showing the frequency of host CD8α+ cells (CD45.1+CD8α+) within CD45+ gate. Summary plot of data from a showing the frequency of host CD4+ cells (CD45.1+CD4+) within CD45+ gate. Summary plot of data from a showing the frequency of Treg cells (Foxp3+) within host CD4+ gate. Summary plot of data from a showing the percentage of host Tconv cells (CD45.1+CD4+Foxp3neg) expressing CD69. Summary plot of data from a showing the percentage of host Tconv cells (CD45.1+CD4+Foxp3neg) expressing CD44. Summary plot of data from a showing the percentage of host CD8α+ cells (CD45.1+CD8α+) expressing CD69. Summary plot of data from a showing the percentage of host CD8α+ cells (CD45.1+CD8α+) expressing CD44. n = 3–4 per TCRrg. Data are pooled from two independent experiments. Each symbol depicts cells from an individual TCRrg mouse.
Bold horizontal lines represent means. Error bars represent means ± SEM. p values were calculated using Student’s t-test (two-tailed) for pooled Group 1 clones versus pooled Group 3 clones. ns, p ≥ 0.05, not significant. Source data contain exact p values and group sizes.
Extended Data Fig. 3. Multiple recurrent prostate-infiltrating CD4+ Tconv clones exhibit hallmarks of steady-state activation.
Three Group 1 and four Group 3 TCRs were expressed as TCRrg mice. >6 weeks after bone marrow reconstitution, TCRrg T cells were directly phenotyped using flow cytometry.
a, Summary plot of data from Fig. 2a,b showing the percentage of CD69 expression by Group 1 (black symbols) and Group 3 (gray symbols) TCRrg T cells (TCRβ+CD4+Thy1.1+) isolated from the indicated regional lymph nodes of primary TCRrg mice (n = 1–7 per TCRrg). Data are pooled from eleven independent experiments. Each symbol depicts cells from an individual TCRrg mouse. iLN, inguinal lymph nodes; aLN, axillary lymph nodes; bLN, brachial lymph nodes; cLN, cervical lymph nodes; pLN, para-aortic lymph nodes; mLN, mesenteric lymph nodes.
b, Representative flow cytometric analysis of Ki67 expression by Group 1 (top) and Group 3 (bottom) TCRrg T cells (TCRβ+CD4+Thy1.1+) isolated from the spleen of primary TCRrg mice. SP, spleen.
c, Summary plot of data from b showing the percentage of Ki67 expression by Group 1 (black symbols) and Group 3 (gray symbols) TCRrg T cells (TCRβ+CD4+Thy1.1+) isolated from the spleen or pooled lymph nodes of primary TCRrg mice (n = 1–8 per TCRrg). Data are pooled from eight independent experiments. Each symbol depicts cells from an individual TCRrg mouse. SP, spleen; LN, pooled lymph nodes (which include inguinal, axillary, brachial, cervical, para-aortic, and mesenteric lymph nodes).
Bold horizontal lines represent means. Error bars represent means ± SEM. p values were calculated using Student’s t-test (two-tailed) for pooled Group 1 clones versus pooled Group 3 clones. ns, p ≥ 0.05. ns, not significant. Source data contain exact p values and group sizes.
Extended Data Fig. 4. Recurrent CD4+ Tconv clones detected in the prostate of Treg cell-depleted mice can be binned into three groups based on hallmarks of steady-state activation and reactivity to MHC-II-restricted self-ligands.
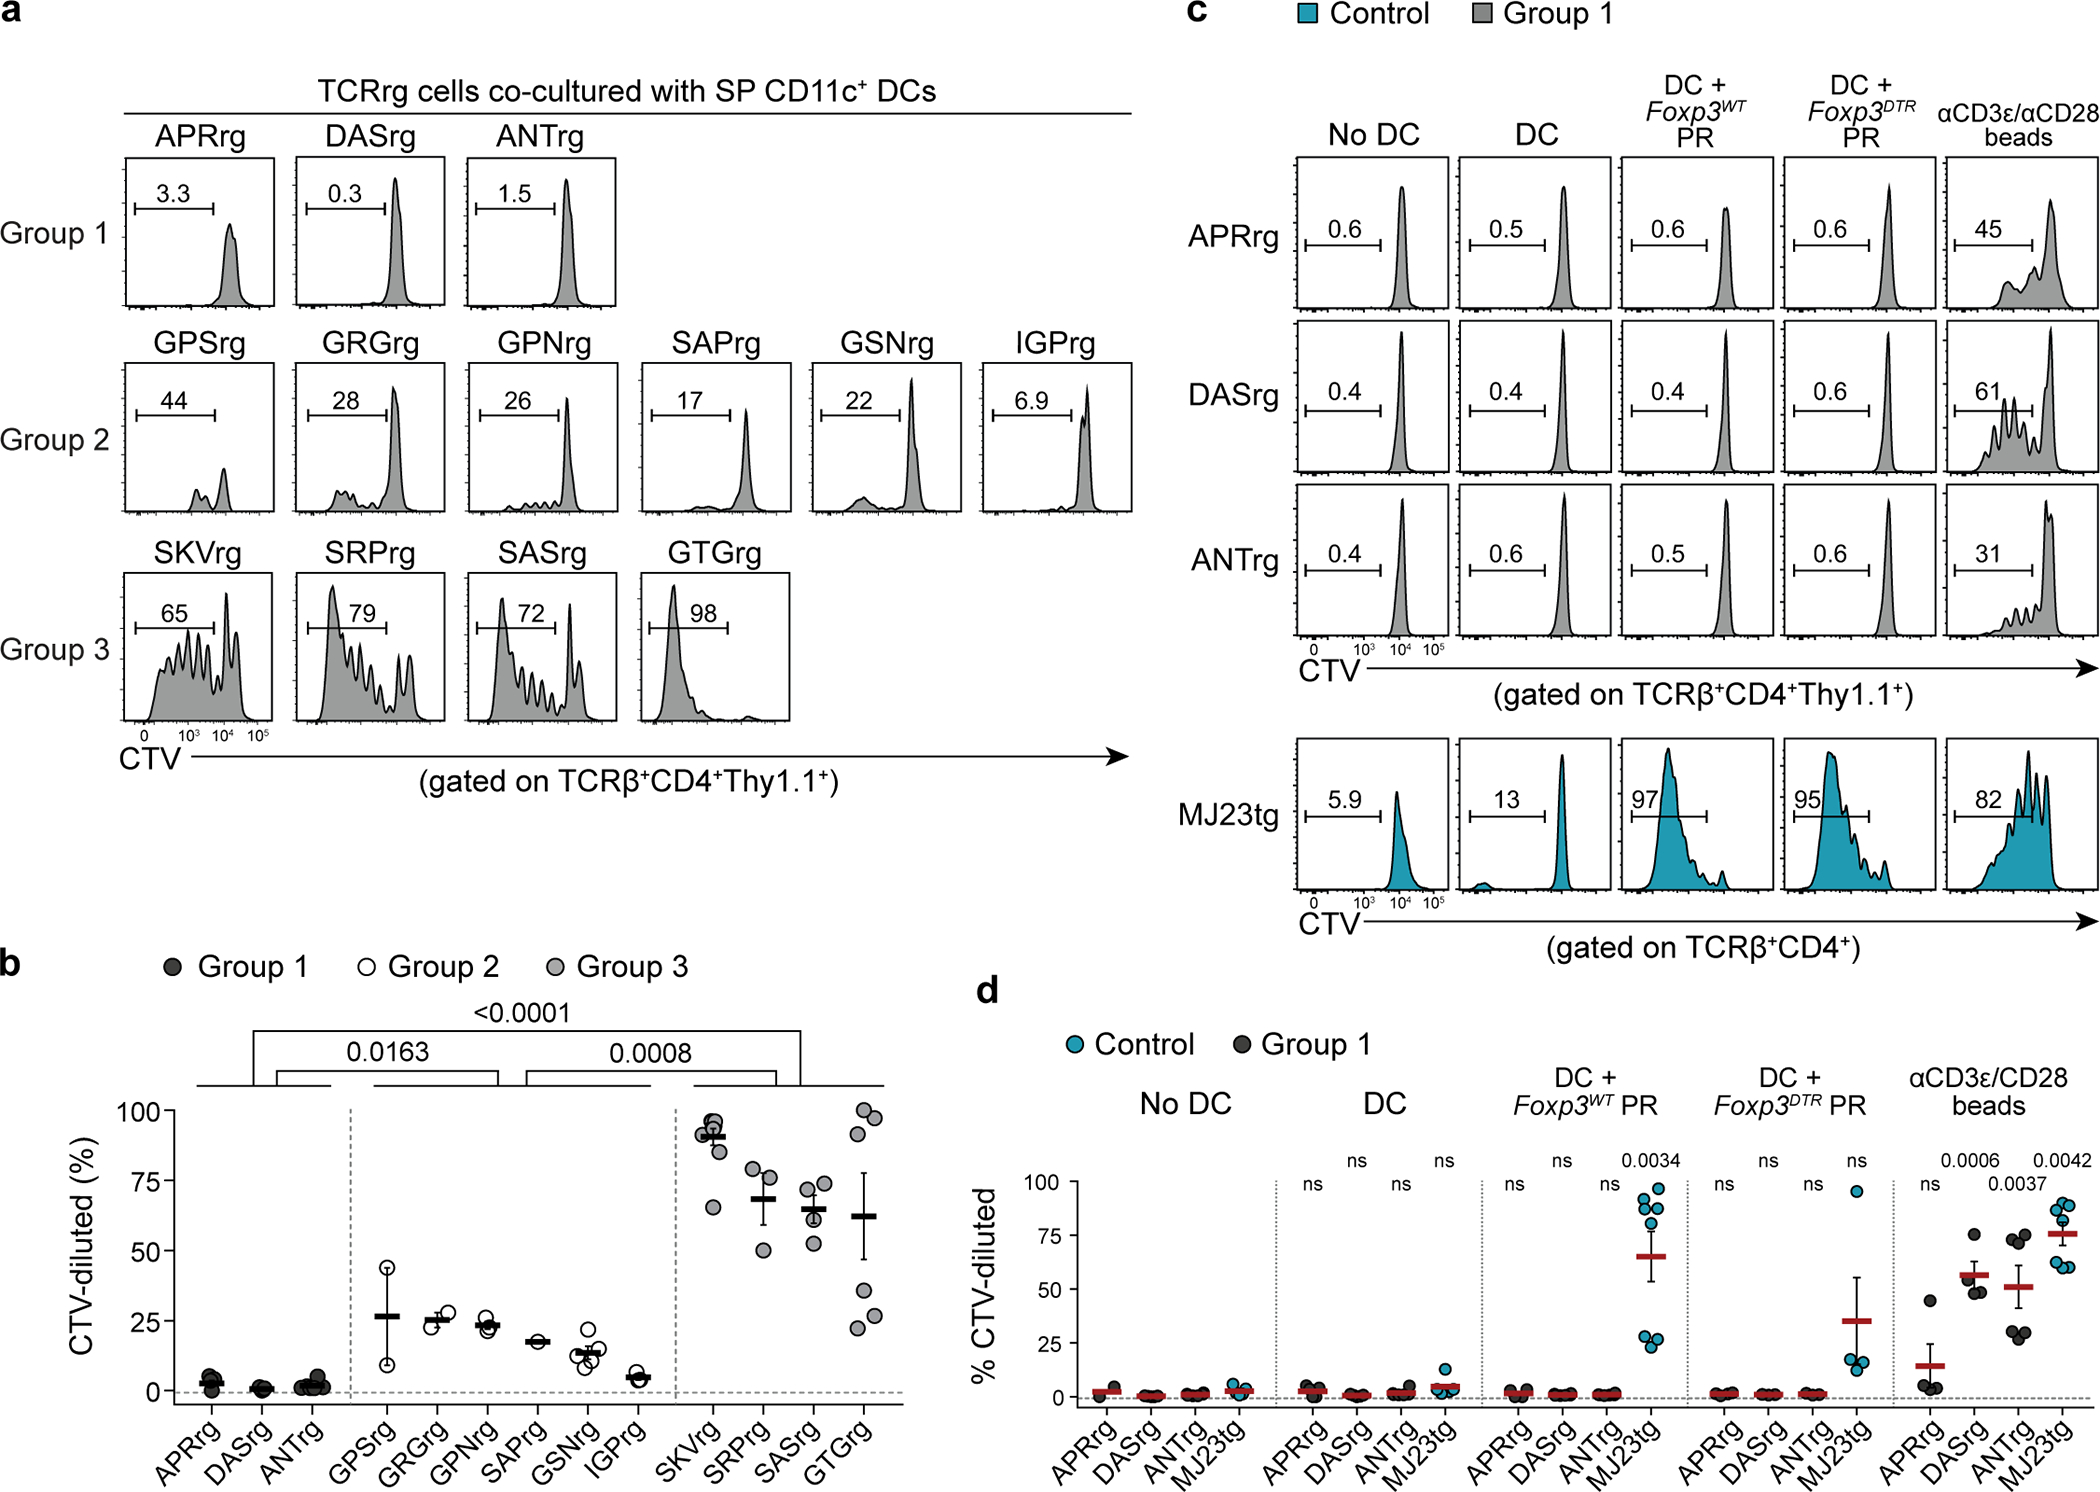
Three Group 1, six Group 2, and four Group 3 TCRs as defined in the text and Supplementary Table 2 were cloned and expressed as TCRrg mice. TCRrg T cells were purified and subjected to in vitro reactivity assays.
a, Purified TCRβ+CD4+Thy1.1+ TCRrg T cells expressing the indicated Group 1 (top), Group 2 (middle), and Group 3 (bottom) clones were labeled with CellTrace Violet (CTV) and co-cultured with splenic CD11c+ dendritic cells (DCs) and mouse recombinant IL-2 (mrIL-2) for 5 days (see Methods). Representative flow cytometric analyses of CTV dilution are shown.
b, Summary plot of data from a depicting the percentage of CTV-diluted Group 1 (black symbols), Group 2 (white symbols), and Group 3 (gray symbols) TCRrg T cells (n = 2–10 per TCRrg). Data are pooled from eight independent experiments. Each symbol represents an individual co-culture.
c, Histograms displaying representative flow cytometric analysis of proliferation by Group 1 CTV-labeled TCRrg cells (TCRβ+CD4+Thy1.1+) co-cultured with splenic CD11c+ DCs and mrIL-2 ± protein extracts isolated from prostatic lysates of untreated Foxp3WT or Treg-depleted Foxp3DTR-EGFP males for 5 days (see Methods). Far left column, TCRrg cells co-cultured with mrIL-2 in the absence of CD11c+ DCs served as negative controls. Far-right column, TCRrg cells co-cultured with anti-CD3ε/anti-CD28 MACSiBead particles (1:1) and mrIL-2 served as positive controls. Bottom row, purified TCRβ+CD4+ TCRtg T cells expressing the prostate-specific MJ23 transgenic TCR (MJ23tg) served as secondary positive controls, indicated by turquoise-colored histograms.
d, Summary plot of data from c depicting the percentage of CTV-diluted Group 1 TCRrg (black symbols) and MJ23tg T cells (turquoise symbols) (n = 2–8 per TCRrg or TCRtg). Data are pooled from three independent experiments. Symbols represent individual co-cultures.
In b and d, means ± SEM are indicated. For b, two-sided p values were calculated using Kruskal-Wallis tests and Dunn’s multiple comparison tests, with clones pooled by group. For d, two-sided p values were calculated using Kruskal-Wallis tests and Dunn’s multiple comparison tests separately for each clone, comparing each experimental condition to the “No DC” control. ns, p ≥ 0.05, not significant. Source data contain exact p values and group sizes.
Extended Data Fig. 5. Group 3 clones express common hallmarks of T follicular helper cells.
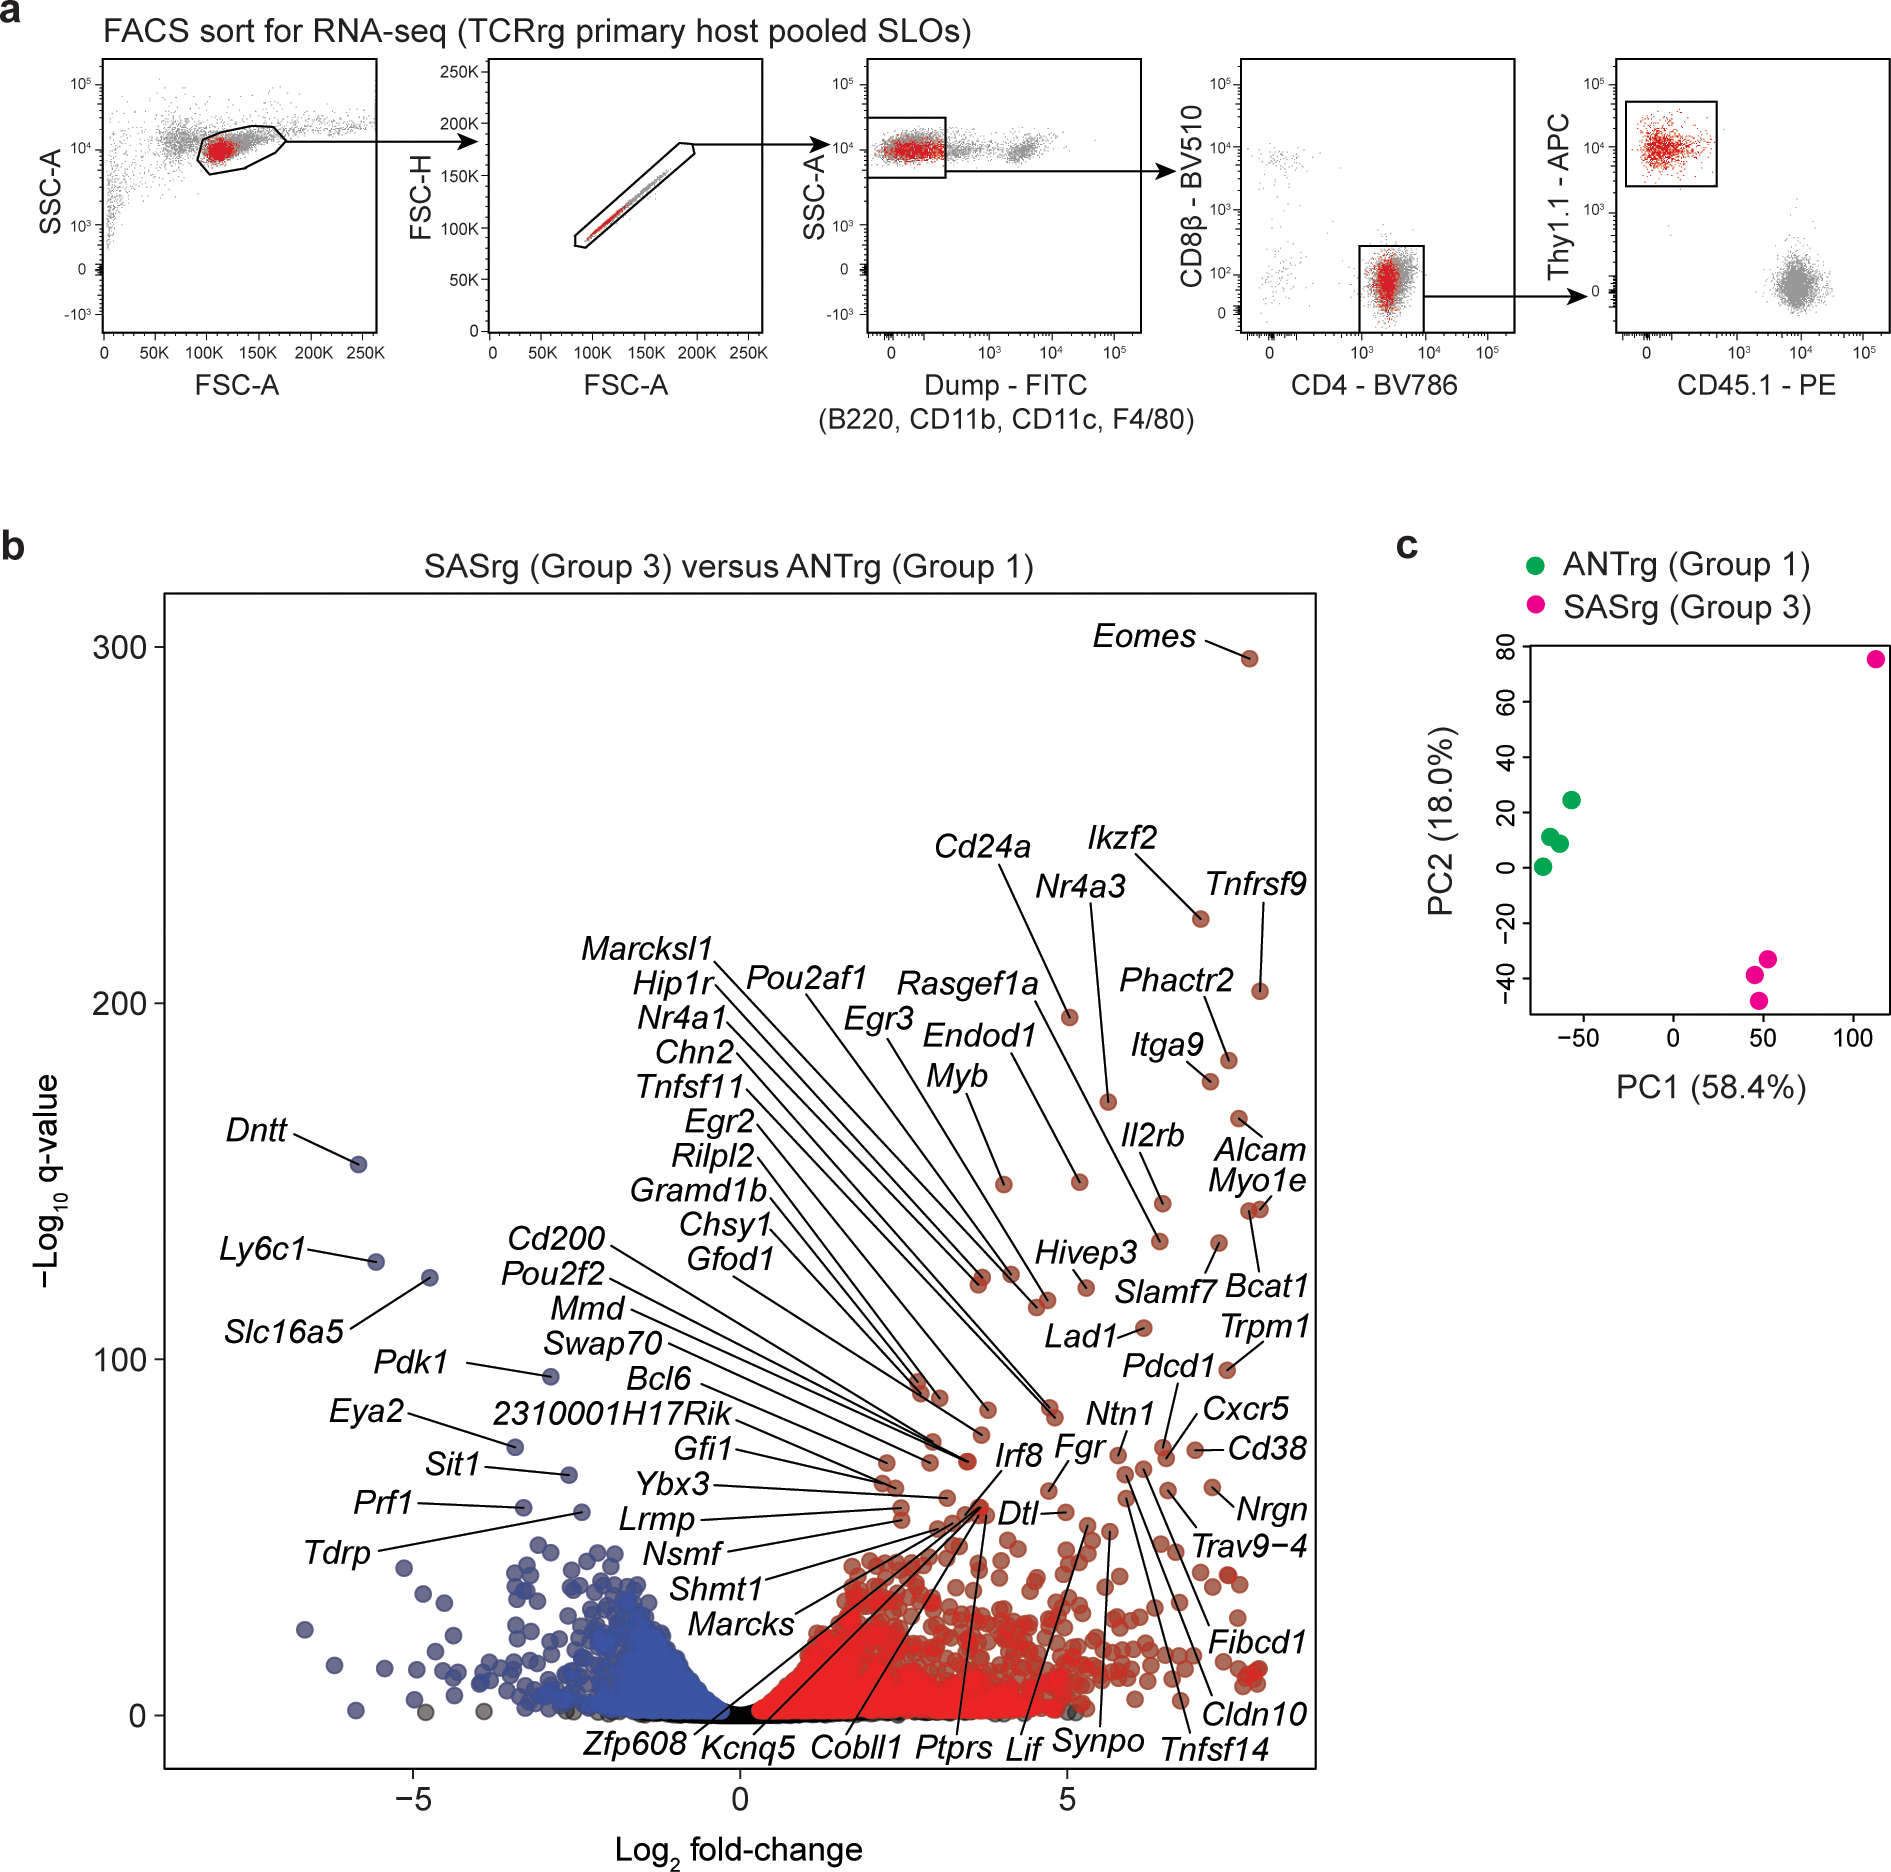
As shown in Fig. 3, comparative RNA-Seq analysis of Group 3 SAS and Group 1 ANT TCRrg cells. The SAS and ANT TCRs were cloned and expressed as TCRrg mice (see Methods). TCRrg T cells were purified from the pooled secondary lymphoid organs (SLOs) of primary TCRrg mice and subjected to bulk RNA sequencing (see Methods). Only biological samples containing ≥ 1 × 10⁵ TCRrg T cells were included for analysis (n=4 mice per TCR).
a, Gating strategy schematic for the fluorescence-activated cells sorting (FACS) of TCRrg T cells for RNA sequencing. TCRrg T cells were selected by gating on Dumpneg (B220negCD11bnegCD11cnegF4/80neg), followed by CD4+CD8βneg, then by Thy1.1+CD45.1neg.
b, RNA-seq volcano plot depicting differential gene expression for Group 3 SAS and Group 1 ANT TCRrg cells. The –log10 q-value versus log2 fold-change is depicted for genes with average log2 CPM ≥ −1. Blue and red dots denote genes over-represented in Group 1 ANT and Group 3 SAS TCRrg T cells, respectively, with FDR ≤ 0.05. Labels denote top genes that are over- or underrepresented, q ≤ 1 × 10−50 (82 genes). Data are pooled from two independent experiments. q values were generated using edgeR (see Methods).
c, Principal component analysis (PCA) of mRNA expression in Group 1 ANT and Group 3 SAS TCRrg T cells, presented as log-scaled normalized expression (log2 CPM). Each dot corresponds to an independent biological sample. Green and magenta dots denote samples isolated from Group 1 ANT and Group 3 SAS TCRrg mice, respectively. n = 4 per TCR. Data are pooled from two independent experiments.
Extended Data Fig. 6. The frequency and phenotype of Group 3 SAS T cells is not impacted following transfer to B cell-depleted recipients.
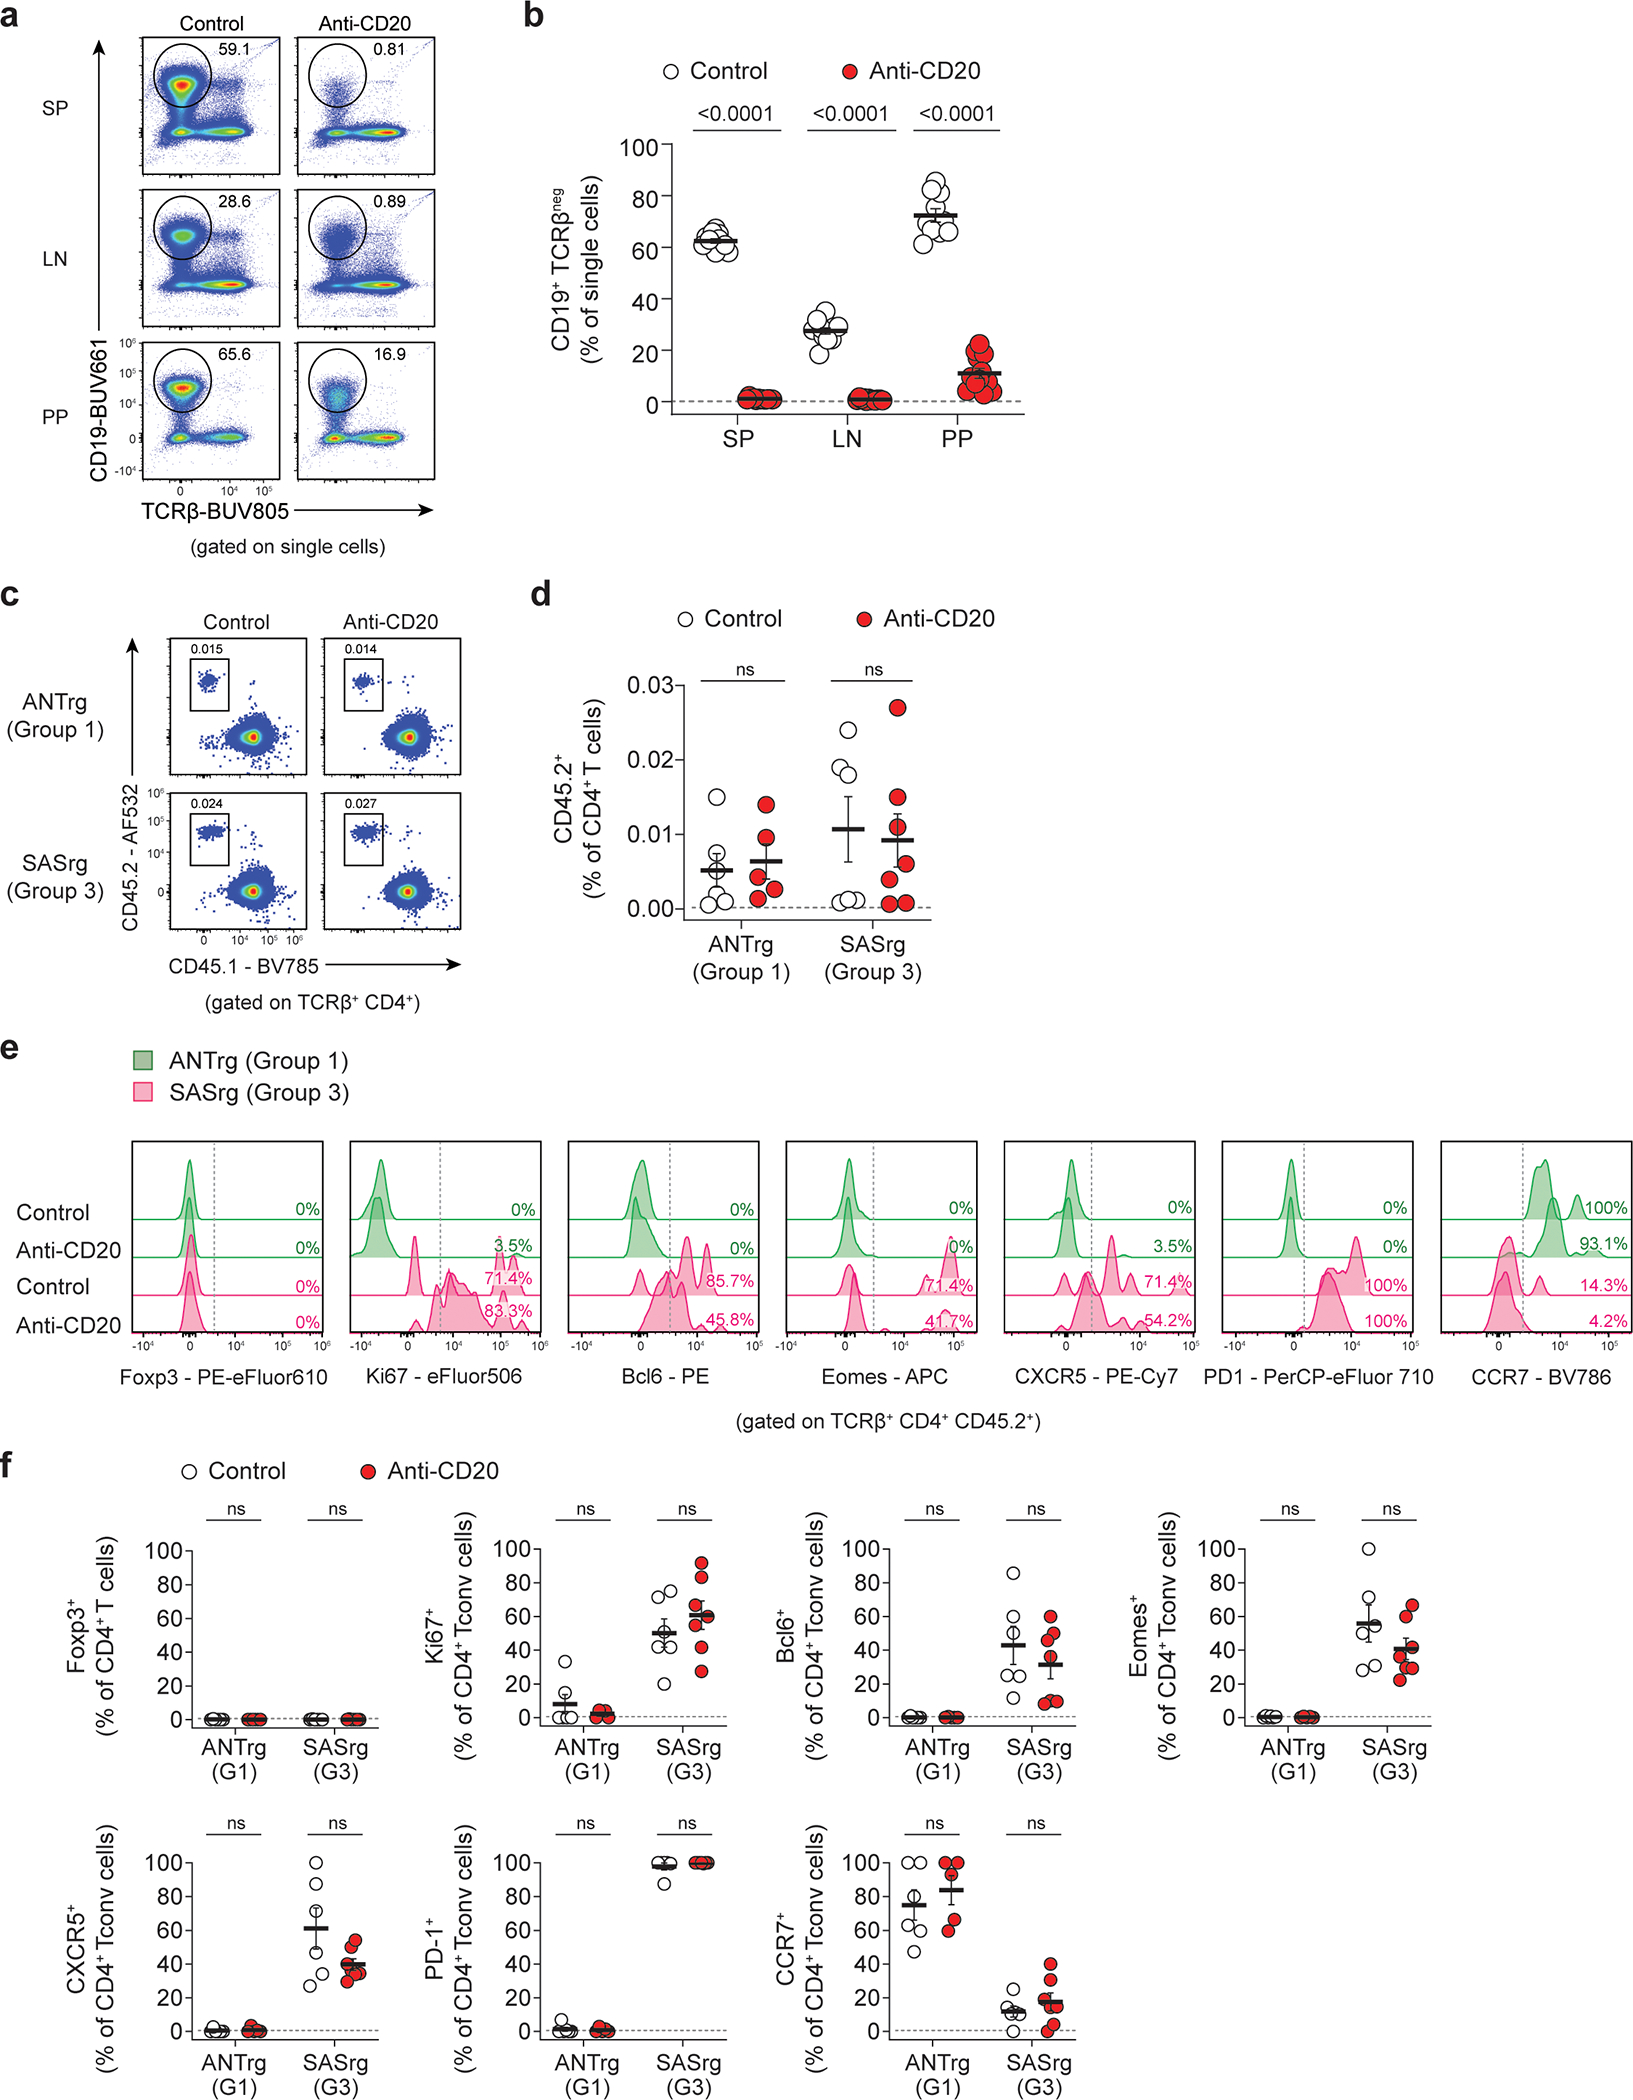
The Group 1 ANT TCR and Group 3 SAS TCRs were cloned and expressed as TCRrg mice. 1×10⁵ FACS-purified TCRrg cells were transferred into treated recipient mice. 7 days prior to TCRrg cell transfer, recipient mice were treated with anti-CD20 or control antibody (see Methods). Donor cell frequency and phenotype was assessed 7 days post-transfer.
a, Representative flow cytometric analysis showing the efficiency of B cell depletion in control and anti-CD20 treated recipient mice. SP, spleen; LN, pooled lymph nodes; PP, Peyer’s Patches.
b, Summary plot of data from a showing the frequency of B cells (CD19+TCRbneg) recovered from the indicated sites of control- and anti-CD20-treated recipient mice (n = 10–12 per condition). Data pooled from two independent experiments. Each symbol depicts cells from an individual TCRrg mouse.
c, Representative flow showing the frequency of CD45.2+CD45.1neg donor TCRrg cells recovered from the spleen of control- and anti-CD20-treated recipient mice.
d, Summary plot of data from c showing the frequency of ANTrg and SASrg donor T cells in the spleen of recipient mice treated with control or anti-CD20 antibody (n = 5–7 per condition). Data pooled from two independent experiments.
e, Representative flow analysis of donor TCRrg T cells expressing the indicated TCRs in either control or anti-CD20 treated recipients. Histograms of expression of the indicated markers are shown for the indicated TCR and treatment group. The percentage of cells falling within the indicated gates is denoted.
f, Summary plots of data from e. For control treated mice and anti-CD20 treated mice, the percentage of cells expressing the indicated marker is plotted for the indicated TCR (n = 5–7 per condition). Data pooled from two independent experiments.
Bold horizontal lines represent means. Error bars represent means ± SEM. p values were calculated using unpaired Student’s t-test (two-tailed) and corrected for multiple comparisons using the Holm-Šídák method. ns, p ≥ 0.05, not significant. Source data contain exact p values and group sizes.
Extended Data Fig. 7. The Group 3 TCR SKV does not facilitate thymic Treg cell development at low clonal frequencies.
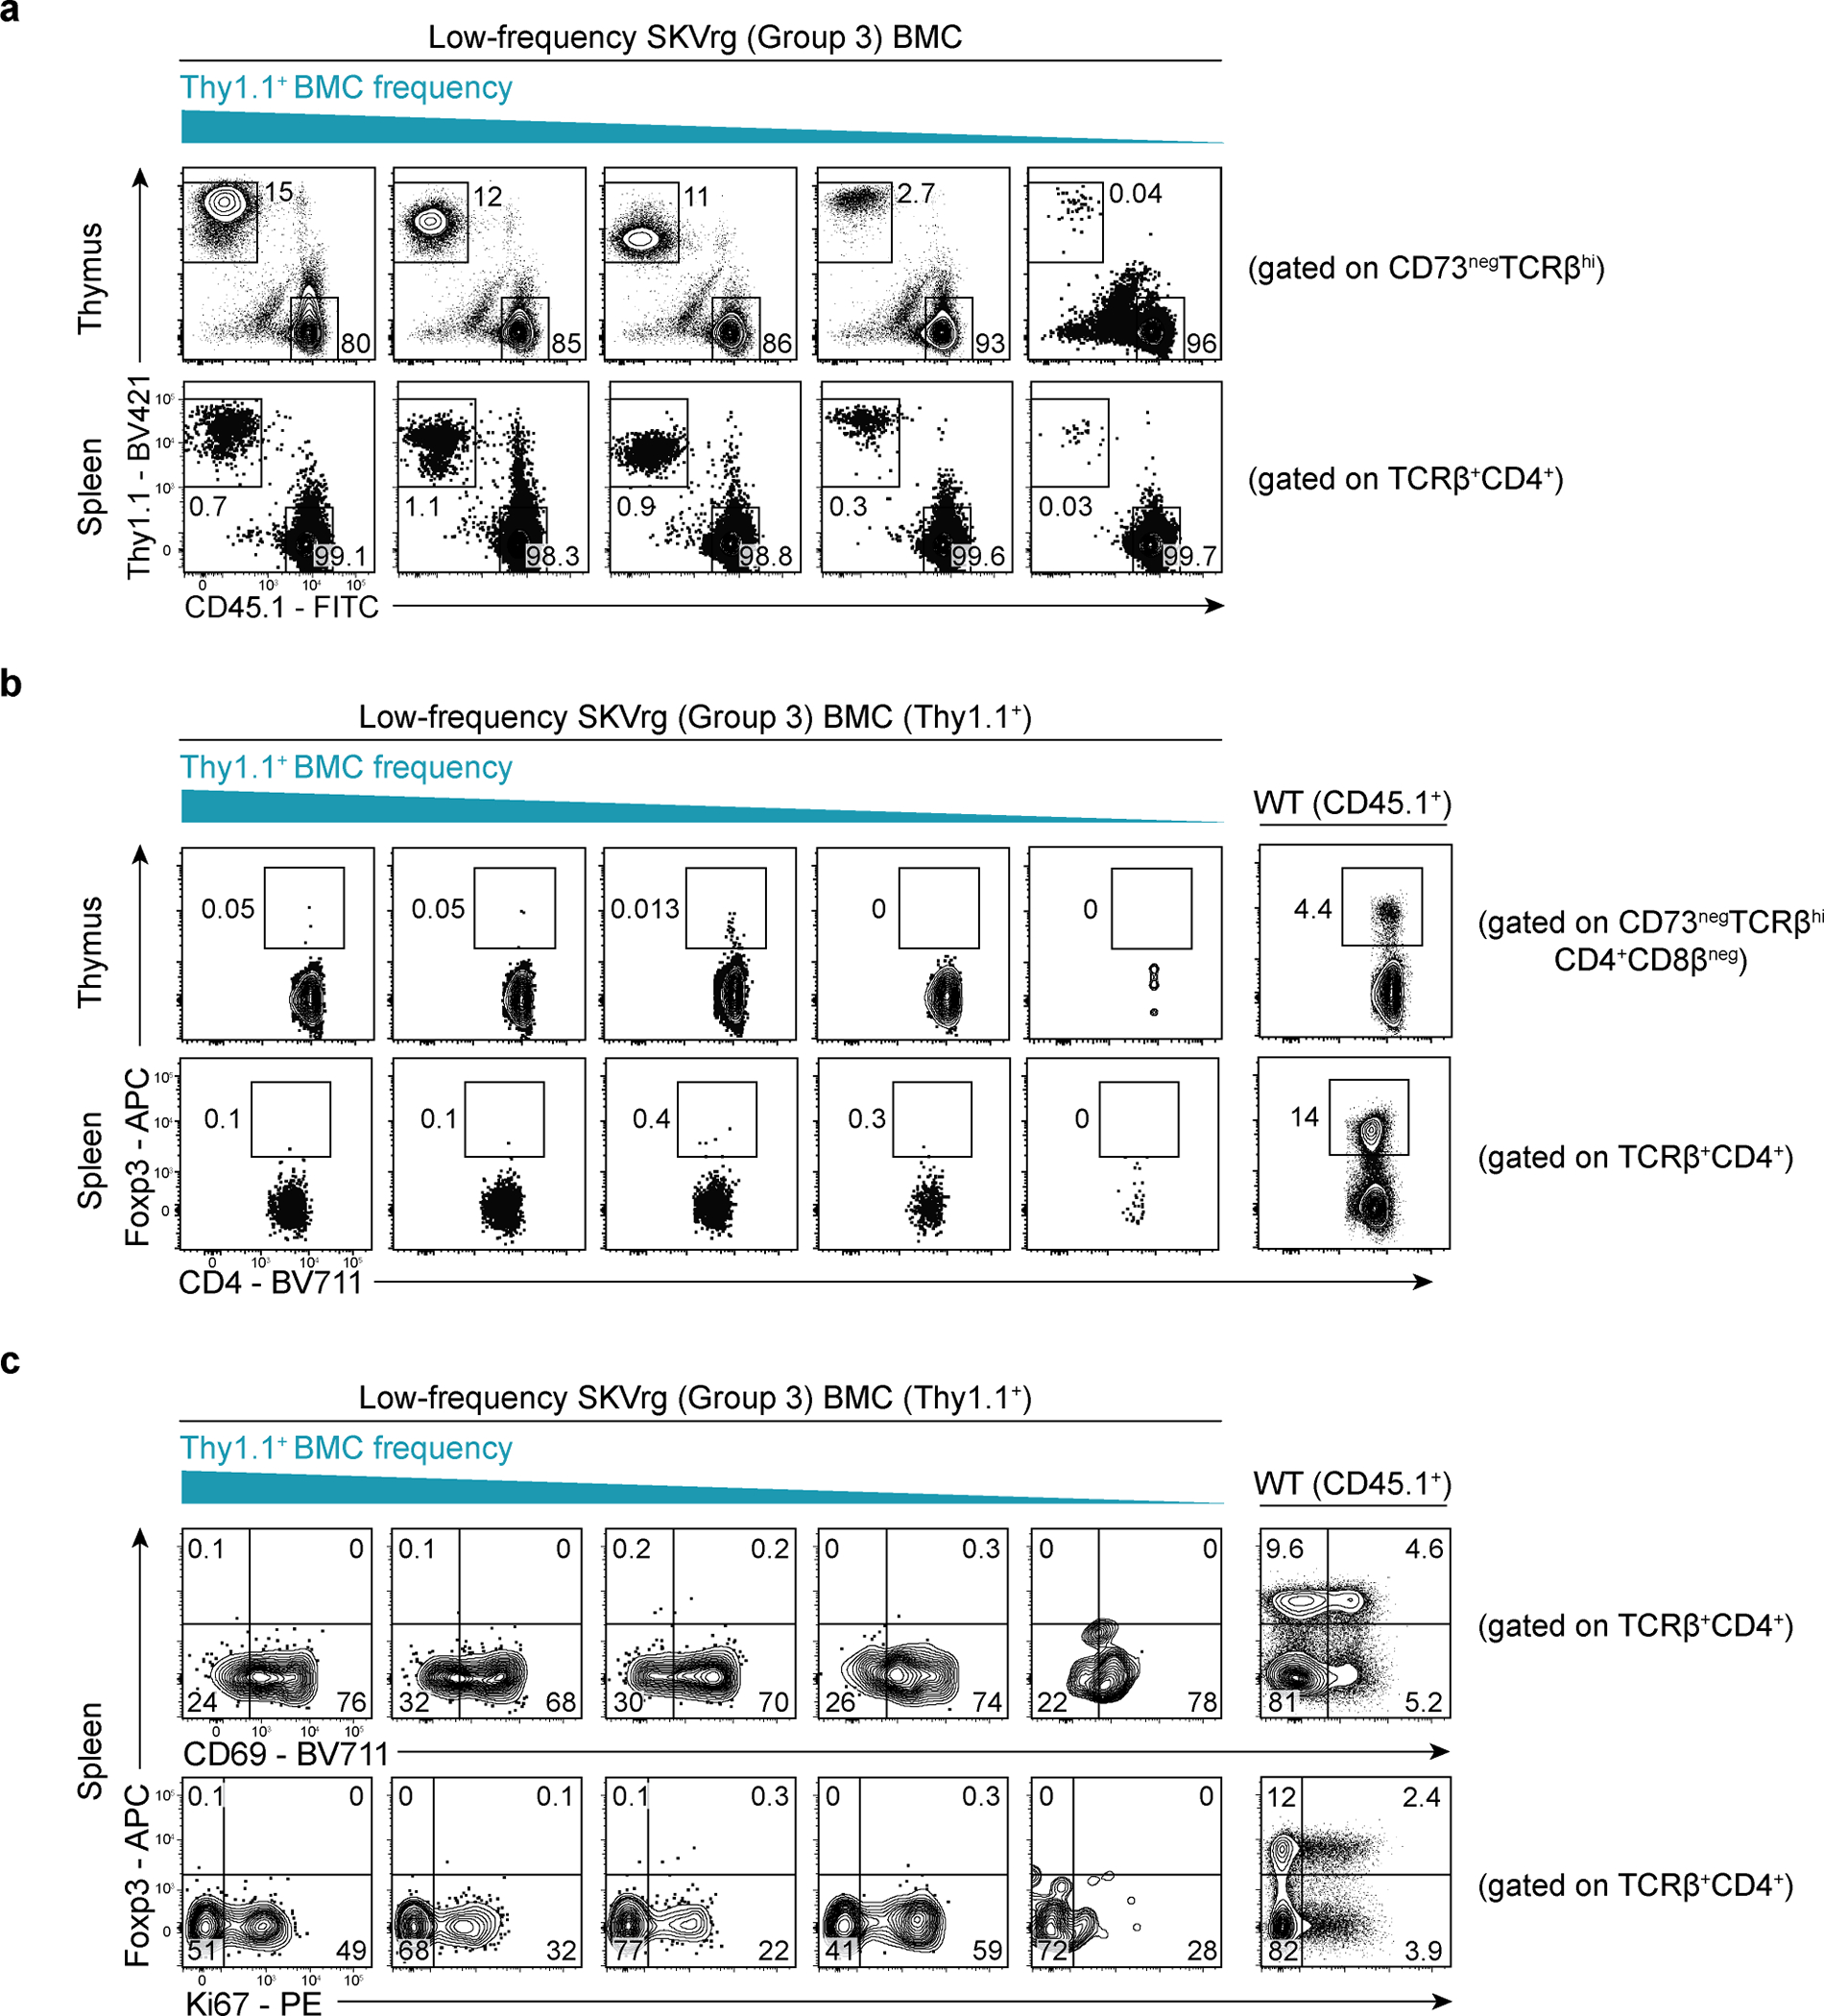
The Group 3 SKV TCR was cloned and expressed as low-frequency TCRrg mixed bone marrow chimeras (see Methods). TCRrg T cells were directly phenotyped using flow cytometry. Thymocytes were gated on CD73neg cells to distinguish newly developed thymocytes from recirculating mature T cells in the thymus61.
a, Representative flow cytometric analysis of thymic (top, CD73negTCRβ+Thy1.1+) and splenic (bottom, TCRβ+CD4+Thy1.1+) TCRrg T cell frequency recovered from low-frequency TCRrg mixed bone marrow chimeras.
b, Representative flow cytometric analysis of Foxp3 vs. CD4 expression by thymic CD4SP (top, CD73neg TCRβhiCD4+CD8βnegThy1.1+) and splenic CD4+ (bottom, TCRβ+CD4+Thy1.1+) TCRrg T cells from low-frequency TCRrg mixed bone marrow chimeras. Far right column, thymic CD4SP (CD73negTCRβhiCD4+CD8βneg) and splenic CD4+ (TCRβ+CD4+) T cells from untreated B6.SJL mice served as positive controls.
c, Representative flow cytometric analysis of Foxp3 vs. CD69 (top) and Ki67 (bottom) expression by splenic CD4+ (TCRβ+CD4+Thy1.1+) TCRrg T cells from low-frequency TCRrg mixed bone marrow chimeras. Far right column, splenic CD4+ (TCRβ+CD4+) T cells from untreated B6.SJL mice served as controls.
Data is representative of at least two independent experiments. Representative flow plots are ordered from highest (left) to lowest (right) thymic TCRrg frequency.
Extended Data Fig. 8. Additional phenotyping of TCRrg thymocytes expressing Group 1 vs. Group 3 TCRs.
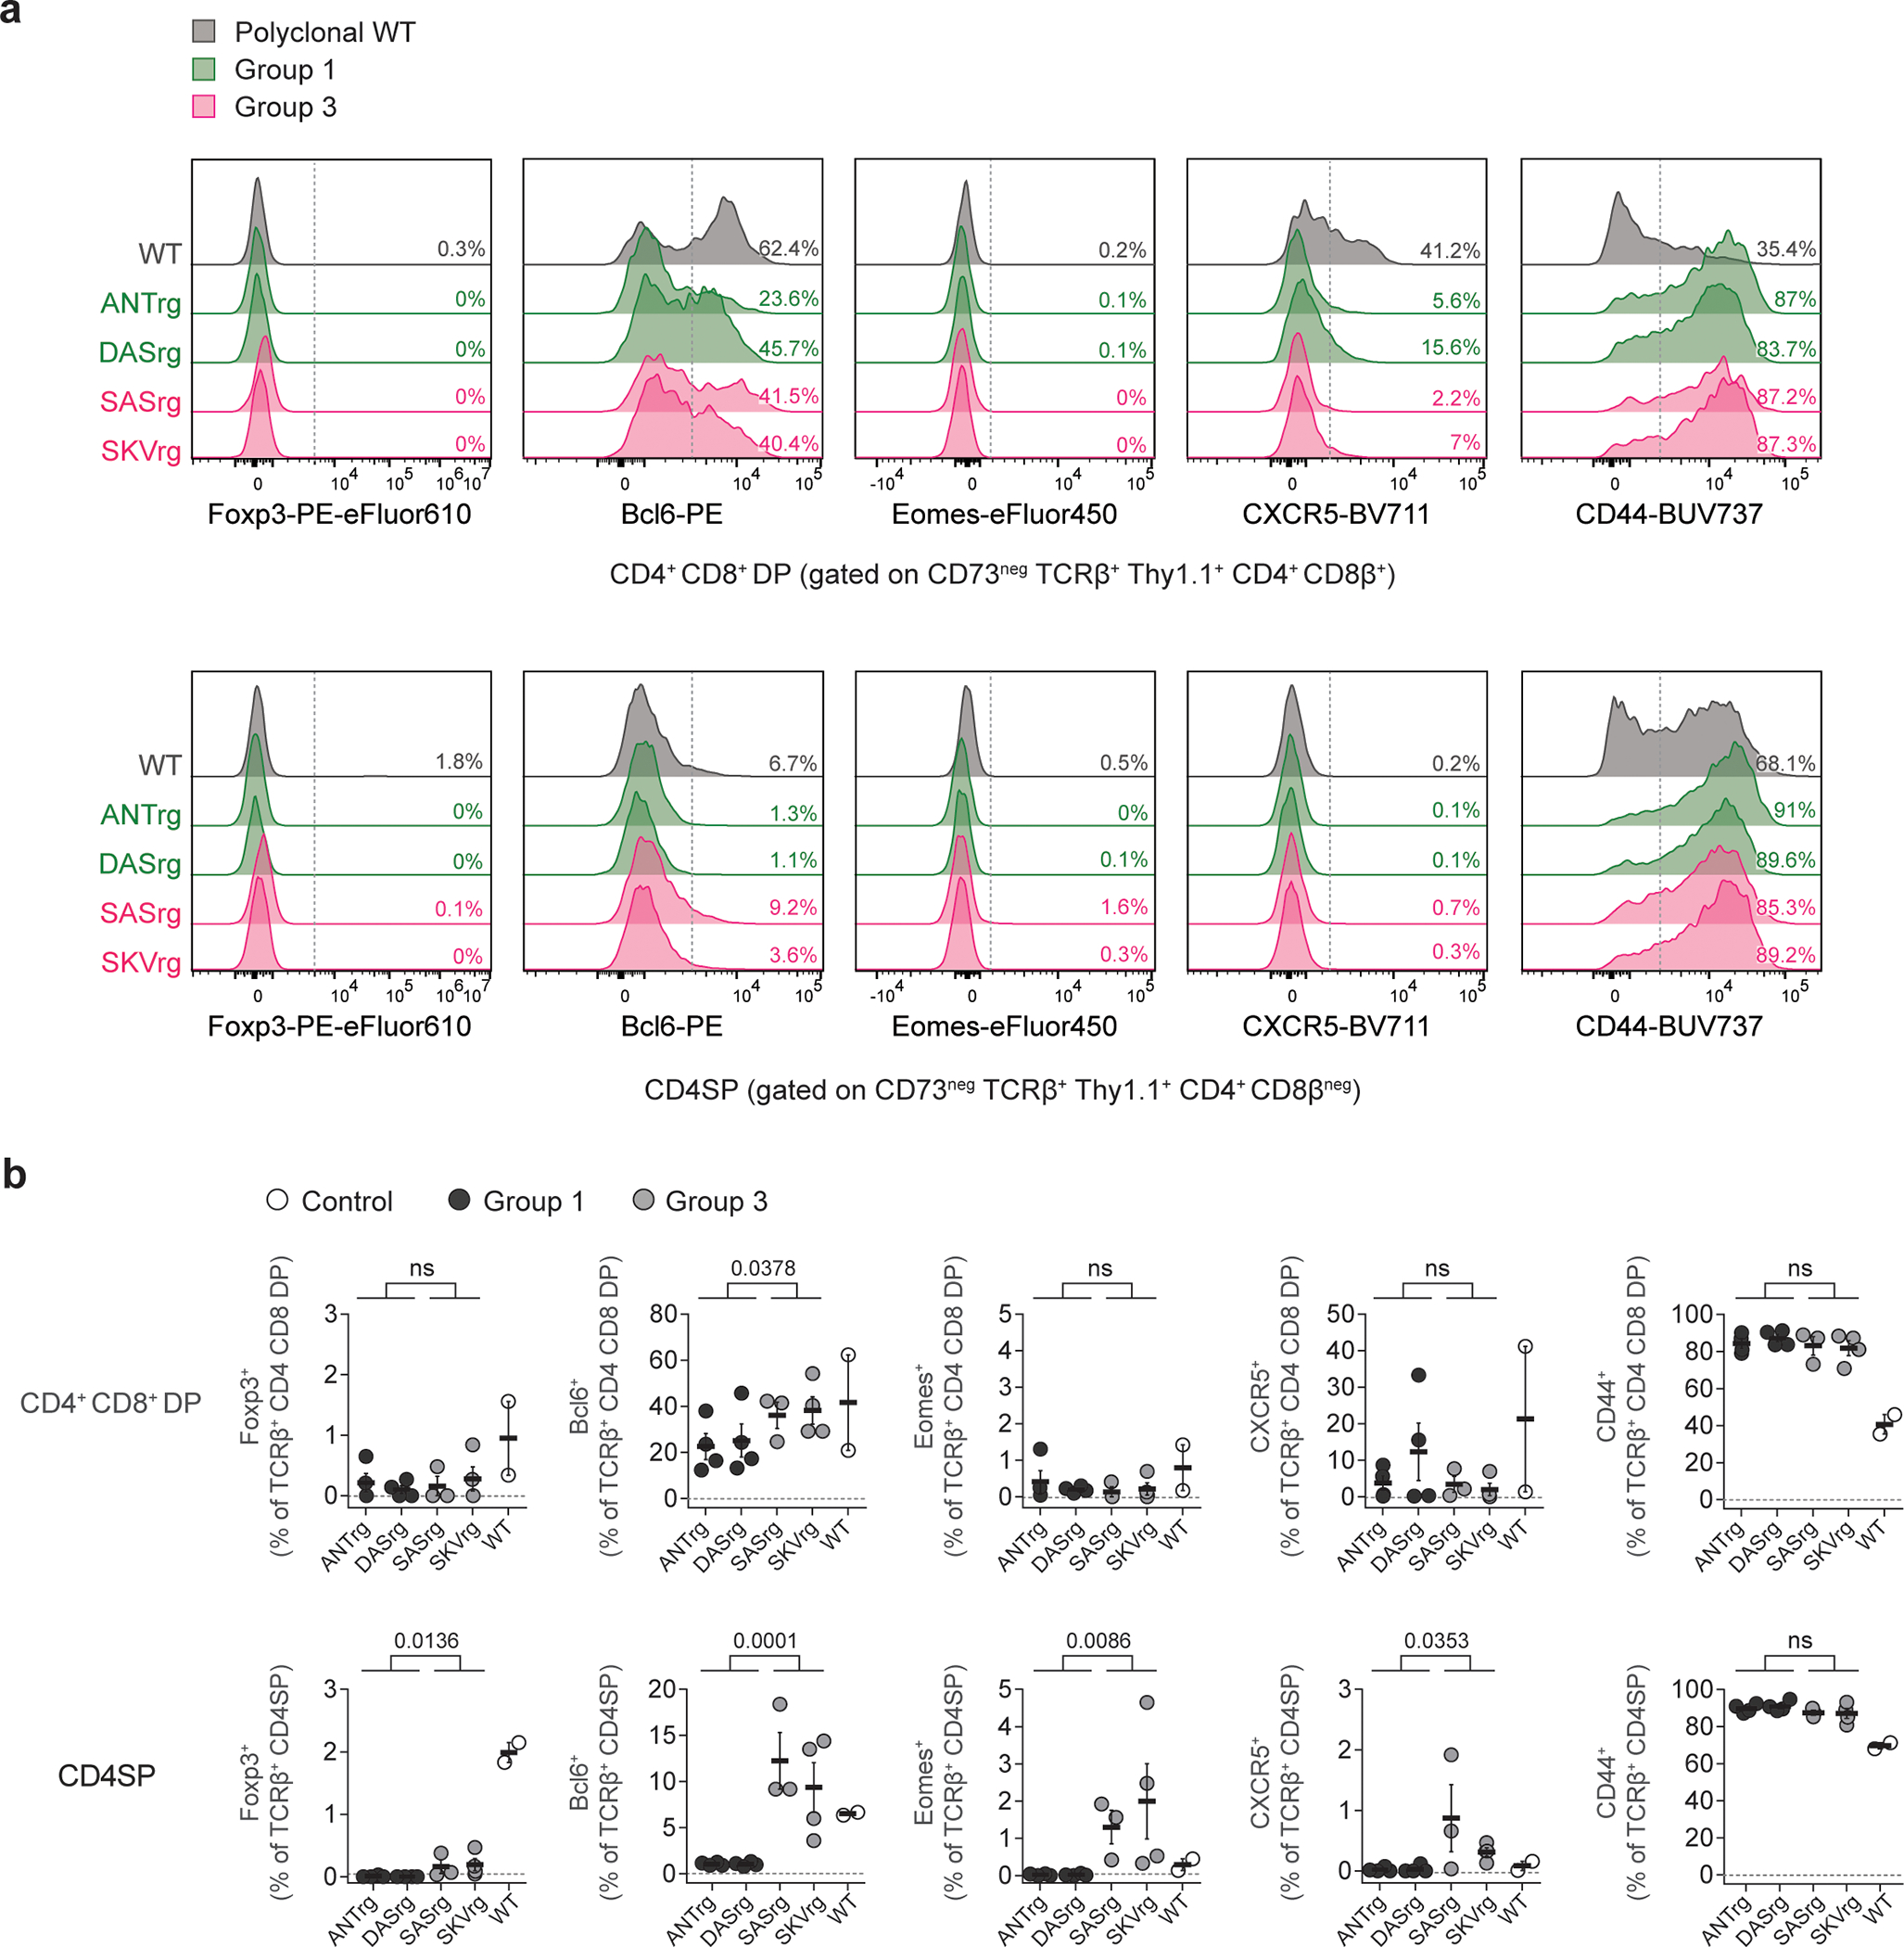
Two Group 1 TCRs (ANT and DAS) and two Group 3 TCRs (SAS and SKV) were cloned and expressed as TCRrg mice Thymi from TCRrg mice were isolated and depleted of CD8α-expressing cells prior to phenotyping by flow cytometry. Thymocytes isolated from polyclonal wild-type (WT) mice served as comparative controls.
a, Representative flow cytometric analysis of thymocytes expressing the indicated TCRs. Normalized histograms of number of cells vs. expression of the indicated markers are shown for CD4+CD8+ DP cells (top row, gated on CD73negTCRβhiThy1.1+CD4+CD8β+) or CD4SP cells (bottom row, gated on CD73negTCRβhiThy1.1+CD4+CD8βneg). The percentage of cells falling within each indicated gate is denoted.
b, Summary plots of data from a. For CD4+CD8+ DP cells (top row) or CD4SP cells (bottom row), the percentage of polyclonal WT (open symbols), Group 1 (black symbols), or Group 3 (gray symbols) expressing the indicated markers is depicted (n = 3–4 per TCRrg, n = 2 per polyclonal WT group). Data are pooled from two independent experiments. Each symbol represents an individual mouse. Bold horizontal lines represent means. Error bars represent means ± SEM. p values were calculated using Student’s t-test (two-tailed) for pooled Group 1 clones versus pooled Group 3 clones. ns, p ≥ 0.05, not significant. Source data contain exact p values and group sizes.
Extended Data Fig. 9. Group 3 SAS T cells proliferate and adopt a Tfh-like phenotype following intravenous transfer of CD4SP thymocytes.
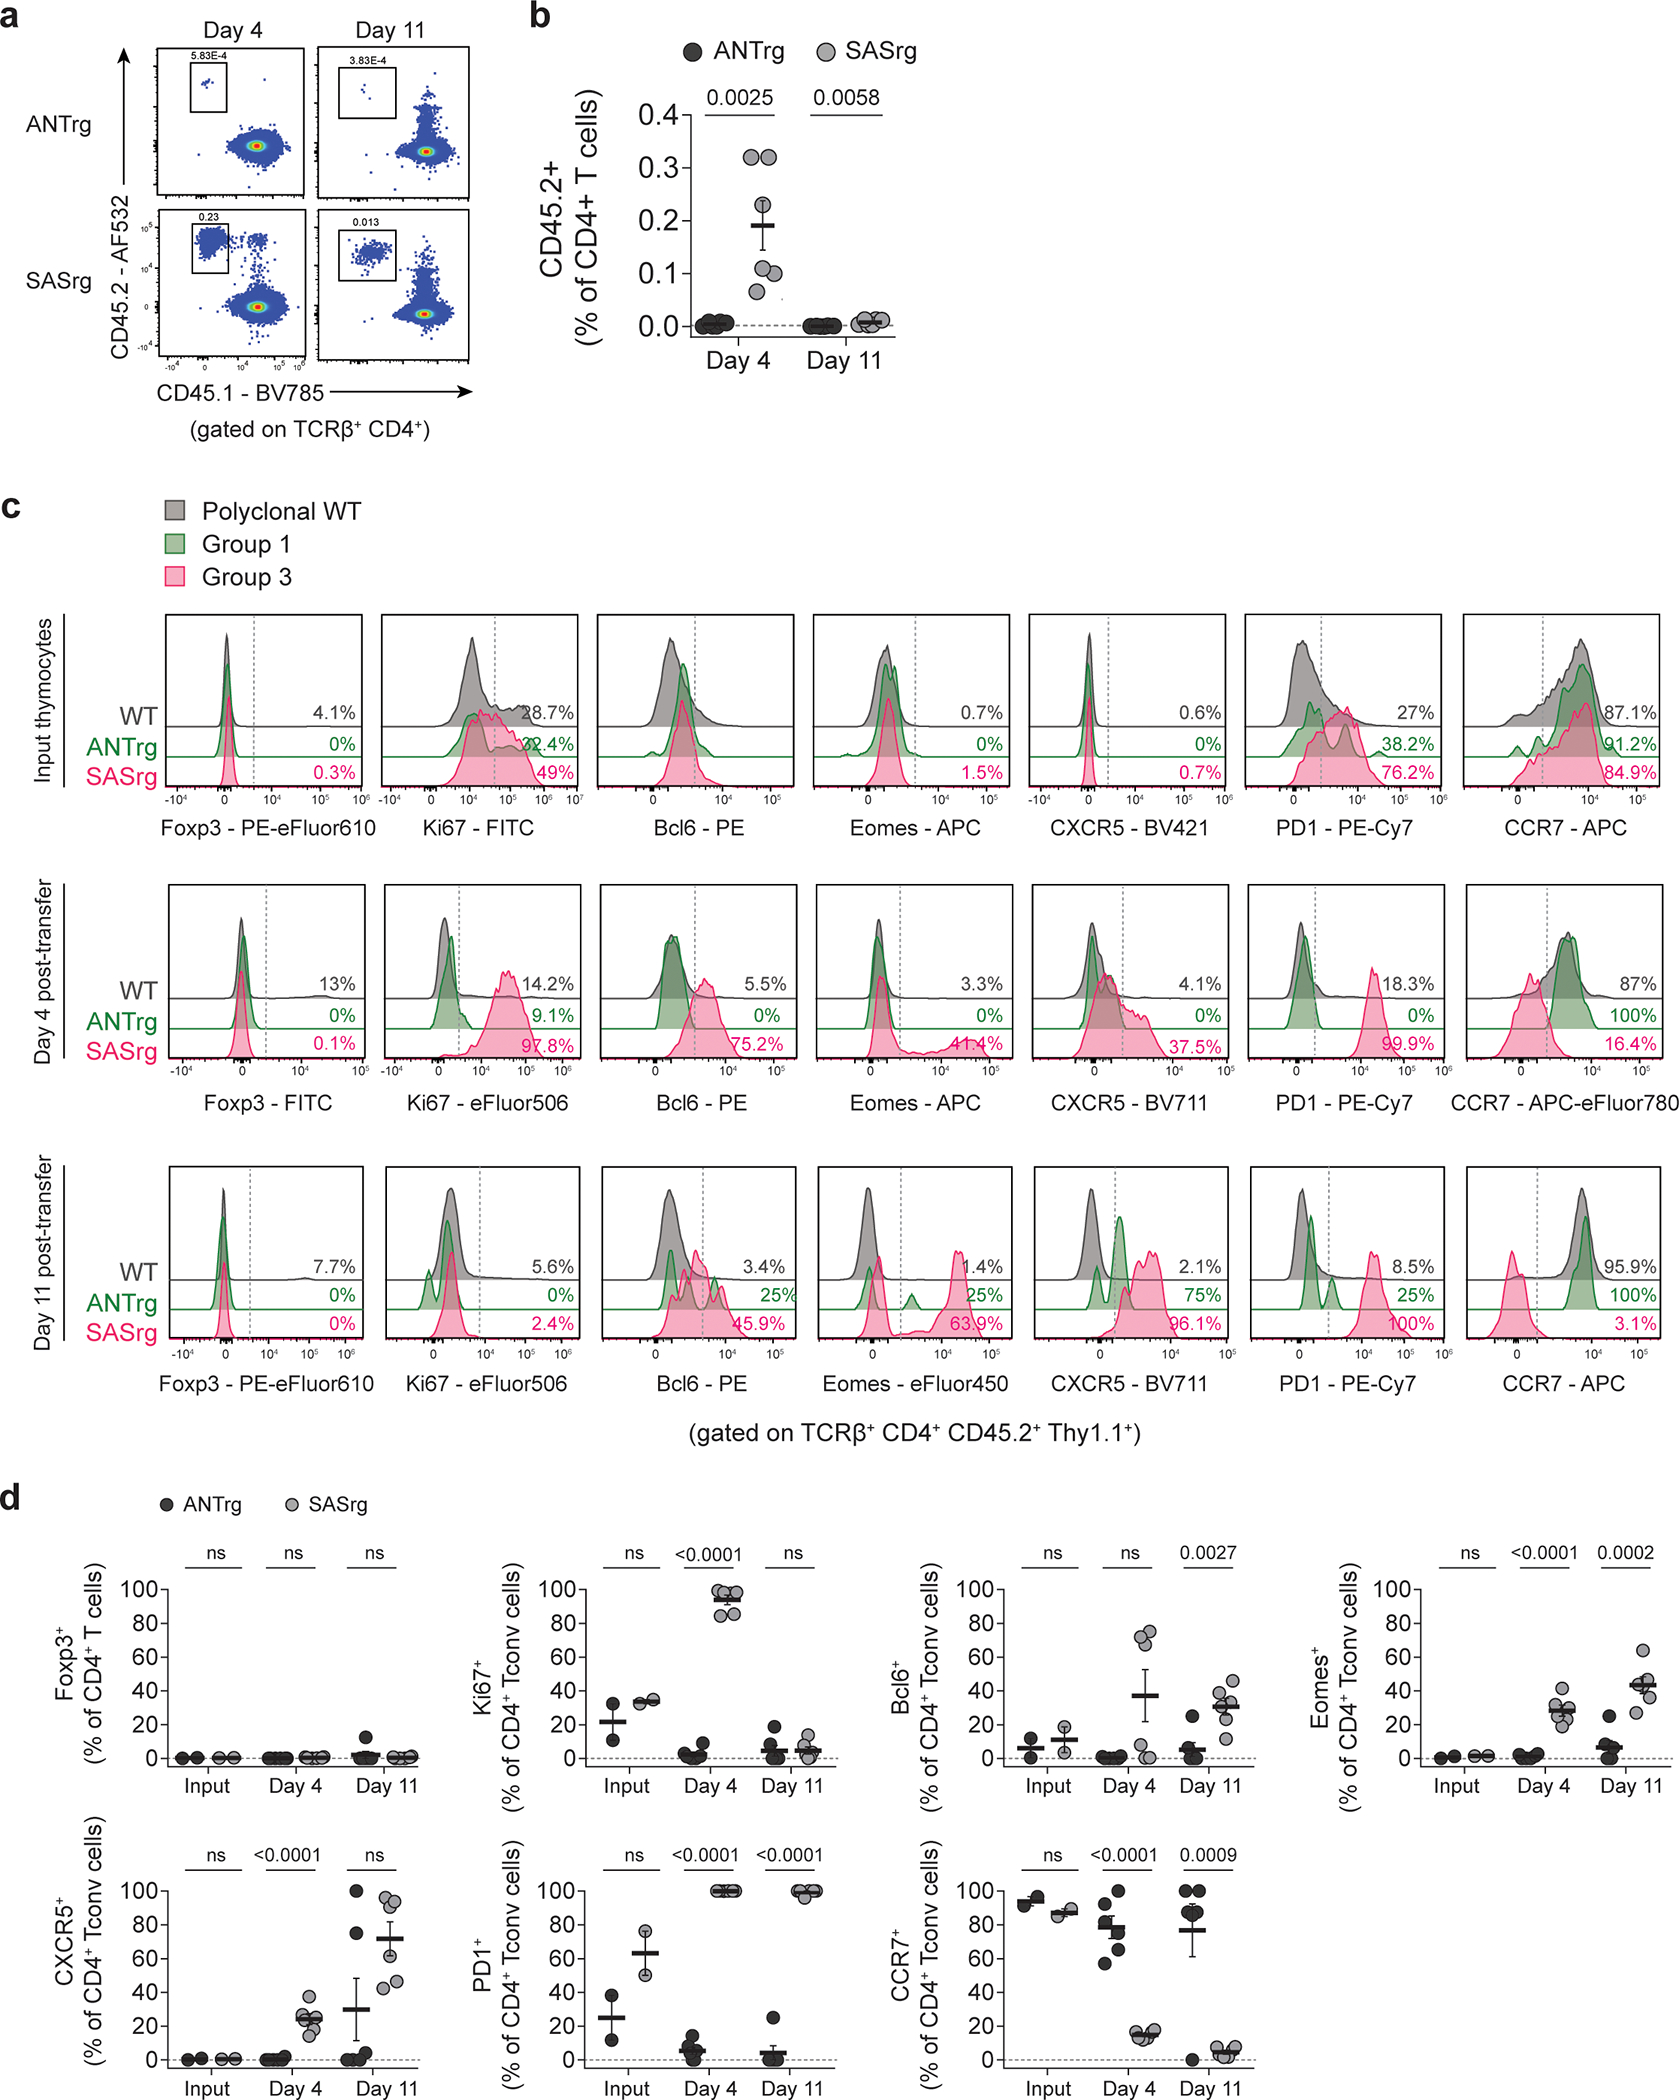
The Group 1 ANT TCR and Group 3 SAS TCRs were cloned and expressed as TCRrg mice. Thymi from TCRrg mice were isolated and depleted of CD8α-expressing cells. 5×10⁶ SASrg thymocytes or 5×10⁵ ANTrg thymocytes were transferred intravenously into B6.SJL recipient mice and analyzed at day 4 or day 11 post-transfer via flow cytometry.
a, Representative analysis of CD45.2+CD45.1neg donor TCRrg cells recovered from the spleens of recipient mice at the indicated time points. The percentage of cells falling within the indicated gates are denoted.
b, Summary plots of data shown in a (n = 6 per condition). Data are pooled from two independent experiments. Each symbol represents an individual mouse.
c, Representative flow cytometric analysis of donor T cells (TCRβ+CD4+CD45.2+Thy1.1+) expressing the indicated TCRs. Normalized histograms of number of cells vs. expression of the indicated markers are shown for the donor cell thymocyte suspension (“input thymocytes”, top row), cells recovered from the spleen of recipients at day 4 (middle row), and cells recovered from the spleen of recipients at day 11 (bottom row). The percentage of cells falling within the indicated gates is denoted. Splenocytes isolated from polyclonal wild-type (WT) mice served as comparative controls.
d, Summary plots of data from c. For donor ANTrg T cells (black symbols) and donor SASrg T cells (gray symbols), the percentage of cells expressing the indicated markers is plotted for the indicated time points (n = 2–6 per condition). Data are pooled from two independent experiments. Each symbol represents an individual mouse.
Bold horizontal lines represent means. Error bars represent means ± SEM. p values were calculated using Student’s t-test (two-tailed) and corrected for multiple comparisons using the Holm-Šídák method. ns, p ≥ 0.05, not significant. Source data contain exact p values and group sizes.
Extended Data Table 1. Gene set enrichment analysis of Group 1 and Group 3 TCRrg Tconv cells.
As in Fig. 3, TCRrg Tconv cells expressing the Group 1 ANT or Group 3 SAS TCR were purified via FACS and subjected to RNA sequencing (see Methods). Using gene set enrichment analysis (GSEA) of transcripts upregulated in SASrg versus ANTrg Tconv cells, SASrg cells were assessed for enrichment for the indicated gene sets, defined through previous characterizations of canonical T-helper cell subsets. Gene sets were derived from the Molecular Signatures Database. Enrichment Scores (ES), Normalized Enrichment Scores (NES), and q values following false discovery rate (FDR) adjustment using the Benjamini-Hochberg correction are indicated.
| Gene Set | ES | NES | FDR q-value | Reference |
|---|---|---|---|---|
| GSE40068_BCL6_POS_VS_NEG_CXCR5_POS_TFH_UP | 0.7631505 | 1.5522048 | 0.4037675 | 34 |
| GSE40685_NAIVE_CD4_TCELL_VS_TREG_DN | 0.76073635 | 1.5237765 | 0.33929574 | 35 |
| GSE11924_TH2_VS_TH17_CD4_TCELL_UP | 0.7708807 | 1.5099276 | 0.2789404 | 29 |
| GSE24574_BCL6_HIGH_VS_LOW_TFH_CD4_TCELL_DN | 0.7304185 | 1.4809927 | 0.31365356 | 33 |
| GSE24574_BCL6_LOW_TFH_VS_TCONV_CD4_TCELL_DN | 0.7244741 | 1.456817 | 0.34146935 | 33 |
| GSE14308_TH1_VS_NAIVE_CD4_TCELL_UP | 0.72614926 | 1.4429848 | 0.34066153 | 30 |
| GSE40068_CXCR5NEG_BCL6NEG_CD4_TCELL_VS_CXCR5POS_BCL6NEG_TFH_UP | 0.70779264 | 1.4409924 | 0.29840574 | 34 |
| GSE24574_BCL6_HIGH_TFH_VS_NAIVE_CD4_TCELL_DN | 0.6926459 | 1.4135411 | 0.3487514 | 33 |
| GSE16697_CD4_TCELL_VS_TFH_CD4_TCELL_UP | 0.69116634 | 1.3844227 | 0.40936768 | 31 |
| GSE24574_BCL6_HIGH_TFH_VS_TCONV_CD4_TCELL_DN | 0.6952595 | 1.3743495 | 0.4016893 | 33 |
| GSE40685_NAIVE_CD4_TCELL_VS_TREG_UP | 0.686526 | 1.364813 | 0.3947406 | 35 |
| GSE24574_BCL6_LOW_TFH_VS_NAIVE_CD4_TCELL_DN | 0.6582397 | 1.308069 | 0.5429073 | 33 |
| GSE24574_NAIVE_VS_TCONV_CD4_TCELL_DN | 0.61578256 | 1.237721 | 0.738599 | 33 |
| GSE11924_TH1_VS_TH2_CD4_TCELL_UP | 0.61331403 | 1.2268406 | 0.72452825 | 29 |
| GSE24574_BCL6_LOW_TFH_VS_TCONV_CD4_TCELL_UP | 0.5985357 | 1.2115455 | 0.7269316 | 33 |
| GSE40068_CXCR5NEG_BCL6NEG_CD4_TCELL_VS_CXCR5POS_BCL6NEG_TFH_DN | 0.5931272 | 1.1866874 | 0.7614271 | 34 |
| GSE24574_BCL6_HIGH_TFH_VS_TCONV_CD4_TCELL_UP | 0.59556746 | 1.1778282 | 0.7458373 | 33 |
| GSE21380_TFH_VS_GERMINAL_CENTER_TFH_CD4_TCELL_UP | 0.57644707 | 1.1526479 | 0.7818314 | 32 |
| GSE21379_TFH_VS_NON_TFH_CD4_TCELL_DN | 0.5754995 | 1.1407313 | 0.77956223 | 32 |
| GSE11924_TH1_VS_TH17_CD4_TCELL_UP | 0.5596839 | 1.1155246 | 0.81682783 | 29 |
| GSE11924_TFH_VS_TH2_CD4_TCELL_DN | 0.55528826 | 1.1053993 | 0.80825174 | 29 |
| GSE14308_NAIVE_CD4_TCELL_VS_INDUCED_TREG_DN | 0.5267761 | 1.0632435 | 0.894384 | 30 |
| GSE43863_NAIVE_VS_TFH_CD4_EFF_TCELL_D6_LCMV_DN | 0.51772934 | 1.0319632 | 0.9480229 | 36 |
| GSE14308_TH2_VS_NAIVE_CD4_TCELL_UP | 0.5165455 | 1.0309829 | 0.9111433 | 30 |
| GSE14308_TH17_VS_NAIVE_CD4_TCELL_DN | 0.50783134 | 1.0260543 | 0.88790214 | 30 |
| GSE21380_NON_TFH_VS_TFH_CD4_TCELL_DN | 0.496131 | 1.0236479 | 0.8596249 | 32 |
| GSE11924_TH1_VS_TH2_CD4_TCELL_DN | 0.5066928 | 1.0211934 | 0.8338873 | 29 |
| GSE24574_BCL6_HIGH_TFH_VS_TFH_CD4_TCELL_UP | 0.48585078 | 0.9743469 | 0.9203721 | 33 |
| GSE40068_CXCR5POS_BCL6POS_TFH_VS_CXCR5NEG_BCL6NEG_CD4_TCELL_DN | 0.4798042 | 0.97064114 | 0.8982592 | 34 |
| GSE21380_NON_TFH_VS_GERMINAL_CENTER_TFH_CD4_TCELL_UP | 0.48907134 | 0.9702962 | 0.8692025 | 32 |
| GSE14308_TH17_VS_NAIVE_CD4_TCELL_UP | 0.48664215 | 0.9697883 | 0.842264 | 30 |
| GSE21380_TFH_VS_GERMINAL_CENTER_TFH_CD4_TCELL_DN | 0.4730439 | 0.9417637 | 0.87850636 | 32 |
| GSE21379_TFH_VS_NON_TFH_CD4_TCELL_UP | 0.47076082 | 0.92750406 | 0.88291115 | 32 |
| GSE24574_BCL6_LOW_TFH_VS_NAIVE_CD4_TCELL_UP | 0.45170534 | 0.92087936 | 0.8695344 | 33 |
| GSE21380_NON_TFH_VS_TFH_CD4_TCELL_UP | 0.44786096 | 0.90150815 | 0.8822169 | 32 |
| GSE14308_NAIVE_CD4_TCELL_VS_NATURAL_TREG_DN | 0.4506384 | 0.89836144 | 0.86367315 | 30 |
| GSE16697_CD4_TCELL_VS_TFH_CD4_TCELL_DN | 0.41063762 | 0.8339336 | 0.95234966 | 31 |
| GSE43863_NAIVE_VS_TFH_CD4_EFF_TCELL_D6_LCMV_UP | 0.41530865 | 0.82745236 | 0.93823874 | 36 |
| GSE11924_TFH_VS_TH1_CD4_TCELL_DN | 0.420819 | 0.82406265 | 0.9199474 | 29 |
| GSE11924_TFH_VS_TH17_CD4_TCELL_UP | 0.4080981 | 0.8099977 | 0.9180563 | 29 |
| GSE14308_NAIVE_CD4_TCELL_VS_NATURAL_TREG_UP | 0.35548174 | 0.71619487 | 1 | 30 |
| GSE11924_TH2_VS_TH17_CD4_TCELL_DN | 0.34759694 | 0.70580596 | 1 | 29 |
| GSE21380_NON_TFH_VS_GERMINAL_CENTER_TFH_CD4_TCELL_DN | 0.3523564 | 0.7020873 | 0.9879333 | 32 |
| GSE24574_BCL6_HIGH_TFH_VS_NAIVE_CD4_TCELL_UP | 0.34938243 | 0.694078 | 0.97459966 | 33 |
| GSE14308_TH1_VS_NAIVE_CD4_TCELL_DN | 0.34521246 | 0.6812734 | 0.96426624 | 30 |
| GSE24574_BCL6_HIGH_TFH_VS_TFH_CD4_TCELL_DN | 0.32808715 | 0.66755694 | 0.9556372 | 33 |
| GSE11924_TFH_VS_TH1_CD4_TCELL_UP | 0.30729678 | 0.6170977 | 0.9749366 | 29 |
| GSE14308_TH2_VS_NAIVE_CD4_TCELL_DN | 0.30800417 | 0.6142928 | 0.95651484 | 30 |
| GSE11924_TFH_VS_TH17_CD4_TCELL_DN | 0.29926413 | 0.5956113 | 0.9478615 | 29 |
Supplementary Material
Supplementary Table 1
T1 Complete TCRα sequencing frequency table
For samples subjected to complete TCRα sequencing (see Methods), the frequencies of each TCR CDR3α segment, as a percentage of all TCRα sequence reads within a given sample, are listed. For this table, TCRs were cataloged solely based on predicted TCR CDR3α sequence, regardless of V-region usage. The table lists the Sample ID (PR 1–5, SG 1–5, and TRAMP 1–5) for the complete TCRα sequencing data set, the organ from which T cells were isolated (PR, prostate; SG, salivary glands), the genotype (Foxp3DTR-EGFP or TRAMP), the treatment (Treg-depleted or untreated), and the T cell subset (Tconv cells). For each biological sample, the total number of in-frame TCR sequence reads and the number of unique TCR sequence reads are also listed.
Supplementary Table 2
T2 Selection of recurrent prostate-infiltrating CD4+ Tconv clones for TCR retrogenic studies
13 of the top 20 most abundant recurrent TCRα sequences expressed by Tconv cells in the prostate of Treg cell-depleted mice were selected for TCR retrogenic studies. TCRs were selected based on differential TRAV and TRAJ usage. Each TCRα chain is denoted using a 3-letter code representing residues 3–5 of the predicted CDR3α chain. The full TCRα sequence information is listed, including TRAV and TRAJ usage. The 13 selected TCRα clonotypes can be binned into three groups based on hallmarks of steady-state activation and reactivity to MHC-II-restricted self-ligands (see Extended Data Figs. 3 and 4).
Supplementary Table 3
T3 List of primers used for the generation of TCR retrogenic constructs
ACKNOWLEDGMENTS
This work was funded by the following sources (to P.A.S.): R01-CA160371, R01-AI110507, U01-AI154560, a Cancer Research Institute Investigator Award, and the University of Chicago Comprehensive Cancer Center. V.L. was supported by an NIH/NCI F30 predoctoral fellowship (F30-CA217109). D.R. was supported by an NIH/NCI F30 predoctoral fellowship (F30-CA247264). C.H.M. was supported by an NIH/NCI F30 predoctoral fellowship (F30-CA236061). V.L, D.R., and C.H.M. were supported by the University of Chicago Medical Scientist Training Program (T32-GM007281). J.L.C, M.T.W., D.E.J.K were supported by T32-AI007090. M.M-C was supported in part by the University of Illinois Center for Clinical and Translational Science (NCATS Grant UL1TR002003). N.D.S. was supported by MSKCC Comprehensive Cancer Center (Support Grant P30-CA008748). This work was also supported by R01-AI143778 and R01-AI150860 awarded to M.R.C. Flow cytometry and cell sorting were performed at the Cytometry and Antibody Technology Facility at University of Chicago (RRID: SCR_017760), which receives financial support from the Cancer Center Support Grant (P30-CA014599).
Footnotes
ETHICS DECLARATION
Competing Interests
The authors declare no competing interests.
Editor recognition statement (if applicable to your journal):
L. A. Dempsey was the primary editor on this article and managed its editorial process and peer review in collaboration with the rest of the editorial team.
Peer Review Information:
Nature Immunology thanks Shohei Hori, Ellen Robey and the other, anonymous, reviewer(s) for their contribution to the peer review of this work.
DATA AVAILABILITY
The RNA sequencing data are available at the National Institutes of Health Gene Expression Omnibus (GEO) repository under accession number GSE190127. All other source data, including TCR sequencing data, are provided with this manuscript.
REFERENCES
- 1.Klein L, Kyewski B, Allen PM & Hogquist KA Positive and negative selection of the T cell repertoire: What thymocytes see (and don’t see). Nat. Rev. Immunol. (2014) doi: 10.1038/nri3667. [DOI] [PMC free article] [PubMed] [Google Scholar]
- 2.Hogquist KA & Jameson SC The self-obsession of T cells: How TCR signaling thresholds affect fate ‘decisions’ and effector function. Nat. Immunol. (2014) doi: 10.1038/ni.2938. [DOI] [PMC free article] [PubMed] [Google Scholar]
- 3.Bouneaud C, Kourilsky P & Bousso P Impact of negative selection on the T cell repertoire reactive to a self-peptide: A large fraction of T cell clones escapes clonal deletion. Immunity (2000) doi: 10.1016/S1074-7613(00)00080-7. [DOI] [PubMed] [Google Scholar]
- 4.Zehn D & Bevan MJ T Cells with Low Avidity for a Tissue-Restricted Antigen Routinely Evade Central and Peripheral Tolerance and Cause Autoimmunity. Immunity (2006) doi: 10.1016/j.immuni.2006.06.009. [DOI] [PMC free article] [PubMed] [Google Scholar]
- 5.Yu W et al. Clonal Deletion Prunes but Does Not Eliminate Self-Specific αβ CD8+ T Lymphocytes. Immunity (2015) doi: 10.1016/j.immuni.2015.05.001. [DOI] [PMC free article] [PubMed] [Google Scholar]
- 6.Kim JM, Rasmussen JP & Rudensky AY Regulatory T cells prevent catastrophic autoimmunity throughout the lifespan of mice. Nat. Immunol. (2007) doi: 10.1038/ni1428. [DOI] [PubMed] [Google Scholar]
- 7.Lahl K et al. Selective depletion of Foxp3+ regulatory T cells induces a scurfy-like disease. J. Exp. Med. (2007) doi: 10.1084/jem.20061852. [DOI] [PMC free article] [PubMed] [Google Scholar]
- 8.Chinen T, Volchkov PY, Chervonsky AV & Rudensky AY A critical role for regulatory T cell-mediated control of inflammation in the absence of commensal microbiota. J. Exp. Med. (2010) doi: 10.1084/jem.20101235. [DOI] [PMC free article] [PubMed] [Google Scholar]
- 9.Yi J et al. Unregulated antigen-presenting cell activation by T cells breaks self tolerance. Proc. Natl. Acad. Sci. U. S. A. (2019) doi: 10.1073/pnas.1818624116. [DOI] [PMC free article] [PubMed] [Google Scholar]
- 10.Fernando MMA et al. Defining the role of the MHC in autoimmunity: A review and pooled analysis. PLoS Genetics (2008) doi: 10.1371/journal.pgen.1000024. [DOI] [PMC free article] [PubMed] [Google Scholar]
- 11.Sakaguchi S, Sakaguchi N, Asano M, Itoh M & Toda M Immunologic self-tolerance maintained by activated T cells expressing IL-2 receptor alpha-chains (CD25). Breakdown of a single mechanism of self-tolerance causes various autoimmune diseases. J. Immunol. (1995). [PubMed] [Google Scholar]
- 12.Morrissey PJ, Charrier K, Braddy S, Liggitt D & Watson JD CD4+ T cells that express high levels of CD45RB induce wasting disease when transferred into congenic severe combined immunodeficient mice. disease development is prevented by cotransfer of purified CD4+ T Cells. J. Exp. Med. (1993) doi: 10.1084/jem.178.1.237. [DOI] [PMC free article] [PubMed] [Google Scholar]
- 13.Powrie F, Leach MW, Mauze S, Caddie LB & Coffman RL Phenotypically distinct subsets of cd4+t cells induce or protect from chronic intestinal inflammation in c. B-17 scid mice. Int. Immunol. (1993) doi: 10.1093/intimm/5.11.1461. [DOI] [PubMed] [Google Scholar]
- 14.Kim HJ, Verbinnen B, Tang X, Lu L & Cantor H Inhibition of follicular T-helper cells by CD8 + regulatory T cells is essential for self tolerance. Nature (2010) doi: 10.1038/nature09370. [DOI] [PMC free article] [PubMed] [Google Scholar]
- 15.Richards DM et al. The Contained Self-Reactive Peripheral T Cell Repertoire: Size, Diversity, and Cellular Composition. J. Immunol. (2015) doi: 10.4049/jimmunol.1500880. [DOI] [PubMed] [Google Scholar]
- 16.Yi J et al. Unregulated antigen-presenting cell activation by T cells breaks self tolerance. Proc. Natl. Acad. Sci. U. S. A. (2019) doi: 10.1073/pnas.1818624116. [DOI] [PMC free article] [PubMed] [Google Scholar]
- 17.Kawabe T et al. Memory-phenotype CD4+ T cells spontaneously generated under steady-state conditions exert innate TH1-like effector function. Sci. Immunol. (2017) doi: 10.1126/sciimmunol.aam9304. [DOI] [PMC free article] [PubMed] [Google Scholar]
- 18.Levine AG et al. Stability and function of regulatory T cells expressing the transcription factor T-bet. Nature (2017) doi: 10.1038/nature22360. [DOI] [PMC free article] [PubMed] [Google Scholar]
- 19.Kawabe T et al. Requirements for the differentiation of innate T-bet high memory-phenotype CD4+ T lymphocytes under steady state. Nat. Commun. (2020) doi: 10.1038/s41467-020-17136-1. [DOI] [PMC free article] [PubMed] [Google Scholar]
- 20.Kalekar LA et al. CD4+ T cell anergy prevents autoimmunity and generates regulatory T cell precursors. Nat. Immunol. (2016) doi: 10.1038/ni.3331. [DOI] [PMC free article] [PubMed] [Google Scholar]
- 21.Malchow S et al. Aire-dependent thymic development of tumor-associated regulatory T cells. Science (2013) doi: 10.1126/science.1233913. [DOI] [PMC free article] [PubMed] [Google Scholar]
- 22.Malchow S et al. Aire Enforces Immune Tolerance by Directing Autoreactive T Cells into the Regulatory T Cell Lineage. Immunity 44, 1102–13 (2016) doi: 10.1016/j.immuni.2016.02.009. [DOI] [PMC free article] [PubMed] [Google Scholar]
- 23.Sant’Angelo DB et al. The imprint of intrathymic self-peptides on the mature T cell receptor repertoire. Immunity (1997) doi: 10.1016/S1074-7613(00)80373-8. [DOI] [PubMed] [Google Scholar]
- 24.Hsieh CS et al. Recognition of the peripheral self by naturally arising CD25+ CD4+ T cell receptors. Immunity (2004) doi: 10.1016/j.immuni.2004.07.009. [DOI] [PubMed] [Google Scholar]
- 25.Miller CH et al. Eomes identifies thymic precursors of self-specific memory-phenotype CD8+ T cells. Nat. Immunol. (2020) doi: 10.1038/s41590-020-0653-1. [DOI] [PMC free article] [PubMed] [Google Scholar]
- 26.McDonald BD, Bunker JJ, Erickson SA, Oh-Hora M & Bendelac A Crossreactive αβ T Cell Receptors Are the Predominant Targets of Thymocyte Negative Selection. Immunity (2015) doi: 10.1016/j.immuni.2015.09.009. [DOI] [PMC free article] [PubMed] [Google Scholar]
- 27.Miyazaki T et al. Mice lacking H2-M complexes, enigmatic elements of the MHC class II peptide-loading pathway. Cell (1996) doi: 10.1016/S0092-8674(00)81029-6. [DOI] [PubMed] [Google Scholar]
- 28.Subramanian A et al. Gene set enrichment analysis: A knowledge-based approach for interpreting genome-wide expression profiles. Proc. Natl. Acad. Sci. U. S. A. (2005) doi: 10.1073/pnas.0506580102. [DOI] [PMC free article] [PubMed] [Google Scholar]
- 29.Nurieva RI et al. Generation of T follicular helper cells is mediated by interleukin-21 but independent of T helper 1, 2, or 17 cell lineages. Immunity 29, 138–149 (2008) doi: 10.1016/j.immuni.2008.05.009. [DOI] [PMC free article] [PubMed] [Google Scholar]
- 30.Wei G et al. Global mapping of H3K4me3 and H3K27me3 reveals specificity and plasticity in lineage fate determination of differentiating CD4+ T cells. Immunity 30, 155–167 (2009) doi: 10.1016/j.immuni.2008.12.009. [DOI] [PMC free article] [PubMed] [Google Scholar]
- 31.Johnston RJ et al. Bcl6 and Blimp-1 are reciprocal and antagonistic regulators of T follicular helper cell differentiation. Science 325, 1006–1010 (2009) doi: 10.1126/science.1175870. [DOI] [PMC free article] [PubMed] [Google Scholar]
- 32.Yusuf I et al. Germinal Center T Follicular Helper Cell IL-4 Production Is Dependent on Signaling Lymphocytic Activation Molecule Receptor (CD150). J. Immunol. 185, 190–202 (2010) doi: 10.4049/jimmunol.0903505. [DOI] [PMC free article] [PubMed] [Google Scholar]
- 33.Kitano M et al. Bcl6 Protein Expression Shapes Pre-Germinal Center B Cell Dynamics and Follicular Helper T Cell Heterogeneity. Immunity 34, 961–972 (2011) doi: 10.1016/j.immuni.2011.03.025. [DOI] [PubMed] [Google Scholar]
- 34.Liu X et al. Bcl6 expression specifies the T follicular helper cell program in vivo. J. Exp. Med. 209, 1841–1852, S1–24 (2012) doi: 10.1084/jem.20120219. [DOI] [PMC free article] [PubMed] [Google Scholar]
- 35.Samstein RM et al. Foxp3 exploits a pre-existent enhancer landscape for regulatory T cell lineage specification. Cell 151, 153–166 (2012) doi: 10.1016/j.cell.2012.06.053. [DOI] [PMC free article] [PubMed] [Google Scholar]
- 36.Hale JS et al. Distinct memory CD4+ T cells with commitment to T follicular helper- and T helper 1-cell lineages are generated after acute viral infection. Immunity 38, 805–817 (2013) doi: 10.1016/j.immuni.2013.02.020. [DOI] [PMC free article] [PubMed] [Google Scholar]
- 37.Crotty S T Follicular Helper Cell Differentiation, Function, and Roles in Disease. Immunity (2014) doi: 10.1016/j.immuni.2014.10.004. [DOI] [PMC free article] [PubMed] [Google Scholar]
- 38.Vinuesa CG, Linterman MA, Yu D & Maclennan ICM Follicular Helper T Cells. Annu. Rev. Immunol. (2016) doi: 10.1146/annurev-immunol-041015-055605. [DOI] [PubMed] [Google Scholar]
- 39.Crotty S T Follicular Helper Cell Biology: A Decade of Discovery and Diseases. Immunity (2019) doi: 10.1016/j.immuni.2019.04.011. [DOI] [PMC free article] [PubMed] [Google Scholar]
- 40.Xu W et al. The Transcription Factor Tox2 Drives T Follicular Helper Cell Development via Regulating Chromatin Accessibility. Immunity (2019) doi: 10.1016/j.immuni.2019.10.006. [DOI] [PubMed] [Google Scholar]
- 41.Nurieva RI et al. Bcl6 mediates the development of T follicular helper cells. Science (2009) doi: 10.1126/science.1176676. [DOI] [PMC free article] [PubMed] [Google Scholar]
- 42.McDonald BD, Bunker JJ, Ishizuka IE, Jabri B & Bendelac A Elevated T cell receptor signaling identifies a thymic precursor to the TCRαβ+CD4-CD8β- intraepithelial lymphocyte lineage. Immunity (2014) doi: 10.1016/j.immuni.2014.07.008. [DOI] [PMC free article] [PubMed] [Google Scholar]
- 43.Baldwin T, Sandau MM, Jameson SC & Hogquist KA The timing of TCR alpha expression critically influences T cell development and selection. J. Exp. Med. (2005) doi: 10.1084/jem.20050359. [DOI] [PMC free article] [PubMed] [Google Scholar]
- 44.Klawon DEJ et al. Altered selection on a single self-ligand promotes susceptibility to organ-specific T cell infiltration. J. Exp. Med. (2021) doi: 10.1084/jem.20200701. [DOI] [PMC free article] [PubMed] [Google Scholar]
- 45.Hogquist KA Assays of thymic selection. Fetal thymus organ culture and in vitro thymocyte dulling assay. Methods Mol. Biol. (2001) doi: 10.1385/1-59259-062-4:219. [DOI] [PubMed] [Google Scholar]
- 46.Azzam HS et al. CD5 expression is developmentally regulated by T cell receptor (TCR) signals and TCR avidity. J. Exp. Med. (1998) doi: 10.1084/jem.188.12.2301. [DOI] [PMC free article] [PubMed] [Google Scholar]
- 47.Bautista JL et al. Intraclonal competition limits the fate determination of regulatory T cells in the thymus. Nat. Immunol. (2009) doi: 10.1038/ni.1739. [DOI] [PMC free article] [PubMed] [Google Scholar]
- 48.Leung MWL, Shen S & Lafaille JJ TCR-dependent differentiation of thymic Foxp3+ cells is limited to small clonal sizes. J. Exp. Med. (2009) doi: 10.1084/jem.20091033. [DOI] [PMC free article] [PubMed] [Google Scholar]
- 49.Alonso R et al. Induction of anergic or regulatory tumor-specific CD4+ T cells in the tumor-draining lymph node. Nat. Commun. (2018) doi: 10.1038/s41467-018-04524-x. [DOI] [PMC free article] [PubMed] [Google Scholar]
- 50.Simpson N et al. Expansion of circulating T cells resembling follicular helper T cells is a fixed phenotype that identifies a subset of severe systemic lupus erythematosus. Arthritis Rheum. (2010) doi: 10.1002/art.25032. [DOI] [PubMed] [Google Scholar]
- 51.Liu R et al. A regulatory effect of IL-21 on T follicular helper-like cell and B cell in rheumatoid arthritis. Arthritis Res. Ther. (2012) doi: 10.1186/ar4100. [DOI] [PMC free article] [PubMed] [Google Scholar]
- 52.Zhu C et al. Increased frequency of follicular helper T cells in patients with autoimmune thyroid disease. J. Clin. Endocrinol. Metab. (2012) doi: 10.1210/jc.2011-2003. [DOI] [PubMed] [Google Scholar]
- 53.Choi JY et al. Circulating follicular helper-like T cells in systemic lupus erythematosus: Association with disease activity. Arthritis Rheumatol. (2015) doi: 10.1002/art.39020. [DOI] [PMC free article] [PubMed] [Google Scholar]
- 54.Rathmell JC et al. CD95 (Fas)-dependent elimination of self-reactive B cells upon interaction with CD4+T cells. Nature (1995) doi: 10.1038/376181a0. [DOI] [PubMed] [Google Scholar]
- 55.Rathmell JC, Townsend SE, Xu JC, Flavell RA & Goodnow CC Expansion or elimination of B cells in vivo: Dual roles for CD40- and Fas (CD95)-ligands modulated by the B cell antigen receptor. Cell (1996) doi: 10.1016/S0092-8674(00)81349-5. [DOI] [PubMed] [Google Scholar]
- 56.Yu Di et al. Roquin represses autoimmunity by limiting inducible T-cell co-stimulator messenger RNA. Nature (2007) doi: 10.1038/nature06253. [DOI] [PubMed] [Google Scholar]
- 57.Wing JB, Ise W, Kurosaki T & Sakaguchi S Regulatory T cells control antigen-specific expansion of Tfh cell number and humoral immune responses via the coreceptor CTLA-4. Immunity (2014) doi: 10.1016/j.immuni.2014.12.006. [DOI] [PubMed] [Google Scholar]
- 58.Leonard JD et al. Identification of Natural Regulatory T Cell Epitopes Reveals Convergence on a Dominant Autoantigen. Immunity (2017) doi: 10.1016/j.immuni.2017.06.015. [DOI] [PMC free article] [PubMed] [Google Scholar]
- 59.Klawon DEJ et al. Altered selection on a single self-ligand promotes susceptibility to organ-specific T cell infiltration. J. Exp. Med. (2021) doi: 10.1084/jem.20200701. [DOI] [PMC free article] [PubMed] [Google Scholar]
- 60.Owen DL et al. Thymic regulatory T cells arise via two distinct developmental programs. Nat. Immunol. (2019) doi: 10.1038/s41590-018-0289-6. [DOI] [PMC free article] [PubMed] [Google Scholar]
METHODS-ONLY REFERENCES
- 61.Kennedy DE et al. Novel specialized cell state and spatial compartments within the germinal center. Nat. Immunol. (2020) doi: 10.1038/s41590-020-0660-2. [DOI] [PMC free article] [PubMed] [Google Scholar]
- 62.Schindelin J et al. Fiji: an open-source platform for biological-image analysis. Nat. Methods (2012) doi: 10.1038/nmeth.2019. [DOI] [PMC free article] [PubMed] [Google Scholar]
- 63.Hamaguchi Y et al. The Peritoneal Cavity Provides a Protective Niche for B1 and Conventional B Lymphocytes during Anti-CD20 Immunotherapy in Mice. J. Immunol. (2005) doi: 10.4049/jimmunol.174.7.4389. [DOI] [PubMed] [Google Scholar]
- 64.Dobin A et al. STAR: Ultrafast universal RNA-seq aligner. Bioinformatics (2013) doi: 10.1093/bioinformatics/bts635. [DOI] [PMC free article] [PubMed] [Google Scholar]
- 65.Liao Y, Smyth GK & Shi W FeatureCounts: An efficient general purpose program for assigning sequence reads to genomic features. Bioinformatics (2014) doi: 10.1093/bioinformatics/btt656. [DOI] [PubMed] [Google Scholar]
- 66.Robinson MD, McCarthy DJ & Smyth GK edgeR: A Bioconductor package for differential expression analysis of digital gene expression data. Bioinformatics (2010) doi: 10.1093/bioinformatics/btp616. [DOI] [PMC free article] [PubMed] [Google Scholar]
- 67.McCarthy DJ, Chen Y & Smyth GK Differential expression analysis of multifactor RNA-Seq experiments with respect to biological variation. Nucleic Acids Res. (2012) doi: 10.1093/nar/gks042. [DOI] [PMC free article] [PubMed] [Google Scholar]
- 68.Benjamini Y & Hochberg Y Controlling the False Discovery Rate: A Practical and Powerful Approach to Multiple Testing. J. R. Stat. Soc. Ser. B Methodol. (1995) doi: 10.1111/j.2517-6161.1995.tb02031.x. [DOI] [Google Scholar]
- 69.Haimon Z et al. Cognate microglia–T cell interactions shape the functional regulatory T cell pool in experimental autoimmune encephalomyelitis pathology. Nat. Immunol. (2022) doi: 10.1038/s41590-022-01360-6. [DOI] [PubMed] [Google Scholar]
- 70.Painter MW et al. Transcriptomes of the B and T Lineages Compared by Multiplatform Microarray Profiling. J. Immunol. (2011) doi: 10.4049/jimmunol.1002695. [DOI] [PMC free article] [PubMed] [Google Scholar]
Associated Data
This section collects any data citations, data availability statements, or supplementary materials included in this article.
Supplementary Materials
Supplementary Table 1
T1 Complete TCRα sequencing frequency table
For samples subjected to complete TCRα sequencing (see Methods), the frequencies of each TCR CDR3α segment, as a percentage of all TCRα sequence reads within a given sample, are listed. For this table, TCRs were cataloged solely based on predicted TCR CDR3α sequence, regardless of V-region usage. The table lists the Sample ID (PR 1–5, SG 1–5, and TRAMP 1–5) for the complete TCRα sequencing data set, the organ from which T cells were isolated (PR, prostate; SG, salivary glands), the genotype (Foxp3DTR-EGFP or TRAMP), the treatment (Treg-depleted or untreated), and the T cell subset (Tconv cells). For each biological sample, the total number of in-frame TCR sequence reads and the number of unique TCR sequence reads are also listed.
Supplementary Table 2
T2 Selection of recurrent prostate-infiltrating CD4+ Tconv clones for TCR retrogenic studies
13 of the top 20 most abundant recurrent TCRα sequences expressed by Tconv cells in the prostate of Treg cell-depleted mice were selected for TCR retrogenic studies. TCRs were selected based on differential TRAV and TRAJ usage. Each TCRα chain is denoted using a 3-letter code representing residues 3–5 of the predicted CDR3α chain. The full TCRα sequence information is listed, including TRAV and TRAJ usage. The 13 selected TCRα clonotypes can be binned into three groups based on hallmarks of steady-state activation and reactivity to MHC-II-restricted self-ligands (see Extended Data Figs. 3 and 4).
Supplementary Table 3
T3 List of primers used for the generation of TCR retrogenic constructs
Data Availability Statement
The RNA sequencing data are available at the National Institutes of Health Gene Expression Omnibus (GEO) repository under accession number GSE190127. All other source data, including TCR sequencing data, are provided with this manuscript.