

Abstract
Iron-sulfur (Fe-S) clusters are ubiquitous metallocofactors involved in redox chemistry, radical generation, and gene regulation. Common methods to monitor Fe-S clusters include spectroscopic analysis of purified proteins, and auto-radiographic visualization of radiolabeled iron distribution in proteomes. Here, we report a chemoproteomic strategy that monitors changes in the reactivity of Fe-S cysteine ligands to inform on Fe-S cluster occupancy. We highlight the utility of this platform in E. coli by: (1) demonstrating global disruptions in Fe-S incorporation in cells cultured under iron-depleted conditions; (2) determining Fe-S client proteins reliant on five scaffold, carrier and chaperone proteins within the Isc Fe-S biogenesis pathway; and, (3) identifying two previously unannotated Fe-S proteins, TrhP and DppD. In summary, the chemoproteomic strategy described herein is a powerful tool that reports on Fe-S cluster incorporation directly within a native proteome, enabling the interrogation of Fe-S biogenesis pathways and the identification of previously uncharacterized Fe-S proteins.
Introduction
Iron-sulfur (Fe-S) proteins harbor one or more Fe-S clusters, which are inorganic metallocofactors composed of iron and sulfide.1 Fe-S proteins are essential to cellular pathways, including: (1) electron-transfer reactions within respiratory chains;2 (2) radical generation for cofactor synthesis and tRNA/rRNA modification;3,4 (3) transcriptional regulation and DNA repair;5,6 and, (4) generation of primary metabolites, such as aconitate and fumarate.7,8 In E. coli there are 144 annotated Fe-S proteins (Extended Data Fig. 1 and Supplementary Dataset 1), representing ~3% of the proteome, with new Fe-S proteins discovered every year.9 Fe-S clusters are typified by their ligation to protein cysteine residues, yet cysteine motifs and ligation patterns vary by protein family.10 Notably, even within the AdoMet radical enzyme family, which typically contain a well-conserved CxxxCxxC Fe-S ligation motif,11,12 atypical cysteine ligation patterns have recently been identified.10,13 As a result, the de novo identification of Fe-S proteins remains a challenge.
Tightly regulated pathways exist for the biogenesis and delivery of Fe-S clusters, necessitated by the high reactivity of the component iron and sulfide species.14,15 Bacterial Fe-S cluster biogenesis occurs through the house-keeping Isc, the stress-responsive Suf, and the nitrogenase-specific Nif pathways. These pathways shuttle Fe-S clusters among scaffold and carrier proteins before ultimate transfer to client proteins. Client proteins are either newly translated polypeptides, or proteins that have lost their Fe-S cluster due to oxidative damage,16 cannibalism of the cluster as a source of sulfur,17 or iron-limitation.18 Detailed understanding of the role of each scaffold and carrier protein is complicated by the inability to directly monitor Fe-S cluster occupancy within a native proteome. Existing methods involve the use of radioactive iron and sulfur isotopes, which are technically challenging, have limited sensitivity, and do not identify the exact site of cluster binding within a protein.19,20 Many aspects of Fe-S cluster biogenesis, delivery, and damage have been recapitulated with in vitro assays and purified Fe-S proteins,21,22 but confirming the physiological relevance of these studies remains a challenge.
Strategies to monitor Fe-S cluster binding directly in native systems would facilitate functional characterization of Fe-S biogenesis components, and identification of unannotated Fe-S proteins. Here, we leverage a chemoproteomic technique, termed isoTOP-ABPP,23,24 to assess the reactivity of Fe-S cysteine ligands across the E. coli proteome. IsoTOP-ABPP applies a cysteine-reactive chemical probe, typically an iodoacetamide-alkyne (IA-alkyne) probe, to monitor cysteine-reactivity changes across two biological systems. This strategy has been applied to identify cysteine residues that are targeted by covalent ligands,25 reactive oxygen species,26 and zinc binding,27 which result in a loss in cysteine labeling by the IA-alkyne probe. Here, we apply isoTOP-ABPP to E. coli proteomes with impaired Fe-S cluster formation, and demonstrate that Fe-S cysteine ligands in apo- proteins show increased reactivity relative to holo-proteins. We focused on E. coli due to the relatively large and well-characterized Fe-S proteome (144 members or 3% of the proteome), and the ability to manipulate iron availability and Fe-S biogenesis capability. We use isoTOP-ABPP to evaluate perturbations to E. coli Fe-S proteins in response to iron-depletion, or deletion of components of the Isc pathway. We show that deletion of the IscU, IscA, Nfu, HscA and HscB scaffold, carrier and chaperone proteins in the Isc pathway have unique functional consequences on the global Fe-S proteome. Lastly, we determine cysteine residues that show reactivity signatures that align with known Fe-S cysteine ligands, and identify two Fe-S proteins from E. coli that have not previously been characterized.
Results
Application of isoTOP-ABPP to monitor Fe-S cluster binding.
We hypothesized that Fe-S cysteine ligands on non-denatured holo-proteins are minimally reactive with IA-alkyne, whereas those same cysteines within apo-proteins are significantly more IA-alkyne reactive (Fig. 1a). To demonstrate this reactivity difference, we focused on apo- and holo-proteins of the [4Fe-4S] cluster-containing protein aconitase (AcnA). AcnA grown under iron-replete conditions displayed a UV-visible absorbance spectrum indicative of the presence of a [4Fe-4S] cluster (Fig. 1b), and showed minimal labeling with IA-alkyne (Fig. 1c). In contrast, robust IA-alkyne labeling was observed under iron-depleted conditions (Fig. 1b,c), confirming the enhanced reactivity of Fe-S cysteine ligands in the apo-protein.
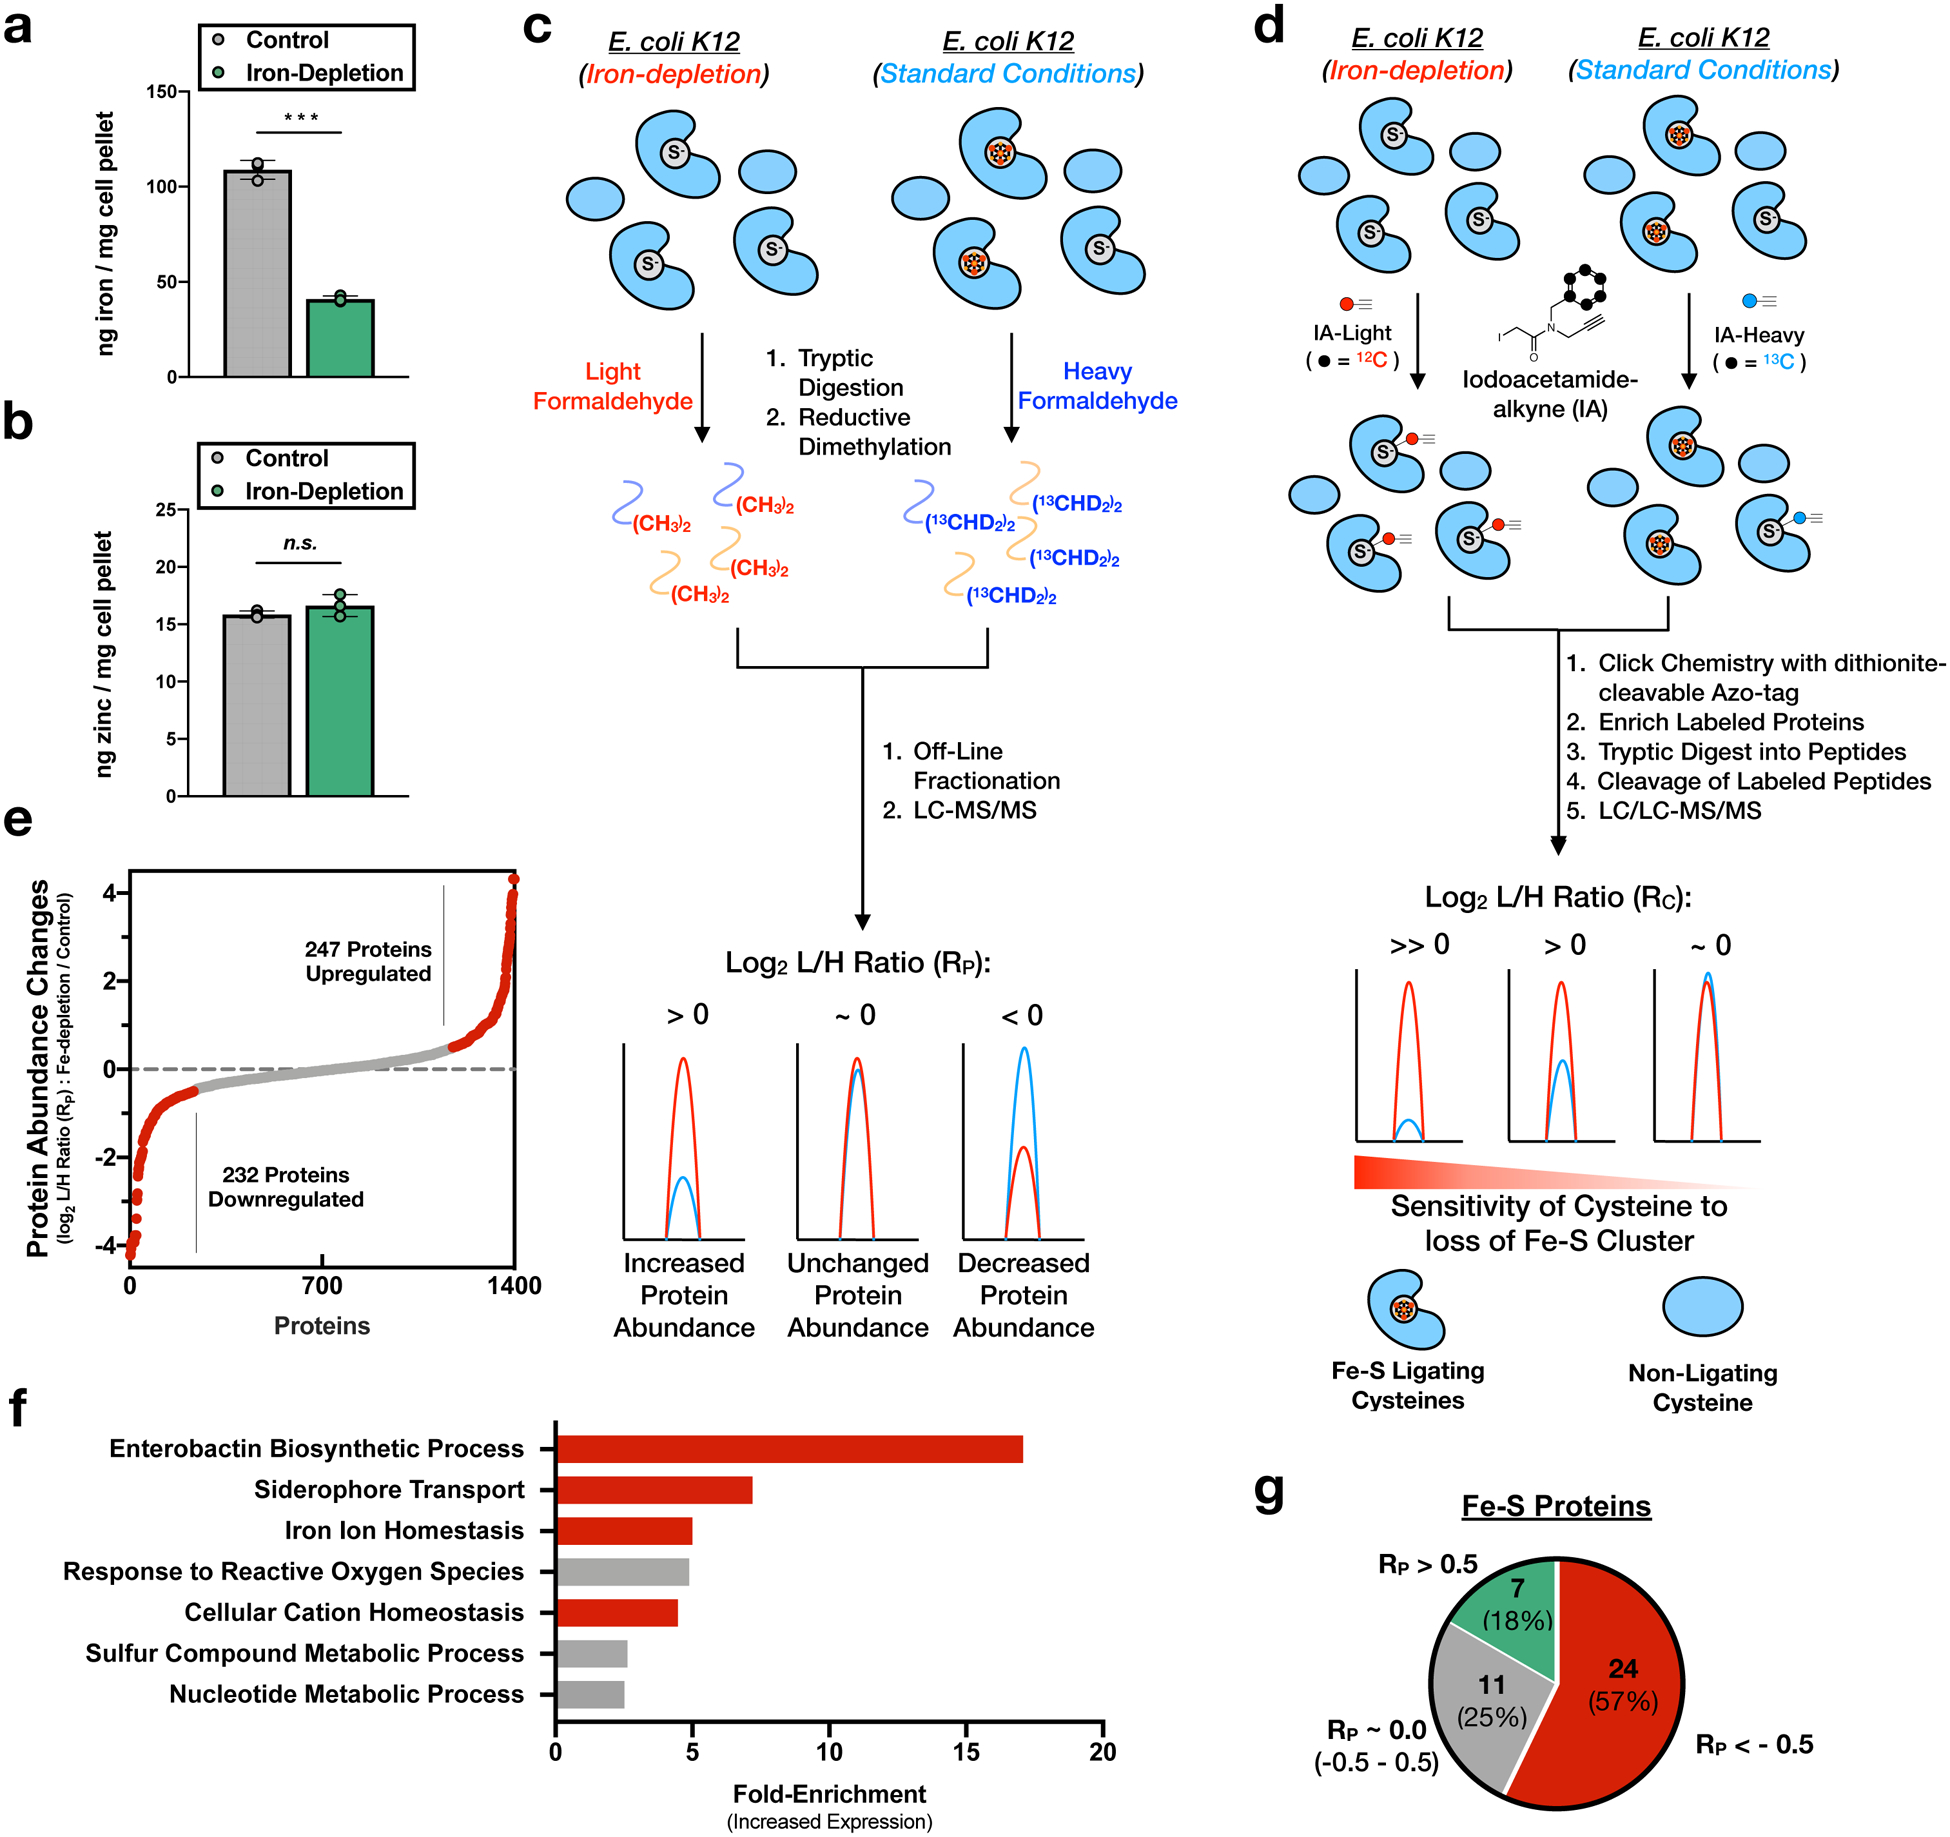
Fig. 1 |. A two-dimensional chemoproteomic platform to monitor Fe-S cluster binding.
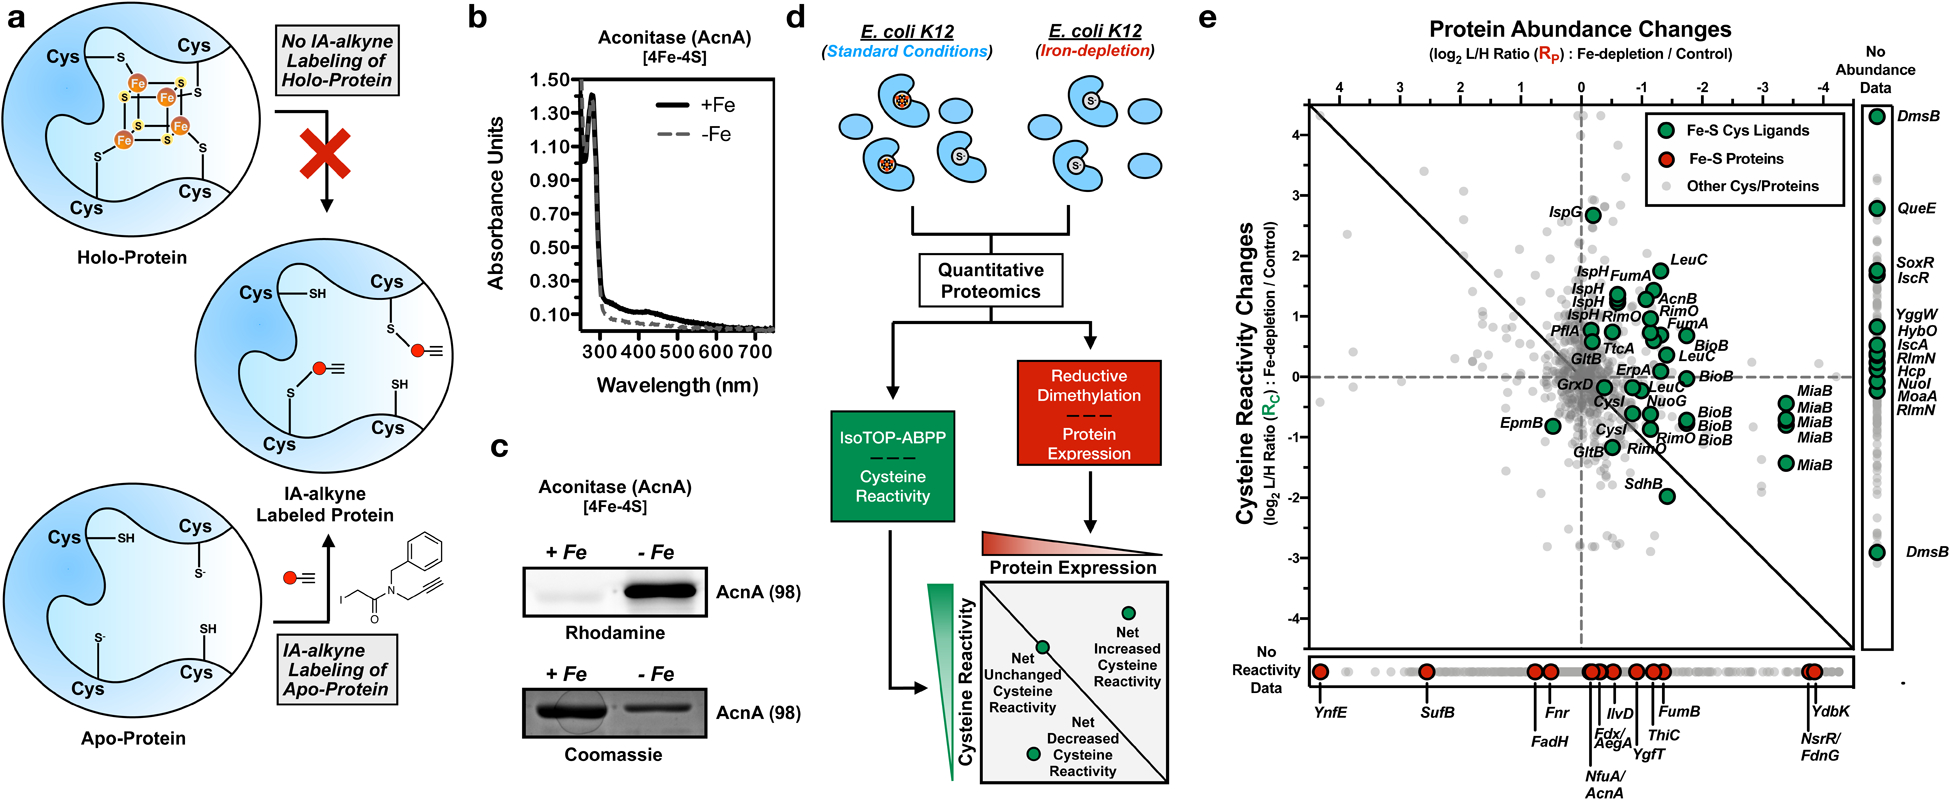
a, Labeling of apo- and holo-proteins with a cysteine-reactive IA-alkyne probe. b, UV-visible absorbance spectrum of recombinant aconitase (AcnA) purified from E. coli (BL21) cells grown under iron-depleted (--) or iron-replete (—) media. Spectra are normalized to the 280 nm protein signal. c, Representative rhodamine and coomassie-blue gels of AcnA purified from iron-depleted (-Fe) or iron-replete (+Fe) media, labeled with IA-alkyne, and conjugated to a fluorophore using copper-catalyzed azide-alkyne cycloaddition (CuAAC) (experiment independently repeated twice). The observed molecular weight (kDa) for AcnA is given in parentheses. d, Two-dimensional proteomic platform for monitoring net changes in cysteine reactivity across a bacterial proteome during iron-limitation. Quantitative chemoproteomic methods are applied to monitor changes in IA-alkyne labeling of cysteines (isoTOP-ABPP) and protein abundance (ReDiMe) upon iron-depletion. Cysteine residues with ratios above the expected linear correlation line show a net increase in cysteine reactivity, those on the line show no net change, and those below the line show a net decrease in cysteine reactivity. e, Two-dimensional proteomic dataset for the E. coli proteome grown under iron-depletion (see Supplementary Dataset 2). All quantified cysteine residues are plotted in the main graph (annotated Fe-S cysteine ligands - green circles, non-annotated cysteine residues - light gray small circles). Inset to right: cysteine residues with no protein abundance data (annotated Fe-S cysteine ligands - green circles, non-annotated cysteine residues - light gray small circles). Inset below: proteins with no cysteine labeling data (annotated Fe-S protein - red circles, non-annotated proteins - light gray small).
Given that cysteines in apo-AcnA displayed increased reactivity relative to holo-AcnA, we used the isoTOP-ABPP platform to query cysteine reactivity differences in the E. coli Fe-S proteome under iron-depleted versus iron-replete conditions. Prior applications of isoTOP-ABPP used short treatments with ligand or oxidant that minimally perturbed protein abundance. In contrast, the iron-depletion conditions that were applied here are likely to significantly change protein abundance due to activation of an E. coli transcriptional program geared to increase intracellular iron levels.28 Therefore, IA-alkyne labeling changes in isoTOP-ABPP reflect changes in both cysteine reactivity and protein abundance. To enable the quantification of net changes in cysteine reactivity, we needed to correlate protein expression changes with changes in cysteine reactivity.29 We established a two-dimensional analysis that quantitatively monitors changes in protein abundance using reductive dimethylation (ReDiMe) in the first dimension, and changes in IA-alkyne labeling of cysteines using isoTOP-ABPP in the second dimension. Cysteines displaying no net change in reactivity track linearly with protein abundance along the diagonal correlation line in the two-dimensional plot (Fig. 1d). Fe-S cysteines are expected to display net increases in reactivity and lie above the correlation line, where the distance from the diagonal reflects the magnitude of the reactivity change, and thereby the relative abundance of apo- versus holo-protein.
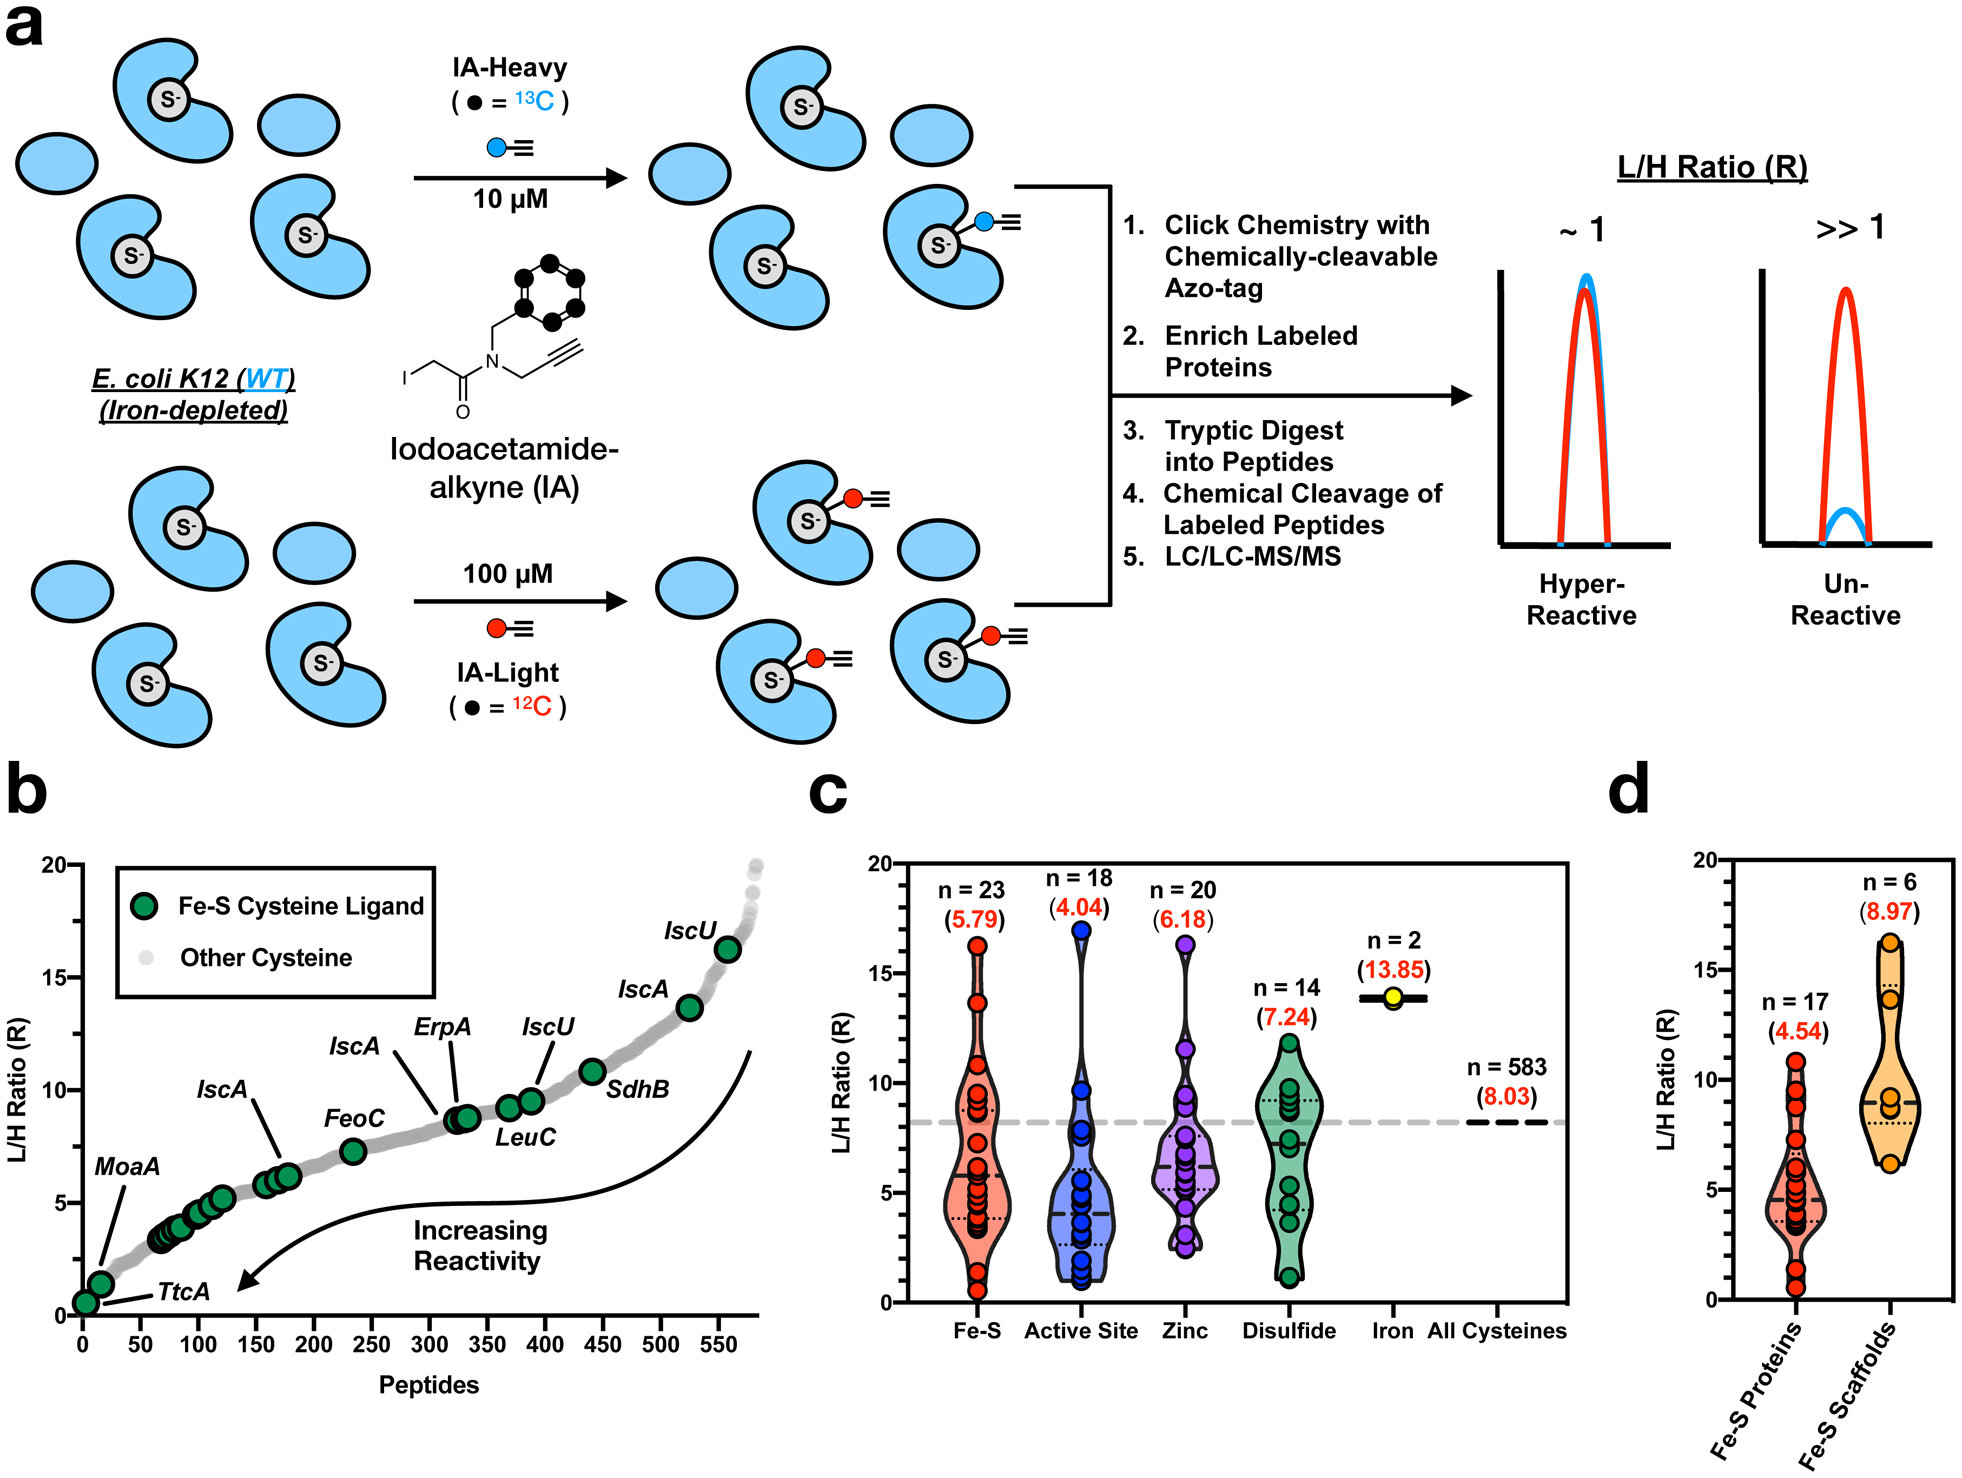
E. coli (K12) cells were grown in minimal media with standard (iron-replete) or 100-fold decreased (iron-depleted) levels of iron. During exponential growth (OD600 ~ 0.6), a ~3-fold decrease in intracellular iron levels was measured by inductively coupled plasma-optical emission spectrometry (ICP-OES) (Extended Data Fig. 2a). In contrast, intracellular zinc levels remained constant (Extended Data Fig. 2b), confirming the specific depletion of iron over other metals. The resulting cell lysates were processed for both ReDiMe30 (Extended Data Fig. 2c) and isoTOP-ABPP23 (Extended Data Fig. 2d) analyses. In the ReDiMe dimension, proteins were subjected to trypsin digestion and isotopic labeling through reductive dimethylation with light (iron-depleted) and heavy (iron-replete) formaldehyde (Extended Data Fig. 2c). The resulting protein log2 light:heavy (L/H) ratios, RP, reflect the relative protein abundance under the two conditions, where RP > 0 indicates increased protein abundance under iron depletion. In the isoTOP-ABPP dimension, iron-depleted and iron-replete cell lysates were labeled with isotopically tagged variants of the IA-alkyne probe,31 IA-light and IA-heavy (Extended Data Fig. 2d), respectively. IA-labeled proteins were conjugated to chemically cleavable biotin-azide, and the light and heavy-labeled samples were combined, enriched on streptavidin beads, and subjected to on-bead trypsin digestion. IA-labeled peptides were eluted and analyzed by LC/LC-MS/MS. The resulting cysteine log2 L/H ratios, RC, reflect the relative changes in cysteine labeling, where RC > 0 indicates an increase in cysteine labeling in the iron-depleted sample.
The ReDiMe analysis quantified the abundance of 1,422 proteins, with 479 displaying changes in protein abundance upon iron depletion (RP > |0.5|) (Extended Data Fig. 2e and Supplementary Dataset 2). Gene-ontology analysis of the 247 up-regulated proteins (RP > 0.5) showed significant enrichment of processes involved in iron uptake, siderophore biosynthesis, and metal homeostasis (Extended Data Fig. 2f). Importantly, 42 Fe-S proteins were identified, of which 24 were down-regulated (Extended Data Fig. 2g) due to translational suppression by the global iron-responsive transcription factor, Fur.28 The significant perturbation of Fe-S protein levels under iron depletion underscores the importance of accounting for protein abundance changes in the typical isoTOP-ABPP workflow.
In the isoTOP-ABPP analysis, RC values were obtained for 896 cysteines, where 651 had corresponding protein abundance information from the ReDiMe analysis (Fig. 1e and Supplementary Dataset 2). In total, RC values for 49 Fe-S cysteine residues were obtained, and of these, 29 had corresponding RP values (Fig. 1e). The remaining 20 Fe-S cysteines did not have corresponding RP values. Similarly, Fe-S cysteine RC values were not obtained for 15 Fe-S proteins with RP values. In general, Fe-S cysteines displayed net increases in cysteine reactivity relative to all cysteines identified (Fig. 2a). Additionally, non-Fe-S cysteines on Fe-S proteins displayed no reactivity changes, confirming that Fe-S occupancy (Fig. 2a) and not global structural perturbation was driving the observed reactivity changes. We can adapt the average RC values for non-ligating cysteines in each protein as a proxy for protein abundance to further increase our coverage to 36 Fe-S cysteines. To demonstrate the quantitative accuracy of the analysis, a control sample (standard versus standard growth conditions) showed no changes RP and RC values (Extended Data Fig. 3a and Supplementary Dataset 3).
Fig. 2 |. Monitoring reactivity changes for Fe-S ligating cysteines.
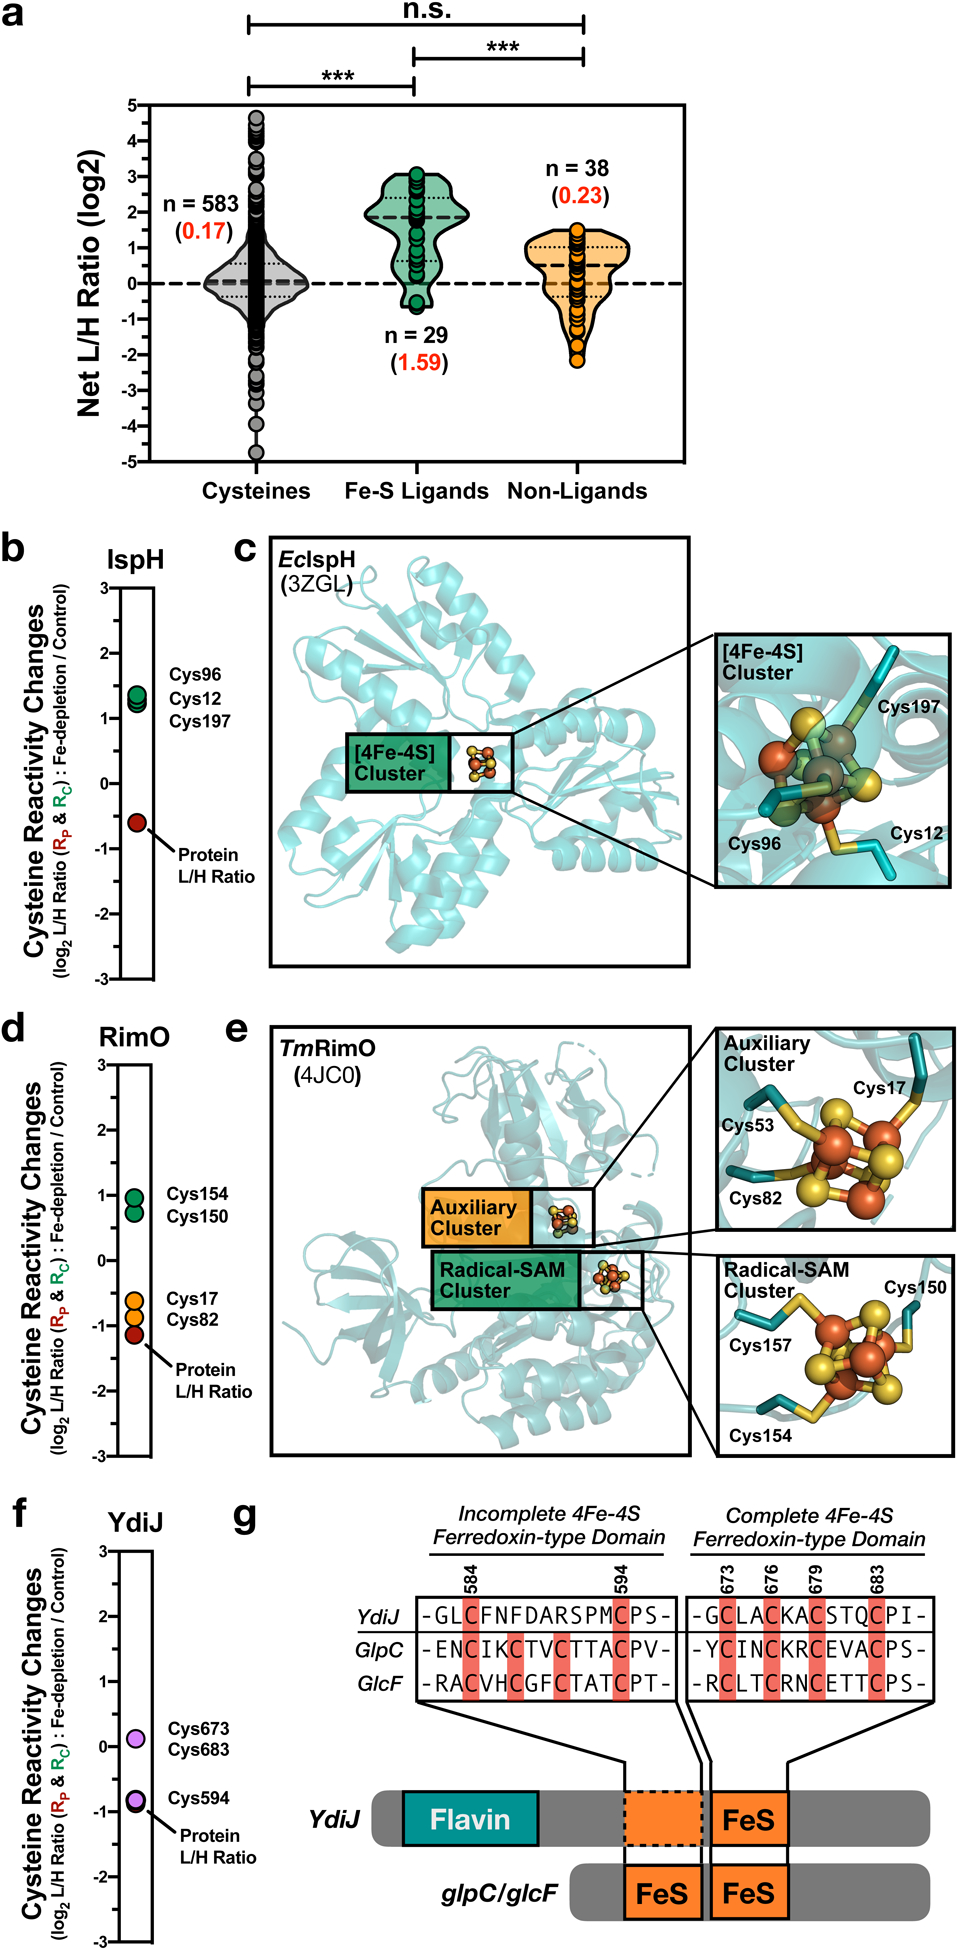
a, Violin plot of net cysteine reactivity ratios (L/H ratios; R) for Fe-S ligands (green), non-liganding cysteines from Fe-S proteins (yellow), and all other cysteine residues from non-Fe-S proteins (gray). The median R value is displayed as a dashed line in the violin plot, while the average R values (red) and number of unique values (black) are indicated for each group. Significance is calculated as *** p < 0.005 (p = 1.4E-10 and 1.8E-06), paired t-test (two-tailed), with n indicated in the figure. b, d, f, Rc values for Fe-S cysteine ligands on Fe-S proteins; b, IspH, d, RimO f, YdiJ. c, e, Crystal structures of each Fe-S protein with cluster and cysteine residues highlighted; c, E. coli IspH (Inset: [4Fe-4S] cluster – green), e, Thermotoga maritima RimO (Insets: AdoMet radical [4Fe-4S] cluster – green and auxiliary [4Fe-4S] cluster – orange), and g, Alignment of YdiJ, with homologs, GlpC and GlcF. Two [4Fe-4S] ferredoxin-type domains are shown, one complete and one incomplete.
Importantly, Fe-S clusters and non-ligated cysteines can be affected by oxygen and reactive oxygen species (ROS), potentially impacting the extent of IA-alkyne labeling. For example, oxidation-induced loss of Fe-S clusters can result in false-positive identification of apo-proteins. Additionally, intracellular ROS generated by iron depletion or impaired Fe-S biogenesis could result in oxidation and impaired IA labeling of Fe-S cysteines, generating false-negative identifications of apo-proteins. To verify that these oxidation events were not generating mis-annotations, isoTOP-ABPP analysis was repeated with; (1) lysates processed entirely under an anerobic atmosphere (Extended Data Fig. 3b and Supplementary Dataset 2) to protect clusters from oxidative damage; and (2) lysates treated with 1 mM TCEP (Extended Data Fig. 3c and Supplementary Dataset 2) to reduce oxidized Fe-S cysteines. In both cases, L/H ratios were comparable to the standard workflow, demonstrating that oxidation-induced changes were minimal.
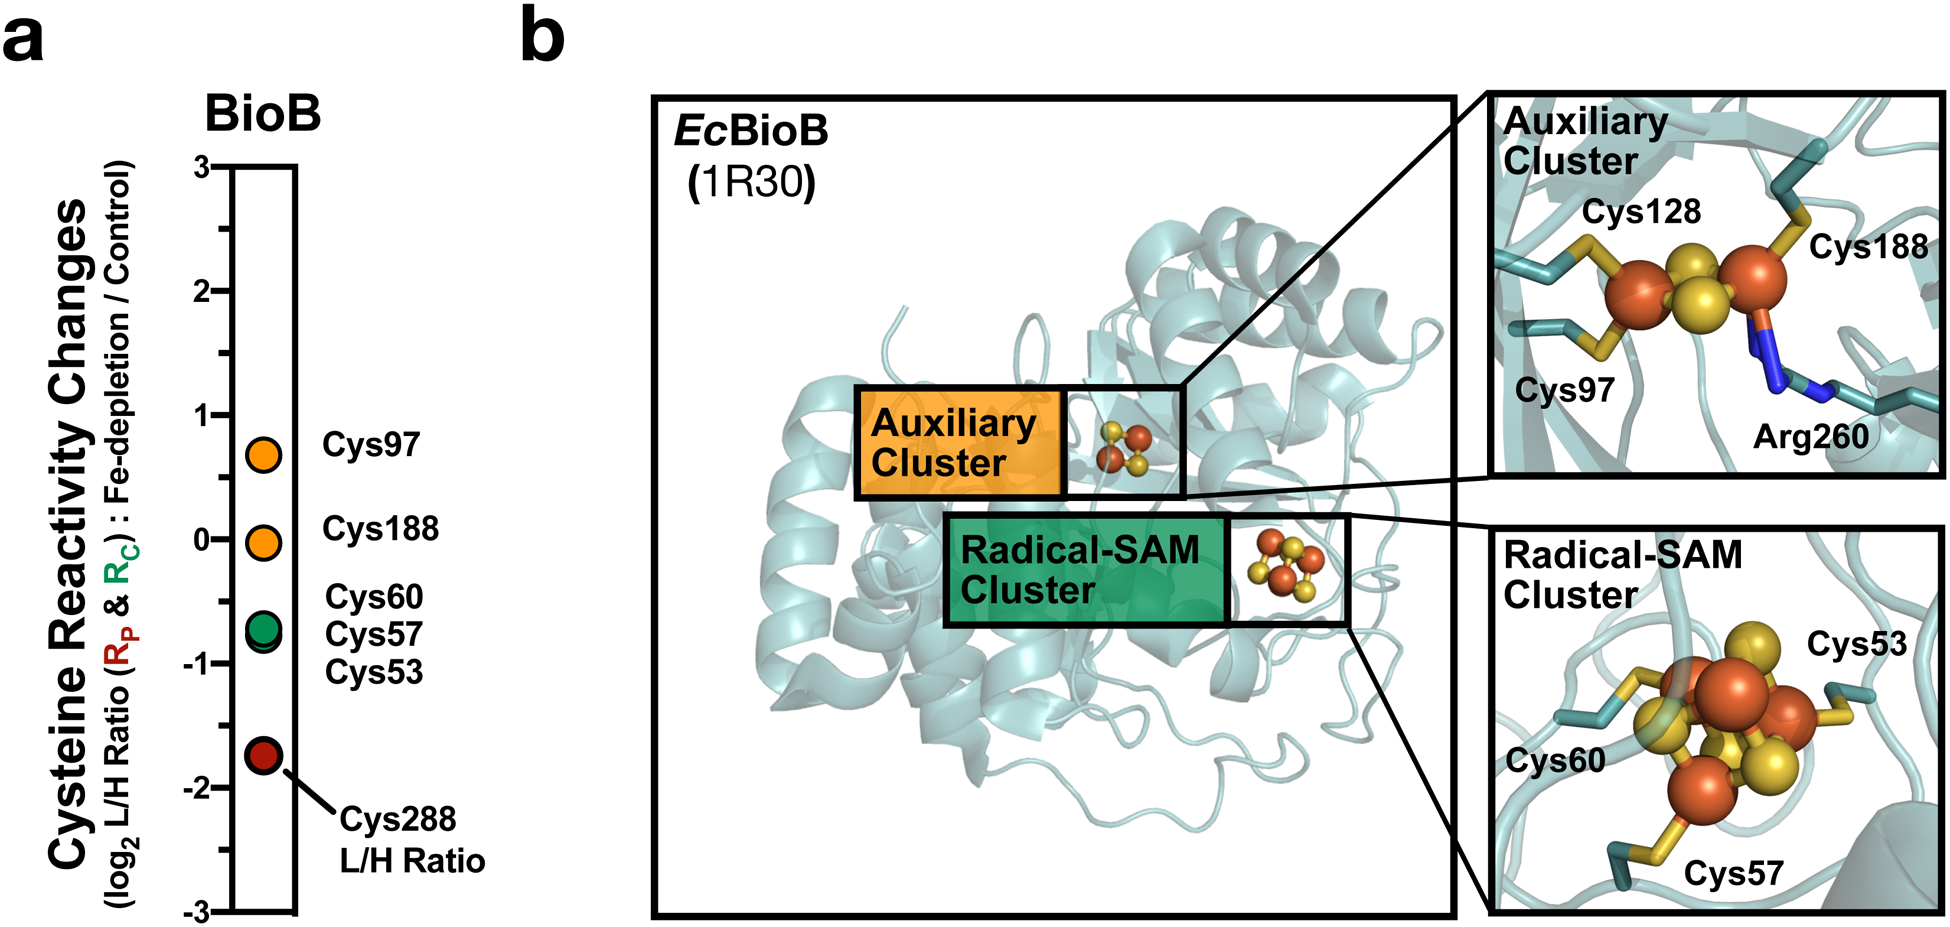
Changes in cysteine reactivity observed for individual Fe-S proteins afforded interesting insight into Fe-S cluster properties. The 49 annotated Fe-S ligating cysteines identified by isoTOP-ABPP were localized on 32 Fe-S clusters. IA-alkyne labeling of multiple cysteines within a cluster were observed for 12 (38%) of the identified clusters, and the reactivity changes for all cysteines within a given cluster tracked together. For example, the 3 Fe-S cysteine ligands on 4-hydroxy-3-methylbut-2-enyl diphosphate reductase, IspH, uniformly displayed RC values of ~1.2 (Fig. 2b,c). For proteins with multiple Fe-S clusters, differential reactivity was observed for cysteines within each cluster. For example, the ribosomal protein S12 methylthiotransferase, RimO, contains two Fe-S clusters, an AdoMet radical [4Fe-4S] cluster, and an auxiliary [4Fe-4S] cluster. Cysteines in the auxiliary cluster displayed a modest net increase in reactivity (~1.5 fold), while the AdoMet radical cluster displayed a ~4-fold net increase in reactivity (Fig. 2d,e). In contrast, for biotin synthase (BioB), the auxiliary [2Fe-2S] cluster displays a greater (~4-fold) net increase in cysteine reactivity compared to the AdoMet radical cluster (~3-fold) (Extended Data Fig. 4a,b). Therefore, the auxiliary cluster of BioB appears to be significantly less stable than the auxiliary cluster of RimO, relative to the AdoMet radical clusters on each protein, consistent with the reaction mechanisms, where the auxiliary cluster of BioB is sacrificed as a source of sulfur during the course of the reaction cycle,17 while that of RimO is left intact.32
Additionally, our data can assign ligation sites in Fe-S proteins that have yet to be fully characterized. For example, YdiJ was recently identified to bind a single Fe-S cluster (likely [4Fe-4S]),10 however, the exact ligands for the cluster were not assigned. Three cysteine residues on YdiJ (C594, C673, and C683) were identified in our analyses, and of these, only C673 and C683 displayed a net increase in cysteine reactivity, alluding to their role in ligating the Fe-S cluster on YdiJ (Fig. 2f). These cysteines belong to a conserved ferredoxin-like motif (as compared to the E. coli homologs, GlcF and GplC), while C594 is part of a partial ferredoxin-like motif that appears incomplete in this protein (Fig. 2g). Together, our platform can: (1) report on Fe-S cluster occupancy across the E. coli proteome; (2) compare multiple Fe-S clusters within a single protein; and, (3) assign Fe-S ligating residues on proteins with uncharacterized ligation sites.
Interrogating Fe-S cluster transfer and delivery.
We next sought to evaluate E. coli proteomes where Fe-S biogenesis was disrupted in a more targeted manner. E. coli genetic deletion strains of the various scaffold, carrier, and chaperone proteins of the Isc Fe-S cluster biogenesis pathway were used (Fig. 3a), including: (1) IscU, the initial scaffold protein that is responsible for [2Fe-2S] cluster synthesis; (2) IscA, an A-type carrier important for synthesis and delivery of [4Fe-4S] clusters; (3) NfuA, an alternative carrier protein involved in targeted cluster delivery, or repair of damaged/lost Fe-S clusters; (4) HscA, a protein chaperone involved in the ATP-dependent transfer of clusters to client Fe-S proteins; and, (5) HscB, a co-chaperone for HscA.14
Fig. 3 |. Interrogating the role of scaffold and carrier proteins within the Isc Fe-S biogenesis pathway.
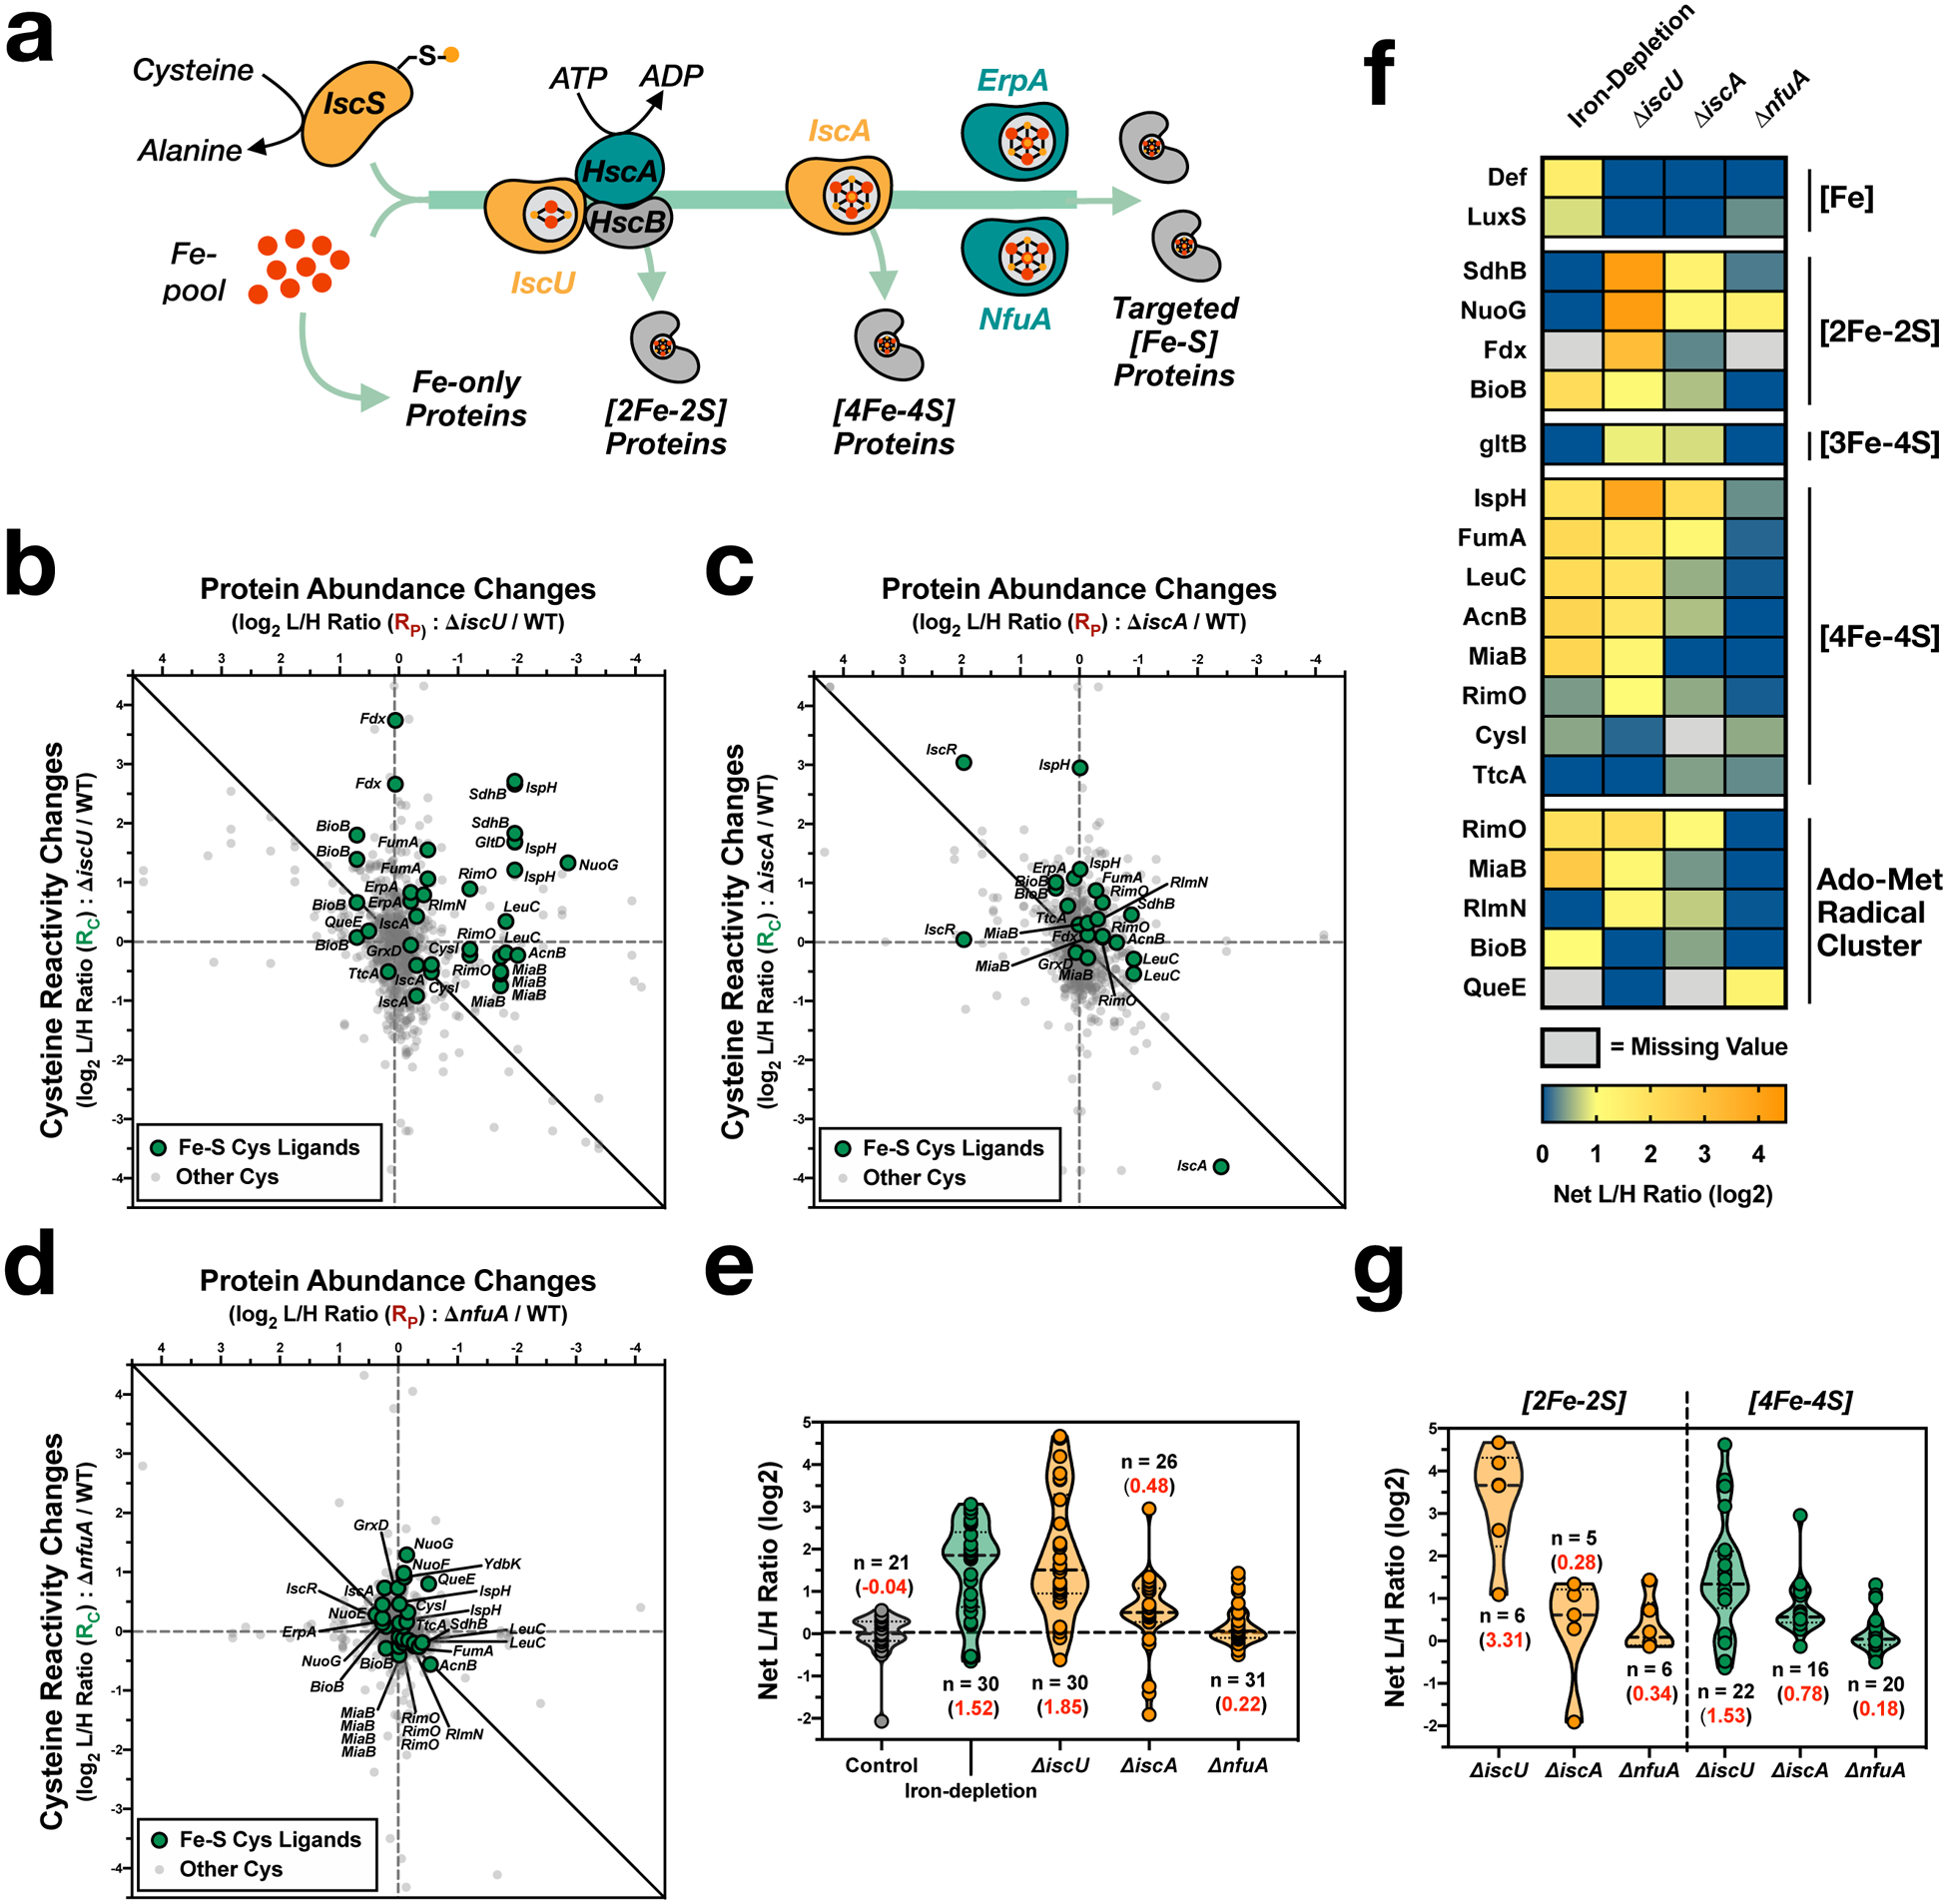
a, Simplified scheme of Isc-mediated Fe-S biogenesis. b-d, Two-dimensional proteomic datasets for the E. coli strains (annotated Fe-S cysteine ligands - green circles, non-annotated cysteine residues - light gray small circles): (b), ΔiscU (see Supplementary Dataset 4); (c), ΔiscA (see Supplementary Dataset 5); and (d), ΔnfuA (see Supplementary Dataset 6). e, Violin plot of net changes in cysteine reactivity for all Fe-S ligands from control (gray), iron-depletion (green), and Isc deletion strains (orange). Number of values (n) and average corrected L/H ratio (red) are indicated for each group. f, Heat map of Fe-S clusters (and iron-binding sites) across all experimental growth conditions and cell strains. Each cell represents the average net change in cysteine reactivity from all quantified cysteines for a given Fe-S cluster. g, Violin plot of net changes in cysteine reactivity for all [2Fe-2S] (orange) and [4Fe-4S] (green) cluster cysteine ligands from the ΔiscU, ΔiscA. and ΔnfuA datasets. Number of values (n) and average corrected L/H ratio (red) are indicated for each group.
We first analyzed the scaffold and carrier proteins in the pathway, by comparing wild-type E. coli (K12) cells to ΔiscU (Fig. 3b and Supplementary Dataset 4), ΔiscA (Fig. 3c and Supplementary Dataset 5), and ΔnfuA (Fig. 3d and Supplementary Dataset 6) deletion strains. First, comparison of the iron-depletion dataset to the isc-deletion datasets (Fig. 3e,f) allowed for exploring how external (iron-depletion) and internal (isc-deletion) disruptions differentially affect the Fe-S proteome. Notably, reactivity changes for cysteines from the two non-heme iron-only proteins, peptide deformylase (Def) and S-ribosylhomocysteine lyase (LuxS),33,34 were observed only under iron-depletion. This is expected as the Isc pathway is not implicated in iron delivery to these non Fe-S proteins (Fig. 3a). Second, comparing the ΔiscU, ΔiscA, and ΔnfuA datasets to each other indicates that the ΔiscU strain has the strongest effect on the Fe-S proteome, with the ΔiscA and ΔnfuA strains displaying modest to minimal changes, respectively (Fig. 3e,f), consistent with the positioning of these proteins in early and later stages of the biogenesis pathway. Lastly, [2Fe-2S] clusters displayed the greatest perturbation in the ΔiscU strain, with minimal changes in ΔiscA and ΔnfuA strains (Fig. 3g). Given the organization of the pathway, where [2Fe-2S] clusters are transferred to client proteins by IscU, whereas IscA and NfuA transfer [4Fe-4S] clusters (Fig. 3a), it is to be expected that [2Fe-2S] cluster-containing client proteins are directly dependent on the presence of IscU, but not IscA or NfuA.
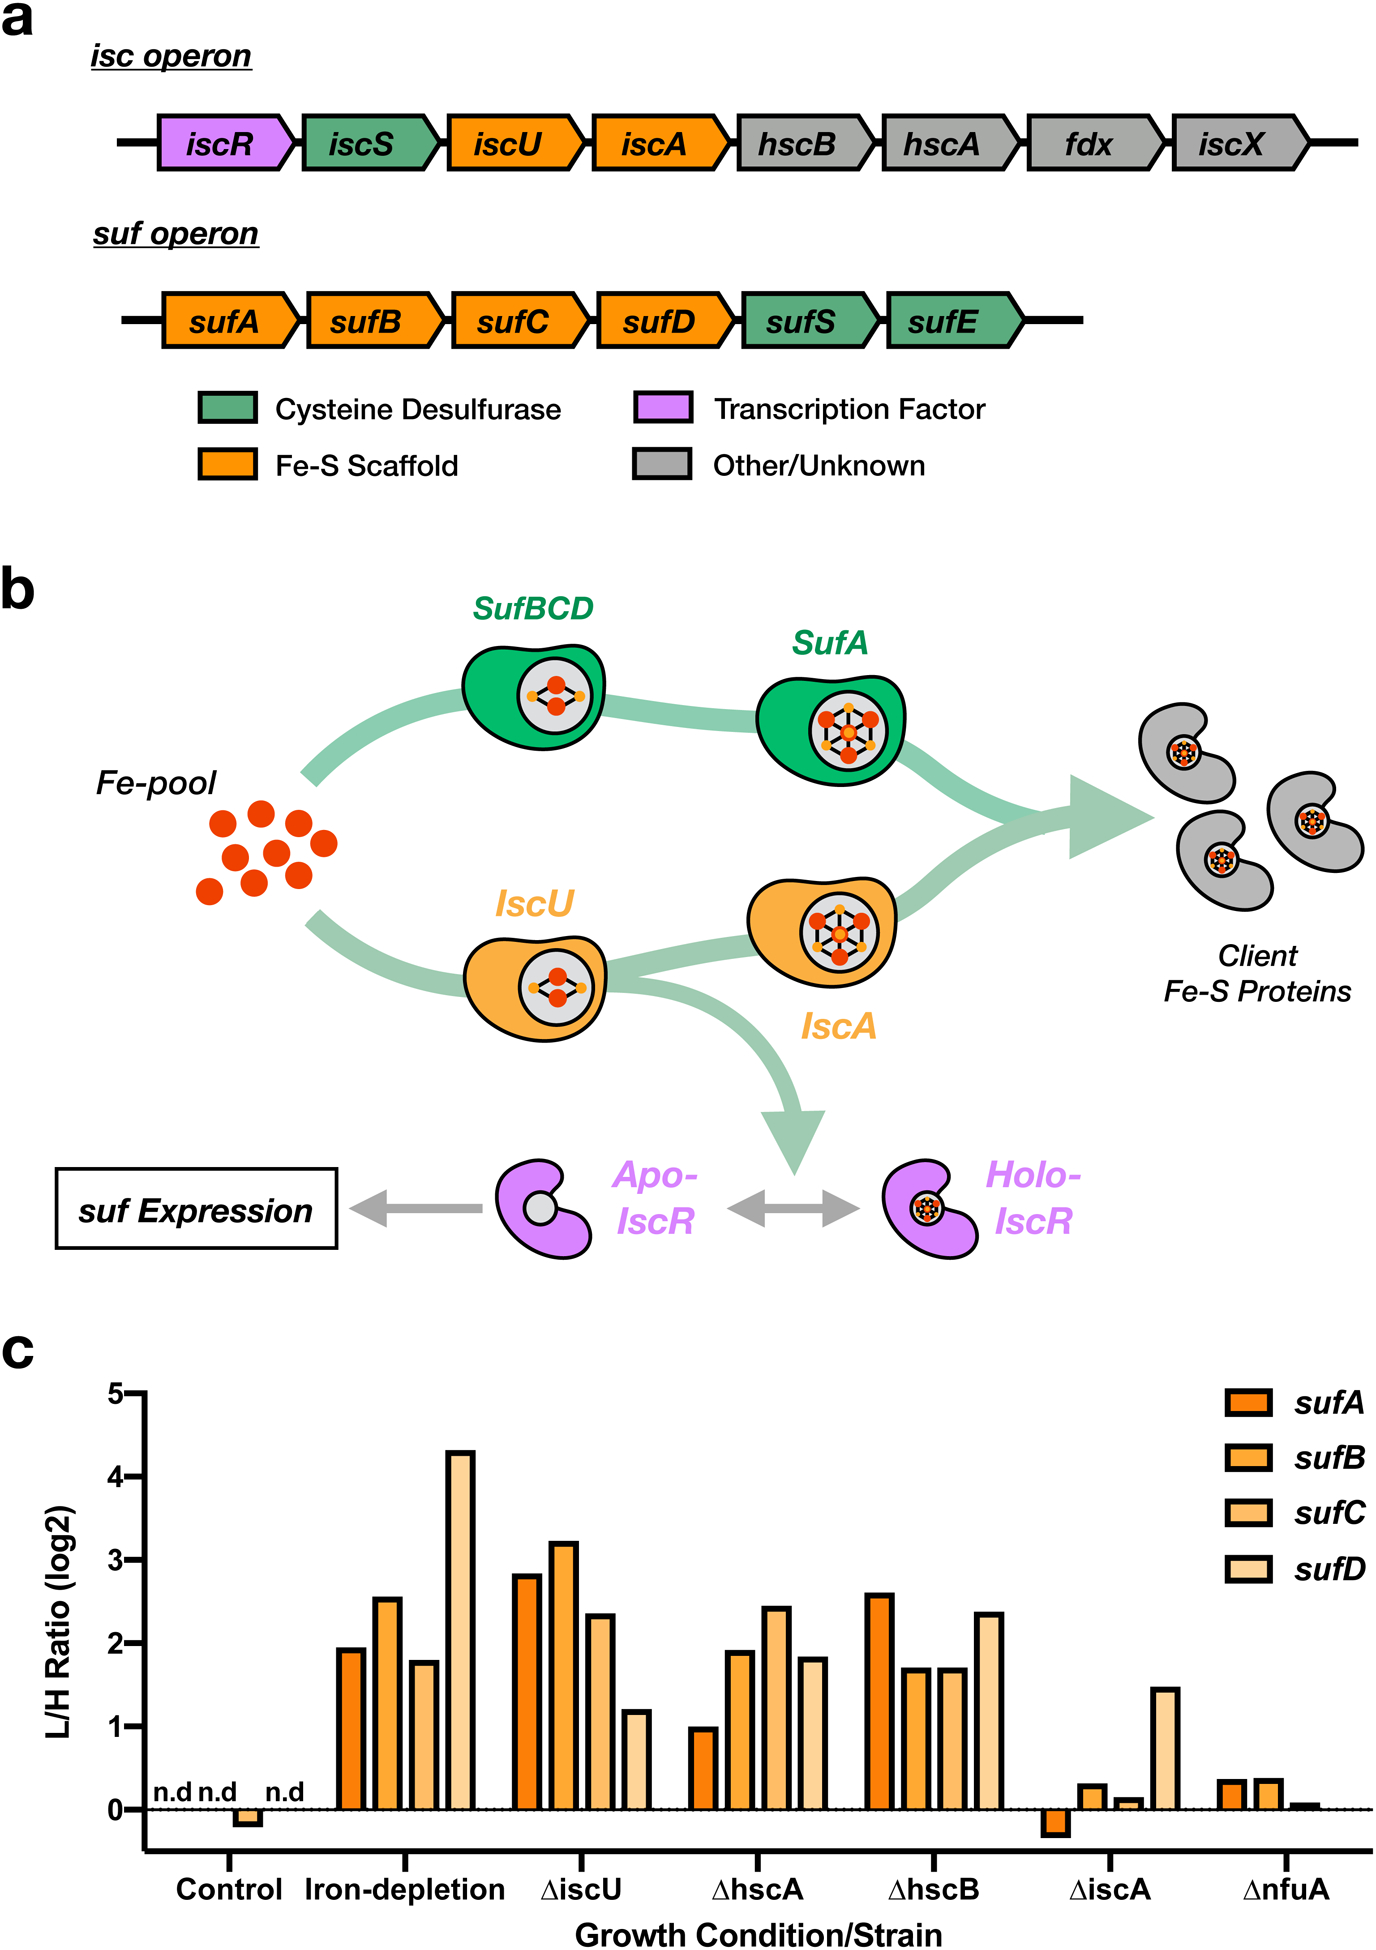
There are two Fe-S biogenesis pathways in E. coli; the Isc pathway, and the stress-inducible Suf pathway.14 Both Isc and Suf proteins are expressed from their respective operons, with the suf operon induced by the Fe-S sensing transcription factor IscR35 (Extended Data Fig. 5a,b). Perturbations that generate apo-IscR activate the Suf system. Using the data from our ReDiMe analysis, we can determine the relative expression of the Isc (IscR, S, U and A) and the Suf (SufA, B, C, D, and S) pathways under the four conditions analyzed (iron-depletion, ΔiscU, ΔiscA, ΔnfuA). Under conditions of iron-depletion and ΔiscU, significant Suf induction is observed (Extended Data Fig. 5c). In contrast, lower levels of Suf induction are observed in the ΔiscA and ΔnfuA strains, likely because IscU is present to form the [2Fe-2S] cluster on IscR and suppresses Suf activation (Extended Data Fig. 5b). Given the essentiality of IscU, the ΔiscU strain can be considered to be defective in the Isc pathway, and only able to load Fe-S clients through the Suf pathway. A number of Fe-S clusters (CysI, QueE, TtcA and BioB) are minimally disrupted by loss of the Isc pathway (Fig. 3b,f), suggesting that these clusters are likely targets of the Suf pathway.
Similarly, to assign client proteins for different components within the Isc pathway, we directly compared the datasets for the ΔiscA and ΔnfuA strains (Fig. 3c,d), where the Suf pathway is not activated. Few perturbations to the Fe-S proteome were identified in the ΔiscA strain (Fig. 3c,f), indicative of the potential to circumvent IscA and utilize other carrier proteins, such as NfuA or ErpA. Notably, significant disruption of the Fe-S cluster in IspH was observed (Fig. 3c,f), suggesting that IspH is a privileged client for IscA over other scaffold/carrier proteins. The ΔnfuA strain showed minimal perturbations in Fe-S cluster formation (Fig. 3d,f), with some perturbations to NuoG, NuoF, QueE and YdbK (Fig. 3d,f). Of these, NuoG and NuoF are subunits of the respiratory NADH dehydrogenase complex, and decreased NADH dehydrogenase activity was previously reported in the ΔnfuA strain,36 supporting our observation that NuoG and NuoF are likely privileged clients of NfuA.
Next, we focused our attention on the HscA and HscB chaperone/co-chaperone system and its role in regulating the IscU-mediated transfer of Fe-S clusters to client proteins.37, 38 HscA and HscB are members of the DnaK and DnaJ chaperone and co-chaperone families, respectively. HscA displays ATPase activity that is accelerated in the presence of the co-chaperone HscB.39,40 In vitro studies showed that Fe-S cluster transfer to apo-ferredoxin (Fdx) from [2Fe-2S]-loaded IscU is accelerated ~10-fold in the presence of HscA, HscB and ATP.41 Removal of either HscA, HscB, or ATP results in a complete loss in the observed acceleration. Interestingly, HscB alone inhibits cluster assembly on IscU, and this effect is ameliorated in the presence of high levels of apo-Fdx.42 Therefore, independent of HscA, HscB can regulate IscU-mediated Fe-S transfer depending on apo-protein abundance. Given the multifaceted roles of HscA and HscB in Fe-S cluster transfer, we sought to further investigate the effects of HscA and HscB deletion on the E. coli Fe-S proteome.
Analysis of the ΔhscA (Fig. 4a and Supplementary Dataset 7) and ΔhscB (Fig. 4b and Supplementary Dataset 8) deletion strains quantified 46 and 48 Fe-S cysteines, respectively. Interestingly, the ΔhscA strain displayed widespread disruptions to Fe-S biogenesis similar to the ΔiscU strain (Fig. 4c,d), suggesting that HscA is a required component of the Fe-S biogenesis machinery in vivo. In contrast, the ΔhscB strain (Fig. 4c,d) displayed only minor disruptions to the Fe-S proteome. Importantly, the suf operon is equally upregulated in both the ΔhscA and ΔhscB strains (Extended Data Fig. 5c) (to a similar extent as the ΔiscU strain), ruling out potential disparate contributions from the Suf pathway. We focused on quantified [2Fe-2S] clusters, which are transferred directly from IscU to target proteins with the aid of the HscA/HscB chaperone system (Fig. 4e). Delivery of the majority of [2Fe-2S] clusters are dependent on the presence of HscA. Interestingly, the [2Fe-2S] clusters for SdhB and NuoG are dependent on HscB, which is in agreement with studies of the human HscB homolog, Hsc20, which is shown to mediate cluster transfer to Complex I, II, and III, through conserved LYR sequence motifs.43,44 In contrast, the [2Fe-2S] clusters of Fdx and GrxD display increased occupancy in the ΔhscB strain, suggesting that HscB inhibits cluster delivery to these proteins. This is in agreement with decreased cluster formation observed on apo-Fdx in the presence of HscB in vitro.41,42 Together, our proteomic data supports a model where HscA facilitates cluster transfer from IscU to a broad array of apo-proteins. In contrast, HscB prioritizes the transfer of cluster to specific Fe-S protein targets that include electron-transport chain components.
Figure 4 |. Interrogating the role of the chaperone/cochaperone proteins, HscA and HscB, within the Isc Fe-S biogenesis pathway.
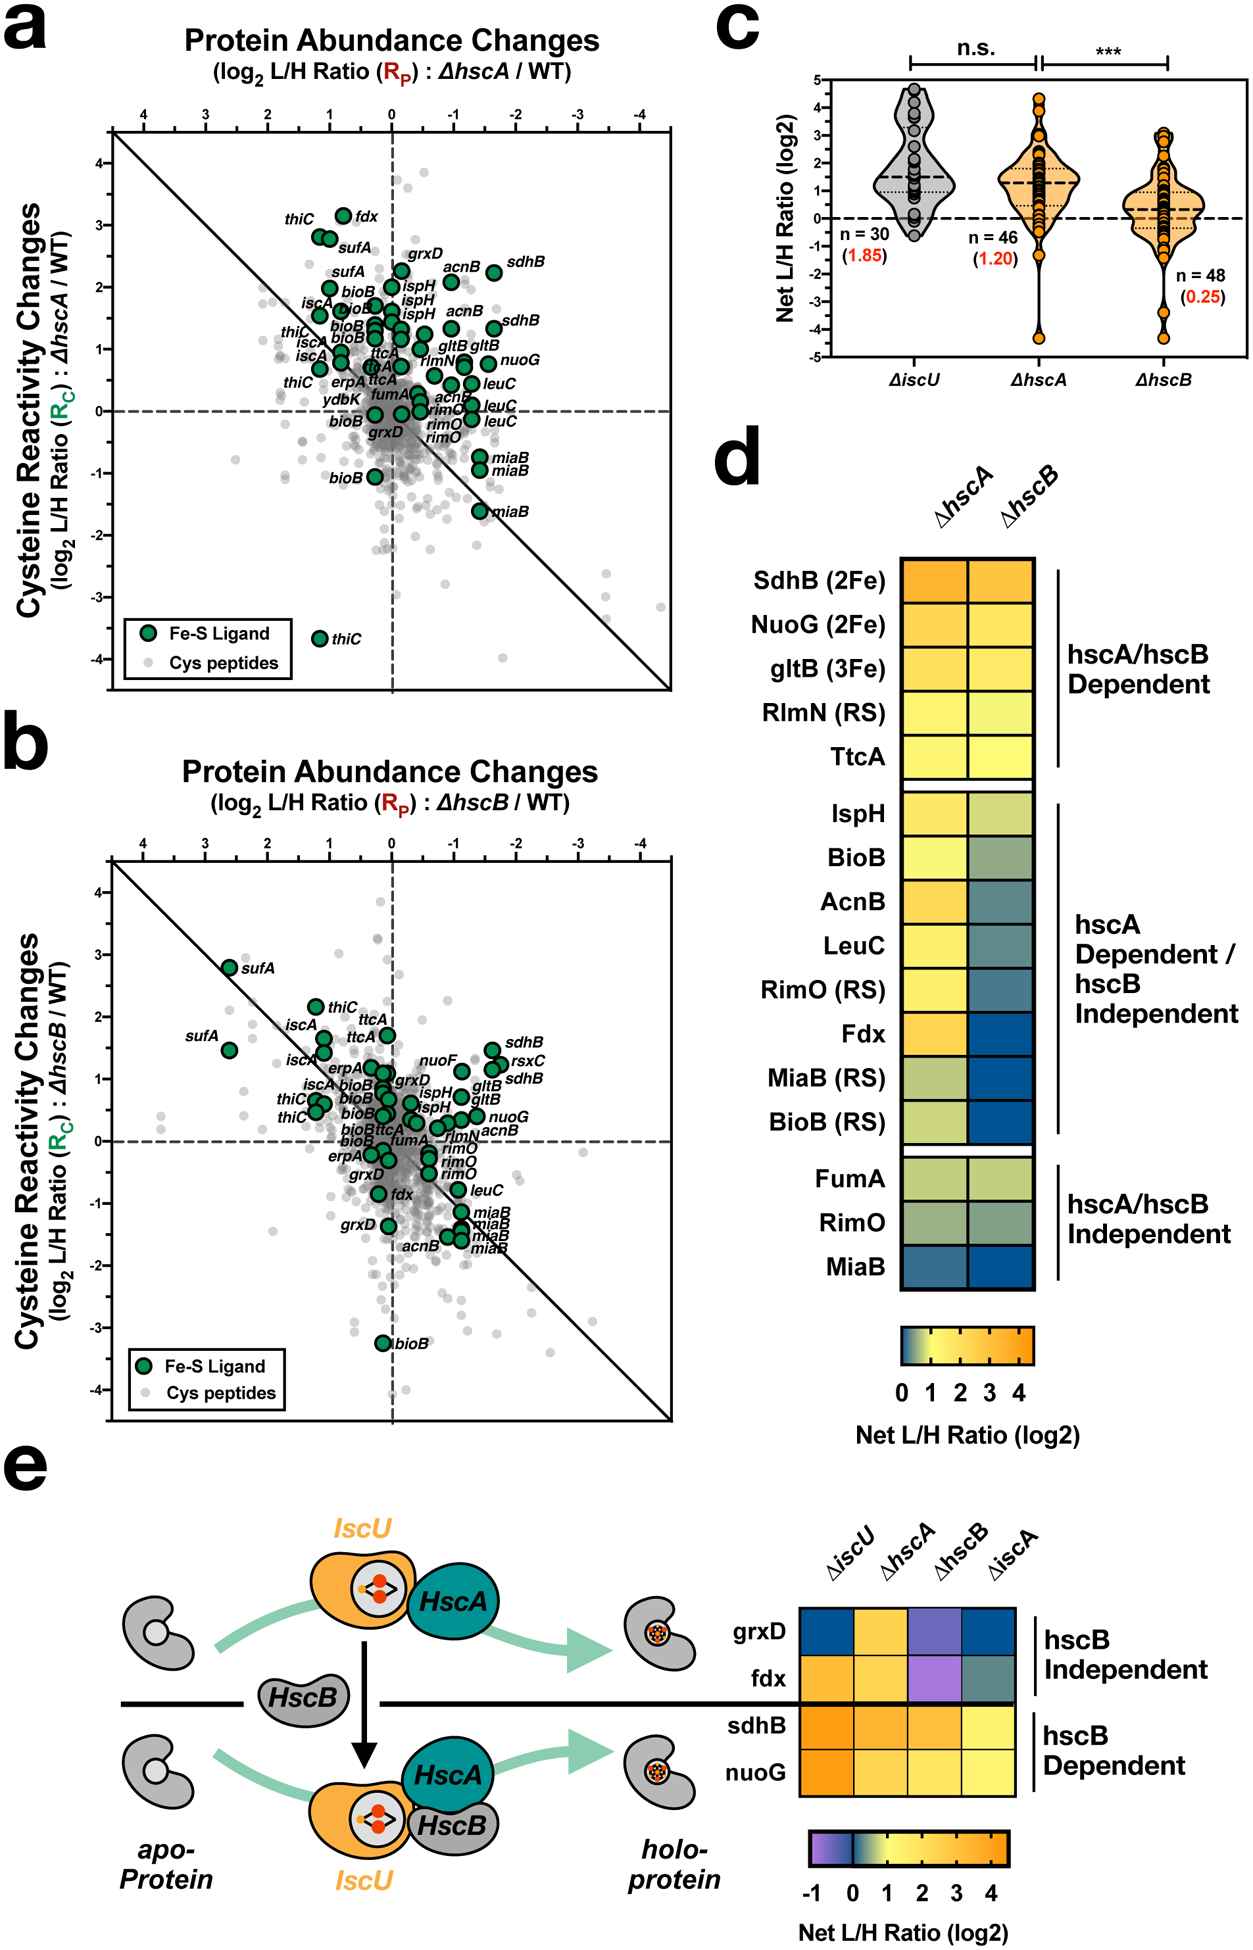
a,b Two-dimensional proteomic datasets for the E. coli strains (annotated Fe-S cysteine ligands - green circles, non-annotated cysteine residues - light gray small circles): (a), ΔhscA (see Supplementary Dataset 7) and (b), ΔhscB (see Supplementary Dataset 8). c, Violin plot of net changes in cysteine reactivity (R) for all Fe-S ligands from ΔiscU (gray) and the chaperone/co-chaperone ΔhscA and ΔhscB (orange) datasets. The median R value is displayed as a dashed line in the violin plot, while the average R values (red) and number of unique values (black) are indicated for each group. Significance is calculated as *** p < 0.005 (p = 0.0031), paired t-test (two-tailed), with n indicated in the figure. d, Heat map of Fe-S clusters for the chaperone/co-chaperone ΔhscA and ΔhscB strains. Each cell represents the average net change in cysteine reactivity from all quantified cysteines for a given Fe-S cluster. e, Cartoon and heatmap of HscA/HscB-dependent [2Fe-2S] cluster delivery. Each cell represents the average net change in cysteine reactivity from all quantified cysteines for a given Fe-S cluster.
Mapping E. coli Fe-S ligand coverage and reactivity.
To determine the overall coverage of the E. coli Fe-S proteome, we combined the data from our seven analyses (control, iron-depletion, ΔiscU, ΔiscA, ΔhscA, ΔhscB, and ΔnfuA). In total, 101 of the 144 Fe-S proteins were identified in either the isoTOP-ABPP or the ReDiMe analyses (Fig. 5 and Extended Data Fig. 1). Fe-S clusters and proteins from all 6 functional categories (ferredoxin-like, AdoMet radical, dehydratase, DNA-binding, Fe-S scaffold/carrier, and miscellaneous) were observed, with varying coverage across the 7 datasets (Supplementary Fig. 1). In general, ferredoxin-like clusters were less represented relative to other functional categories (Supplementary Fig. 2a). Of the ferredoxin-like clusters identified, strong coverage is observed for Fe-S proteins in the aerobic respiratory pathway45 (Supplementary Fig. 2b), in contrast to the Fe-S proteins from alternative respiratory pathways, such as those involved in hydrogen and formate metabolism46 (Supplementary Fig. 2c).
Fig. 5 |.
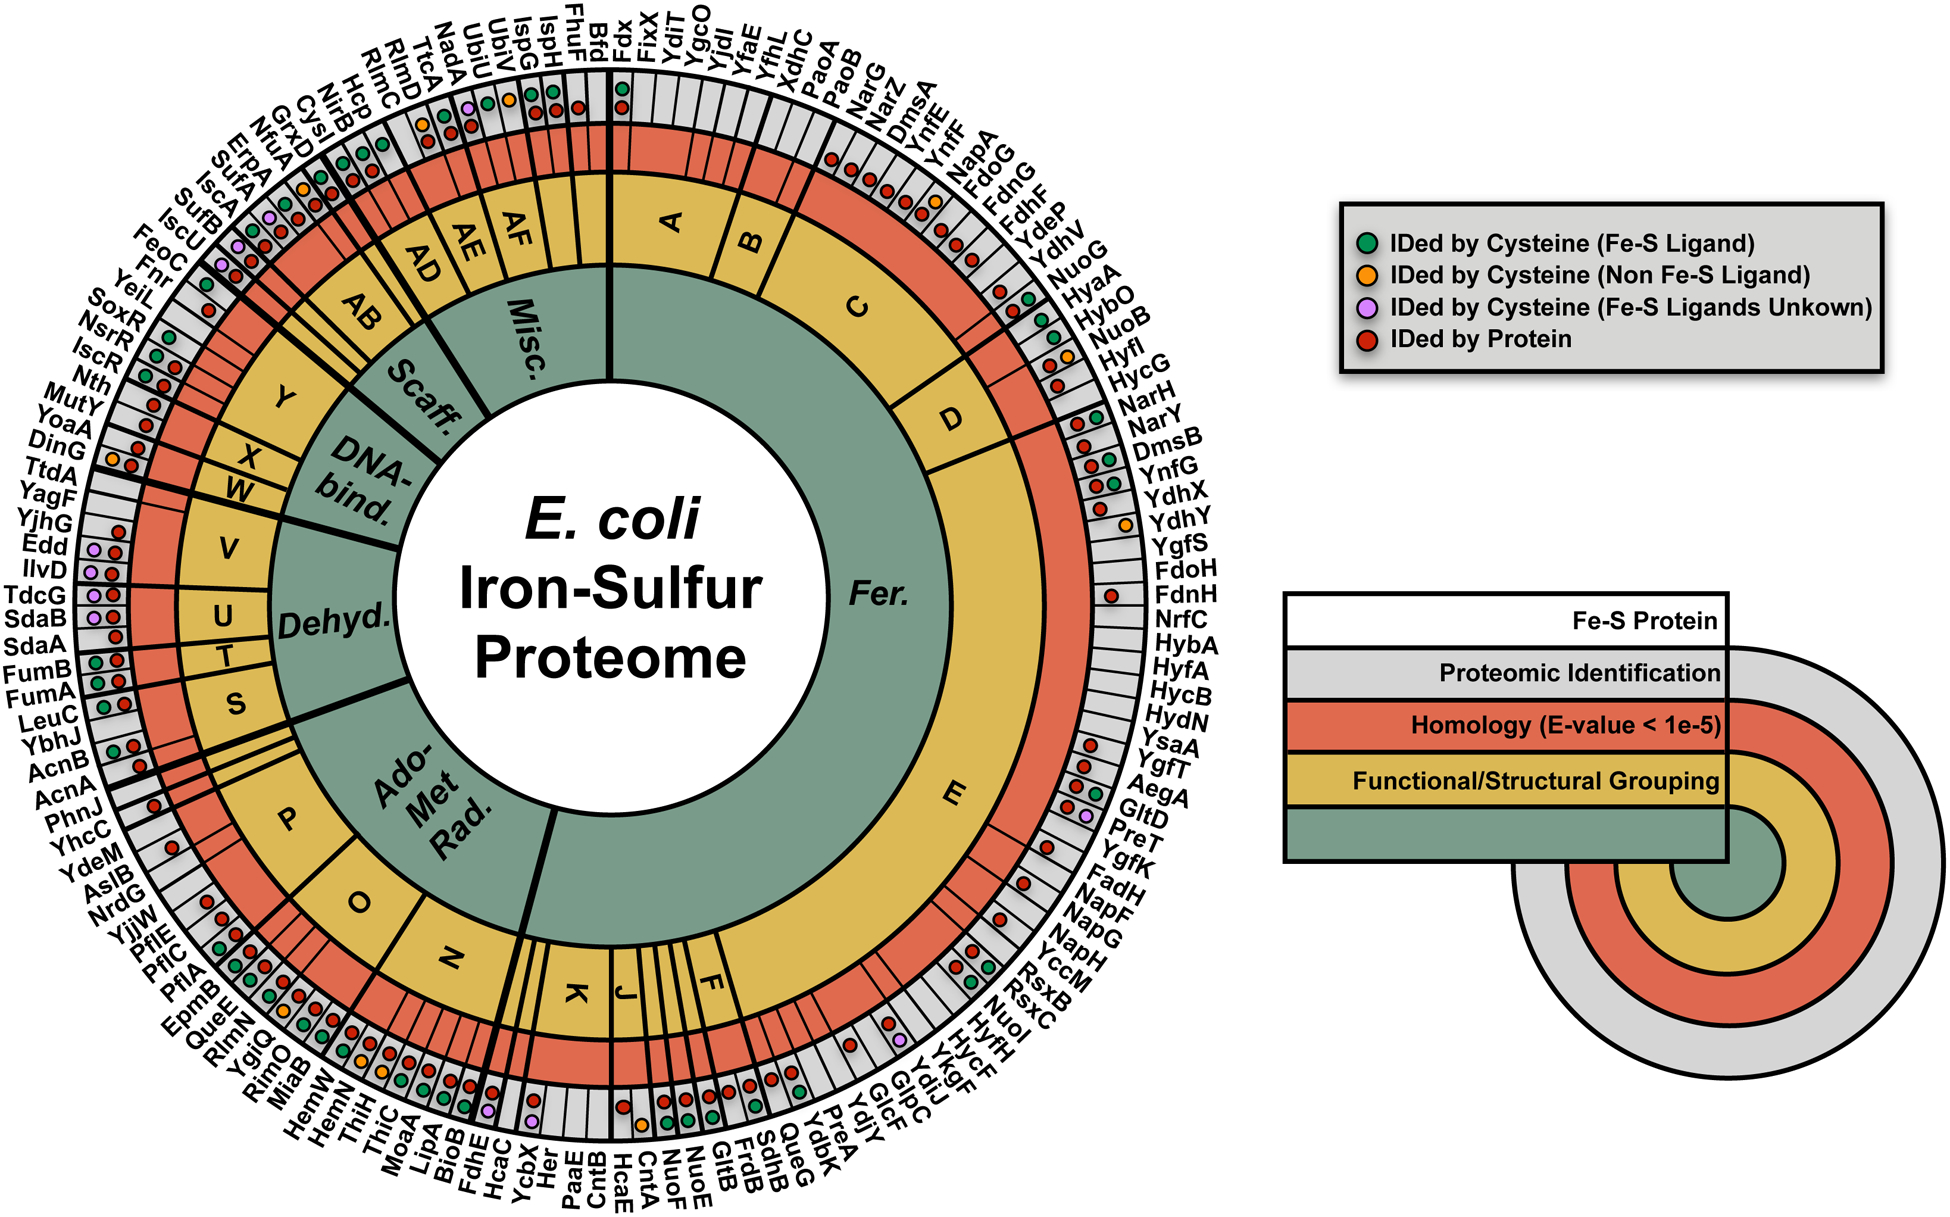
Mapping coverage of the E. coli Fe-S proteome. Wheel diagram of the 144-member annotated E. coli Fe-S Proteome, which can be divided into 6 functional categories of Fe-S proteins : (1) ferredoxin-like cluster containing (Fer.) proteins (cluster involved in electron transfer – fully coordinated); (2) AdoMet radical (Ado-Met Rad.) enzymes (cluster involved in radical generation – open coordination site occupied by S-adenosylmethionine); (3) dehydratase (Deh.) proteins (cluster involved in non-redox catalysis – open coordination site for substrate binding); (4) DNA-binding (DNA bind.) proteins (cluster involved in transcriptional regulation, long range electron transfer or redox sensing); (5) Fe-S scaffold/carrier (Scaff.) proteins (cluster is formed and transferred to client Fe-S proteins); and, (6) miscellaneous (Misc.) Fe-S proteins. Highlighted in the wheel diagram are the 6 E. coli Fe-S functional families (inner first ring – green), smaller sub-functional and structural groups (second ring – yellow), and homology-related (E-value < 1E-5) clusters (third ring – orange). Protein identification by the 2-dimensional proteomic platform is indicated (fourth outer ring – gray) for protein abundance (red circles) and cysteine reactivity (annotated Fe-S cysteine ligands - green circles, non-Fe-S ligating cysteine residues – orange circles, cysteine residues, where Fe-S ligands are unknown for the protein – purple circle).
To characterize the inherent reactivity of Fe-S ligating cysteines relative to other functional cysteines in the proteome, a concentration-dependent isoTOP-ABPP analysis was performed in iron-depleted E. coli lysates. Treatment with either low (10 μM) or high (100 μM) concentrations of IA-alkyne enables identification of highly reactive cysteines that saturate labeling at low concentrations (L/H ratios ~1) (Extended Data Fig. 6a).23 This analysis revealed that Fe-S cysteines displayed high reactivity relative to other cysteines in the proteome (L/H ratios < 5) (Extended Data Fig. 6b and Supplementary Dataset 9). Fe-S cysteines were more reactive than zinc-binding and disulfide-linked cysteines, and were only minimally less reactive than active-site cysteine nucleophiles (Extended Data Fig. 6c). Across Fe-S cysteines, cysteine ligands on client proteins were more reactive than those in scaffold/carrier proteins (Extended Data Fig. 6d), likely reflecting on the stable versus transient chelation to the cluster that is characteristic of client and scaffold/carrier proteins, respectively.
Identification of unannotated bacterial Fe-S proteins.
Many Fe-S proteins have poorly conserved primary sequence motifs, rendering it a challenge to de novo identify Fe-S proteins. The unbiased nature of our chemoproteomic platform allows us to monitor changes to cysteine reactivity on proteins that are not predicted to contain Fe-S clusters. To arrive at a list of putative uncharacterized Fe-S proteins, we performed extensive filtering of our data. First, we identified 322 cysteines that displayed a greater than 3-fold net increase in reactivity in at least one of the six conditions studied (iron-depletion, ΔiscU, ΔiscA, ΔhscA, ΔhscB, ΔnfuA). Upon removing known Fe-S proteins, and filtering for proteins that contain at least three cysteine residues, a requirement for most Fe-S cluster ligation, a list of 100 cysteines on 81 proteins was obtained (Supplementary Fig. 3). Lastly, we generated a high-confidence list of 41 cysteines on 33 proteins by requiring a net increase in reactivity in at least two of the six datasets acquired (Fig. 6a).
Fig. 6 |. Predicting novel Fe-S binding sites from changes in cysteine reactivity.
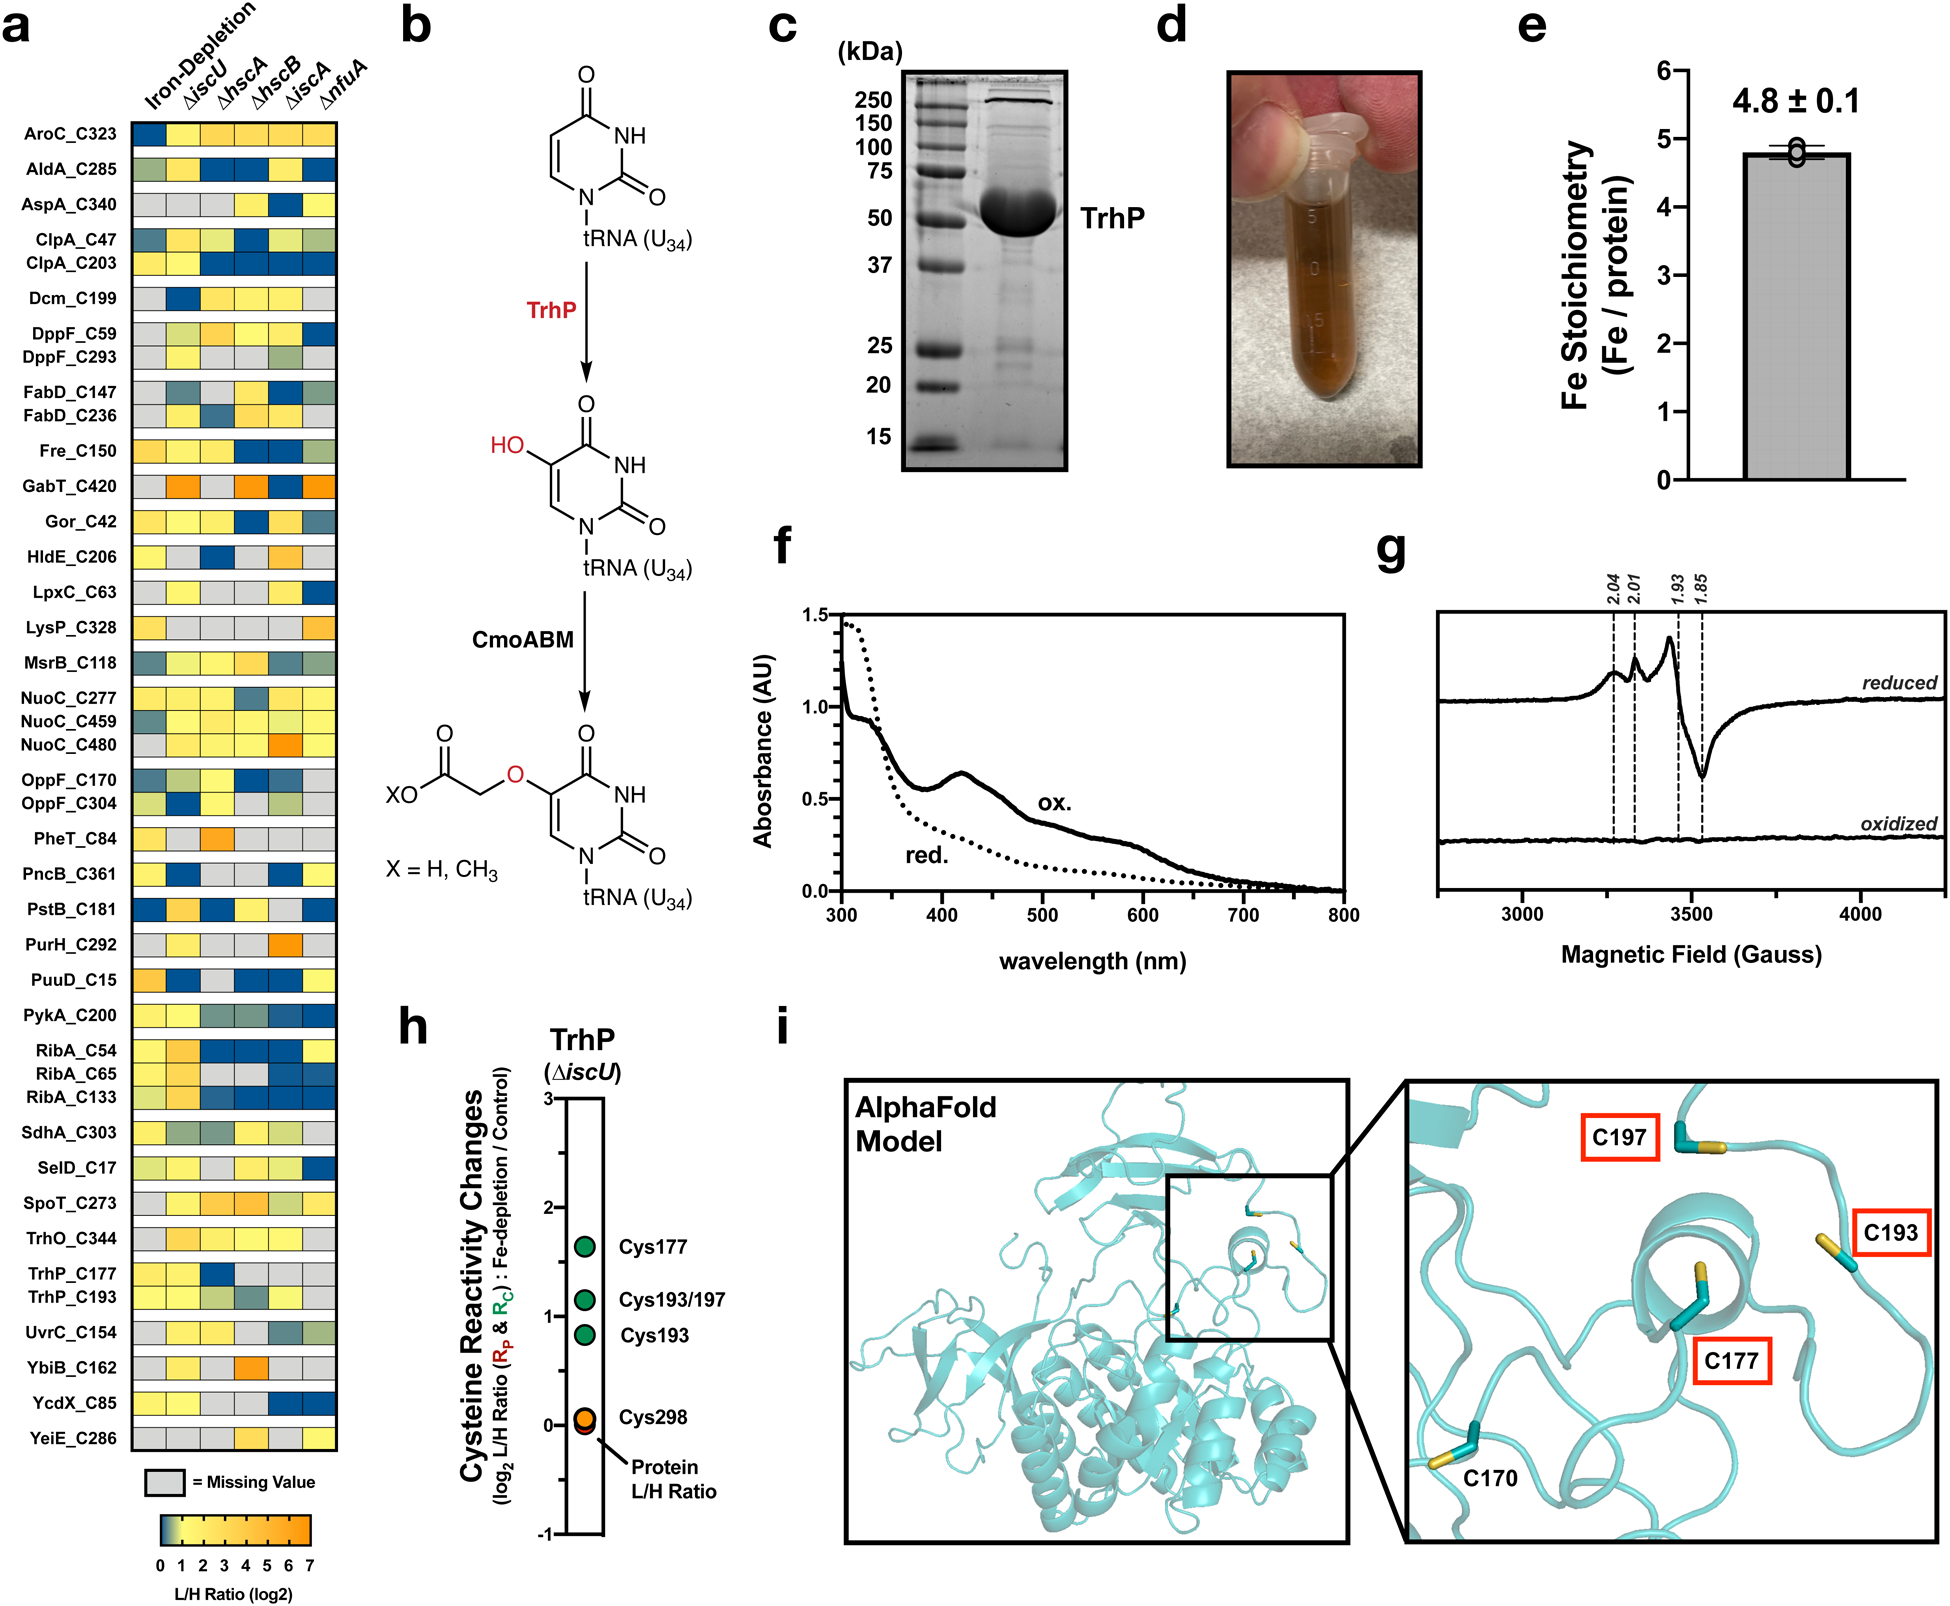
a, Heat map of putative Fe-S ligands across all experimental growth conditions and cell strains. Only cysteine residues with a L/H ratio > 2 in two of the experimental conditions were included (derived from the larger selection in Supplementary Fig. 3). b, Scheme of the pathway for mcmo5U biosynthesis in E. coli. Hydroxylation of U34 by TrhP generates a precursor for the final mcmo5 modification. c, Representative SDS-PAGE analysis of purified E. coli TrhP (experiment independently repeated twice). d, Visible color of purified E. coli TrhP. e, ICP-OES analysis of the iron content of purified E. coli TrhP from n=3 experimental replicates. Error bars represent the standard error of the mean. f, Optical spectra of oxidized as-purified (ox – solid line) and dithionite reduced (red – dotted line) TrhP. g, Low temperature (10K) EPR spectra of dithionite reduced and oxidized (as isolated) TrhP measured at 9.37 GHz. h, Rc values for quantified cysteine ligands on TrhP (putative Fe-S ligands – green, predicted non-ligands – orange, protein abundance change – red). i, AlphaFold structural model of TrhP (AF-P76403-F1). Three cysteine residues that display net increases in cysteine reactivity are highlighted in red boxes.
UV-visible absorption (optical) spectroscopy, EPR spectroscopy, and ICP-OES analysis of purified proteins were used to assess the presence of an Fe-S cluster on proteins from this high-confidence list. TrhP (also called YegQ) (Fig. 6a) is a recently identified tRNA hydroxylase involved in the generation of 5-hydroxyuridine (Fig. 6b).47 Recently, a close homolog of TrhP, RlhA, was shown to be similarly involved in ribosomal RNA hydroxylation. Interestingly, RNA hydroxylation levels decreased in an isc deletion strain, suggesting a dependence on the Fe-S biogenesis pathway.48 TrhP also has more distant homology to two Fe-S proteins involved in ubiquinone biosynthesis, UbiU and UbiV, but shows poor conservation of the putative cysteine ligands for the Fe-S cluster.49 The presence of an Fe-S cluster on TrhP or RlhA has yet to be confirmed. TrhP was expressed and purified from E. coli (Fig. 6c) to produce a brown solution typical of many Fe-S proteins (Fig. 6d). Bound iron was confirmed by ICP-OES, with TrhP binding approximately 4–5 irons per monomer (Fig. 6e). The presence of a redox-active Fe-S cluster was confirmed by both optical (Fig. 6f) and EPR (Fig. 6g) spectroscopy of the oxidized (as isolated) and dithionite-reduced protein species. Three of the five cysteine residues located on TrhP displayed net increases in reactivity (Cys177, 193, and 197), while a fourth ligand (Cys298) had no net change in reactivity (Fig. 6h). These three cysteine residues all map to the same 3-dimensional region of the protein in the recently released AlphaFold Model of TrhP (Fig. 6i), suggesting that TrhP likely binds a single redox active [4Fe-4S] cluster.
Two other putative Fe-S proteins from our high-confidence list were the highly homologous proteins DppF and OppF (Fig. 6a). Two additional homologs, DppD and OppD, also displayed a net increase in cysteine reactivity under ΔhscA deletion and iron-depletion, respectively (Supplementary Fig. 3). All four proteins represent nucleotide-binding subunits of the ABC transporter complexes encoded by genes in either the DppABCDF or OppABCDF operons (Extended Data Fig. 7a).50 Interestingly, DppD/F and OppD/F contain C-terminal extensions that are rich in cysteine residues (Extended Data Fig. 7b), which group together in the AlphaFold Model of DppD (Extended Data Fig. 7c). As a representative of this family of proteins, DppD was expressed and purified from E. coli (Extended Data Fig. 7d) to produce a brown protein sample (Extended Data Fig. 7e). Bound iron was confirmed by ICP-OES, with DppD binding approximately 4 irons per monomer (Extended Data Fig. 7f). The presence of an Fe-S cluster was confirmed by optical spectroscopy (Extended Data Fig. 7g). Together, the experimental confirmation of the Fe-S clusters on TrhP and DppD serve to highlight the promise of our chemoproteomic platform to identify unknown Fe-S proteins.
Discussion
A significant challenge in the field of Fe-S protein biology is the inability to monitor Fe-S cluster occupancy across multiple proteins within a native proteome. Typical methods to study Fe-S cluster binding include purification and spectroscopic analysis of individual proteins, or monitoring of radiolabeled iron incorporation by autoradiography. Here, we describe a chemoproteomic platform to systematically report on Fe-S occupancy within a proteome. This platform monitors the characteristic increase in the reactivity of Fe-S cysteine ligands upon loss of the cluster. Increases in cysteine reactivity are measured using the established isoTOP-ABPP platform, and are coupled with protein abundance changes obtained by quantitative ReDiMe analyses, to provide net changes in cysteine reactivity across the proteome. Fe-S cysteine ligands show net increases in cysteine reactivity under conditions of dysregulated Fe-S biogenesis, including iron-depletion, and genetic deletion of isc Fe-S biogenesis components. This platform provided deeper insight into Fe-S client proteins and the Fe-S biogenesis pathway including: (1) the demonstration that different types of Fe-S clusters (AdoMet radical versus auxiliary) within a single protein (e.g. BioB, RimO) can show differential occupancy under conditions of iron depletion; (2) the assignment of cysteine ligands for Fe-S proteins on which sites of cluster binding are uncharacterized (e.g. YdiJ); (3) the establishment that deletion of early components of Fe-S biogenesis (e.g. IscU) have significantly larger effects on the Fe-S proteome than deletion of late components (e.g. IscA and NfuA); (4) the delineation of client proteins dependent on the Isc and Suf Fe-S biogenesis pathways; (5) the differentiation of client Fe-S proteins between the IscA and NfuA carrier proteins; (6) demonstration of a differential role in Fe-S biogenesis for the chaperone HscA, and the co-chaperone HscB; and, (7) the identification of previously unannotated Fe-S proteins in an unbiased manner (e.g. TrhP and DppD).
In our analyses, we observed ~70% coverage of Fe-S proteins and/or cysteine ligands from E. coli. Determining net changes in cysteine reactivity require the identification of an Fe-S protein in the unenriched proteomics (ReDiMe) analysis, as well as the quantification of cysteine labeling by isoTOP-ABPP. In many cases, we observed Fe-S proteins in only one of these two analyses, likely due to the low abundance of some Fe-S proteins for ReDiMe analysis, or the lack of an ionizable IA-labeled peptide for isoTOP-ABPP analysis. The use of additional fractionation steps, isobaric tags, and more sensitive mass-spectrometry instrumentation, will serve to alleviate some of these issues and increase the coverage of the Fe-S proteome.
Other potential future applications of this platform include: (1) the characterization of client proteins served by other components of the Isc or Suf pathways; (2) the identification of unannotated Fe-S proteins under alternative growth conditions, and in other bacterial strains; (3) the evaluation of the Fe-S biogenesis pathways in mammalian cells (mitochondrial and cytosolic Fe-S pathways); and, (4) the analysis of Fe-S cluster stability under cellular stress conditions (e.g. oxidative stress). We are confident that further improvement of our platform, and expansion to other complex biological systems, will provide an enabling technology for interrogating Fe-S clusters within native proteomes, and further illuminating the intricate biology of Fe-S clusters.
Methods
E. coli strains and growth media.
E. coli mutant strains, derived from BW25113, were obtained from the Keio collection (Supplementary Table 1).51 All growths were carried out in MOPS-minimal media; standard (iron-replete) recipe - 40 mM MOPS and 4 mM tricine (adjusted to pH 7.4 with KOH), 0.1 M NaCl, 10 mM NH4Cl, 1.32 mM KH2PO4, 0.523 mM MgCl2, 0.276 mM Na2SO4, 0.1 mM FeSO4, trace micronutrients, and 0.1% glucose.52 Iron-depleted MOPS-minimal media was prepared without supplemental FeSO4. The E. coli BL21(DE3) strain was used for all protein over-expression experiments. All Glassware used for culturing E. coli was acid washed to remove any residual metals.
E. coli Fe-S protein cloning and expression.
The full-length gene sequences for the E. coli Fe-S proteins AcnA, TrhP, and DppD were PCR amplified from E. coli K-12 genomic DNA with the appropriate primers (Supplementary Table 2). and cloned by Gibson assembly53 into the digested pET-16b vector (XhoI and NdeI). The resulting plasmids were verified by DNA sequencing and transformed into BL21(DE3) cells. For AcnA, transformed cells were cultured (37 °C) in either iron-replete and iron-depleted MOPS-minimal media, supplemented with ampicillin (50 mg l−1). Once an optical density at 600 nm (OD600) of ~0.6 was reached, protein production was induced (37 °C, 3 hr) by the addition of 0.4 mM IPTG. For TrhP and DppD, BL21 (DE3) cells were co-transformed with the pDB1281 plasmid as previously described.54 Transformed cells were cultured (37 °C) in 2xYT media, supplemented with FeSO4−2 (1 g l−1), ampicillin (50 mg l−1), and kanamycin (50 mg l−1). At an OD600 of ~0.2, induction of the pDB1281 plasmid was initiated by the addition of 0.1% L-Arabinose. Once an OD600 of ~0.6 was reached, protein production was induced (25 °C, 16hr) by the addition of 0.1 mM IPTG. For all three Fe-S proteins, cells were pelleted from 500 mL cultures by centrifugation (5,000 g, 10 min, 4 °C).
Purification and characterization of recombinant AcnA.
Cell pellets were resuspended in 5 mL lysis buffer (5 mM imidazole in PBS), and lysed by sonication (3 ×10 pulses – 90%) on ice. Cell lysates were centrifuged (10,000 g, 10 min, 4 °C) and the resulting supernatant was loaded onto 1 mL of Ni-NTA that had been equilibrated with lysis buffer. The Ni-NTA was washed with 5-bed volumes of wash buffer (25 mM imidazole in PBS). Recombinant AcnA was eluted from the Ni-NTA column with 2-bed volumes of elution buffer (250 mM imidazole in PBS). The protein was desalted over a pre-packed PD-10 column equilibrated with PBS buffer and concentrated using an Amicon-Ultra 10 kDa centrifugal filter. Protein concentration was determined by Bradford assay, and the presence or absence of an Fe-S cluster was confirmed by UV-visible absorption spectroscopy on a ThermoScientific Nanodrop 2000c spectrophotometer.
IA-alkyne labeling for fluorescent gel analysis of AcnA.
Fifty micrograms of Recombinant AcnA (1 mg/ml), purified from growth in iron-replete or iron-depleted MOPS-minimal media, was incubated with 100 μM IA-alkyne (10 mM stock in DMSO) for 1 hr at 25 °C. Click chemistry was performed with 25 μM rhodamine-azide (1.25 mM stock in DMSO), 1 mM TCEP, 100 μM TBTA ligand (17x stock in DMSO:t-butanol 1:4) and 1 mM CuSO4 (50x stock in water). The reaction was quenched after 1 hr at 25 °C by the addition of 50 μL of 2x SDS-PAGE loading buffer. Samples were separated by SDS-PAGE, visualized for IA-alkyne labeling by fluorescence on a BioRad ChemiDoc MP Gel Imager, stained with Coomassie-blue, and imaged again for protein abundance.
E. coli cell pellet preparation for ICP-OES.
Overnight cultures of E. coli K-12 strain, BW25113, grown in 5 mL of iron-replete MOPS-minimal media, were used to inoculate 100 mL cultures of either iron-replete or iron-deplete MOPS-minimal media at a 1:100 dilution and grown at 37 °C to an OD600 of ~0.6. Cells were pelleted by centrifugation (5,000 g, 10 min, 4 °C), washed twice with 500 μL of 1 mM EDTA in PBS and twice more with 500 μL of EDTA-free PBS. Cell pellets were dried down overnight on a speed-vac, before the dry pellet weight was determined. Dried cell pellets were dissolved overnight in 150 μL of TraceMetal Grade Nitric Acid, then heated for 1 hr at 80 °C. The sample was then diluted to 5% nitric acid with Milli-Q double distilled water. Iron and zinc content was measured on an Agilent 5100 ICP-OES. Samples were prepared in triplicate and the relative iron and zinc concentration of each cell pellet sample was calculated from a calibration curve of external standards (iron – 0 to 56 mg l−1, zinc – 0 to 65 mg ml−1) according to peak height.
E. coli lysate preparation for two-dimensional chemoproteomics.
Overnight cultures of E. coli K-12 strains, grown in 5 mL of iron-replete MOPS-minimal media, were used to inoculate 100 mL cultures of the appropriate iron-replete or iron-deplete MOPS-minimal media at a 1:100 dilution and grown at 37 °C to an OD600 of ~0.6. Cells were pelleted by centrifugation (5,000 g, 10 min, 4 °C) and washed once with 5 mL of PBS. Cell pellets were then resuspended in 500 μL of PBS, lysed by sonication and centrifuged (10,000 g, 10 min, 4 °C) to generate clarified lysates. For anaerobic labeling experiments, washed cell pellets were lysed and clarified as described above using degassed oxygen-free PBS buffer under nitrogen atmosphere in an anaerobic glove box. For labeling experiments under reducing conditions, washed cell pellets were lysed and clarified as described above using PBS buffer containing 1 mM TCEP under standard atmosphere. Protein concentration was determined by Bradford assay and lysates were diluted to a concentration of 2 mg/mL with the appropriate PBS buffer.
Whole-proteome sample preparation for ReDiMe analysis.
For quantification of protein abundance changes upon iron-depletion or in strains harboring isc deletions (Supplementary Datasets 2–8), 100 μg of control (iron-replete E. coli (K-12)) and Fe-S deficient (iron-depleted E. coli (K-12), ΔiscU, ΔiscA, ΔnfuA, ΔhscA, or ΔhscB) proteome (100 μL, 1 mg/mL) were precipitated by the addition of 5 μL 100% trichloroacetic acid in PBS, vortexed and frozen (-80 °C, overnight). After thawing, proteins were pelleted by centrifugation (15,000 g, 10 min, 4 °C) and the solvent was removed. Protein pellets were resuspended in 500 μL of ice-cold acetone by bath sonication and pelleted by centrifugation (5000 g, 10 min, 4 °C). The solvent was removed and the pellet was allowed to air dry before being resuspended in 8 M Urea in 100 mM TEAB (30 μL). Reductive alkylation was performed by the sequential addition of 100 mM TEAB (70 μL), 1.5 μL of 1 M DTT (65 °C, 15 min), and 2.5 μL of 400 mM iodoacetamide (25 °C, 30 min). Reactions were diluted with additional 100 mM TEAB (120 μL) and tryptic digestion performed by the addition of 2 μg of sequencing-grade trypsin (4 μL of 20 μg diluted in H2O) and 2.5 μL of 100 mM CaCl2 (37 °C, overnight). After tryptic digest, reductive dimethylation30 was performed by the addition of 4 μL of 20% light (Fe-S deficient) or heavy (control) formaldehyde and 20 μL of 0.6 M sodium cyanoborohydride (25 °C, 2 hours). The reaction was quenched by the addition of 8μL ammonium hydroxide (25 °C, 15 min). The light (Fe-S deficient) and heavy (control) tryptic peptide samples were then combined, desalted on a Sep-Pak, and dried by speed-vac and stored at -20 °C.
Off-line high-pH ReDiMe peptide fractionation.
Samples were resuspended in 500 μL of high pH buffer A (95% H2O, 5% acetonitrile, 10 mM ammonium bicarbonate) and loaded onto a manual injection loop connected to an Agilent 1100 Series HPLC. Peptides were separated on a 25 cm Agilent Extend-C18 column using a 60 min gradient from 20–35% high pH buffer B (10% H2O, 90% acetonitrile, 10 mM ammonium bicarbonate).55 Fractions were collected using a Gilson FC203B fraction collector into a 96 deep-well plate (0.6 min/well). Subsequent concatenation of every sixth well resulted in six pooled fractions that were dried by speed-vac and then resuspended in 30 μL of low pH buffer A (95% H2O, 5% acetonitrile, 0.1% formic acid).
LC-MS/MS and data analysis for ReDiMe whole-proteome quantification.
LC-MS/MS was performed either on a Thermo LTQ Oribtrap XL mass spectrometer running Xcalibur v2.2 (Thermo Scientific), coupled to an easy-nanoLC system (Agilent) or on an Orbitrap Exploris 240 mass spectrometer running Xcalibur v4.4 (Thermo Scientific) coupled to a Dionex Ultimate 3000 RSLCnano system. For samples run on the LTQ Orbitrap XL mass spectrometer, 10 μL of each of the six off-line fractions was pre-loaded onto a C18 pre-column. Peptides were eluted onto a 100-mm fused silica column packed with 10 cm C18 resin using a 4 hr gradient of buffer B in Buffer A (Buffer A: 95% water, 5% acetonitrile, 0.1% formic acid; Buffer B: 20% water, 80% acetonitrile, 0.1% formic acid). The flow rate through the column was ~0.4 μL/min, with a spray voltage of 2.75 kV. One full MS1 scan (400–1800 MW) was followed by 8 data dependent scans of the nth most intense ion. Dynamic exclusion was enabled. The tandem MS data was analyzed by the SEQUEST v.27 algorithm.56 Static modification of cysteine residues (+57.0215 m/z, iodoacetamide alkylation) was assumed with no enzyme specificity. The precursor-ion mass tolerance was set at 50 ppm while the fragment-ion mass tolerance was set to 0 (default setting). Data was searched against an E. coli reverse-concatenated non-redundant FASTA database containing Uniprot identifiers. MS datasets were independently searched with light and heavy ReDiMe parameter files; for these searches, static modifications on lysine and the peptide N-terminus of +28.0313 (light) or +34.0632 (heavy) were used. MS2 spectra matches were assembled into protein identifications and filtered using DTASelect2.0,57 to generate a list of protein hits with a peptide false-discovery rate of <5%. Quantification of protein L/H ratios were calculated using the cimage1.0 quantification package described previously.23 All mass-spectrometry data were collected for 3–5 independent biological replicates. For samples run on the Orbitrap Exploris 240 mass spectrometer, samples (5 μL) were injected directly onto an Acclaim PepMap 100 loading column. Peptides were eluted onto an Acclaim PepMap RSLC and separated with a 2-hour gradient from 5% to 25% of Buffer B (20% H2O, 80 % MeCN, 0.1% formic acid) in Buffer A (100% H2O, 0.1% formic acid) at a flow rate of 0.3 μL/min. The spray voltage was set to 2.1 kV. One full MS1 scan (120,000 resolution, 350–1800 m/z, RF lens 65%, AGC target 300%, automatic maximum injection time, profile mode) was obtained every 2 secs with dynamic exclusion (repeat count 2, duration 10 s), isotopic exclusion (assigned), and apex detection (30% desired apex window) enabled. A variable number of MS2 scans (15,000 resolution, AGC 75%, maximum injection time 100 ms, centroid mode) were obtained between each MS1 scan based on the highest precursor masses, filtered for monoisotopic peak determination, theoretical precursor isotopic envelope fit, intensity (5E4), and charge state (2–6). MS2 analysis consisted of the isolation of precursor ions (isolation window 2 m/z) followed by higher-energy collision dissociation (HCD) (collision energy 30%). The tandem MS data was analyzed by the Thermo Proteome Discoverer V2.4 software package and searched using the SequestHT and Percolator58 algorithms against a UniprotKB database (www.uniprot.org) of E. coli K12 proteome. Trypsin was specified as the protease with a maximum of 2 missed cleavages. Peptide precursor mass tolerance was set to 10 ppm with a fragment mass tolerance of 0.02 Da. Oxidation of methionine (+15.995) as well as acetylation (+42.011) and/or methionine-loss (+131.040) of the protein N-terminus were set as dynamic modifications. Cysteine alkylation (+57.021) and either light (+28.031) or heavy (+34.063) dimethylation of lysine residues and peptide N-termini were set as static modifications for two independent searches. The false discovery rate (FDR) for peptide identification was set to 1%. Protein light/heavy ratios were assigned as the median value of all relevant peptide light/heavy ratios, calculated from the ratio of light and heavy dimethylated peptide precursor ion intensities. All mass-spectrometry data were collected as two technical replicates each from two independent biological replicates.
Chemoproteomic labeling and enrichment of E. coli cysteine residues.
For identification and enrichment of cysteines residues labeled upon iron-depletion or in strains harboring isc deletions (Supplementary Datasets 2–8), 2 mg of control (iron-replete E. coli (K-12)) or Fe-S deficient (iron-depleted E. coli (K-12), ΔiscU, ΔiscA, ΔnfuA. ΔhscA, or ΔhscB) proteome (1 mL, 2 mg/mL) were labeled with 100 μM IA-alkyne light (IAL – 10 μL, 10 mM stock in DMSO) or IA-alkyne Heavy (IAH – 10 μL, 10 mM stock in DMSO) for 1 h at room temperature, respectively. Labeling under anaerobic conditions was achieved by IA-alkyne labeling of anaerobically generated cell lysates under nitrogen atmosphere in an anerobic glove box for 1 h at room temperature, after which the samples were removed from nitrogen atmosphere. For labeling of cell lysates under reducing conditions, lysates generated in the presence of 1 mM TCEP were IA-alkyne labeling for 1 h at room temperature in the dark. Probe labeled proteins were then conjugated to either chemically- or photo-cleavable biotin-azide (azo-tag) by Cu(I)-catalyzed [3 + 2] cycloaddition as previously reported.30,59 Briefly, azo-tag (100 μM), TCEP (1 mM), TBTA (100 μM), and CuSO4 (1 mM) were sequentially added to the labeled proteome. Reactions were vortexed and incubated at room temperature in the dark for 1 h. Light- and heavy-proteomes were combined and centrifuged (6500 g, 10 min, 4 °C) to collect precipitated protein. Supernatant was discarded, and protein pellets were resuspended in 500 μL of methanol (dry-ice chilled) with sonication, and centrifuged (6500 g, 10 min, 4 °C). This step was repeated, and the resulting washed pellets was redissolved (1.2% w/v SDS in PBS; 1 mL); sonication followed by heating at 80–95 °C for 5 min was used to ensure complete solubilization. Samples were cooled to room temperature, diluted with PBS (5.0 mL), and incubated with Streptavidin beads (100 μL of 50% aqueous slurry per enrichment) overnight at 4 °C. Samples were allowed to warm to room temperature, pelleted by centrifugation (1400 g, 3 min), and supernatant discarded. Beads were then sequentially washed with 0.2% SDS in PBS (5 mL × 1), PBS (5 mL × 3) and H2O (5 mL × 3) for a total of 7 washes.
On-bead reductive alkylation, tryptic digestion, and chemical cleavage of samples.
Following the final wash, protein-bound streptavidin beads were resuspended in 6 M urea in PBS (500 μL) and reductively alkylated by sequential addition of 10 mM DTT (25 μL of 200 mM in H2O, 65 °C for 20 min) and 20 mM iodoacetamide (25 μL of 400 mM in H2O, 37 °C for 30 min) to each sample. Reactions were then diluted by addition of PBS (950 μL), pelleted by centrifugation (1400 g, 3 min), and the supernatant discarded. Samples were subject to trypsin digestion by addition of 200 μL of a pre-mixed solution of 2M urea in PBS, 1 mM CaCl2 (2 μL of 100 mM in H2O), and 2 μg of Trypsin Gold (Promega, 4 μL of 0.5 μg/μL in 1% acetic acid). Samples were shaken overnight at 37 °C and pelleted by centrifugation (1400 g, 3 min). Beads were then washed sequentially with PBS (500 μL × 3) and H2O (500 μL × 3). For chemical cleavage the beads were resuspended in sodium dithionite (50 μL of 50 mM in H2O) and incubated at room temperature for 1 h to release labeled peptides. Beads were pelleted by centrifugation (1,400 g, 3 min, 25 °C) and the supernatant transferred to a new centrifuge tube. Cleavage was repeated twice more (75 μL of 50 mM in H2O) with the supernatants transferred to same centrifuge tube as the previous supernatant. The beads were washed with PBS (100 μL, 2x), with the washes being combined with the previous supernatants, for a total eluted peptide sample volume of ~ 350 μL. Formic acid (17.5 μL) was added to a final concentration of 5% and samples were stored at −20 °C. For photocleavage, the beads were resuspended in 250 μL of water and placed under UV lamp (360 nm) with gentle agitation via stirring for 2 hours. After UV cleavage, beads were centrifuged, and supernatant transferred to a new centrifuge tube. The beads were washed with water (75 μL, 2x), with the washes being combined with the previous supernatant, for a total eluted peptide sample volume of ~ 350 μL. Formic acid (17.5 μL) was added to a final concentration of 5% and samples were stored at −20 °C.
LC/LC-MS/MS and data analysis for isoTOP-ABPP.
LC-MS/MS was performed either on an LTQ Orbitrap Discovery mass spectrometer running Xcalibur v2.2 (Thermo scientific) coupled to an Agilent 1200 series HPLC or on an Orbitrap Exploris 240 mass spectrometer running Xcalibur v4.4 (Thermo Scientific) coupled to a Dionex Ultimate 3000 RSLCnano system. For samples run on the LTQ Orbitrap Discovery mass spectrometer, labeled peptide mixtures were pressure loaded onto 250 mm fused silica desalting column packed with 4 cm of Aqua C18 reverse phase resin (Phenomenex). Peptides were eluted onto a 100-mm fused silica biphasic column packed with 10 cm C18 resin and 4 cm Partisphere strong cation exchange resin (SCX, Whatman), using a five-step multidimensional LC-MS protocol (MudPIT) as outlined previously.23 The flow-rate through the column was ~0.25μL/min, with a spray voltage of 2.75 kV. One full MS1 scan (400–1800 MW) was followed by 8 data dependent scans of the nth most intense ion. Dynamic exclusion was enabled. The tandem MS data was analyzed by the SEQUEST v.27 algorithm.56 A static (+57.0215 m/z, iodoacetamide alkylation) modification on cysteine residues was specified. The precursor-ion mass tolerance was set at 50 ppm while the fragment-ion mass tolerance was set to 0 (default setting). Data was searched against an E. coli reverse-concatenated non-redundant FASTA database containing Uniprot identifiers. MS datasets were independently searched with light and heavy parameter files; for these searches, differential modifications on cysteine for either the IAL (+306.1481) or IAH (+312.1682) modification with the chemically-cleavable azo-tag were used. MS2 spectra matches were assembled into protein identifications and filtered using DTASelect2.0,57 to generate a list of protein hits with a peptide false-discovery rate of <5%. With the –trypstat and –modstat options applied, peptides were restricted to fully tryptic (-y 2) with a found modification (-m 0) and a delta-CN score greater than 0.06 (-d 0.06). Single peptides per locus were also allowed (-p 1) as were redundant peptide identifications from multiple proteins, but the database contained only a single consensus splice variant for each protein. Quantification of peptide L/H ratios were calculated using the cimage1.0 quantification package described previously.23 Annotation of protein subcellular localization as well as cysteine function and conservation were generated from the Uniprot Protein Knowledgebase (UniProtKB) as described previously.60 All mass-spectrometry data were collected for 3–5 independent biological replicates. For samples run on the Orbitrap Exploris 240 mass spectrometer, labeled peptide mixtures were first desalted on a Sep-Pak and dried by speed-vac before resuspension in 30 μL of low pH buffer A (95% H2O, 5% acetonitrile, 0.1% formic acid). Samples were analyzed by LC-MS/MS on a Orbitrap Exploris 240 mass spectrometer as described previously. The tandem MS data was analyzed by the Thermo Proteome Discoverer V2.4 software package and searched using the SequestHT and Percolator58 algorithms against a UniprotKB database of E. coli K12 proteome. Trypsin was specified as the protease with a maximum of 2 missed cleavages. Peptide precursor mass tolerance was set to 10 ppm with a fragment mass tolerance of 0.02 Da. Oxidation of methionine (+15.995) as well as acetylation (+42.011) and/or methionine-loss (+131.040) of the protein N-terminus were set as dynamic modifications. Cysteine alkylation (+57.021) and either IAL (+285.159) or IAH (+291.179) modification with the photo-cleavable azo-tag were set as dynamic modifications for two independent searches. The false discovery rate (FDR) for peptide identification was set to 1%. Peptide light/heavy ratios were calculated from the ratio of IAL and IAH modified peptide precursor ion intensities. Annotation of cysteine function were generated from the Uniprot Protein Knowledgebase (UniProtKB) as described previously.60 All mass-spectrometry data were collected as two technical replicates each from three independent biological replicates.
Chemoproteomic labeling of E. coli cysteine residues for reactivity profiling.
For reactivity profiling of E. coli cysteine residues (Supplementary Dataset 9), 2 mg of iron-depleted E. coli (K-12) lysate were labeled with either 100 μM IA-alkyne Light (IAL – 10 μL, 10 mM stock in DMSO) or 10 μM IA-alkyne Heavy (IAH – 10 μL, 1 mM stock in DMSO) for 1 h at room temperature. Probe labeled proteins were then conjugated to chemically-cleavable diazobenzene biotin-azide (azo-tag) by Cu(I)-catalyzed [3 + 2] cycloaddition. The samples were then carried through the same sample preparation as described previously for isoTOP-ABPP analysis and analyzed as described by LC/LC-MS/MS on a Thermo LTQ Orbitrap Discovery mass spectrometer coupled to an Agilent 1200 series HPLC.
Purification and iron-content determination of recombinant TrhP.
Cell pellets were resuspended in 5 mL of degassed TrhP lysis buffer (50 mM Tris, 150 mM NaCl, pH 8.5, 5 mM imidazole, 1 mM DTT), and lysed by sonication (3 ×10 pulses – 90%) on ice. Cell lysates were centrifuged at 10,000 g for 15 min at 4 °C, and the resulting supernatant was loaded onto 1 mL of Ni-NTA that had been previously equilibrated with degassed lysis buffer. The Ni-NTA was washed with 5-bed volumes of degassed wash buffer (50 mM Tris, 150 mM NaCl, pH 8.5, 20 mM imidazole, 1 mM DTT). Recombinant TrhP was eluted from the Ni-NTA column with 2-bed volumes of degassed elution buffer (50 mM Tris, 150 mM NaCl, pH 8.5, 250 mM imidazole, 1 mM DTT). The protein was desalted over a pre-packed PD-10 column equilibrated with degassed protein storage buffer (50 mM Tris, 150 mM NaCl, pH 8.5, 1 mM DTT) and concentrated using an Amicon-Ultra 10 kDa centrifugal filter. Protein concentration was determined by Bradford assay. Recombinant TrhP was diluted to 1 μg mL−1 in 5% of TraceMetal Grade Nitric Acid in Milli-Q double distilled water. Iron content was measured on an Agilent 5100 ICP-OES. ICP-OES sample were prepared in triplicate and the relative iron concentration of each sample was calculated from a calibration curve of external standards (iron – 0 to 56 mg l−1) according to peak height.
Purification and iron-content determination of recombinant DppD.
Recombinant DppD was purified and characterized as previously described for TrhP, with the exception that 5% glycerol and 0.5 % N-Dodecycyl-Beta-Maltiside (DDM) were added to the lysis, wash, elution, and protein storage buffers.
UV/visibile absorption analysis.
The presence of an Fe-S cluster was confirmed by UV-visible absorption spectroscopy on a ThermoScientific Nanodrop 2000c spectrophotometer. Reduced TrhP was generated by the addition of 1 mM sodium dithionite to the protein solution immediately before recording the spectra.
Electron paramagentic mesonance (EPR) analysis.
Low temperature (10 K) EPR measurments were made using a Bruker X-band EMX-Plus EPR spectrometer equipped with a cryogen-free variable temperature (VT) setup. Reduced TrhP was generated by the addition of 1 mM sodium dithionite to the protein solution immediately prior to flash freezing samples. EPR spectra were collected at 9.37 GHz, 2 mW microwave power, and with a modulation amplitude of 4G.
Extended Data
Extended Data Figure 1 |. A functional catalogue of the E. coli Fe-S proteome.
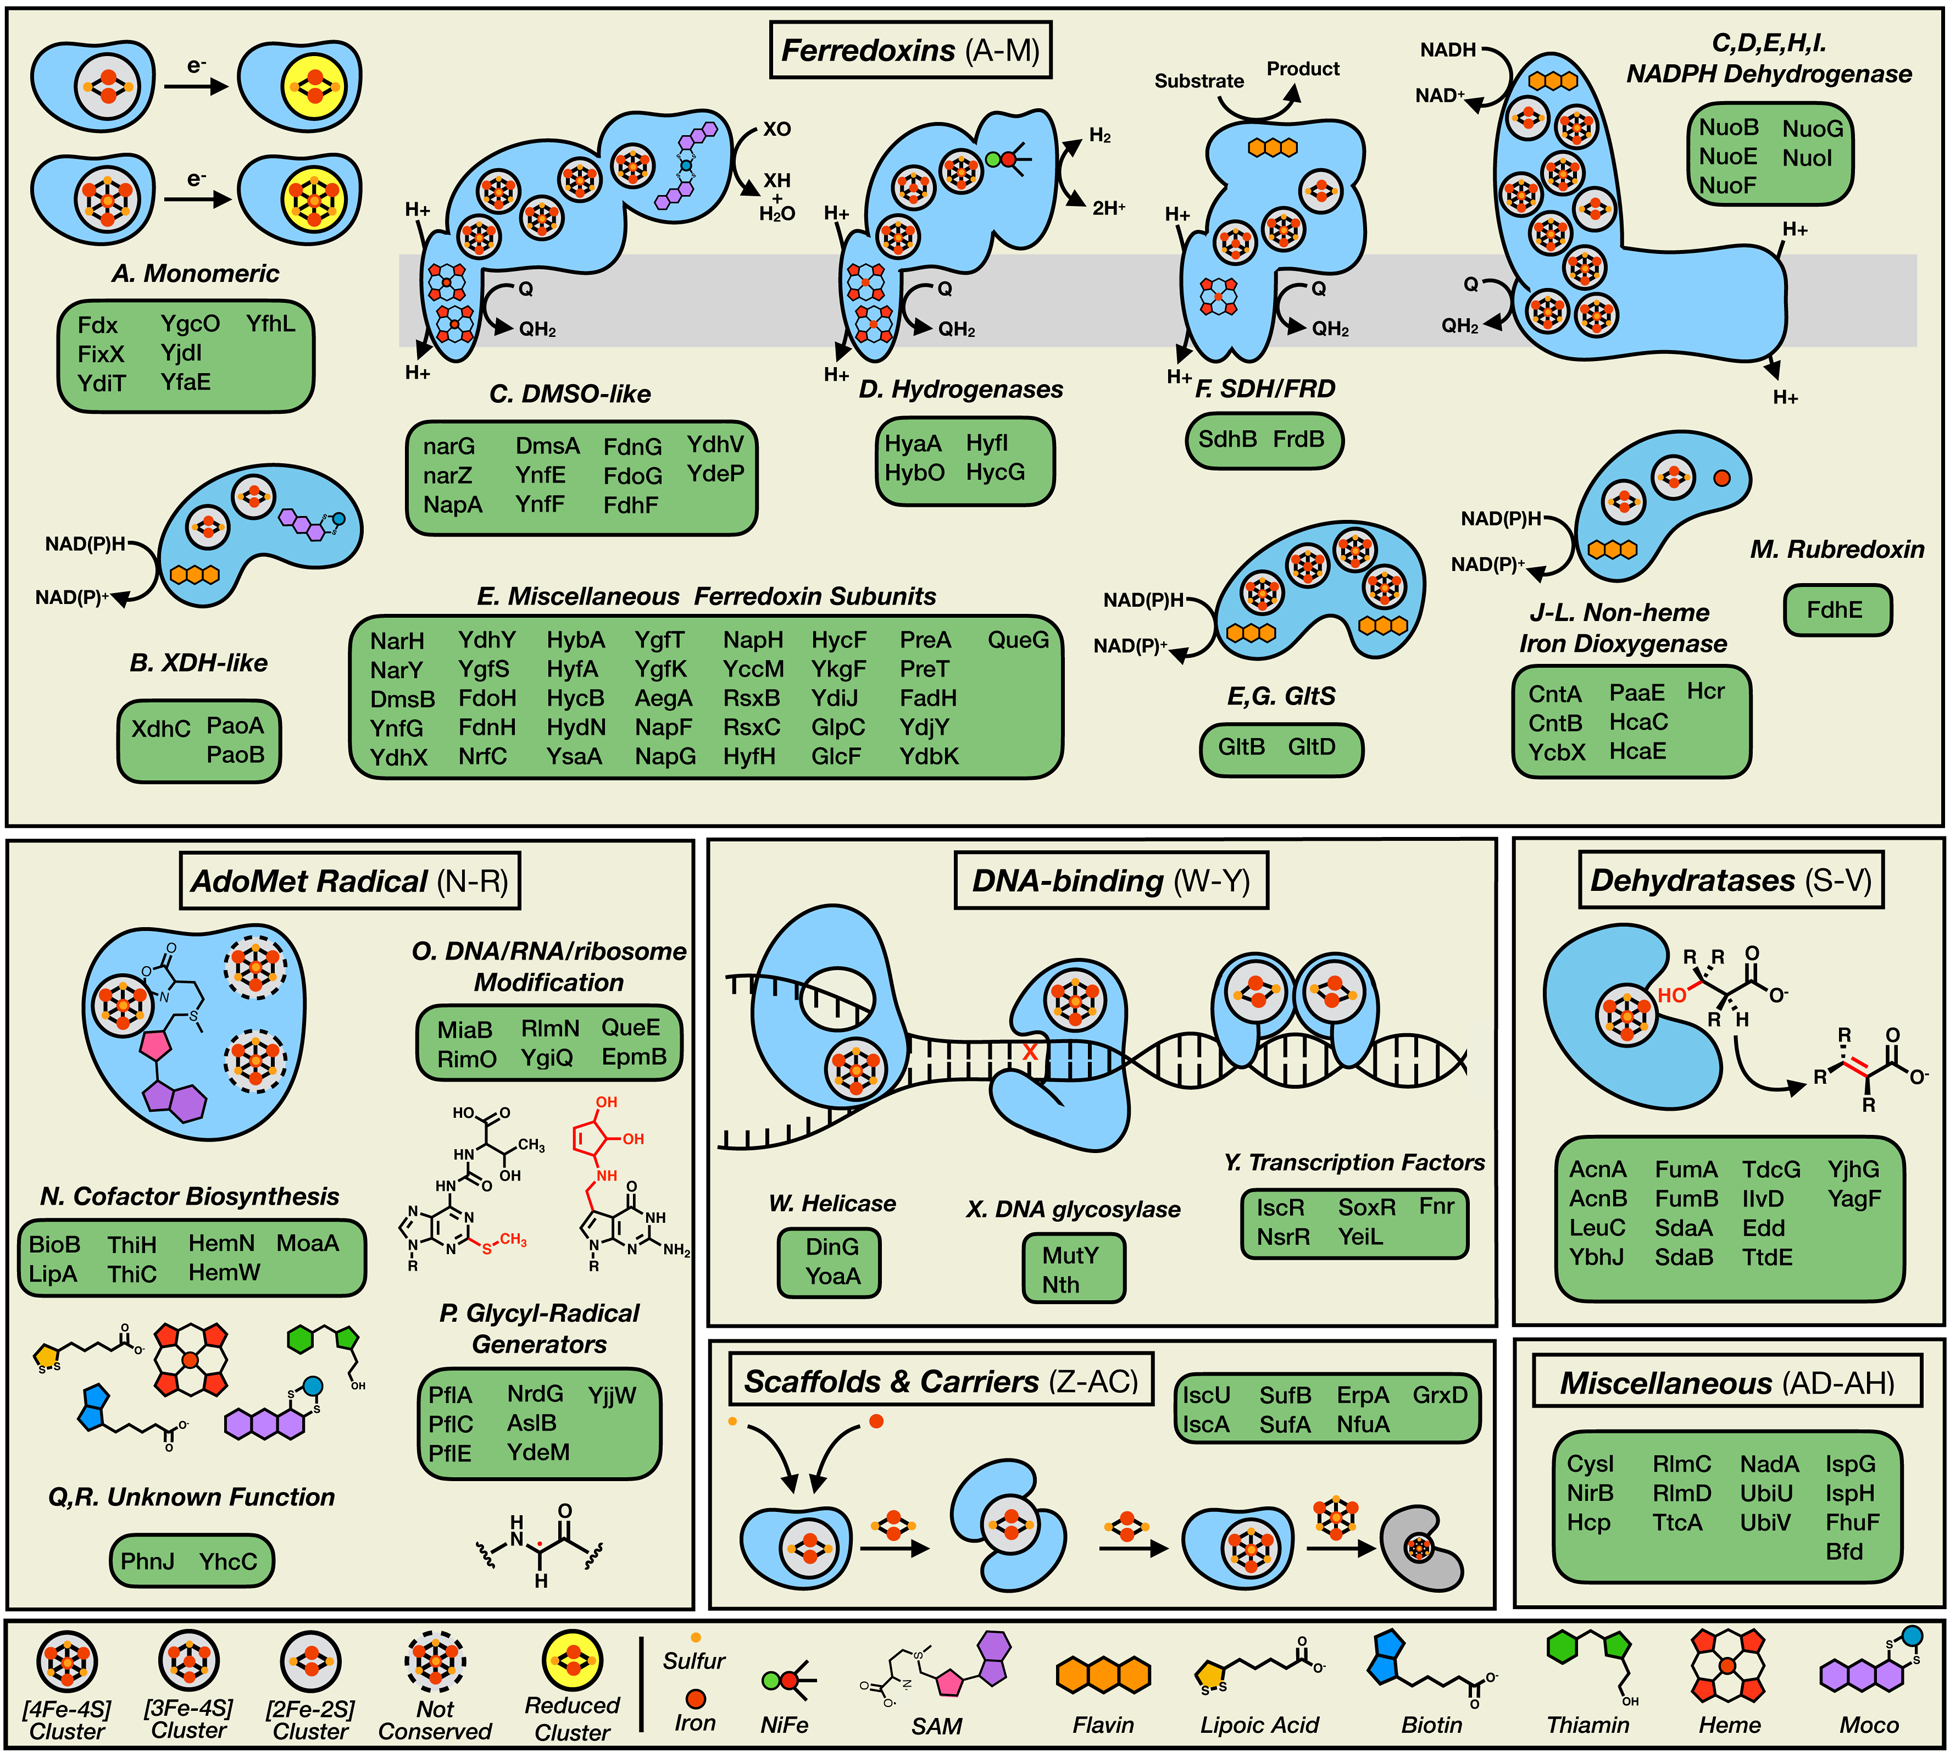
The 144 members of the E. coli Fe-S proteome categorized by cluster function (see Supplementary Dataset 1). General Fe-S proteins/complexes (blue) are represented as cartoon diagrams displaying the approximate orientation of all (metallo)cofactors, with a list of individual Fe-S family members presented in the associated green boxes. Abbreviations: XDH, xanthine dehydrogenase; DMSO, dimethyl sulfoxide reductase; SDH, succinate dehydrogenase; FRD, fumarate reductase; GltS, glutamate synthase; NiFe, dinuclear nickel-iron center; SAM, S-adenosylmethionine; Moco, molybdenum cofactor.
Extended Data Figure 2 |. Cysteine labeling and protein abundance changes in the E. coli Fe-S proteome upon iron-depletion.
a,b, Intracellular (a) iron and (b) zinc concentration determined by ICP-OES for E. coli grown under iron-replete (control) (gray) or iron-depleted (green) conditions. Significance is calculated as *** p < 0.005 (p = 2.2E-05), paired t-test (two-tailed) from n = 3 biological replicates. Error bars represent the standard error of the mean. c, Reductive dimethylation (ReDiMe) proteomic platform employed to measure protein abundance changes upon growth of E. coli under iron-depletion conditions. d, IsoTOP-ABPP proteomic platform employed to measure cysteine labeling changes upon growth of E. coli under iron-depletion conditions. e, Waterfall plot of log2 L/H ratio (RP) changes for all quantified proteins from an iron-depleted E. coli proteome (see Supplementary Dataset 2). Proteins with RP > |0.5| are highlighted in red. f, Gene-ontology analysis of processes enriched in proteins with RP > 0.5. Processes involved in iron import and homeostasis are highlighted in red. g, Pie chart analysis of the number of quantified Fe-S proteins with RP < -0.5 (red), RP ~ 0.0 (gray), and RP > 0.5 (green).
Extended Data Figure 3 |. Cysteine reactivity under iron-depletion is independent of lysate preparation and IA-alkyne labeling conditions.

a, Two-dimensional proteomic dataset for the E. coli proteome grown under iron-replete (control) conditions (see Supplementary Dataset 3). All quantified cysteine residues are plotted in the main graph (annotated Fe-S cluster cysteine ligands - green circles, non-annotated cysteine residues - light gray small circles). Inset to right: cysteine residues with no protein abundance data (annotated Fe-S cluster cysteine ligands - green circles, non-annotated cysteine residues - light gray small circles). Inset below: proteins with no cysteine reactivity data (annotated Fe-S protein - red circles, non-annotated proteins - light gray small). b,c, Comparison plot of cysteine reactivity ratios (iron-depleted versus iron-replete) for quantified Fe-S ligands (green circles) from lysates IA-alkyne labeled under standard aerobic (x-axis) versus (b) anaerobic or (c) reducing conditions (y-axis) (see Supplementary Dataset 2).
Extended Data Figure 4 |. Cysteine reactivity changes for the ligands of the two Fe-S clusters of biotin synthase.
a, Rc values for Fe-S cysteine ligands on the Fe-S protein, BioB. b, Crystal structure of E. coli BioB with clusters and cysteine residues highlighted (Insets: AdoMet radical [4Fe-4S] cluster – green and auxiliary [4Fe-4S] cluster – orange).
Extended Data Figure 5 |. suf operon expression in E. coli isc genetic deletion strains.
a, Structural organization of the E. coli isc and suf operons. b, Proposed model of suf operon function and regulation by the IscU client protein and transcription factor, IscR. c, Protein abundance changes for scaffold complex proteins from the suf operon across all experimental growth conditions and deletion strains.
Extended Data Figure 6 |. Reactivity profile of cysteine residues involved in Fe-S ligation.
a, Proteomic workflow for measuring the cysteine reactivity of Fe-S cluster ligands in an iron-depleted E. coli proteome labeled with 100 μM IA-Light or 10 μM IA-Heavy. b, Cysteine reactivity curve for all quantified cysteine residues (light gray) from an iron-depleted E. coli proteome (see Supplementary Dataset 9). Fe-S cluster cysteine ligands are highlighted (green circles). c,d Violin plot of L/H ratios for unique groups of (c) functional cysteine residues, including Fe-S ligands (red), active site residues (blue), zinc ligands (purple), disulfides (green), and iron ligands (yellow) and (d) Fe-S ligands from Fe-S client proteins (red) and Fe-S scaffold proteins (yellow). The median R value for each functional group of cysteine residues is displayed as a dashed line, while the average R values (red) and number of unique values (black) are indicated for each group.
Extended Data Figure 7 |. Biochemical characterization of the putative Fe-S protein DppD.
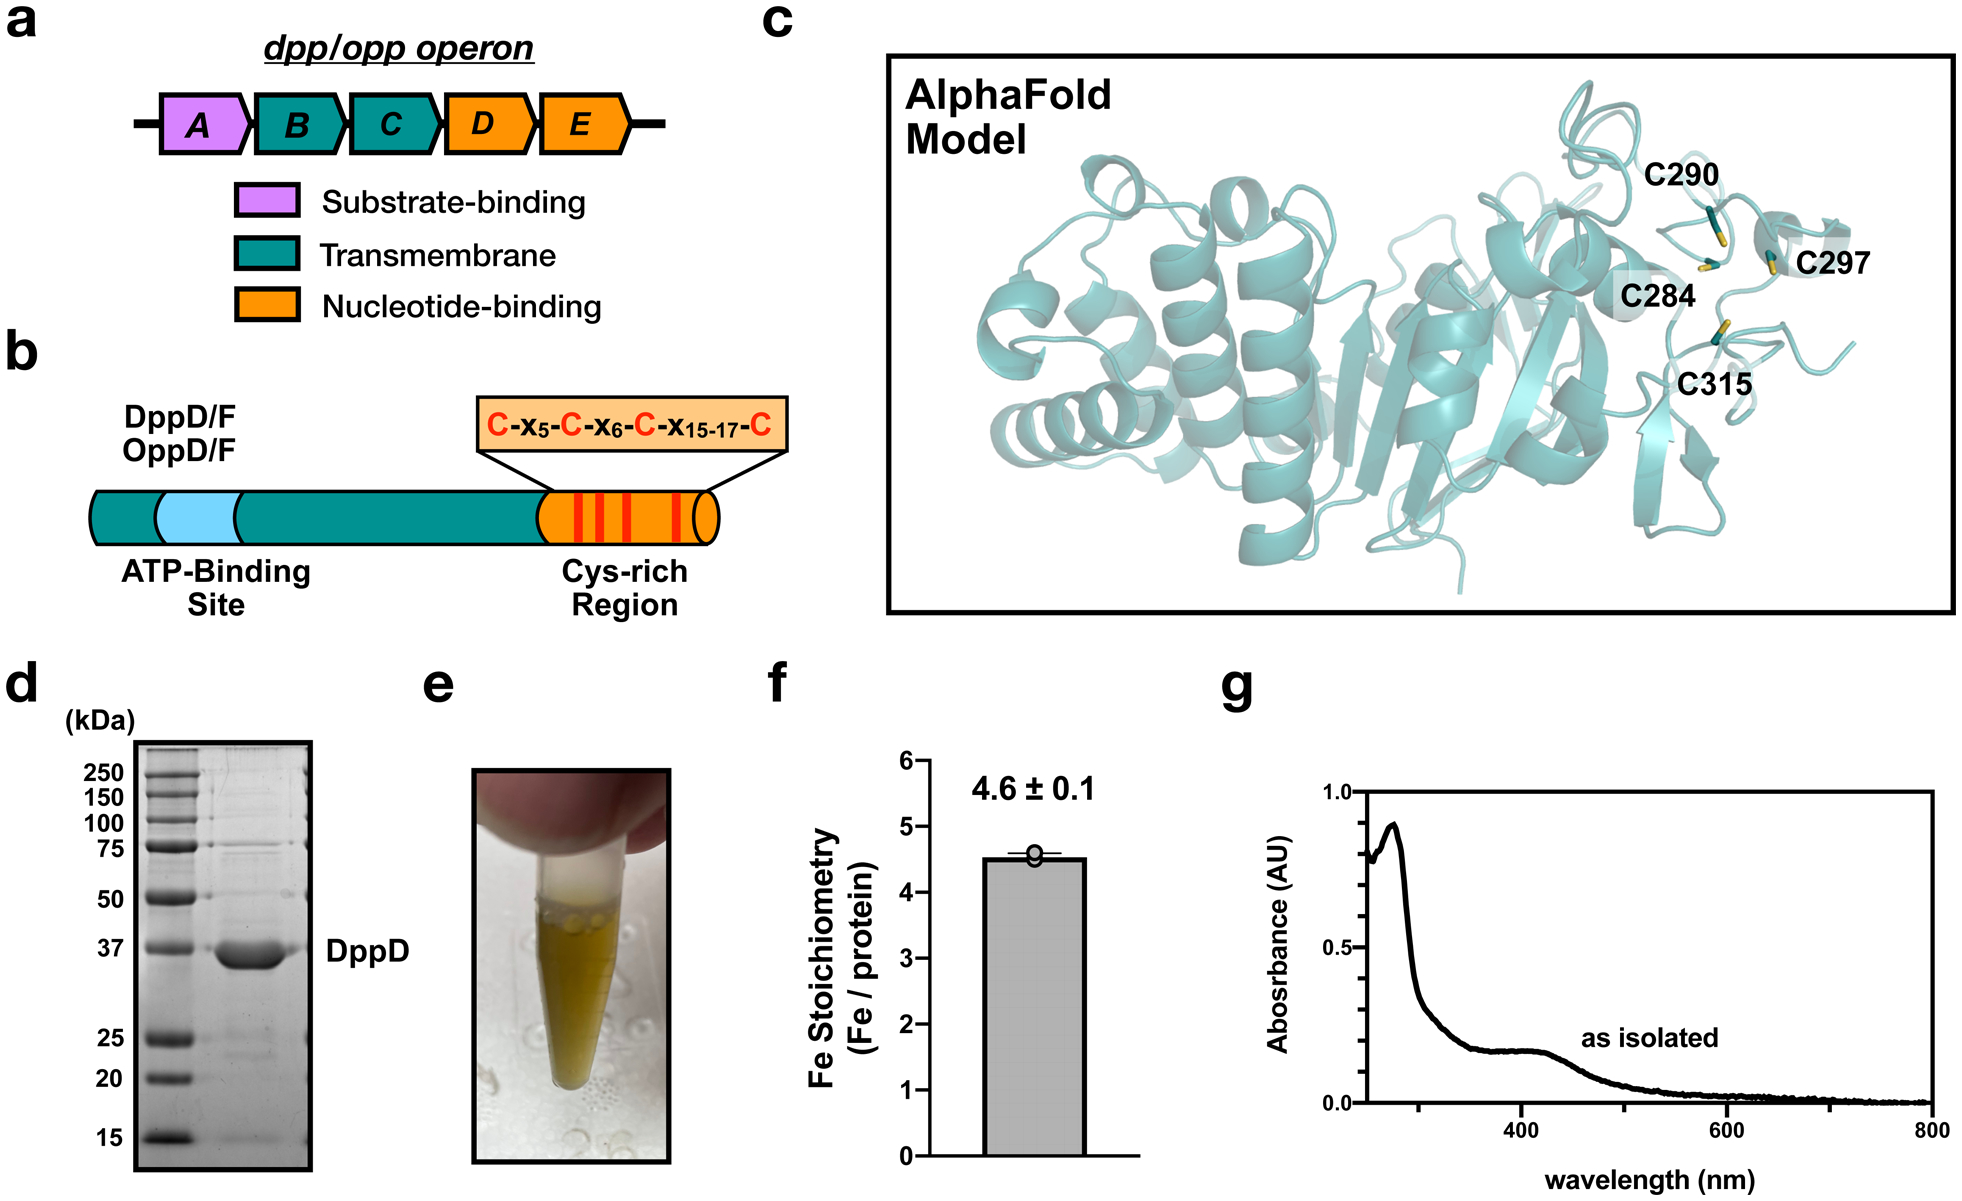
a, Organization of the dpp and opp operons. b, the protein domain structure of the nucleotide-binding subunits, DppD/F and OppD/F. Conserved cysteine residues in the C-terminal extension (orange) are shown as red lines. c, AlphaFold structural model of DppD (AF-P0AAG0-F1). The four conserved c-terminal cysteine residues are highlighted. d, Representative SDS-PAGE analysis of purified E. coli DppD (experiment independently repeated twice). e, Visible color of purified E. coli DppD protein. f, ICP-OES analysis of the iron content of purified E. coli DppD from n=3 experimental replicates. Error bars represent the standard error of the mean. g, UV-visible absorbance spectrum of as-isolated E. coli DppD.
Supplementary Material
Acknowledgements
We thank all members of the E.W. laboratory for discussions and feedback. This work was supported by NIH grant R35GM134964 to E.W.
Footnotes
Competing Interests Statement
The authors declare no competing interests.
Data Availability
Mass-spectrometry proteomics data for this study have been deposited in ProteomeXchange via the PRIDE partner repository with the dataset identifier PXD026488. Databases used for MS/MS searches against the E. coli proteome were obtained from the Uniprot Protein Knowledgebase (UniProtKB) at www.uniprot.org. Source data are provided with this manuscript.
References
- 1.Beinert H, Holm RH and Münck E Iron-sulfur clusters: nature’s modular, multipurpose structures. Science 277, 653–659 (1997). [DOI] [PubMed] [Google Scholar]
- 2.Hirst J Mitochondrial complex I. Annu. Rev. Biochem 82, 551–575 (2013). [DOI] [PubMed] [Google Scholar]
- 3.Landgraf BJ, McCarthy EL and Booker SJ Radical S-adenosylmethionine enzymes in human health and disease. Annu. Rev. Biochem 85, 485–514 (2016). [DOI] [PubMed] [Google Scholar]
- 4.Vey JL and Drennan CL Structural insights into radical generation by the radical SAM superfamily. Chem. Rev 111, 2487–2506 (2011). [DOI] [PMC free article] [PubMed] [Google Scholar]
- 5.Boal AK, Genereux JC, Sontz PA, Gralnick JA, Newman DK and Barton JK Redox signaling between DNA repair proteins for efficient lesion detection. Proc. Nat. Acad. Sci 106, 15237–15242 (2009). [DOI] [PMC free article] [PubMed] [Google Scholar]
- 6.Crack JC, Green J, Thomson AJ and Le Brun NE Iron–sulfur cluster sensor-regulators. Curr. Opin. Chem. Biol 16, 35–44 (2012). [DOI] [PubMed] [Google Scholar]
- 7.Beinert H, Kennedy MC and Stout CD Aconitase as iron−sulfur protein, enzyme, and iron-regulatory protein. Chem. Rev 96, 2335–2374 (1996). [DOI] [PubMed] [Google Scholar]
- 8.Flint DH and Allen RM Iron−sulfur proteins with non-redox functions. Chem. Rev 96, 2315–2334 (1996). [DOI] [PubMed] [Google Scholar]
- 9.Rouault TA Iron-sulfur proteins hiding in plain sight. Nat. Chem. Biol 11, 442–445 (2015). [DOI] [PubMed] [Google Scholar]
- 10.Estellon J, De Choudens SO, Smadja M, Fontecave M and Vandenbrouck Y An integrative computational model for large-scale identification of metalloproteins in microbial genomes: a focus on iron–sulfur cluster proteins. Metallomics 6, 1913–1930 (2014). [DOI] [PubMed] [Google Scholar]
- 11.Sofia HJ, Chen G, Hetzler BG, Reyes-Spindola JF and Miller NE Radical SAM, a novel protein superfamily linking unresolved steps in familiar biosynthetic pathways with radical mechanisms: functional characterization using new analysis and information visualization methods. Nucleic Acids Res 29, 1097–1106 (2001). [DOI] [PMC free article] [PubMed] [Google Scholar]
- 12.Frey PA, Hegeman AD and Ruzicka FJ The radical SAM superfamily. Crit. Rev. Biochem. Mol 43, 63–88 (2008). [DOI] [PubMed] [Google Scholar]
- 13.Zhang Y, Zhu X, Torelli AT, Lee M, Dzikovski B, Koralewski RM, Wang E, Freed J, Krebs C, Ealick SE and Lin H Diphthamide biosynthesis requires an organic radical generated by an iron–sulphur enzyme. Nature 465, 891–896 (2010). [DOI] [PMC free article] [PubMed] [Google Scholar]
- 14.Braymer JJ, Freibert SA, Rakwalska-Bange M and Lill R Mechanistic concepts of iron-sulfur protein biogenesis in Biology. Biochim. Biophys. Acta Mol. Cell Res 1868, 118863–118690 (2020). [DOI] [PubMed] [Google Scholar]
- 15.Rouault TA and Maio N Biogenesis and functions of mammalian iron-sulfur proteins in the regulation of iron homeostasis and pivotal metabolic pathways. J. Biol. Chem 292, 12744–12753 (2017). [DOI] [PMC free article] [PubMed] [Google Scholar]
- 16.Yan LJ, Levine RL and Sohal RS Oxidative damage during aging targets mitochondrial aconitase. Proc. Nat. Acad. Sci 94, 11168–11172 (1997). [DOI] [PMC free article] [PubMed] [Google Scholar]
- 17.Broach RB and Jarrett JT Role of the [2Fe-2S] 2+ cluster in biotin synthase: mutagenesis of the atypical metal ligand arginine 260. Biochemistry 45, 14166–14174 (2006). [DOI] [PMC free article] [PubMed] [Google Scholar]
- 18.Rouault TA, Haile DJ, Downey WE, Philpott CC, Tang C, Samaniego F, Chin J, Paul I, Orloff D, Harford JB and Klausner RD An iron-sulfur cluster plays a novel regulatory role in the iron-responsive element binding protein. Biometals 5, 131–140 (1992). [DOI] [PubMed] [Google Scholar]
- 19.Pierik AJ, Netz DJ and Lill R Analysis of iron–sulfur protein maturation in eukaryotes. Nat. Protoc 4, 753–766 (2009). [DOI] [PubMed] [Google Scholar]
- 20.Stehling O, Paul VD, Bergmann J, Basu S and Lill R Biochemical analyses of human iron–sulfur protein biogenesis and of related diseases. Method. Enzymol 599, 227–263 (2018). [DOI] [PubMed] [Google Scholar]
- 21.Webert H, Freibert SA, Gallo A, Heidenreich T, Linne U, Amlacher S, Hurt E, Mühlenhoff U, Banci L and Lill R Functional reconstitution of mitochondrial Fe/S cluster synthesis on Isu1 reveals the involvement of ferredoxin. Nat. Commun 5, 1–12 (2014). [DOI] [PubMed] [Google Scholar]
- 22.Fox NG, Chakrabarti M, McCormick SP, Lindahl PA and Barondeau DP The human iron–sulfur assembly complex catalyzes the synthesis of [2Fe-2S] clusters on ISCU2 that can be transferred to acceptor molecules. Biochemistry 54, 3871–3879 (2015). [DOI] [PMC free article] [PubMed] [Google Scholar]
- 23.Weerapana E, Wang C, Simon GM, Richter F, Khare S, Dillon MB, Bachovchin DA, Mowen K, Baker D and Cravatt BF Quantitative reactivity profiling predicts functional cysteines in proteomes. Nature 468, 790–795 (2010). [DOI] [PMC free article] [PubMed] [Google Scholar]
- 24.Weerapana E, Speers AE and Cravatt BF Tandem orthogonal proteolysis-activity-based protein profiling (TOP-ABPP)—a general method for mapping sites of probe modification in proteomes. Nat. Protoc 2, 1414–1425 (2007). [DOI] [PubMed] [Google Scholar]
- 25.Backus KM, Correia BE, Lum KM, Forli S, Horning BD, González-Páez GE, Chatterjee S, Lanning BR, Teijaro JR, Olson AJ, Wolan DW, and Cravatt BF Proteome-wide covalent ligand discovery in native biological systems. Nature 534, 570–574 (2016). [DOI] [PMC free article] [PubMed] [Google Scholar]
- 26.Deng X, Weerapana E, Ulanovskaya O, Sun F, Liang H, Ji Q, Ye Y, Fu Y, Zhou L, Li J, Zhang H, Wang C, Hicks LM, Lan L, Wu M, Cravatt BF, and He C Proteome-wide quantification and characterization of oxidation-sensitive cysteines in pathogenic bacteria. Cell Host Microbe 13, 358–370 (2013). [DOI] [PMC free article] [PubMed] [Google Scholar]
- 27.Pace NJ and Weerapana E A competitive chemical-proteomic platform to identify zinc-binding cysteines. ACS Chem. Biol 9, 258–265 (2014). [DOI] [PubMed] [Google Scholar]
- 28.Seo SW, Kim D, Latif H, O’Brien EJ, Szubin R and Palsson BO Deciphering Fur transcriptional regulatory network highlights its complex role beyond iron metabolism in Escherichia coli. Nat. Commun 5, 1–10 (2014). [DOI] [PMC free article] [PubMed] [Google Scholar]
- 29.Vinogradova EV, Zhang X, Remillard D, Lazar DC, Suciu RM, Wang Y, Bianco G, Yamashita Y, Crowley VM, Schafroth MA and Yokoyama M, Konrad DB, Lum KM, Simon GM, Kemper EK, Lazear MR, Yin S, Blewett MM, Dix MM, Nguyen N, Shokirev MN, Chen EM, Lairson LL, Melillo B, Schreiber SL, Forli S, Teijaro JR, and Cravatt BF An activity-guided map of electrophile-cysteine interactions in primary human T cells. Cell 182, 1009–1026 (2020). [DOI] [PMC free article] [PubMed] [Google Scholar]
- 30.Boersema PJ, Raijmakers R, Lemeer S, Mohammed S and Heck AJ Multiplex peptide stable isotope dimethyl labeling for quantitative proteomics. Nat. Protoc 4, 484–494 (2009). [DOI] [PubMed] [Google Scholar]
- 31.Abo M, Li C and Weerapana E Isotopically-labeled iodoacetamide-alkyne probes for quantitative cysteine-reactivity profiling. Mol. Pharm 15, 743–749 (2017). [DOI] [PMC free article] [PubMed] [Google Scholar]
- 32.Forouhar F, Arragain S, Atta M, Gambarelli S, Mouesca JM, Hussain M, Xiao R, Kieffer-Jaquinod S, Seetharaman J, Acton TB, Montelione GT, Mulliez E, Hunt JF, and Fontecave M Two Fe-S clusters catalyze sulfur insertion by radical-SAM methylthiotransferases. Nat. Chem. Biol 9, 333–338 (2013). [DOI] [PMC free article] [PubMed] [Google Scholar]
- 33.Becker A, Schlichting I, Kabsch W, Groche D, Schultz S and Wagner AV Iron center, substrate recognition and mechanism of peptide deformylase. Nat. Struct. Biol 5, 1053–1058 (1998). [DOI] [PubMed] [Google Scholar]
- 34.Ruzheinikov SN, Das SK, Sedelnikova SE, Hartley A, Foster SJ, Horsburgh MJ, Cox AG, McCleod CW, Mekhalfia A, Blackburn GM, Rice DW, and Baker PJ The 1.2 Å structure of a novel quorum-sensing protein, Bacillus subtilis LuxS. J. Mol. Biol 313, 111–122 (2001). [DOI] [PubMed] [Google Scholar]
- 35.Yeo WS, Lee JH, Lee KC and Roe JH IscR acts as an activator in response to oxidative stress for the suf operon encoding Fe‐S assembly proteins. Mol. Microbiol 61, 206–218 (2006). [DOI] [PubMed] [Google Scholar]
- 36.Burschel S, Kreuzer Decovic D, Nuber F, Stiller M, Hofmann M, Zupok A, Siemiatkowska B, Gorka M, Leimkühler S and Friedrich T Iron‐sulfur cluster carrier proteins involved in the assembly of Escherichia coli NADH: ubiquinone oxidoreductase (complex I). Mol. Microbiol 111, 31–45 (2019). [DOI] [PubMed] [Google Scholar]
- 37.Maio N and Rouault TA Iron–sulfur cluster biogenesis in mammalian cells: new insights into the molecular mechanisms of cluster delivery. Biochim. Biophys. Acta Mol. Cell Res 1853 1493–1512 (2015). [DOI] [PMC free article] [PubMed] [Google Scholar]
- 38.Puglisi R and Pastore A The role of chaperones in iron–sulfur cluster biogenesis. FEBS Lett 592 4011–4019 (2018). [DOI] [PMC free article] [PubMed] [Google Scholar]
- 39.Silberg JJ and Vickery LE Kinetic characterization of the ATPase cycle of the molecular chaperone Hsc66 from Escherichia coli. J. Biol. Chem 275 7779–7786 (2000). [DOI] [PubMed] [Google Scholar]
- 40.Silberg JJ, Tapley TL, Hoff KG and Vickery LE Regulation of the HscA ATPase reaction cycle by the co-chaperone HscB and the iron-sulfur cluster assembly protein IscU. J. Biol. Chem 279 53924–53931 (2004). [DOI] [PubMed] [Google Scholar]
- 41.Bonomi F, Iametti S, Morleo A, Ta D and Vickery LE Studies on the mechanism of catalysis of iron− sulfur cluster transfer from IscU [2Fe2S] by HscA/HscB chaperones. Biochemistry, 47 12795–12801 (2008). [DOI] [PubMed] [Google Scholar]
- 42.Iametti S, Barbiroli A and Bonomi F Functional implications of the interaction between HscB and IscU in the biosynthesis of FeS clusters. J. Biol. Inorg. Chem 20 1039–1048 (2015). [DOI] [PubMed] [Google Scholar]
- 43.Maio N, Singh A, Uhrigshardt H, Saxena N, Tong WH and Rouault TA Cochaperone binding to LYR motifs confers specificity of iron sulfur cluster delivery. Cell Metab 19 445–457 (2014). [DOI] [PMC free article] [PubMed] [Google Scholar]
- 44.Maio N, Kim KS, Singh A and Rouault TA A single adaptable cochaperone-scaffold complex delivers nascent iron-sulfur clusters to mammalian respiratory chain complexes I–III. Cell Metab 25 945–953 (2017). [DOI] [PubMed] [Google Scholar]
- 45.Hinchliffe P and Sazanov LA Organization of iron-sulfur clusters in respiratory complex I. Science 309, 771–774 (2005). [DOI] [PubMed] [Google Scholar]
- 46.Unden G and Bongaerts J Alternative respiratory pathways of Escherichia coli: energetics and transcriptional regulation in response to electron acceptors. Biochim. Biophys. Acta Bioenerg 1320, 217–234 (2017). [DOI] [PubMed] [Google Scholar]
- 47.Sakai Y, Kimura S and Suzuki T Dual pathways of tRNA hydroxylation ensure efficient translation by expanding decoding capability. Nat. Commun 10, 1– 16 (2019). [DOI] [PMC free article] [PubMed] [Google Scholar]
- 48.Kimura S, Sakai Y, Ishiguro K and Suzuki T Biogenesis and iron-dependency of ribosomal RNA hydroxylation. Nucleic Acids Res 45, 12974–12986 (2017). [DOI] [PMC free article] [PubMed] [Google Scholar]
- 49.Pelosi L, Abby SS, Loiseau L, Rascalou B, Chehade MH, Faivre B, Goussé M, Chenal C, Touati N, Binet L, Cornu D, Fyfe CD, Fontecave M, Barras F, Lombard M, and Pierrel F Ubiquinone Biosynthesis over the Entire O2 Range: Characterization of a Conserved O2-Independent Pathway. Mbio 10, e01319–19 (2019). [DOI] [PMC free article] [PubMed] [Google Scholar]
- 50.Locher KP Mechanistic diversity in ATP-binding cassette (ABC) transporters. Nat. Struct. Mol. Biol 23, 487–493 (2016). [DOI] [PubMed] [Google Scholar]
- 51.Baba T, Ara T, Hasegawa M, Takai Y, Okumura Y, Baba M, Datsenko KA, Tomita M, Wanner BL and Mori H Construction of Escherichia coli K‐12 in‐frame, single‐gene knockout mutants: the Keio collection. Mol. Syst. Biol 2, 2006–0008 (2006). [DOI] [PMC free article] [PubMed] [Google Scholar]
- 52.Neidhardt FC, Bloch PL and Smith DF Culture medium for enterobacteria. J. Bacteriol 119, 736–747 (1974). [DOI] [PMC free article] [PubMed] [Google Scholar]
- 53.Gibson DG, Young L, Chuang RY, Venter JC, Hutchison CA and Smith HO Enzymatic assembly of DNA molecules up to several hundred kilobases. Nat. Methods 6, 343–345 (2009). [DOI] [PubMed] [Google Scholar]
- 54.Frazzon J and Dean DR Formation of iron–sulfur clusters in bacteria: an emerging field in bioinorganic chemistry. Curr. Opin. Chem. Biol 7 166–173 (2003). [DOI] [PubMed] [Google Scholar]
- 55.Edwards A and Haas W Multiplexed quantitative proteomics for high-throughput comprehensive proteome comparisons of human cell lines. In Proteomics in Systems Biology (Humana Press, New York, NY, 2016). [DOI] [PubMed] [Google Scholar]
- 56.Eng JK, McCormack AL & Yates JR An approach to correlate tandem mass spectral data of peptides with amino acid sequences in a protein database. J. Am. Soc. Mass Spec 5, 976–989 (1994). [DOI] [PubMed] [Google Scholar]
- 57.Tabb DL, McDonald WH & Yates JR DTASelect and Contrast: tools for assembling and comparing protein identifications from shotgun proteomics. J. Proteome Res 1, 21–26 (2002). [DOI] [PMC free article] [PubMed] [Google Scholar]
- 58.Käll L, Canterbury JD, Weston J, Noble WS and MacCoss MJ Semi-supervised learning for peptide identification from shotgun proteomics datasets. Nat. Methods 4 923–925 (2007). [DOI] [PubMed] [Google Scholar]
- 59.Qian Y, Martell J, Pace NJ, Ballard TE, Johnson DS and Weerapana E An isotopically tagged azobenzene-based cleavable linker for quantitative proteomics. Chembiochem 14, 1410–1414 (2013). [DOI] [PubMed] [Google Scholar]
- 60.Bak DW, Pizzagalli MD, and Weerapana E Identifying Functional Cysteine Residues in the Mitochondria. ACS Chem. Biol 12, 947–957 (2017). [DOI] [PMC free article] [PubMed] [Google Scholar]
Associated Data
This section collects any data citations, data availability statements, or supplementary materials included in this article.
Supplementary Materials
Data Availability Statement
Mass-spectrometry proteomics data for this study have been deposited in ProteomeXchange via the PRIDE partner repository with the dataset identifier PXD026488. Databases used for MS/MS searches against the E. coli proteome were obtained from the Uniprot Protein Knowledgebase (UniProtKB) at www.uniprot.org. Source data are provided with this manuscript.