

Abstract
Background:
A putative role for iron in driving Alzheimer’s disease (AD) progression is complicated by previously reported associations with neuroinflammation, apolipoprotein E and AD proteinopathy. To establish how iron interacts with clinicopathological features of AD and at what disease stage iron influences cognitive outcomes, we investigated the association of CSF biomarkers of iron (ferritin), inflammation (acute phase response proteins) and apolipoproteins with pathological biomarkers (CSF Aβ42/t-tau, p-tau181), clinical staging, and longitudinal cognitive deterioration in subjects from the BioFINDER cohort, with replication of key results in the Alzheimer’s Disease Neuroimaging Initiative (ADNI) cohort.
Methods:
Ferritin, acute phase response proteins (n=9) and apolipoproteins (n=6) were measured in CSF samples from BioFINDER (n=1239; 4-years cognitive follow-up) participants stratified by cognitive status (Cognitively Unimpaired, Mild Cognitive Impairment, Alzheimer’s Disease) and for the presence of amyloid and tangle pathology using CSF Aβ42/t-tau (A+) and p-tau181 (T+). The ferritin and apolipoprotein E associations were replicated in the ADNI (n=264) cohort.
Results:
In both cohorts, ferritin and apoE were elevated in A−T+ and A+T+ subjects (16–40%), but not clinical diagnosis. Other apolipoproteins and acute phase response proteins increased with clinical diagnosis, not pathology. CSF ferritin was positively associated with p-tau181, which was mediated by apolipoprotein E. An optimized threshold of ferritin predicted cognitive deterioration in Mild Cognitive Impairment subjects in the BioFINDER cohort, especially those people classified as A−T− and A+T−.
Conclusions:
CSF markers of iron and neuroinflammation have distinct associations with disease stages, while iron may be more intimately associated with apolipoprotein E and tau pathology.
Keywords: Iron, Ferritin, apolipoprotein E, Alzheimer’s disease, inflammation
Introduction
Brain iron burden is a co-pathology increasingly implicated in Alzheimer’s disease (AD) pathogenesis; higher iron burden can promote inflammation or lipid peroxidation, which signals the regulated cell death pathway, ferroptosis1. Brain iron levels assayed both by ferritin (the major iron storage biomarker) in CSF2–5, by Quantitative Susceptibility Mapping-MRI6, or directly measured post mortem7 8, predict longitudinal cognitive deterioration and brain atrophy in people within the AD clinical spectrum.
Iron also has both physiological and pathological associations with the canonical AD proteins: Aβ and the amyloid precursor protein (APP), tau, and apolipoprotein E (apoE – protein; APOE – gene). APP and tau have been reported to have physiological roles in neuronal iron homeostasis9–14. In neuropathological and neuroimaging surveys, brain iron levels have been reported as associating with plaque and tangle pathology6 7 15–18. We previously identified an unexpected positive correlation between CSF apoE and ferritin levels2. We also found that CSF ferritin was elevated in carriers of the AD risk allele, APOE ε4. Higher MRI-determined brain iron has been reported in APOE ε4 carriers in some studies19, but not others6 20, while APOE ε4 genotype has been shown to influence the impact of iron on synchronized default mode network activity21.
Iron neurochemistry is linked to neuroinflammation, which is implicated in the natural history of AD by uncertain mechanisms. Most22–29, but not all30 31 studies of translocator protein (TSPO) PET ligand (which reports activated glia) describe increased uptake in AD and MCI subjects. Yet, PET-determined Aβ plaque has been reported consistently as not positively associated with TSPO 23 27 31. In agreement, we found that acute phase response proteins in CSF (including α1-antichymotrypsin, α1-antitrypsin, ceruloplasmin, C-reactive protein, complement C3, ferritin, α-, β-, γ-fibrinogens, haptoglobin, hemopexin), as reporters of pro-inflammatory microglia, were not associated with amyloid burden, but were increased with clinical diagnosis32.
Several acute phase response proteins have functional roles in iron regulation. These include ceruloplasmin (required for cellular iron export), ferritin, haptoglobin and hemopexin (bind and clear iron-rich hemoglobin and heme, respectively), and lactoferrin (binds and transports extracellular iron). Iron sequestration from extracellular fluid into cells is an innate immune maneuver to deprive pathogens of iron nutrition33,thus, activated microglia retain iron34–36. Indeed a subset of microglia that are infiltrated by plaque were recently characterized as particularly enriched with ferritin and iron in AD cases37. Conversely, iron promotes the NALP3-inflammasome as well as Aβ-induced activation of IL-1β38. But the role of iron in AD neuroinflammation is uncertain.
Since iron is associated with other putative causative factors of AD such as neuroinflammation34–37, proteinopathy (amyloid plaque, neurofibrillary tangles are enriched with iron6 7 15–18), or apolipoprotein E2 19 39, iron might be epiphenomenal to other principal lesions. To test the hypothesis that iron is a co-pathology of AD that acts independently on disease progression we used biomarkers of iron (CSF ferritin), inflammation (CSF acute phase response proteins), proteopathy (CSF Aβ42, total-tau, p-tau181) and APOE (CSF protein levels and ε4 genotype) to explore: (1) changes in ferritin during the clinicopathology staging of AD, (2) associations of ferritin with other biomarker and clinical variables, and (3) the performance of ferritin against other biomarkers in predicting longitudinal disease outcomes according to disease stage in the BioFINDER cohort, with replication in the Alzheimer’s Disease Neuroimaging Initiative (ADNI) cohort where data availability allowed.
Methods
BioFINDER Cohort
We included Cognitively Unimpaired participants (CU; n=788) and patients with Mild Cognitive Impairment (MCI) (n=263) and AD dementia (n=188) from the BioFINDER study. Participants underwent a medical history, complete neurologic examination, neuropsychological testing and lumbar puncture. Subjects or their legal representatives signed an Institutional Review Board-approved informed consent form before taking part in the study (Regional Ethics Committee in Lund, Sweden:2016-120-32). The inclusion and exclusion criteria are described in the Supplementary Methods.
The characteristics of the study participants are given in Table 1. Subjects were assessed with MMSE and Clinical Dementia Rating Scale, sum of boxes (CDR-SB) at baseline, annually for 4 years (subjective cognitive decline and MCI subjects) or every second year (CU subjects without subjective cognitive decline). The N at each timepoint is displayed in Supplementary Table 1. The measurement of CSF samples is described in the supplementary methods.
Table 1.
Baseline Demographics of BioFINDER subjects stratified by cognitive severity (CU, MCI, AD) and biomarker (A+/− and T+/−) criteria.
| Dx | CU | MCI | AD | |||||||||
|---|---|---|---|---|---|---|---|---|---|---|---|---|
|
| ||||||||||||
| A | − | + | − | + | − | + | − | + | − | + | − | + |
| T | − | − | + | + | − | − | + | + | − | − | + | + |
|
| ||||||||||||
| N | 558 | 85 | 22 | 123 | 90 | 34 | 7 | 132 | 9 | 19 | 0 | 160 |
| Age: Mean (SD) | 70.3 (5.8) | 72.6 (4.8) | 75.5 (7.1) | 72.9 (5.2) | 69.0 (5.7) | 72.3 (5.2) | 69.7 (4.5) | 72.1 (5.0) | 75.0 (7.1) | 78.3 (4.6) | NA | 74.5 (7.4) |
| Female Sex: N (%) | 344 (61.6) | 56 (65.9) | 12 (54.5) | 65 (52.8) | 28 (31.1) | 11 (32.4) | 2 (28.6) | 68 (51.5) | 6 (66.7) | 9 (47.4) | NA | 104 (65.0) |
| APOE ε4+ve: N (%) | 135 (24.4) | 44 (52.4) | 7 (31.8) | 81 (65.9) | 17 (18.9) | 21 (61.8) | 3 (42.9) | 92 (69.7) | 4 (44.4) | 10 (58.8) | NA | 105 (66.9) |
| Aβ42: mean (SD) | 734 (233) | 371 (137) | 1002 (272) | 374 (119) | 689 (214) | 327 (114) | 961 (343) | 342 (122) | 526 (293) | 255 (110) | NA | 317 (138) |
| t-tau mean (SD) | 275 (74) | 352 (98) | 456 (101) | 551 (190) | 265 (76) | 358 (120) | 430 (136) | 571 (209) | 282 (97) | 386 (154) | NA | 648 (206) |
| Aβ42/t-tau: mean (SD) | 0.13 (0.02) | 0.08 (0.02) | 0.11 (0.02) | 0.06 (0.02) | 0.13 (0.02) | 0.08 (0.03) | 0.11 (0.03) | 0.06 (0.02) | 0.13 (0.03) | 0.09 (0.03) | NA | 0.06 (0.02) |
| p-tau181: mean (SD) | 35.1 (9.9) | 44.7 (10.7) | 71.4 (14.7) | 100.2 (37.1) | 34.5 (9.8) | 43.2 (11.3) | 77.8 (13.2) | 115.1 (43.3) | 37.5 (11.1) | 37.2 (12.2) | NA | 128.3 (42.6) |
| CDR-SB: mean (SD) | 0.15 (0.41) | 0.09 (0.29) | 0.00 (0.00) | 0.32 (0.54) | 1.34 (0.95) | 1.45 (0.87) | 1.00 (0.58) | 1.48 (0.97) | NA (NA) | NA (NA) | NA | NA (NA) |
| MMSE: mean (SD) | 29.0 (1.1) | 29.0 (1.0) | 28.9 (1.1) | 28.5 (1.3) | 27.6 (1.8) | 27.2 (2.0) | 26.7 (2.2) | 26.6 (1.6) | 19.6 (5.1) | 22.0 (4.6) | NA | 21.0 (3.9) |
Values of Aβ42, t-tau and p-tau181 are in pg/ml.
ADNI Cohort
Data were obtained from the Alzheimer’s Disease Neuroimaging Initiative (ADNI) database (adni.loni.usc.edu; 09/06/2019). ADNI was launched in 2003 as a public-private partnership, led by Principal Investigator Michael W. Weiner. The primary goal of ADNI has been to test whether serial MRI, PET, other biological markers, and clinical and neuropsychological assessment can be combined to measure the progression of MCI and early AD.
The study received prior approval by Institutional Review Boards of the study sites. Informed consent was obtained from each subject. The ADNI study protocols and patient inclusion criteria have been reported previously2. Subject demographics are reported in Supplementary Table 4. The measurement of CSF samples is described in the supplementary methods.
Statistics
Baseline demographics of participants included in this study were described in strata of CU, MCI and AD diagnosis (determined clinically, described above) as well as A+ and T+ criteria using previously published thresholds, respectively, for CSF Aβ42/t-tau and p-tau181 for BioFINDER40 and ADNI41 cohorts. The acute phase proteins and apolipoproteins were log and Z transformed. Ferritin and apoE levels were used in the primary analysis; unadjusted P-values are reported, but the Bonferroni-adjusted alpha is noted in the table legends and text. The other acute phase response proteins and lipoproteins were used in exploratory analysis, therefore, correction for multiple comparisons was not performed. Factors associated with each of the CSF proteins were analyzed using separate multiple linear regressions with the following covariates: age, sex, APOE ε4 genotype, and either A&T stratification or cognitive status (CU, MCI, AD). Multiple regressions of each CSF protein included the following additional covariates: age, sex, and APOE ε4. Mixed effects models of CDR-SB or MMSE were constructed for CU and MCI subjects in strata of A± and T±, and included the following variables: age, sex, APOE ε4 and the CSF protein of interest. Due to insufficient N we did not model A−T+ subjects (of any clinical status) or AD dementia subjects in BioFINDER. For the same reason we did not perform longitudinal modelling in ADNI subjects. Data were not imputed if missing. Models were performed with R (version 4.03).
Results
1. CSF ferritin and apoE levels are markedly elevated in T+ subjects.
Similar to our previous report32 in the BioFINDER cohort, CSF ferritin varied little with cognitive status (CU, MCI, AD dementia) in a multiple regression model including cognitive status, age, sex, and APOE ε4 (Figure 1A, Table 2 – values, Supplementary Table 2 - statistics). Ferritin was elevated to 11.6 ng/ml in AD dementia subjects compared to 10.2 ng/ml in CU, which was at the threshold of significance (P=0.05). But, when the cohort was categorized by A/T grouping, ferritin was markedly increased in A−T+ (β[S.E.]=0.621 [0.183]; P=0.001), and A+T+ (β[S.E.]=0.426 [0.068]; P=3.3×10⁻¹¹) subjects compared to A−T− (Figure 1B, Table 3 – values, Supplementary Table 3 - statistics). The trend for ferritin to be elevated in T+ subjects was observed in each diagnostic category, albeit with few subjects in some of the categories when grouped in this way (Supplementary Table 4).
Figure 1. Ferritin and apoE levels in BioFINDER subjects.
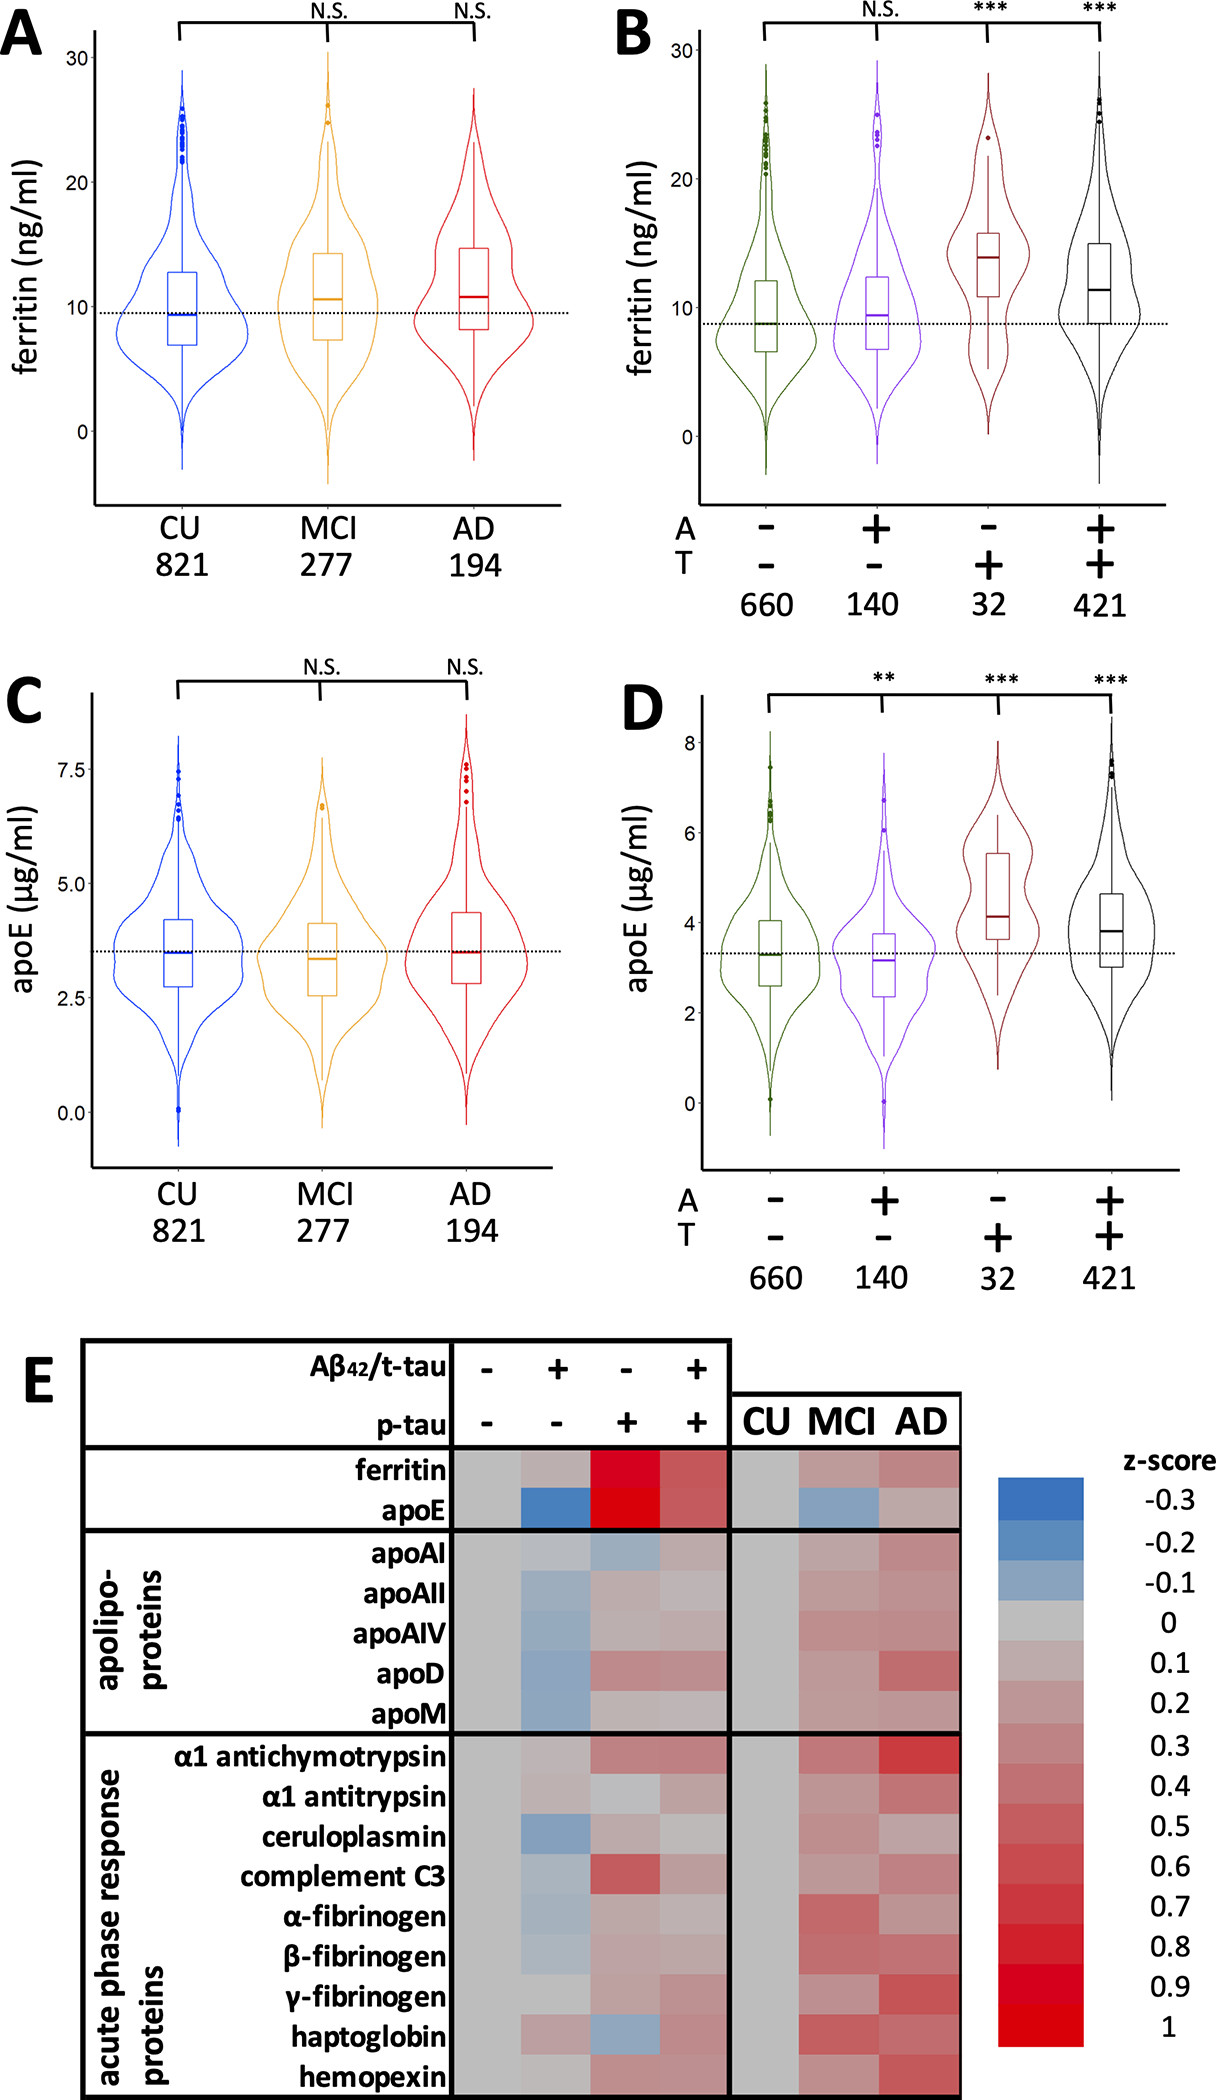
(A&B) Violin plots of CSF ferritin (A) stratified by cognitive status and (B) A&T criteria. (C&D) Violin plots of CSF apoE (C) stratified by cognitive status and (D) A&T criteria. Statistics are from multiple regression models including age, sex, APOE ε4, apoE, ferritin, and either cognitive status or A&T criteria, where **P<0.01; ***P<0.001. (E) Heat map of changes in apoE, ferritin, and other apolipoproteins and acute phase response proteins in subjects stratified by either cognitive status or A&T criteria.
Table 2.
Comparison of changes in CSF apoE and ferritin with other apolipoproteins and acute phase proteins across clinical diagnosis in the BioFINDER cohort.
| CU | MCI | AD | ||||||||
|---|---|---|---|---|---|---|---|---|---|---|
| Mean | S.D. | P | Mean | S.D. | P | Mean | S.D. | P | ||
|
| ||||||||||
| apolipoproteins | apoE | 3.53 | (1.13) | NA | 3.41 | (1.18) | 0.092 | 3.66 | (1.33) | 0.625 |
| apoAI | 2.56 | (1.32) | NA | 2.73 | (1.42) | 0.422 | 2.92 | (1.48) | 0.007 | |
| apoAII | 0.42 | (0.23) | NA | 0.46 | (0.26) | 0.263 | 0.47 | (0.26) | 0.016 | |
| apoAIV | 0.23 | (0.12) | NA | 0.26 | (0.15) | 0.022 | 0.26 | (0.14) | 0.027 | |
| apoD | 2.20 | (0.78) | NA | 2.35 | (0.88) | 0.197 | 2.53 | (0.94) | 5.3×10⁻⁵ | |
| apoM | 10.8 | (8.20) | NA | 12.3 | (9.70) | 0.070 | 12.5 | (9.71) | 0.022 | |
|
| ||||||||||
| acute phase proteins | ferritin | 10.2 | (4.60) | NA | 11.0 | (4.90) | 0.264 | 11.6 | (4.59) | 0.050 |
| α1 antichymotrypsin | 0.87 | (0.39) | NA | 1.01 | (0.48) | 7.8×10⁻⁵ | 1.13 | (0.52) | 2.2×10⁻⁹ | |
| α1 antitrypsin | 3.14 | (1.58) | NA | 3.48 | (1.79) | 0.054 | 3.75 | (1.79) | 3.1×10⁻⁴ | |
| ceruloplasmin | 0.49 | (0.48) | NA | 0.62 | (0.67) | 0.017 | 0.56 | (0.38) | 0.058 | |
| complement C3 | 3.48 | (1.35) | NA | 3.75 | (1.52) | 0.070 | 3.91 | (1.53) | 0.001 | |
| α-fibrinogen | 0.43 | (0.53) | NA | 0.67 | (0.93) | 5.2×10⁻⁵ | 0.55 | (0.43) | 0.001 | |
| β-fibrinogen | 0.17 | (0.19) | NA | 0.24 | (0.30) | 0.001 | 0.24 | (0.21) | 2.5×10⁻⁵ | |
| γ-fibrinogen | 0.14 | (0.09) | NA | 0.16 | (0.10) | 0.008 | 0.19 | (0.12) | 2.0×10⁻⁶ | |
| haptoglobin | 1.47 | (1.43) | NA | 2.18 | (2.13) | 1.1×10⁻⁵ | 2.08 | (2.04) | 0.001 | |
| hemopexin | 3.06 | (1.31) | NA | 3.38 | (1.55) | 0.033 | 3.75 | (1.65) | 1.2×10⁻⁶ | |
The apolipoprotein composite was formed by averaging the Z(log()) transformed variables: apoAI, apoAII, apoAIV, apoD, apoM. The APR composite was formed by averaging the Z(log()) transformed variables: α1 antichymotrypsin, α1 antitrypsin, ceruloplasmin, complement C3, α-, β-, and γ-fibrinogen, haptoglobin and hemopexin. Statistics are from multiple regression models of each of the analytes including age, sex, APOE ε4 gene, and diagnosis as covariates. Protein concentrations are in μg/ml CSF except for ferritin and apoM which are ng/ml. Ferritin and apoE were highlighted as the primary analysis, the other analytes are included as exploratory comparative results. Bold indicates P<0.05.
indicates correction after multiple comparison between the two primary analysis of ferritin and apoE (α/2 = 0.025).
Table 3.
Comparison of changes in CSF apoE and ferritin with other apolipoproteins and acute phase proteins in strata of A and T criteria in the BioFINDER cohort.
| A−T− | A+T− | A−T+ | A+T+ | ||||||||||
|---|---|---|---|---|---|---|---|---|---|---|---|---|---|
| Mean | S.D. | P | Mean | S.D. | P | Mean | S.D. | P | Mean | S.D. | P | ||
|
| |||||||||||||
| apolipoprotein | apoE | 3.34 | (1.08) | NA | 3.07 | (1.09) | 0.003 * | 4.42 | (119) | 1.2×10⁻⁴ * | 3.9 | (1.20) | 8.8×10⁻¹⁴ * |
| apoA-I | 2.61 | (1.35) | NA | 2.59 | (1.40) | 0.280 | 2.52 | (1.26) | 0.473 | 2.75 | (1.39) | 0.279 | |
| apoA-II | 0.43 | (0.24) | NA | 0.42 | (0.23) | 0.140 | 0.45 | (0.26) | 0.746 | 0.44 | (0.24) | 0.846 | |
| apoA-IV | 0.23 | (0.13) | NA | 0.22 | (0.14) | 0.012 | 0.24 | (0.16) | 0.852 | 0.25 | (0.13) | 0.506 | |
| apoD | 2.22 | (0.81) | NA | 2.14 | (0.84) | 0.027 | 2.44 | (0.72) | 0.361 | 2.42 | (0.86) | 0.001 | |
| apoM | 11.4 | (9.27) | NA | 10.5 | (7.13) | 0.672 | 11.9 | (9.95) | 0.931 | 11.8 | (8.65) | 0.275 | |
|
| |||||||||||||
| acute phase proteins | ferritin | 9.66 | (4.45) | NA | 9.99 | (4.47) | 0.701 | 13.59 | (4.95) | 0.001 * | 12.06 | (4.67) | 3.3×10⁻¹¹ * |
| α1 antichymotrypsin | 0.89 | (0.42) | NA | 0.91 | (0.42) | 0.308 | 1.02 | (0.39) | 0.252 | 1.02 | (0.48) | 0.257 | |
| α1 antitrypsin | 3.21 | (1.65) | NA | 3.32 | (1.75) | 0.250 | 3.21 | (1.55) | 0.665 | 3.45 | (1.68) | 0.606 | |
| ceruloplasmin | 0.53 | (0.60) | NA | 0.46 | (0.39) | 0.108 | 0.60 | (0.49) | 0.601 | 0.55 | (0.42) | 0.370 | |
| complement C3 | 3.51 | (1.41) | NA | 3.46 | (1.46) | 0.123 | 4.22 | (1.18) | 0.019 | 3.75 | (1.41) | 0.001 | |
| α-fibrinogen | 0.48 | (0.71) | NA | 0.45 | (0.50) | 0.391 | 0.57 | (0.55) | 0.095 | 0.53 | (0.55) | 0.077 | |
| β-fibrinogen | 0.19 | (0.23) | NA | 0.18 | (0.21) | 0.141 | 0.22 | (0.22) | 0.529 | 0.21 | (0.22) | 5.3×10⁻¹⁰ | |
| γ-fibrinogen | 0.14 | (0.09) | NA | 0.14 | (0.10) | 0.169 | 0.16 | (0.10) | 0.620 | 0.16 | (0.11) | 0.001 | |
| haptoglobin | 1.55 | (1.54) | NA | 1.78 | (1.61) | 0.158 | 1.41 | (1.04) | 0.868 | 1.96 | (2.02) | 0.205 | |
| hemopexin | 3.10 | (1.37) | NA | 3.13 | (1.48) | 0.151 | 3.44 | (142) | 0.395 | 3.43 | (1.51) | 0.362 | |
Statistics are from multiple regression models of each of analyte including age, sex, APOE ε4, and A/T criteria as covariates. Protein concentrations are in μg/ml CSF except for ferritin and apoM which are ng/ml. Ferritin and apoE were highlighted as the primary analysis, the other analytes are included as exploratory comparative results. Bold indicates P<0.05.
indicates correction after multiple comparison between the two primary analysis of ferritin and apoE (α/2 = 0.025).
APOE ε4 status was not associated with ferritin (P>0.05; Supplementary Table 5), and apoE levels did not differ according to diagnosis (Figure 1C, Table 2 – values, Supplementary Table 2 - statistics). Compared to A−T− subjects, apoE levels were decreased in A+T− subjects (β[S.E.]=−0.283 [0.095]; P=0.003), but, like ferritin, were increased in A−T+ subjects (β[S.E.]=0.709; [0.184]; P=1.2×10⁻⁴) and A+T+ subjects (β[S.E.]=0.468 [0.070]; P=8.8×10⁻¹⁴; Figure 1D, Table 3 – values, Supplementary Table 3 - statistics)
Changes in ferritin and apoE were recapitulated in the ADNI cohort (Supplementary Table 6). As previously reported2, neither ferritin nor apoE differed according to diagnosis (assessed in multiple regression models of each of the analytes, including age, sex, APOE ε4 and cognitive status as covariates; Supplementary Figure 1A,C; Supplementary Table 7). But, when analyzed according to A/T criteria, ferritin was increased in A−T+ (β[S.E.]=0.945 [0.375]; P=0.012) and A+T+ subjects (β[S.E.] = 0.445 [0.163]; P=0.007; Supplementary Figure 1B; Supplementary Table 8). ApoE was likewise increased in A−T+ (β[S.E.] = 0.913 [0.347]; P=0.009) and A+T+ subjects (β[S.E.]=0.545 [0.151]; P=0.3.6×10−4; Supplementary Figure 1D).
2. Cross-sectional CSF ferritin and apoE discriminate A/T status while lipoproteins and acute phase proteins discriminate diagnosis
Since the pattern in changes according to the A/T biomarkers was similar for both ferritin and apoE, we explored whether other lipoproteins (ApoA-I, apoA-II, apoA-IV, apoM and apoD) might change similarly. Unlike apoE or ferritin, these additional lipoproteins were modestly elevated in AD compared to CU subjects (0.187<β<0.339; 5.3×10⁻⁵<P<0.027; Figure 1E, Table 2 – values, Supplementary Table 2 - statistics). ApoA-IV was also modestly elevated in MCI subjects (β[S.E.]=0.160 [0.070]; P=0.022). Levels of these lipoproteins were generally not associated with A or T status (Figure 1E, Table 3 - values, Supplementary Table 3 - statistics), except for a decrease in apoA-IV (β[S.E.]=−0.241 [0.095]; P=0.012) and apoD β[S.E.]=−0.208 [0.094]; P=0.027) levels in subjects who were A+T−, and an elevation in apoD in A+T+ subjects (β[S.E.]=0.220 [0.068]; P=0.001). Thus, the association of ferritin and apoE with A/T biomarkers cannot be explained by generalized changes in CSF lipoproteins.
Ferritin is an acute phase response protein, so it is possible that changes in ferritin reflect inflammatory changes and not brain iron burden. We therefore investigated a panel of other CSF acute phase response proteins in the BioFINDER cohort: α1-antichymotrypsin, α1-antitrypsin, ceruloplasmin, complement C3, α-fibrinogen, β-fibrinogen, γ-fibrinogen, haptoglobin and hemopexin. In contrast to ferritin levels, all acute phase response proteins except for α1 antitrypsin and complement C3 were significantly elevated in MCI (0.149<β<0.316; 1.1×10⁻⁵<P<0.033) and, except for ceruloplasmin, in AD dementia (0.271<β<0.499; 2.2×10⁻⁹<P<0.001; Figure 1E; Table 2 -values, Supplementary Table 2– statistics), similar to what we have previously reported32.
Several of the acute phase proteins also varied according to A&T criteria, although these changes were more modest compared to ferritin and apoE (Figure 1E; Table 3 -values, Supplementary Table 3– statistics). In multiple regression models of each analyte (including age, sex, APOE ε4, and A/T criteria covariates), no protein was changed in A+T− subjects, and only complement C3 was changed (increased) in A−T+ subjects (β[S.E.]=0.434 [0.185]; P=0.019). Complement C3 was also elevated in A+T+ subjects, along with γ-fibrinogen and β-fibrinogen (0.173<β<0.186; 5.3×10⁻¹⁰<P<0.001). Therefore, changes in ferritin and apoE were unlikely to be explained by a generalized response of acute phase proteins.
3. Associations between CSF ferritin, apoE, Aβ and tau.
We explored associations between ferritin, apoE, Aβ42/t-tau and p-tau in regressions of all BioFINDER subjects, then separately according to cognitive status. In the BioFINDER cohort, ferritin and apoE were correlated in the overall cohort (Figure 2A, B; partial r2=0.056; P=3.8×10⁻¹⁵) and within each diagnostic category (Supplementary Figure 2A–C), consistent with our previous report of ADNI samples2. Both ferritin (Figure 2C; partial r2=0.038 P=2.0×10⁻¹¹) and apoE (Figure 2D; partial r2=0.069; P=5.3×10⁻¹⁹) levels were correlated with p-tau levels in the overall cohort, and in each clinical category (Supplementary Figure 2D–F; J–L). Ferritin was not associated with Aβ42/t-tau when all subjects were included in the modelling (Figure 2E), or when the diagnostic categories were separately explored (Supplementary Figure 2G–I). ApoE was negatively associated with Aβ42/t-tau in all subjects (Figure 2F; partial r2=0.010; P=5.4×10⁻⁴), but not in any group when stratified by cognitive status (Supplementary Figure 2M–O). When we replicated this analysis in the ADNI cohort, finding that ferritin was again correlated with apoE (partial r2=0.236; P=4.3×10⁻¹⁵), but not in this cohort with p-tau or Aβ42/t-tau (Supplementary Figure 3). ApoE was again correlated with p-tau (partial r2=0.098; P=1.9×10⁻⁸) and, to a lesser extent, Aβ42/t-tau (partial r2=0.045; P=0.027).
Figure 2. Correlations between ferritin, apoE, p-tau and Aβ42/t-tau in subjects from the BioFINDER cohort, and mediation analysis.
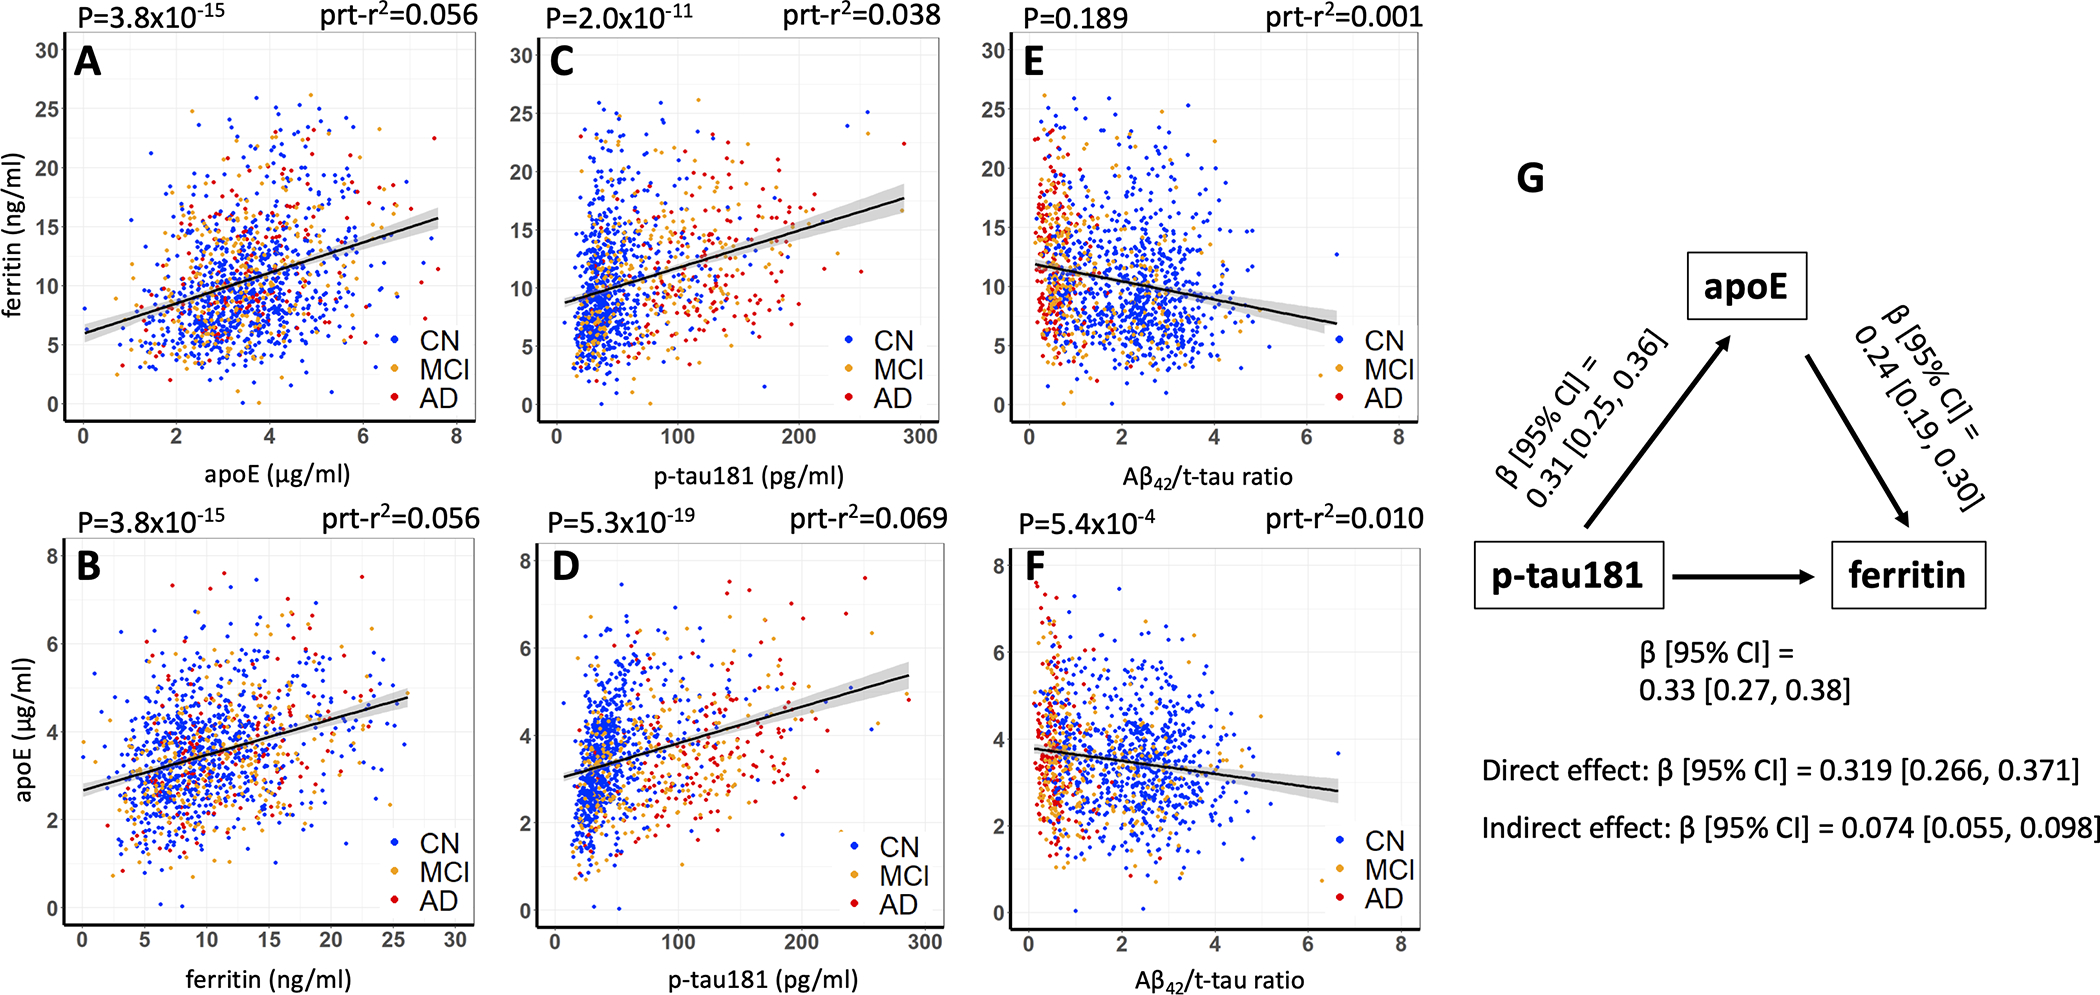
Figures A and B are the same data that are alternatively presented for ease of comparison. Statistics are from multiple regression model of either ferritin or apoE, including age, sex, APOE ε4, p-tau181, Aβ42/t-tau and either ferritin or apoE. Prt-r2 represents the partial r2.
In prior work measuring iron by in vivo QSM MRI18, or by direct assay in post mortem brain tissue7, we have found evidence that iron promotes neurodegeneration downstream of tangle pathology in the natural history of AD. Since ferritin was associated with both p-tau (β [95% CI]=0.33 [0.27, 0.38]) and apoE (β [95% CI]=0.24, [0.19, 0.30]), we tested whether apoE mediated the association between p-tau and ferritin in the BioFINDER cohort. Indeed, we found that the indirect effect between p-tau and ferritin was significant (β [95% CI]=0.074 [0.055, 0.098]), indicating partial mediation of the relationship between p-tau and ferritin by apoE (Figure 2G). This underscores a neurochemical relationship between brain iron burden, reflected by CSF ferritin, and the canonical AD proteins, apoE and p-tau.
4. Predicting cognitive decline using ferritin and related biomarkers in different disease stages
We next investigated whether baseline ferritin or apoE predicted clinical deterioration on the CDR-SB scale over 4 years of annual follow up of the BioFINDER subjects (Supplementary Table 1 for N). Change in MMSE was additionally used as an outcome variable in secondary analysis. Baseline ferritin predicted increased CDR-SB score (deterioration) when tested in mixed-effects models in MCI (β[S.E.]=0.179 [0.043]; P=2.8×10⁻⁵) but not CU subjects (Figure 3A&B; Supplementary Table 9). Within the MCI cohort, baseline ferritin predicted CDR-SB deterioration in A−T− (Figure 3D; β[S.E.]=0.228 [0.089]; P=0.011) and, most prominently, A+T− (Figure 3F; β[S.E.]=0.633 [0.141]; P=2.0×10⁻⁵), but not A+T+. Among CU subjects, the only category where ferritin was significantly predictive was in A+T+ subjects, where it predicted improvement in CDR-SB (β[SE]=−0.176 [0.068]; P=0.010).
Figure 3. Baseline CSF analytes predict longitudinal deterioration on CDR-SB in BioFINDER subjects.
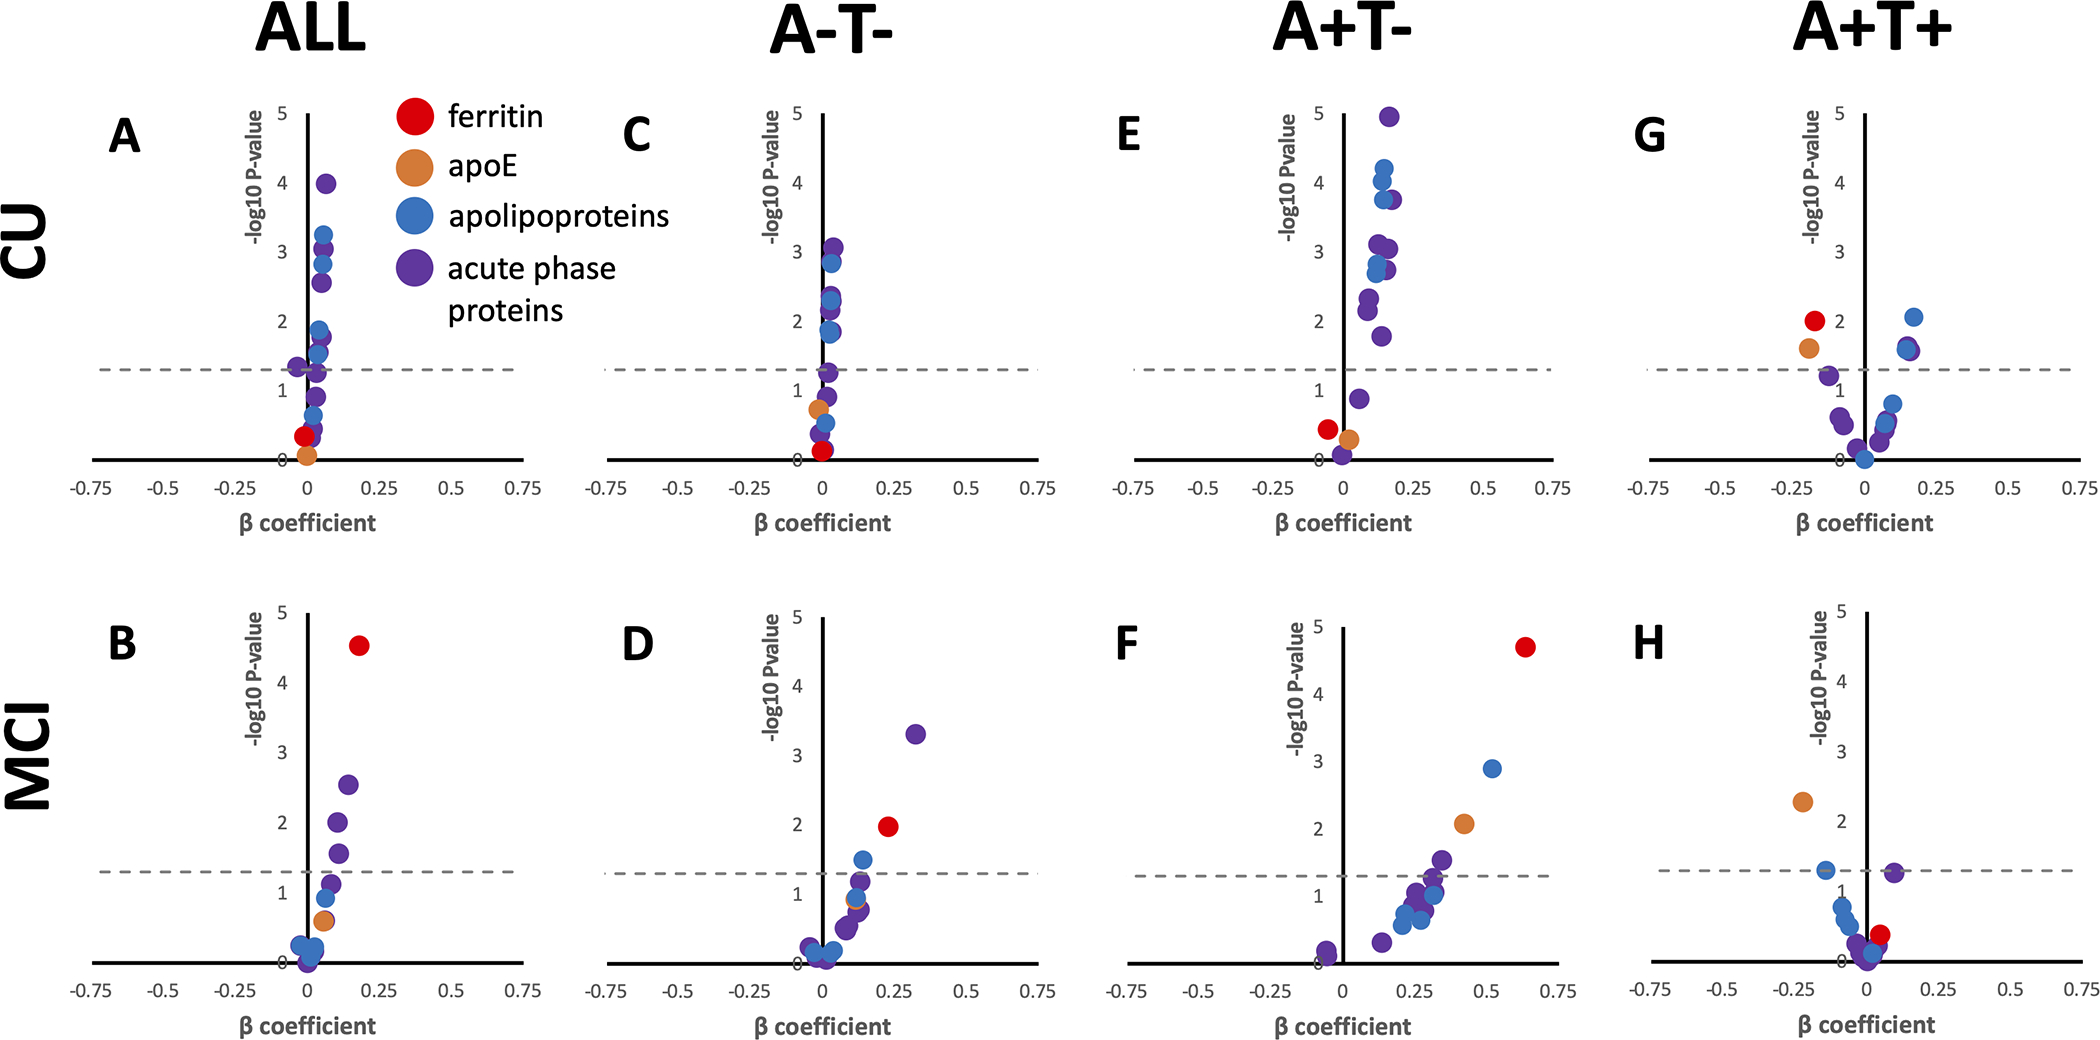
Volcano plots for the β coefficient and P-values (−log10 for visual display) of the interaction between each analyte and time in separate mixed effects linear models including the following additional variables: age, sex, APOE ε4. Positive β signifies that higher values of the analyte are associated with worsening performance (faster accumulated score on CDR-SB), negative β signifies that lower values of the analyte are associated with worsening performance. Acute phase response proteins and apolipoproteins are grouped for visual display, actual statistics for each variable can be found in Supplementary Table 7. Above the dotted line represents P<0.05.
When MMSE was used as the cognitive outcome variable our results were similar to that of the CDR-SB models; baseline ferritin predicted decline in all MCI subjects, and in A+T− subjects, but predicted improvement (as did apoE, see below) in A+T+ CU subjects (Supplementary Table 9).
Baseline apoE levels did not predict change in CDR-SB in either CU or MCI unless additionally stratified by A/T criteria (Figure 3A&B; Supplementary Table 9). But upon stratifying by A/T criteria, apoE predicted CDR-SB deterioration in A+T− MCI subjects (Figure 3F; β[S.E.]=0.420 [0.156]; P= 0.008), like ferritin. In both CU and MCI subjects that were designated A+T+, apoE predicted improvement in CDR-SB (Figure 3G&H; CU: β[S.E.]=−0.195 [0.086]; P=0.025; MCI β[S.E.]=−0.222 [0.079]; P=0.005). When using MMSE as the outcome variable, apoE was also associated with improvement on this scale in CU A+T+ subjects (β[S.E.]=0.268 [0.127]; P=0.036), but not MCI A+T+ subjects. Rather, apoE predicted deterioration on MMSE when all MCI subjects were combined into one group (β[S.E.]=−0.139 [0.065]; P=0.034).
The results relating to ferritin and apoE were unlikely due to a biochemical class effects since the other acute phase proteins and lipoproteins were generally more strongly associated with decline on CDR-SB of CU subjects, and in particular those who were A+T− (Figure 3; Supplementary Table 9) where all proteins were significant predictors of CDR-SB except for haptoglobin and γ-fibrinogen.
To determine whether CSF ferritin could be a useful diagnostic test in tandem with the A/T pathology biomarkers (which already have established pathological thresholds), we defined a pathological threshold of ferritin value (high/low). We stratified the subjects into a series of high/low ferritin dichotomies, which were based on incremental increases in the ferritin threshold beginning at 1 standard deviation below the mean ferritin of the CU group, to 1 standard deviation above the CU mean. We included these groupings, individually, as predictive variables (interacted with time) in a series of mixed effects linear models of CDR-SB in MCI subjects (including age, sex, APOE ε4, apoE). Ferritin was significantly associated with decline with almost every threshold used, but the best performing (determined by highest β and lowest P; Figure 4A) threshold was 12.47 ng/ml ferritin (β[S.E.]=0.492[0.094]; P=9.9×10⁻⁷; Figure 4B), which was almost exactly ½ a standard deviation increase from the mean ferritin values in the CU reference group. So, we designated this category of elevated ferritin “I+”, for high iron (demographics: Supplementary Table 10).
Figure 4. Defining a high ferritin/iron threshold (I+) to predict cognitive decline in BioFINDER MCI cases.
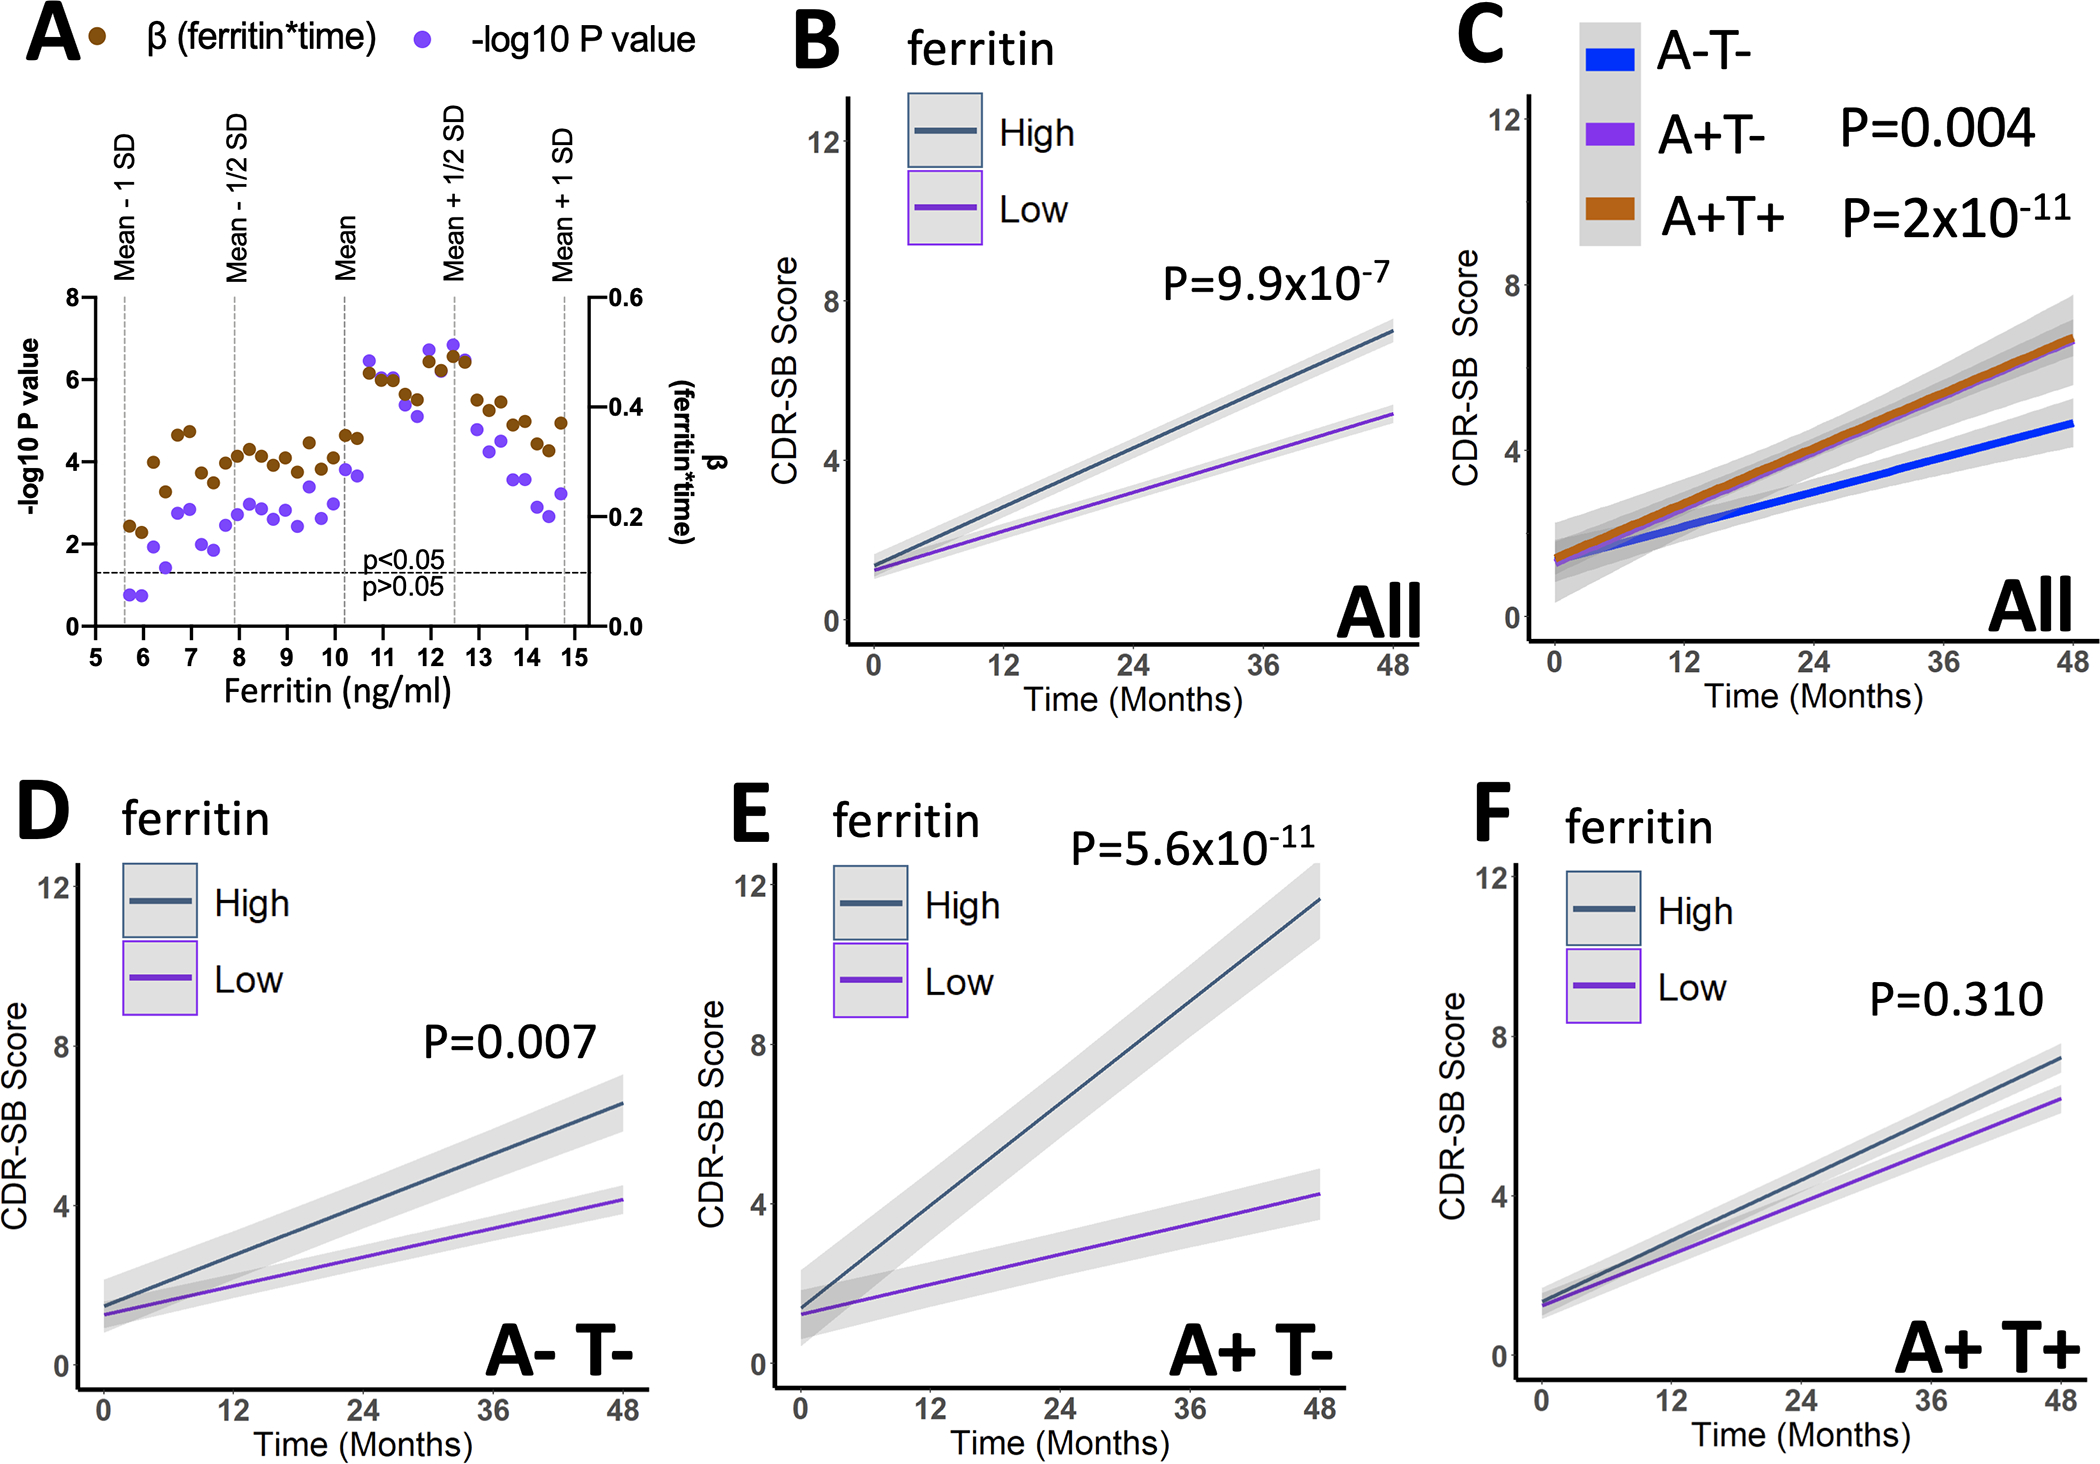
(A) Statistical readouts from time*ferritin (high/low) when included as a variable with increasing ferritin threshold (over ±1SD from the referent mean of CU subjects) value in a series of mixed effects models of longitudinal CDR-SB scores from all MCI subjects. 12.47 ng/ml was the best performing threshold (determined by lowest P-value and highest β), which was almost exactly 0.5 standard deviations above the mean of the CU reference group. Above this threshold was considered high ferritin, or Iron+ (I+) in future analysis. (B&C) Association of A+, T+ and I+ with change in CDR-SB in all MCI subjects. Statistics are from mixed effects models including the additional covariates: age, sex, APOE ε4 gene, and apoE levels. (D-G) Association between I+ and change in CDR-SB in MCI subjects stratified by A&T criteria. Statistics are from mixed effects models including the additional covariates: age, sex, APOE ε4, and apoE levels. Data are means +/− standard error.
The association with I+ and decline on CDR-SB in MCI subjects (Figure 4B) was similar in magnitude to the effect of A+/T− (β[S.E.]=0.362 [0.190]; P=0.004) and A+/T+ (β[S.E.] = 0.659 [0.097]; P=2×10⁻¹¹) categorizations when they were compared to A−T− MCI subjects (Figure 4C). The I+ designation also proved valuable for predicting decline on CDR-SB after stratifying by A/T criteria. I+ predicted accelerated decline in CDR-SB in A−T− subjects (β[S.E.]=0.533 [0.198]; P=0.007; Figure 4D), most prominently in A+T− subjects (β[S.E.]=1.813 [0.277]; P=5.6×10⁻¹¹; Figure 4E) but was not predictive in A+T+ subjects (β[S.E.]=0.119[0.117]; P=0.310; Figure 4F).
Discussion
Here, we report an elevation of CSF ferritin associated with p-tau181 that was significantly mediated by CSF apoE levels, which were likewise elevated in T+ cases. Ferritin and apoE levels did not change according to clinical diagnosis in the BioFINDER cohort, which is similar to our prior findings in the ADNI cohort2. The changes in ferritin and apoE according to A/T criteria that we now report in both ADNI and BioFINDER cohorts differed to all other apolipoproteins and acute phase response proteins that we investigated in the BioFINDER study. We found CSF ferritin predicts accelerated clinical deterioration in MCI subjects, particularly T− subjects, whereas other inflammatory acute phase response proteins associate with cognitive decline in subjects classified as CU at baseline. As will be discussed, these findings provide insight into the pathophysiological mechanisms of AD, the timing of their influence in disease progression, and a potentially clinically useful ferritin threshold for prognostication.
Associations between ferritin and apoE levels and genotype
We previously observed a positive association between CSF apoE and ferritin in the ADNI cohort2, which was replicated in the present study. It has been shown that apoE inhibits the degradation of ferritin by ferritinophagy independent of genotype42, which may mechanistically explain these findings. But in ADNI we also observed that APOE ε4 carriers express elevated CSF ferritin, which was not replicated here. In other studies, APOE ε4 carriers were reported to have higher MRI-reported brain iron levels, which adversely influences the impact of iron on functional MRI21 39 and cognitive decline3. Therefore, the association between apoE and ferritin levels appears to be robust, but an association with APOE ε4 genotype warrants additional validation.
Ferritin and apoE associations with plaque pathology
We have not observed positive associations between cross-sectional tau/Aβ42 and apoE or ferritin in either the current or prior studies5. One factor that may confound the interpretation of ferritin and apoE in CSF is the potential for these proteins to be sequestered into plaque. As plaque increases, Aβ42 levels decrease because the peptide is sequestered into plaque; it is possible that ferritin and apoE may also be sequestered, since they are both resident plaque proteins17 43 44. This would result in a lower level of ferritin and apoE than we would otherwise expect. However, it is impossible to tell from these datasets whether sequestration could account for our findings, or whether these results simply reflect ferritin and apoE status at different disease states/stages. We conclude that ferritin and apoE rise in concert with T+ status, but the lack of elevation of apoE and ferritin in A+ subjects may reflect either the underlying pathophysiology, or sequestration of these proteins in accumulating plaque pathology.
Ferritin and apoE associations with p-tau181 and cognitive decline
We7 18 and others15 16 have reported tau-related iron elevation, which is supported by the current study. However, the association of ferritin and p-tau181 with cognitive decline was complex. Ferritin, but not p-tau181, was predictive of decline in MCI T− subjects despite neither being elevated compared to any other clinicopathology group. Conversely, p-tau181, but not ferritin, was associated with decline in MCI A+T+ subjects even though both ferritin and p-tau181 were elevated in this group. So, while ferritin and p-tau181 are associated in the clinicopathology staging, they represent different facets of disease progression.
Neurofibrillary tangles differ to iron since tangles are an abnormality, whereas iron is endogenously present within the brain. Prior studies have shown that iron acts as a risk factor for cognitive decline in AD, since it associates with disease progression even when not elevated during disease staging2 3 6 8. We observe similar associations in the current study – when MCI subjects are considered as a whole, ferritin predicted decline despite no elevation to ferritin in MCI subjects. The same is true in MCI subjects classified as T− where ferritin levels are likewise unchanged. But in MCI T+ subjects, where ferritin levels are markedly elevated, the degree of variation in ferritin levels within this group may have been insufficient to observe a statistical association with decline. Indeed, in defining a threshold for I+, we used 12.47 ng/mL as the optimum threshold to predict decline – thresholds beyond this value did not provide improved prognostic performance. Yet, this threshold approximated the mean ferritin value of A+T+ =12.06 ng/mL. Thus, the ferritin values in the MCI T+ group may have lacked the variance needed to demonstrate an association with cognitive outcome.
The opposite is likely true for p-tau181. Values of p-tau181 below the defined threshold are unlikely to be associated with tangle pathology since the threshold is used to classify patients with tangle pathology. So it is not surprising that p-tau181 levels are only associated with cognitive decline in people with tangle pathology (above threshold p-tau181 levels). Therefore, while the clinical value of I+ in MCI subjects that are also T+ is not apparent from these data, we show the prognostic value of I+ in T− subjects (which represent 48% of MCI subjects in BioFINDER), where p-tau181 is not associated with decline when used as a continuous variable.
Associations between ferritin, apoE and p-tau181 warrant further mechanistic investigations. ApoE inhibits the degradation of intracellular ferritin via ferritinophagy42 – which may be a mechanism that could explain our current findings. The elevation to ferritin downstream of tau agrees with prior findings that loss of soluble tau – which occurs during the aggregation of the protein in neurofibrillary tangles – limits APP mediated iron export from neurons13. But since neurofibrillary tangles also accumulate iron, it remains to be determined whether the elevation of ferritin downstream of p-tau181 reports iron accumulating with tangle pathology directly, or loss of functional tau that occurs with tau phosphorylation and aggregation that then disables iron export.
It is also possible that the effect of apoE and ferritin on disease outcomes varies according to disease stage. Higher levels of apoE has previously been reported to predict better cognitive outcomes2 45, and we observe this in the current study in both A+T+ CU and MCI subjects. Conversely, higher apoE levels were associated with worse outcomes in MCI A+T− subjects. We don’t believe apoE has been investigated in this specific patient group previously, and this result raises the possibility that apoE has a complex role on disease outcomes, which would require further validation. Similarly, we observed in CU A+T+ subjects that higher ferritin was associated with better cognitive outcomes. Again, we are not aware that ferritin has been tested in this particular patient group previously, but may suggest a complex role for ferritin that varies by disease stage.
Ferritin is distinct to neuroinflammatory changes of the acute phase response
Ferritin, along with several acute phase response proteins, have functional roles in iron regulation. Activated microglia retain iron34–36 and a subset of microglia that are infiltrated by plaque are particularly enriched with ferritin37. Prior to this study it was plausible to interpret CSF ferritin as a part of the acute phase response that reports neuroinflammation rather than iron levels. Yet we reveal that ferritin differs to other acute phase response proteins by elevating according to p-tau181 status, whereas other acute phase proteins elevate with symptomatic progression. Ferritin predicted decline in MCI subjects, whereas acute phase response proteins were more associated with decline in cognitively unimpaired subjects. Our findings agree with research into other neuroinflammation biomarkers, such as PET TSPO, where no or an inverse relationship with amyloid PET is reported23 27 31. Most prior findings regarding TSPO report elevation with clinical diagnosis22–29, which we also observe with acute phase proteins.
Limitations and therapeutic implications
Small samples sizes in the A−T+ group limit our interpretation. Insufficient longitudinal data for AD subjects (regardless of A/T designation) restricts our interpretations to the pre-dementia phase.
We have used CSF ferritin as a biomarker of iron, but acknowledge that this has not been validated against iron in the brain measured post-mortem. The rationale supporting CSF ferritin as a biomarker of brain iron burden is as follows: plasma ferritin is an established biomarker of body iron burden, CSF ferritin is decreased in Restless Legs Syndrome, a disease of low brain iron46 and ferritin expression and secretion from cultured glia is dependent on iron47.
Do these associations have implications for iron or inflammation as therapeutic targets? Associations between acute phase proteins and cognitive deterioration was observed only in cognitively unimpaired subjects, suggesting that therapeutically targeting neuroinflammation might be most effective in the early stages of disease. Preventing brain iron elevation that rises in concert with tau pathology might be effective in slowing disease progression in people who have MCI. Whether there is benefit in targeting iron and inflammation after they have already been induced remains difficult to forecast, since the biomarkers of iron and inflammation we used were not associated with longitudinal decline at the disease stages where they were significantly elevated.
Supplementary Material
What is already known on this topic?
Brain iron is implicated in Alzheimer’s disease, with uncertain pathogenic significance. Iron also associates with clinicopathological features such as proteinopathy, inflammation and APOE, so it is unclear if iron is an independent lesion of Alzheimer’s disease or epiphenomenal.
What this study adds:
By interrogating CSF biomarkers of iron (ferritin), inflammation (acute phase response proteins) and apolipoproteins with pathological biomarkers (CSF Aβ42/t-tau and p-tau181), in a large clinical cohort (with replication of key results in a smaller cohort), we reveal that iron associates with tangle pathology, which is mediated by apolipoprotein E. Iron does not change with clinical severity or with inflammation. Iron, inflammation and tau biomarkers all predict disease progression, but in different disease stages.
How this study might affect research, practice or policy:
We propose criteria for high iron pathology (I+), and in what disease stage this may have clinical utility.
Funding
BioFINDER is funded by the Swedish Research Council, the Knut and Alice Wallenberg foundation, the Marianne and Marcus Wallenberg foundation, the Strategic Research Area MultiPark (Multidisciplinary Research in Parkinson’s disease) at Lund University, the Swedish Alzheimer Foundation, the Swedish Brain Foundation, The Parkinson foundation of Sweden, The Parkinson Research Foundation, the Skåne University Hospital Foundation, and the Swedish federal government under the ALF agreement. Data collection and sharing for this project was funded by ADNI (National Institutes of Health Grant U01 AG024904) and DOD ADNI (Department of Defense award number W81XWH-12-2-0012). ADNI is funded by the National Institute on Aging, the National Institute of Biomedical Imaging and Bioengineering, and through generous contributions from the following: Alzheimer’s Association; Alzheimer’s Drug Discovery Foundation; BioClinica, Inc.; Biogen Idec Inc.; Bristol-Myers Squibb Company; Eisai Inc.; Elan Pharmaceuticals, Inc.; Eli Lilly and Company; F. Hoffmann-La Roche Ltd and its affiliated company Genentech, Inc.; GE Healthcare; Innogenetics, N. V.; IXICO Ltd.; Janssen Alzheimer Immunotherapy Research & Development, LLC.; Johnson & Johnson Pharmaceutical Research & Development LLC.; Medpace, Inc.; Merck & Co., Inc.; Meso Scale Diagnostics, LLC.; NeuroRx Research; Novartis Pharmaceuticals Corporation; Pfizer Inc.; Piramal Imaging; Servier; Synarc Inc.; and Takeda Pharmaceutical Company. The Canadian Institutes of Health Research is providing funds to support ADNI clinical sites in Canada. Private sector contributions are facilitated by the Foundation for the National Institutes of Health (www.fnih.org). The grantee organization is the Northern California Institute for Research and Education, and the study is coordinated by the Alzheimer’s Disease Cooperative Study at the University of California, San Diego. ADNI data are disseminated by the Laboratory for Neuro Imaging at the University of Southern California. This study was supported by a grant from the BAND consortium: Alzheimer’s Association, Westin Brain Institute, Michael J Fox Foundation, Alzheimer’s Research UK. Fellowship support from the National Health & Medical Research Council of Australia. Additional support from the Alzheimer’s Drug Discovery Foundation, the Cooperative Research Centre for Mental Health, and the Victorian Government’s Operational Infrastructure Support Program.
Abbreviations
- Aβ
amyloid beta
- AD
Alzheimer’sADNI: Alzheimer’s disease Neuroimaging Initiative
- apoE
apolipoprotein E
- CDR-SB
clinical dementia rating scale sum of boxes
- CU
cognitively unimpaired
- CSF
cerebrospinal fluid
- SRM
selective reaction monitoring
- MMSE
mini mental state exam
- MS
mass spectrometry
- LC
liquid chromatography
- MCI
mild cognitive impairment
- p-tau
phosphorylated tau
Footnotes
Competing Interests
Dr. Bush is a shareholder in Alterity Ltd, Cogstate Ltd and Mesoblast Ltd. He is a paid consultant for, and has a profit share interest in, Collaborative Medicinal Development Pty Ltd. Dr Hansson has acquired research support (for the institution) from Roche, Pfizer, GE Healthcare, Biogen, Eli Lilly and AVID Radiopharmaceuticals. In the past 2 years, he has received consultancy/speaker fees (paid to the institution) from Biogen and Roche. Dr. Roberts is an inventor on patent application AU2014/00849 for diagnosis of neurological disorders and receives research support from Agilent Technologies, eMSion Inc. and Neurovision.
Research Ethics Approval
The BioFINDER study was approved by the Swedish Ethical Review Authority. The ADNI study received prior approval by Institutional Review Boards of the study sites. Subjects for both studies signed an Institutional Review Board-approved informed consent form before taking part in the study.
Data Availability
Anonymized data will be shared by request from a qualified academic investigator for the sole purpose of replicating procedures and results presented in the article and as long as data transfer is in agreement with EU legislation on the general data protection regulation and decisions by the Ethical Review Board of Sweden and Region Skåne, which should be regulated in a material transfer agreement.
References
- 1.Jakaria M, Belaidi AA, Bush AI, et al. Ferroptosis as a mechanism of neurodegeneration in Alzheimer’s disease. J Neurochem 2021. doi: 10.1111/jnc.15519 [published Online First: 2021/09/24] [DOI] [PubMed] [Google Scholar]
- 2.Ayton S, Faux NG, Bush AI, et al. Ferritin levels in the cerebrospinal fluid predict Alzheimer’s disease outcomes and are regulated by APOE. Nature communications 2015;6:6760. doi: 10.1038/ncomms7760 [published Online First: 2015/05/20] [DOI] [PMC free article] [PubMed] [Google Scholar]
- 3.Ayton S, Faux NG, Bush AI. Association of Cerebrospinal Fluid Ferritin Level With Preclinical Cognitive Decline in APOE-epsilon4 Carriers. JAMA neurology 2017;74(1):122–25. doi: 10.1001/jamaneurol.2016.4406 [published Online First: 2016/11/29] [DOI] [PubMed] [Google Scholar]
- 4.Diouf I, Fazlollahi A, Bush AI, et al. Cerebrospinal fluid ferritin levels predict brain hypometabolism in people with underlying beta-amyloid pathology. Neurobiology of disease 2019;124:335–39. doi: 10.1016/j.nbd.2018.12.010 [published Online First: 2018/12/18] [DOI] [PubMed] [Google Scholar]
- 5.Ayton S, Diouf I, Bush AI, et al. Evidence that iron accelerates Alzheimer’s pathology: a CSF biomarker study. Journal of neurology, neurosurgery, and psychiatry 2018;89(5):456–60. doi: 10.1136/jnnp-2017-316551 [published Online First: 2017/09/25] [DOI] [PubMed] [Google Scholar]
- 6.Ayton S, Fazlollahi A, Bourgeat P, et al. Cerebral quantitative susceptibility mapping predicts amyloid-beta-related cognitive decline. Brain : a journal of neurology 2017;140(8):2112–19. doi: 10.1093/brain/awx137 [published Online First: 2017/09/14] [DOI] [PubMed] [Google Scholar]
- 7.Ayton S, Wang Y, Diouf I, et al. Brain iron is associated with accelerated cognitive decline in people with Alzheimer pathology. Molecular psychiatry 2020;25(11):2932–41. doi: 10.1038/s41380-019-0375-7 [published Online First: 2019/02/20] [DOI] [PMC free article] [PubMed] [Google Scholar]
- 8.Ayton S, Portbury S, Kalinowski P, et al. Regional brain iron associated with deterioration in Alzheimer’s disease: A large cohort study and theoretical significance. Alzheimer’s & Dementia 2021;17(7):1244–56. doi: 10.1002/alz.12282 [published Online First: 2021/01/26] [DOI] [PMC free article] [PubMed] [Google Scholar]
- 9.Takahashi M, Dore S, Ferris CD, et al. Amyloid precursor proteins inhibit heme oxygenase activity and augment neurotoxicity in Alzheimer’s disease. Neuron 2000;28(2):461–73. doi: 10.1016/s0896-6273(00)00125-2 [published Online First: 2001/01/06] [DOI] [PubMed] [Google Scholar]
- 10.Duce JA, Tsatsanis A, Cater MA, et al. Iron-export ferroxidase activity of beta-amyloid precursor protein is inhibited by zinc in Alzheimer’s disease. Cell 2010;142(6):857–67. doi: 10.1016/j.cell.2010.08.014 [published Online First: 2010/09/08] [DOI] [PMC free article] [PubMed] [Google Scholar]
- 11.Dlouhy AC, Bailey DK, Steimle BL, et al. Fluorescence resonance energy transfer links membrane ferroportin, hephaestin but not ferroportin, amyloid precursor protein complex with iron efflux. The Journal of biological chemistry 2019;294(11):4202–14. doi: 10.1074/jbc.RA118.005142 [published Online First: 2019/01/17] [DOI] [PMC free article] [PubMed] [Google Scholar]
- 12.Tsatsanis A, Wong BX, Gunn AP, et al. Amyloidogenic processing of Alzheimer’s disease beta-amyloid precursor protein induces cellular iron retention. Molecular psychiatry 2020;25(9):1958–66. doi: 10.1038/s41380-020-0762-0 [published Online First: 2020/05/24] [DOI] [PubMed] [Google Scholar]
- 13.Lei P, Ayton S, Finkelstein DI, et al. Tau deficiency induces parkinsonism with dementia by impairing APP-mediated iron export. Nature medicine 2012;18(2):291–5. doi: 10.1038/nm.2613 [published Online First: 2012/01/31] [DOI] [PubMed] [Google Scholar]
- 14.Ayton S, Lei P, Hare DJ, et al. Parkinson’s disease iron deposition caused by nitric oxide-induced loss of beta-amyloid precursor protein. The Journal of neuroscience : the official journal of the Society for Neuroscience 2015;35(8):3591–7. doi: 10.1523/JNEUROSCI.3439-14.2015 [published Online First: 2015/02/27] [DOI] [PMC free article] [PubMed] [Google Scholar]
- 15.van Duijn S, Bulk M, van Duinen SG, et al. Cortical Iron Reflects Severity of Alzheimer’s Disease. Journal of Alzheimer’s disease : JAD 2017;60(4):1533–45. doi: 10.3233/JAD-161143 [published Online First: 2017/10/31] [DOI] [PMC free article] [PubMed] [Google Scholar]
- 16.Smith MA, Harris PL, Sayre LM, et al. Iron accumulation in Alzheimer disease is a source of redox-generated free radicals. Proceedings of the National Academy of Sciences of the United States of America 1997;94(18):9866–8. doi: 10.1073/pnas.94.18.9866 [published Online First: 1997/09/02] [DOI] [PMC free article] [PubMed] [Google Scholar]
- 17.Everett J, Lermyte F, Brooks J, et al. Biogenic metallic elements in the human brain? Sci Adv 2021;7(24) doi: 10.1126/sciadv.abf6707 [published Online First: 2021/06/11] [DOI] [PMC free article] [PubMed] [Google Scholar]
- 18.Spotorno N, Acosta-Cabronero J, Stomrud E, et al. Relationship between cortical iron and tau aggregation in Alzheimer’s disease. Brain : a journal of neurology 2020;143(5):1341–49. doi: 10.1093/brain/awaa089 [published Online First: 2020/04/25] [DOI] [PMC free article] [PubMed] [Google Scholar]
- 19.van Bergen JM, Li X, Hua J, et al. Colocalization of cerebral iron with Amyloid beta in Mild Cognitive Impairment. Sci Rep 2016;6:35514. doi: 10.1038/srep35514 [published Online First: 2016/10/18] [DOI] [PMC free article] [PubMed] [Google Scholar]
- 20.Bulk M, Kenkhuis B, van der Graaf LM, et al. Postmortem T2*- Weighted MRI Imaging of Cortical Iron Reflects Severity of Alzheimer’s Disease. Journal of Alzheimer’s disease : JAD 2018;65(4):1125–37. doi: 10.3233/JAD-180317 [published Online First: 2018/08/15] [DOI] [PMC free article] [PubMed] [Google Scholar]
- 21.Kagerer SM, van Bergen JMG, Li X, et al. APOE4 moderates effects of cortical iron on synchronized default mode network activity in cognitively healthy old-aged adults. Alzheimers Dement (Amst) 2020;12(1):e12002. doi: 10.1002/dad2.12002 [published Online First: 2020/03/27] [DOI] [PMC free article] [PubMed] [Google Scholar]
- 22.Edison P, Archer HA, Gerhard A, et al. Microglia, amyloid, and cognition in Alzheimer’s disease: An [11C](R)PK11195-PET and [11C]PIB-PET study. Neurobiology of disease 2008;32(3):412–9. doi: 10.1016/j.nbd.2008.08.001 [published Online First: 2008/09/13] [DOI] [PubMed] [Google Scholar]
- 23.Yokokura M, Mori N, Yagi S, et al. In vivo changes in microglial activation and amyloid deposits in brain regions with hypometabolism in Alzheimer’s disease. European journal of nuclear medicine and molecular imaging 2011;38(2):343–51. doi: 10.1007/s00259-010-1612-0 [published Online First: 2010/09/17] [DOI] [PubMed] [Google Scholar]
- 24.Cagnin A, Brooks DJ, Kennedy AM, et al. In-vivo measurement of activated microglia in dementia. Lancet 2001;358(9280):461–7. doi: 10.1016/S0140-6736(01)05625-2 [published Online First: 2001/08/22] [DOI] [PubMed] [Google Scholar]
- 25.Tomasi G, Edison P, Bertoldo A, et al. Novel reference region model reveals increased microglial and reduced vascular binding of 11C-(R)-PK11195 in patients with Alzheimer’s disease. Journal of nuclear medicine : official publication, Society of Nuclear Medicine 2008;49(8):1249–56. doi: 10.2967/jnumed.108.050583 [published Online First: 2008/07/18] [DOI] [PubMed] [Google Scholar]
- 26.Okello A, Edison P, Archer HA, et al. Microglial activation and amyloid deposition in mild cognitive impairment: a PET study. Neurology 2009;72(1):56–62. doi: 10.1212/01.wnl.0000338622.27876.0d [published Online First: 2009/01/06] [DOI] [PMC free article] [PubMed] [Google Scholar]
- 27.Kreisl WC, Lyoo CH, McGwier M, et al. In vivo radioligand binding to translocator protein correlates with severity of Alzheimer’s disease. Brain : a journal of neurology 2013;136(Pt 7):2228–38. doi: 10.1093/brain/awt145 [published Online First: 2013/06/19] [DOI] [PMC free article] [PubMed] [Google Scholar]
- 28.Varrone A, Oikonen V, Forsberg A, et al. Positron emission tomography imaging of the 18-kDa translocator protein (TSPO) with [18F]FEMPA in Alzheimer’s disease patients and control subjects. European journal of nuclear medicine and molecular imaging 2015;42(3):438–46. doi: 10.1007/s00259-014-2955-8 [published Online First: 2014/11/22] [DOI] [PubMed] [Google Scholar]
- 29.Suridjan I, Pollock BG, Verhoeff NP, et al. In-vivo imaging of grey and white matter neuroinflammation in Alzheimer’s disease: a positron emission tomography study with a novel radioligand, [18F]-FEPPA. Molecular psychiatry 2015;20(12):1579–87. doi: 10.1038/mp.2015.1 [published Online First: 2015/02/25] [DOI] [PMC free article] [PubMed] [Google Scholar]
- 30.Schuitemaker A, Kropholler MA, Boellaard R, et al. Microglial activation in Alzheimer’s disease: an (R)-[(1)(1)C]PK11195 positron emission tomography study. Neurobiology of aging 2013;34(1):128–36. doi: 10.1016/j.neurobiolaging.2012.04.021 [published Online First: 2012/07/31] [DOI] [PubMed] [Google Scholar]
- 31.Wiley CA, Lopresti BJ, Venneti S, et al. Carbon 11-labeled Pittsburgh Compound B and carbon 11-labeled (R)-PK11195 positron emission tomographic imaging in Alzheimer disease. Archives of neurology 2009;66(1):60–7. doi: 10.1001/archneurol.2008.511 [published Online First: 2009/01/14] [DOI] [PMC free article] [PubMed] [Google Scholar]
- 32.Ayton S, Janelidze S, Roberts B, et al. Acute phase markers in CSF reveal inflammatory changes in Alzheimer’s disease that intersect with pathology, APOE epsilon4, sex and age. Prog Neurobiol 2021;198:101904. doi: 10.1016/j.pneurobio.2020.101904 [published Online First: 2020/09/04] [DOI] [PubMed] [Google Scholar]
- 33.Wessling-Resnick M Iron homeostasis and the inflammatory response. Annual review of nutrition 2010;30:105–22. doi: 10.1146/annurev.nutr.012809.104804 [published Online First: 2010/04/28] [DOI] [PMC free article] [PubMed] [Google Scholar]
- 34.Heneka MT, Carson MJ, El Khoury J, et al. Neuroinflammation in Alzheimer’s disease. Lancet neurology 2015;14(4):388–405. doi: 10.1016/S1474-4422(15)70016-5 [published Online First: 2015/03/21] [DOI] [PMC free article] [PubMed] [Google Scholar]
- 35.McIntosh A, Mela V, Harty C, et al. Iron accumulation in microglia triggers a cascade of events that leads to altered metabolism and compromised function in APP/PS1 mice. Brain Pathol 2019;29(5):606–21. doi: 10.1111/bpa.12704 [published Online First: 2019/01/21] [DOI] [PMC free article] [PubMed] [Google Scholar]
- 36.Shahidehpour RK, Higdon RE, Crawford NG, et al. Dystrophic microglia are associated with neurodegenerative disease and not healthy aging in the human brain. Neurobiology of aging 2021;99:19–27. doi: 10.1016/j.neurobiolaging.2020.12.003 [published Online First: 2021/01/11] [DOI] [PMC free article] [PubMed] [Google Scholar]
- 37.Kenkhuis B, Somarakis A, de Haan L, et al. Iron loading is a prominent feature of activated microglia in Alzheimer’s disease patients. Acta neuropathologica communications 2021;9(1):27. doi: 10.1186/s40478-021-01126-5 [published Online First: 2021/02/19] [DOI] [PMC free article] [PubMed] [Google Scholar]
- 38.Nnah IC, Lee CH, Wessling-Resnick M. Iron potentiates microglial interleukin-1beta secretion induced by amyloid-beta. J Neurochem 2020;154(2):177–89. doi: 10.1111/jnc.14906 [published Online First: 2019/11/07] [DOI] [PMC free article] [PubMed] [Google Scholar]
- 39.Uchida Y, Kan H, Sakurai K, et al. APOE varepsilon4 dose associates with increased brain iron and beta-amyloid via blood-brain barrier dysfunction. Journal of neurology, neurosurgery, and psychiatry 2022. doi: 10.1136/jnnp-2021-328519 [published Online First: 2022/04/29] [DOI] [PubMed] [Google Scholar]
- 40.Mattsson-Carlgren N, Leuzy A, Janelidze S, et al. The implications of different approaches to define AT(N) in Alzheimer disease. Neurology 2020;94(21):e2233–e44. doi: 10.1212/WNL.0000000000009485 [published Online First: 2020/05/14] [DOI] [PMC free article] [PubMed] [Google Scholar]
- 41.Alexopoulos P, Werle L, Roesler J, et al. Conflicting cerebrospinal fluid biomarkers and progression to dementia due to Alzheimer’s disease. Alzheimer’s research & therapy 2016;8(1):51. doi: 10.1186/s13195-016-0220-z [published Online First: 2016/12/10] [DOI] [PMC free article] [PubMed] [Google Scholar]
- 42.Belaidi AA, Masaldan S, Southon A, et al. Apolipoprotein E potently inhibits ferroptosis by blocking ferritinophagy. Molecular Psychiatry 2022 [DOI] [PMC free article] [PubMed] [Google Scholar]
- 43.Namba Y, Tomonaga M, Kawasaki H, et al. Apolipoprotein E immunoreactivity in cerebral amyloid deposits and neurofibrillary tangles in Alzheimer’s disease and kuru plaque amyloid in CreutzfeldT-Jakob disease. Brain research 1991;541(1):163–6. doi: 10.1016/0006-8993(91)91092-f [published Online First: 1991/02/08] [DOI] [PubMed] [Google Scholar]
- 44.Grundke-Iqbal I, Fleming J, Tung YC, et al. Ferritin is a component of the neuritic (senile) plaque in Alzheimer dementia. Acta neuropathologica 1990;81(2):105–10. doi: 10.1007/BF00334497 [published Online First: 1990/01/01] [DOI] [PubMed] [Google Scholar]
- 45.Toledo JB, Da X, Weiner MW, et al. CSF Apo-E levels associate with cognitive decline and MRI changes. Acta neuropathologica 2014;127(5):621–32. doi: 10.1007/s00401-013-1236-0 [published Online First: 2014/01/05] [DOI] [PMC free article] [PubMed] [Google Scholar]
- 46.Earley CJ, Connor JR, Beard JL, et al. Abnormalities in CSF concentrations of ferritin and transferrin in restless legs syndrome. Neurology 2000;54(8):1698–700. [published Online First: 2000/04/13] [DOI] [PubMed] [Google Scholar]
- 47.Zhang X, Surguladze N, Slagle-Webb B, et al. Cellular iron status influences the functional relationship between microglia and oligodendrocytes. Glia 2006;54(8):795–804. doi: 10.1002/glia.20416 [published Online First: 2006/09/08] [DOI] [PubMed] [Google Scholar]
Associated Data
This section collects any data citations, data availability statements, or supplementary materials included in this article.
Supplementary Materials
Data Availability Statement
Anonymized data will be shared by request from a qualified academic investigator for the sole purpose of replicating procedures and results presented in the article and as long as data transfer is in agreement with EU legislation on the general data protection regulation and decisions by the Ethical Review Board of Sweden and Region Skåne, which should be regulated in a material transfer agreement.