

Abstract
BACKGROUND:
In single-institution studies, overtriaging low-risk postoperative patients to ICUs has been associated with a low value of care; undertriaging high-risk postoperative patients to general wards has been associated with increased mortality and morbidity. This study tested the reproducibility of an automated postoperative triage classification system to generating an actionable, explainable decision support system.
STUDY DESIGN:
This longitudinal cohort study included adults undergoing inpatient surgery at two university hospitals. Triage classifications were generated by an explainable deep learning model using preoperative and intraoperative electronic health record features. Nearest neighbor algorithms identified risk-matched controls. Primary outcomes were mortality, morbidity, and value of care (inverted risk-adjusted mortality/total direct costs).
RESULTS:
Among 4,669 ICU admissions, 237 (5.1%) were overtriaged. Compared with 1,021 control ward admissions, overtriaged admissions had similar outcomes but higher costs ($15.9K [interquartile range $9.8K to $22.3K] vs $10.7K [$7.0K to $17.6K], p < 0.001) and lower value of care (0.2 [0.1 to 0.3] vs 1.5 [0.9 to 2.2], p < 0.001). Among 8,594 ward admissions, 1,029 (12.0%) were undertriaged. Compared with 2,498 control ICU admissions, undertriaged admissions had longer hospital length-of-stays (6.4 [3.4 to 12.4] vs 5.4 [2.6 to 10.4] days, p < 0.001); greater incidence of hospital mortality (1.7% vs 0.7%, p = 0.03), cardiac arrest (1.4% vs 0.5%, p = 0.04), and persistent acute kidney injury without renal recovery (5.2% vs 2.8%, p = 0.002); similar costs ($21.8K [$13.3K to $34.9K] vs $21.9K [$13.1K to $36.3K]); and lower value of care (0.8 [0.5 to 1.3] vs 1.2 [0.7 to 2.0], p < 0.001).
CONCLUSIONS:
Overtriage was associated with low value of care; undertriage was associated with both low value of care and increased mortality and morbidity. The proposed framework for generating automated postoperative triage classifications is reproducible.
In the US, approximately 15 million inpatient surgeries are performed annually, corresponding to 15 million decisions for postoperative triage to ICUs or general wards; these triage decisions are often misaligned with patient risk for adverse events.1,2 Evidence from single institution studies suggests that postoperative undertriage of high-acuity patients to general wards is associated with increased mortality and morbidity; postoperative overtriage of low-acuity patients to ICUs is associated with low value of care (risk-adjusted mortality relative to total direct costs) and may harm others who are denied admission to full ICUs.3–5
To align patient acuity with postoperative triage destination, we must first quantify individual patient acuity. Machine learning algorithms perform this task well.1 Earlier work established the feasibility and efficacy of automated machine learning–enabled patient acuity assessments using pre- and intraoperative electronic health record (EHR) features available at the end of surgery; this work was performed at a single hospital and its reproducibility was untested until performing the current study.3,5–7 The current study also uses explainable deep learning modeling rather than the random forest modeling used in earlier studies; deep learning architectures have the potential to generate a continuous stream of predictions as new information becomes available, which will be a priority for future work to continuously align patient acuity with resource intensity throughout postoperative admission and facilitate early, safe hospital discharge.
Our objective was to test the reproducibility of an automated overtriage and undertriage classification system to generating a postoperative triage decision support system that is both actionable and explainable. Using a longitudinal cohort of 28,646 admissions that included at least one surgery at 2 university hospitals and an explainable deep learning model to estimate patient acuity using automated EHR data, this study tested the hypothesis that postoperative overtriage is associated with low value of care (inverted risk-adjusted mortality/total direct costs) and that postoperative undertriage is associated with increased mortality and morbidity.
METHODS
Study design
This study used a longitudinal, retrospective cohort of all patients 18 years of age or older undergoing inpatient surgery at University of Florida Health Jacksonville, a 695-bed university hospital with 105 ICU beds within the urban core of Jacksonville, serving an urban, inner-city population, and at University of Florida Health North, a 92-bed university hospital with 24 ICU beds that is 11 miles from the main Jacksonville campus in a community hospital setting. Hospital station (ICU, ward, and operating room, among others) labels and ICU coverage are described in the supporting information regarding study methods (in Document, Supplemental Digital Content 1, http://links.lww.com/JACS/A173). The study design mimics that of earlier work using a similar cohort from the University of Florida Health Gainesville, a 1,162-bed quaternary care center that is approximately 73 miles from the Jacksonville hospitals.3,5
This study is built on the central hypothesis that high acuity patients managed with low resource intensity (ie undertriage) are at increased risk for mortality and morbidity; and that low acuity patients managed with high resource intensity (ie overtriage) receive low-value care, as illustrated in Figure 1. We tested this central hypothesis by classifying patient acuity with a deep learning model, classifying resource intensity according to postoperative triage destination (ICU or ward), and then assigning triage adjudications based on alignment between patient acuity and resource intensity. As previously described, ICU admissions were considered overtriaged if their predicted risk for hospital mortality and prolonged (48 hours or more) ICU stay were each below median risk thresholds (ie below the 50th percentile) among all inpatient surgeries, as previously described; ward admissions were considered undertriaged if their predicted risk for hospital mortality or prolonged ICU stay was in the top quartile among all inpatient surgeries.3,5
Figure 1.
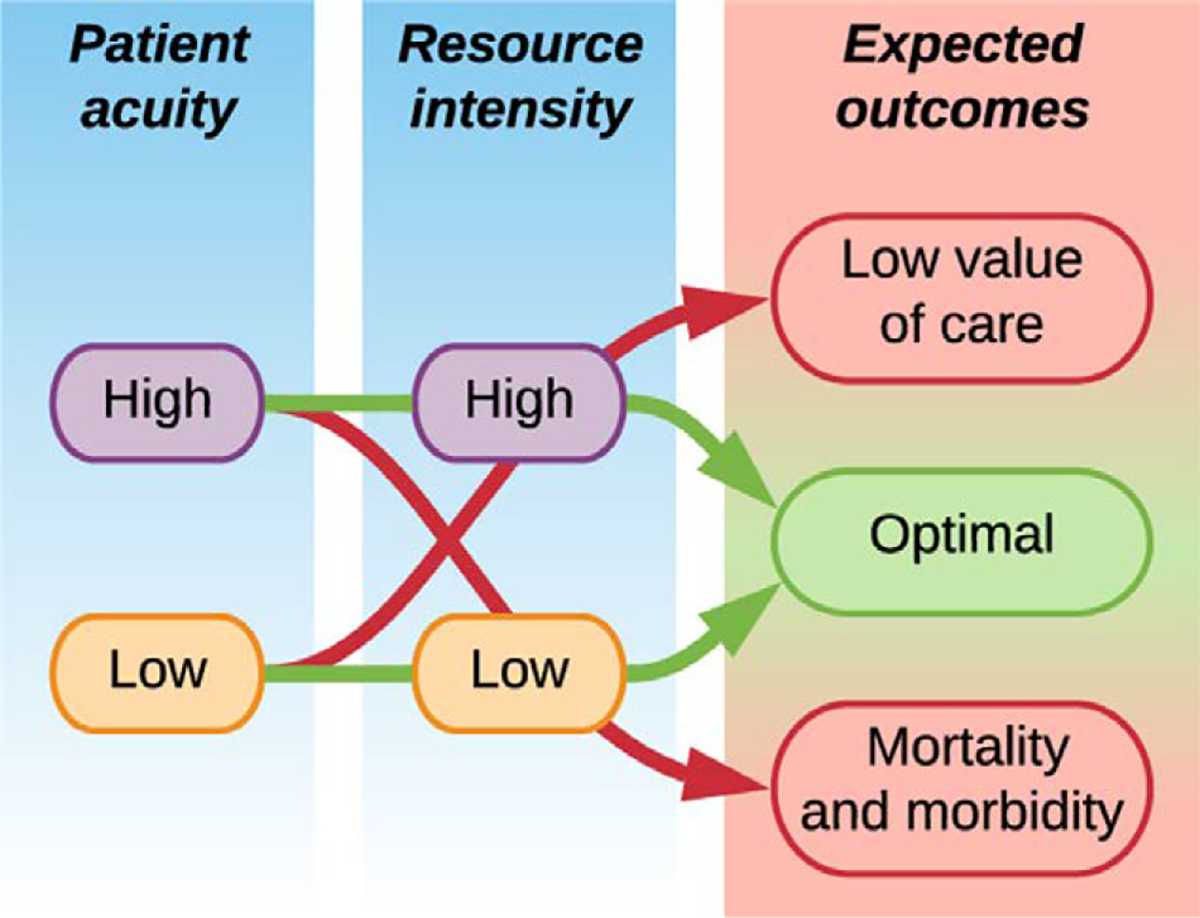
Conceptual schema for aligning patient acuity with resource intensity. High-acuity patients managed with low resource intensity (eg undertriage to general wards) are at increased risk for mortality and morbidity; low-acuity patients managed with high resource intensity (ie overtriage to ICUs) receive low-value care.
To understand whether patients with similar risk profiles but different triage destinations had different outcomes, risk-matched control cohorts were identified by a nearest neighbors algorithm matching on risk of hospital mortality or prolonged ICU stay. This approach used a wide range of patient demographic factors, comorbidities, physiologic measurements, and surgical procedural factors (including surgery type) in identifying matched cohorts, as each of these factors contributed to risk predictions. As previously described, the nearest neighbors brute-force algorithm used to identify risk-matched control admission is available at: https://scikit-learn.org/stable/modules/generated/sklearn.neighbors.NearestNeighbors.html. To identify controls for the overtriage cohort, the algorithm was fit on predictions for hospital mortality, prolonged ICU stay, and the average z-score across both outcomes among ward admissions, and the fit model was applied to the overtriage cohort using a parameter space radius of 1 and a Minkowski distance metric with p = 2.0. We performed 3 separate searches that each identified the 2 nearest neighbor ward admissions based on risk for hospital mortality, prolonged ICU stay, and the average z-score across both outcomes, and used the union of the 3 searches to compose the control cohort. The same process was used to identify controls for the undertriage cohort, with the caveat that ICU admissions were ineligible for matching to undertriaged ward admissions if they included mechanical ventilation or vasopressor support within 2 hours of the end of surgery. This approach matched 237 admissions that were overtriaged to ICU with 1,021 controls that were admitted to hospital wards and matched 1,029 undertriaged ward admissions with 2,498 controls that were admitted to ICUs. Efficacy of the matching procedure was assessed by comparing average z-scores for predictions of hospital mortality or prolonged ICU stay, which demonstrated similar results between the overtriage cohort and risk-matched controls (−0.6 [−0.6 to −0.5] vs −0.6 [−0.6 to −0.5], p=0.10) and between the undertriage cohort and risk-matched controls (0.3 [−0.1 to 0.8] vs 0.3 [0.0 to 0.7], p=0.11). The overtriage and undertriage models are based solely on information that is available at the end of surgery, when the clinicians’ postoperative triage decisions are finalized.
The primary analysis compared mortality, morbidity, and value of care for overtriaged admissions vs risk-matched controls, as well as for undertriaged admissions vs risk-matched controls. Institutional Review Board approval was obtained (No. 201802284). This study complies with Strengthening the Reporting of Observational Studies in Epidemiology (STROBE) guidelines (STROBE Checklist, Supplemental Digital Content 2, http://links.lww.com/JACS/A173).
Data source
The University of Florida Integrated Data Repository was used as an honest broker to assemble the patient cohort from retrospective EHR data, consisting of patients 18 years of age or older undergoing inpatient surgery at the University of Florida Health Jacksonville Main and North campuses from June 1, 2014 to September 20, 2020 (in Figure, Supplemental Digital Content 3, http://links.lww.com/JACS/A173). Only the first surgery of each admission was considered in the main analysis. Patients who died during the index surgery were excluded, as no postoperative triage decision was made. Admissions lasting fewer than 24 hours were excluded to avoid excessively short prediction windows and because these admissions are often classified as “observation only,” differing from the target population for an actionable postoperative triage decision support system. The final dataset included granular information from pre-, intra-, and postoperative phases of care regarding patient demographics, socioeconomic status represented by publicly available area deprivation index values matched with 9-digit zip codes from the EHR, hospital stations, diagnoses, procedures, vital signs, laboratory values, medications, blood product transfusions, patient outcomes, charges by providers, total charges for each hospital admission, and total direct costs for each hospital admission (described in Document, Supplemental Digital Content 1, http://links.lww.com/JACS/A173).
The study cohort was split chronologically into development and validation cohorts to mitigate potentially adverse effects of dataset drift, consistent with Transparent Reporting of a Multivariable Prediction Model for Individual Prognosis or Diagnosis (TRIPOD) recommendations in the type 2b analysis category.8,9 The model was trained on a development cohort of 15,383 University of Florida Jacksonville postoperative admissions at the Main and North campuses. The trained model made predictions on 13,263 University of Florida Jacksonville validation cohort admissions at the Main and North campus; results are reported exclusively from the validation cohort. We used a relatively balanced train/test split because smaller hospitals and healthcare systems may be unable to allocate more than 15,000 admissions to model training, though we acknowledge a 70/30 train/test split may have achieved greater model predictive performance.
Explainable deep learning risk stratification
Estimated risk of hospital mortality and prolonged ICU stay were generated by deep learning classifiers—not the previously reported3,5 random forest classifiers—because deep learning offered similar predictive performance and the additional potential for generating continuous risk assessments to inform continuous overtriage and undertriage classifications, which will be prioritized in future work.3,10 The current study used a new model and a new patient population to establish reproducibility of the triage classification framework, rather than validating previously reported models or model weights. Risk stratification was performed using EHR data available at the end of surgery to simulate clinical scenarios in which an automated decision support system would offer triage recommendations immediately after surgery.
Variables, data types, and data missingness are provided in Supplemental Digital Content 4, http://links.lww.com/JACS/A173. Data processing, feature selection, and hyperparameter selection are described in Supplemental Digital Content 1, http://links.lww.com/JACS/A173. The optimal model learning rate, batch size, dropout rate, and hidden dimensions that were used in this study are listed in Supplemental Digital Content 5, http://links.lww.com/JACS/A173. Model performance was evaluated on the validation cohort by calculating area under the receiver operating characteristic curve, area under the precision-recall curve, and by calculating Youden’s index to derive an optimal classification threshold for evaluating sensitivity, specificity, positive predictive value, negative predictive value, and F1 score. Ninety-five percent confidence intervals were computed for each metric using bootstrapping with 1,000 iterations.
To understand the relative importance of each feature in generating model predictions, we used the Shaply Additive Explanations (SHAP) Python package.11 Briefly, SHAP is a game theoretic technique that computes feature attribution scores after several iterations of sampling feature subsets from validation data, replacing absent features with baseline values drawn from training data distributions, and comparing model predictions with and without each feature present. One benefit of this approach is that it offers interpretation to otherwise deeply nonlinear models. In this study, SHAP values represent the magnitude or extent to which a particular feature influences the prediction of hospital mortality or prolonged ICU stay.
Sensitivity analysis
The primary analysis study dates (June 1, 2014 to September 20, 2020) include an era in which undertriage decisions may have been affected by coronavirus disease 2019 (COVID-19) pandemic–associated changes in ICU bed availability. Therefore, we performed a sensitivity analysis comparing undertriaged and control admissions while excluding patients who were discharged from the hospital February 1, 2020 or later.
Statistical analysis
The primary statistical objective was to compare mortality, morbidity, and value of care for overtriaged admissions vs risk-matched controls and for undertriaged admissions vs risk-matched controls. We calculated value of care as inverted observed-to-expected mortality ratios divided by median total costs and multiplied by a constant to set value of care for the entire study population to 1, as previously described.3,5,12 Our power analysis is described in Supplemental Digital Content 1, http://links.lww.com/JACS/A173. Categorical variables were reported as raw numbers with percentages and compared by Fisher exact test. Continuous variables were reported as median values with interquartile ranges and compared by the Kruskal–Wallis test. All hypothesis tests were 2-sided with α=0.05. All outcome analyses were adjusted for multiple comparisons using the Benjamini–Hochberg procedure.
RESULTS
Overtriage to ICUs vs risk-matched ward admissions
Patient characteristics
Among 4,669 postoperative admissions to ICUs, 237 (5.1%) were overtriaged. Overtriaged admissions were matched with 1,021 control ward admissions with similar risk profiles. Compared with controls, the overtriage cohort had fewer female patients (38.4% vs 63.7%, p < 0.001), similar age (44 years in both cohorts, p=0.17), similar proportions of races, and similar area deprivation index values (Table 1). The overtriage cohort had higher admission Sequential Organ Failure Assessment (SOFA) scores (2.0 [0.0 to 3.0] vs 1.0 [0.0 to 3.0], p = 0.008) and higher incidence of emergent admission priority (58.6% vs 47.7%, p = 0.002), but lower Charlson comorbidity index scores (0.0 [0.0 to 0.0] vs 0.0 [0.0 to 1.0], p = 0.007). There were disproportionate contributions to the overtriage cohort from neurosurgery, ophthalmology, orthopedic surgery, and trauma and acute care surgery; there were disproportionate contributions to the control cohort by gynecologic surgery, oral surgery, and podiatry (Table 2).
Table 1.
Characteristics of Postoperative Admissions Overtriaged to ICUs, Undertriaged to Hospital Wards, and Risk- Matched Controls
| Characteristic | Overtriage (N = 237) |
Overtriage control (N = 1,021) |
p Value † | Undertriage (N = 1,029) |
Undertriage control (N = 2,498) |
p Value ‡ |
|---|---|---|---|---|---|---|
| Demographic | ||||||
| Sex, n (%) | ||||||
| Female | 91 (38.4) | 650 (63.7) | <0.001* | 499 (48.5) | 1025 (41.0) | <0.001* |
| Male | 146 (61.6) | 371 (36.3) | <0.001* | 530 (51.5) | 1473 (59.0) | <0.001* |
| Age, y, median [IQR] | 44.0 [32.0–55.0] | 44.0 [32.0–59.0] | 0.17 | 60.0 [49.0–71.0] | 56.0 [41.0–66.0] | <0.001* |
| Race, n (%) | ||||||
| American Indian or Alaska Native | 0 (0.0) | 0 (0.0) | >0.99 | 2 (0.2) | 2 (0.1) | 0.59 |
| Asian | 1 (0.4) | 13 (1.3) | 0.49 | 7 (0.7) | 11 (0.4) | 0.44 |
| Black or African American | 74 (31.2) | 349 (34.2) | 0.40 | 402 (39.1) | 888 (35.5) | 0.05 |
| Native Hawaiian or Pacific Islander | 0 (0.0) | 0 (0.0) | >0.99 | 0 (0.0) | 5 (0.2) | 0.33 |
| Other or multiracial | 17 (7.2) | 72 (7.1) | >0.99 | 47 (4.6) | 110 (4.4) | 0.86 |
| White | 143 (60.3) | 583 (57.1) | 0.38 | 565 (54.9) | 1475 (59.0) | 0.02 |
| Unknown | 2 (0.8) | 4 (0.4) | 0.32 | 6 (0.6) | 7 (0.3) | 0.22 |
| Area Deprivation Index | ||||||
| State rank, median [IQR] | 7.0 [5.0–9.0] | 7.0 [5.0–9.0] | 0.89 | 8.0 [5.0–10.0] | 8.0 [5.0–10.0] | 0.43 |
| National rank, median [IQR] | 69.0 [47.0–80.0] | 68.0 [47.0–85.0] | 0.95 | 70.0 [52.0–92.0] | 70.0 [52.0–92.0] | 0.59 |
| Illness severity | ||||||
| Admission SOFA score, median [IQR] | 2.0 [0.0–3.0] | 1.0 [0.0–3.0] | 0.008* | 3.0 [1.0–4.0] | 2.0 [1.0–3.0] | <0.001* |
| Charlson comorbidity index, median [IQR] | 0.0 [0.0–0.0] | 0.0 [0.0–1.0] | 0.007* | 2.0 [1.0–5.0] | 1.0 [0.0–2.0] | <0.001* |
| Admitted from emergency department, n (%) | 139 (58.6) | 398 (39.0) | <0.001* | 623 (60.5) | 1611 (64.5) | 0.03* |
| Had preoperative RBC transfu- sion, n (%) | 0 (0.0) | 5 (0.5) | 0.59 | 55 (5.3) | 55 (5.3) | <0.001* |
| Admission priority status, n (%) | ||||||
| Elective | 94 (39.7) | 446 (43.7) | 0.28 | 332 (32.3) | 810 (32.4) | .94 |
| Urgent | 3 (1.3) | 88 (8.6) | <.001* | 68 (6.6) | 79 (3.2) | <0.001* |
| Emergent | 139 (58.6) | 487 (47.7) | 0.002* | 629 (61.1) | 1608 (64.4) | 0.07 |
| Unknown | 1 (0.4) | 0 (0.0) | 0.19 | 0 (0.0) | 1 (0.0) | >0.99 |
p Values correspond to significance tests comparing cohorts by each variable in the Characteristics column.
Statistically significant.
Overtriage vs overtriage controls, which were ward admissions with risk profiles similar to those of overtriaged ICU admissions.
Undertriage vs undertriage controls, which were ICU admissions with risk profiles similar to those of undertriaged ward admissions.
IQR, interquartile range; SOFA, sequential organ failure assessment.
Table 2.
Primary Surgical Service for Postoperative Admissions
| Primary surgical service | Overtriage (N = 237) |
Overtriage control (N = 1,021) |
p Value† | Undertriage (N = 1,029) |
Undertriage control (N = 2,498) |
p Value‡ |
|---|---|---|---|---|---|---|
| General | 36 (15.2) | 155 (15.2) | >0.99 | 187 (18.2) | 392 (15.7) | 0.07 |
| Gynecologic | 7 (3.0) | 322 (31.5) | <0.001* | 68 (6.6) | 20 (0.8) | <0.001* |
| Neurosurgery | 15 (6.3) | 23 (2.3) | 0.002* | 136 (13.2) | 394 (15.8) | 0.06 |
| Ophthalmology | 3 (1.3) | 1 (0.1) | 0.02* | 2 (0.2) | 10 (0.4) | 0.53 |
| Oral | 13 (5.5) | 105 (10.3) | 0.03* | 96 (9.3) | 123 (4.9) | <0.001* |
| Orthopaedic | 96 (40.5) | 234 (22.9) | <0.001* | 173 (16.8) | 523 (20.9) | 0.005* |
| Otolaryngology | 4 (1.7) | 5 (0.5) | 0.07 | 9 (0.9) | 15 (0.6) | 0.37 |
| Podiatry | 4 (1.7) | 53 (5.2) | 0.02* | 63 (6.1) | 96 (3.8) | 0.004* |
| Plastic and reconstructive | 1 (0.4) | 6 (0.6) | >0.99 | 8 (0.8) | 5 (0.2) | 0.03* |
| Thoracic and cardiovascular | 0 (0.0) | 1 (0.1) | >0.99 | 4 (0.4) | 197 (7.9) | <0.001* |
| Trauma and acute care | 44 (18.6) | 43 (4.2) | <0.001* | 110 (10.7) | 413 (16.5) | <0.001* |
| Urology | 14 (5.9) | 72 (7.1) | 0.67 | 112 (10.9) | 82 (3.3) | <0.001* |
| Vascular | 0 (0.0) | 1 (0.1) | >0.99 | 61 (5.9) | 228 (9.1) | 0.001* |
Data presented as n (%). p Values correspond to significance tests comparing cohorts by each variable in the Primary Surgical Service column.
Statistically significant.
Overtriage vs overtriage controls, which were ward admissions with risk profiles similar to those of overtriaged ICU admissions.
Undertriage vs undertriage controls, which were ICU admissions with risk profiles similar to those of undertriaged ward admissions.
Perioperative factors
The incidence of emergent surgery was approximately 24% in both cohorts (p > 0.99, Table 3). Compared with controls, the overtriage cohort had lower American Society of Anesthesiology physical status classification scores (2.0 [2.0 to 2.0] vs 3.0 [2.0–3.0], p < 0.001), but similar SOFA scores immediately before surgery (0.0 in both groups, p = 0.32), incidence of intraoperative red cell transfusions (0.0% vs 1.0%, p = 0.22), and length of surgery (139 [92 to 216] vs 127 [83 to 203] minutes, p=0.08). Immediately after surgery, the overtriage cohort had higher heart rates (83.7 [74.9 to 93.2] vs 80.3 [71.8 to 89.4]), systolic and diastolic blood pressures (133.0 [121.1 to 143.1] vs 124.5 [113.2 to 137.3] mmHg and 78.4 [71.5 to 86.4] vs 73.4 [65.4 to 81.4] mmHg, respectively), and temperatures (36.7°C [36.6° to 36.9°C] vs 36.6°C [36.4° to 36.8°C]), and a greater proportion with Glasgow Coma Scale eye opening responses of less than 4 (27.4% vs 15.2%; all p < 0.001).
Table 3.
Perioperative Factors for Postoperative Admissions Overtriaged to ICUs, Undertriaged to Hospital Wards, and Risk-Matched Controls
| Perioperative factor | Overtriage (N = 237) |
Overtriage control (N = 1,021) |
p Value† | Undertriage (N = 1,029) |
Undertriage control (N = 2,498) |
p Value‡ |
|---|---|---|---|---|---|---|
| Surgery priority status, n (%) | ||||||
| Elective | 150 (63.3) | 702 (68.8) | 0.11 | 764 (74.2) | 1807 (72.3) | 0.26 |
| Urgent | 29 (12.2) | 70 (6.9) | 0.01* | 52 (5.1) | 174 (7.0) | 0.03* |
| Emergent | 58 (24.5) | 249 (24.4) | >0.99 | 213 (20.7) | 517 (20.7) | >0.99 |
| Immediate preoperative illness severity | ||||||
| ASA score, median [IQR] | 2.0 [2.0–2.0] | 3.0 [2.0–3.0] | <0.001* | 3.0 [3.0–3.0] | 3.0 [3.0–3.0] | <0.001* |
| ASA score ≥4, n (%) | 0 (0.0) | 8 (0.8) | 0.37 | 212 (20.6) | 249 (10.0) | <0.001* |
| SOFA score, median [IQR] | 0.0 [0.0–0.0] | 0.0 [0.0–0.0] | 0.32 | 1.0 [0.0–2.0] | 0.0 [0.0–1.0] | <0.001* |
| SOFA score ≥2, n (%) | 16 (6.8) | 56 (5.5) | 0.44 | 399 (38.8) | 526 (21.1) | <0.001* |
| Intraoperative factor | ||||||
| Had intraoperative red cell transfusion | 0 (0.0) | 10 (1.0) | 0.22 | 41 (4.0) | 82 (3.3) | 0.31 |
| Length of surgery, min, median [IQR] | 139 [92–216] | 127 [83–203] | 0.08 | 140 [83–247] | 163 [103–246] | <0.001* |
| Immediate postoperative vital sign | ||||||
| Heart rate, median [IQR] | 83.7 [74.9–93.2] | 80.3 [71.8–89.4] | <0.001* | 82.2 [73.3–92.8] | 83.0 [73.4–93.8] | 0.23 |
| Systolic blood pressure, | 133.0 [121.1–143.1] 124.5 [113.2–137.3] | <0.001* | 128.0 [113.9–143.0] 130.6 [117.6–143.7] 0.006* | |||
| mmHg, median [IQR] | ||||||
| Diastolic blood pressure, | 78.4 [71.5–86.4] | 73.4 [65.4–81.4] | <0.001* | 70.9 [62.3–80.5] | 72.7 [63.8–82.9] | <0.001* |
| mmHg, median [IQR] | ||||||
| Respiratory rate, | 16.4 [14.7–18.3] | 16.4 [15.2–17.7] | 0.75 | 16.4 [15.0–18.6] | 16.4 [14.9–18.4] | 0.41 |
| median [IQR] | ||||||
| Oxygen saturation, %, median [IQR] | 97.7 [96.1–98.8] | 97.7 [96.3–98.9] | 0.39 | 97.4 [95.9–98.6] | 97.5 [96.1–98.7] | 0.06 |
| Temperature, °C, median [IQR] | 36.7 [36.6–36.9] | 36.6 [36.4–36.8] | <0.001* | 36.6 [36.4–36.8] | 36.7 [36.4–36.9] | <0.001* |
| GCS eye opening response, median [IQR] | 4.0 [3.8–4.0] | 4.0 [4.0–4.0] | <0.001* | 4.0 [3.7–4.0] | 4.0 [3.7–4.0] | 0.07 |
| GCS eye opening response <4, n (%) | 65 (27.4) | 155 (15.2) | <0.001* | 319 (31.0) | 847 (33.9) | 0.10 |
p Values correspond to significance tests comparing cohorts by each variable in the Perioperative Factor column.
Statistically significant.
Overtriage vs overtriage controls, which were ward admissions with risk profiles similar to those of overtriaged ICU admissions.
Undertriage vs undertriage controls, which were ICU admissions with risk profiles similar to those of undertriaged ward admissions.
ASA, American Society of Anesthesiologists physical status classification score; GCS, Glasgow Coma Scale; IQR, interquartile range; SOFA, Sequential Organ Failure Assessment.
Patient outcomes
Compared with controls, overtriaged admissions had a greater incidence of prolonged (48 hours or more) ICU stay (13.1% vs 1.4%, p < 0.001) and having a second surgery during admission (18.6% vs 5.9%, p < 0.001), though the incidence of emergent second surgery was similar between cohorts (2.1% vs 1.8%, p = 0.97), as was the interval between index and second surgeries (67 hours [46 to 104 hours] and 71 hours [32 to 128 hours], p = 0.97, Table 4). Overtriage and control cohorts had similar incidence of postoperative red cell transfusion, acute kidney injury, cardiac arrest, and discharge to hospice, and there were no mortalities in either cohort (all p > 0.05). The overtriage cohort had greater total costs ($15.9K [$9.8K to $22.3K] vs $10.7K [$7.0K to $17.6K], all p<0.001). For calculating value of care for the overtriage and control ward admission cohorts, observed mortality was imputed as 0.01% symmetrically to obtain a real number when calculating observed-to-expected mortality ratios as there were no observed mortalities in either cohort. Value was lower in the overtriage cohort (0.2 [0.1 to 0.3] vs 1.5 [0.9 to 2.2], p < 0.001), as illustrated in Figure 2.
Table 4.
Outcomes of Postoperative Admissions that Were Overtriaged to ICUs, Undertriaged to Hospital Wards, and Risk-Matched Controls
| Outcomes | Overtriage (N = 237) |
Overtriage control (N = 1,021) |
p Value† | Undertriage (N = 1,029) |
Undertriage control (N = 2,498) |
p Value‡ |
|---|---|---|---|---|---|---|
| Resource use | ||||||
| ICU admission for ≥48 h, n (%) | 31 (13.1) | 14 (1.4) | <0.001* | 57 (5.5) | 1022 (40.9) | <0.001* |
| ICU length of stay, d, median [IQR] | 0.0 [0.0–0.9] | 0.0 [0.0–0.0] | <0.001* | 0.0 [0.0–0.0] | 1.2 [0.0–3.9] | <0.001* |
| Mechanical ventilation for ≥48 h, n (%) | 1 (0.4) | 14 (1.4) | 0.46 | 19 (1.8) | 41 (1.6) | 0.86 |
| Postoperative vasopressors within 2 h of surgery, n (%) | 0 (0.0) | 0 (0.0) | >0.99 | 1 (0.1) | 15 (0.6) | 0.05* |
| Second surgery during admission, n (%) | 44 (18.6) | 60 (5.9) | <0.001* | 115 (11.2) | 376 (15.1) | 0.006* |
| Time between surgeries, h, median [IQR] | 67 [46–104] | 71 [32–128] | 0.97 | 92 [49–153] | 72 [41–141] | 0.07 |
| Had emergent second surgery during admission, n (%) | 5 (2.1) | 18 (1.8) | 0.97 | 25 (2.4) | 77 (3.1) | 0.46 |
| Had postoperative red cell transfusion, n (%) | 3 (1.3) | 23 (2.3) | 0.60 | 117 (11.4) | 221 (8.8) | 0.05* |
| Red cell transfusion during admission, n (%) | 3 (1.3) | 35 (3.4) | 0.15 | 182 (17.7) | 300 (12.0) | <0.001* |
| Hospital length of stay, d, median [IQR] | 3.1 [2.0–5.9] | 2.5 [1.9–4.6] | 0.06 | 6.4 [3.4–12.4] | 5.4 [2.6–10.4] | <0.001* |
| Complication, n (%) | ||||||
| Hospital mortality | 0 (0.0) | 0 (0.0) | >0.99 | 17 (1.7) | 17 (0.7) | 0.03* |
| Discharge to hospice | 0 (0.0) | 2 (0.2) | >0.99 | 28 (2.7) | 17 (0.7) | <0.001* |
| Cardiac arrest | 0 (0.0) | 3 (0.3) | >0.99 | 14 (1.4) | 13 (0.5) | 0.04* |
| Acute kidney injury | ||||||
| Rapid reversal | 7 (3.0) | 54 (5.3) | 0.27 | 122 (11.9) | 250 (10.0) | 0.18 |
| Persistent, with renal recovery | 2 (0.8) | 11 (1.1) | >0.99 | 62 (6.0) | 95 (3.8) | 0.01* |
| Persistent, without renal recovery | 3 (1.3) | 16 (1.6) | >0.99 | 53 (5.2) | 70 (2.8) | 0.002* |
| Charges and cost | ||||||
| Professional service charges, $K, median [IQR] | 10.4 [7.3–16.8] | 8.4 [6.1–11.9] | <0.001* | 12.1 [8.2–19.7] | 14.6 [9.0–27.4] | <0.001* |
| Charges for hospital admission, $K, median [IQR] | 92.8 [62.7–128.0] | 63.6 [37.1–92.2] | <0.001* | 111.0 [71.8–167.5] | 114.3 [75.7–178.4] | 0.07 |
| Costs for hospital admission, $K, median [IQR] | 15.9 [9.8–22.3] | 10.7 [7.0–17.6] | <0.001* | 21.8 [13.3–34.9] | 21.9 [13.1–36.3] | 0.97 |
| Value of care, median [IQR] | 0.2 [0.1–0.3] | 1.5 [0.9–2.2] | <0.001* | 0.8 [0.5–1.3] | 1.2 [0.7–2.0] | <0.001* |
p Values correspond to significance tests comparing cohorts by each variable in the Outcomes column. p Values were adjusted for multiple comparisons using the Benjamini–Hochberg procedure.
Statistically significant.
Overtriage vs overtriage controls, which were ward admissions with risk profiles similar to those of overtriaged ICU admissions.
Undertriage vs undertriage controls, which were ICU admissions with risk profiles similar to those of undertriaged ward admissions.
IQR, interquartile range.
Figure 2.

Both overtriage and undertriage were associated with low value of care relative to risk-matched controls. Each point represents a single admission. The black lines represent medians. p values compare medians between cohorts by the Kruskal–Wallis test. To calculate value of care for each admission, inverted observed-to-expected, O:E, mortality ratios for cohorts were divided by total cost for each admission and multiplied by a constant to set value of care for the entire study population to 1. For calculating value of care for the overtriage and control ward admission cohorts, observed mortality was imputed as 0.01% symmetrically because there were no observed mortalities in either cohort, therefore, imputation was required to obtain a real number for calculating O:E mortality ratios.
Undertriage to general wards vs risk-matched ICU admissions
Patient characteristics
Among 8,594 postoperative ward admissions, 1,029 (12.0%) were undertriaged. Undertriaged admissions were matched with 2,498 control ICU admissions with similar risk profiles. Compared with controls, the undertriage cohort had more females (48.5% vs 41.0%, p < 0.001), greater age (60 vs 56 years, p < 0.001), a greater proportion of admissions for which the patient self-identified as Black or African American (39.1% vs 35.5%, p = 0.05), and a lesser proportion of admissions for which the patient self-identified as White (54.9% vs 59.0%, p = 0.02), but had similar area deprivation index values (Table 1). The undertriage cohort had higher admission SOFA scores (3.0 [1.0 to 4.0] vs 2.0 [1.0 to 3.0], p < 0.001), higher Charlson comorbidity index scores (2.0 [1.0 to 5.0] vs 1.0 [0.0 to 2.0], p < 0.001), and greater incidence of preoperative red cell transfusion (5.3% vs 2.4%, p < 0.001). There were disproportionate contributions to the undertriage cohort from gynecologic surgery, oral surgery, podiatry, plastic and reconstructive surgery, and urology; there were disproportionate contributions to the control cohort by orthopedic surgery, thoracic and cardiovascular surgery, trauma and acute care surgery, and vascular surgery (Table 2).
Perioperative factors
The incidence of emergent surgery was approximately 21% in both cohorts (p = 0.99, Table 3). Compared with controls, the undertriage cohort had a greater proportion of admissions with American Society of Anesthesiologists physical status classification scores of 4 or greater (20.6% vs 10.0%], p < 0.001) and higher SOFA scores immediately before surgery (1.0 [0.0 to 2.0] vs 0.0 [0.0 to 1.0], p < 0.001), similar incidence of intraoperative red cell transfusions (4.0% vs 3.3%, p = 0.31), and shorter length of surgery (140 [83 to 247] vs 163 [103 to 246] minutes, p < 0.001). Immediately after surgery, the undertriage cohort had lower systolic and diastolic blood pressures (128.0 mmHg [113.9 to 143.0 mmHg] vs 130.6 mmHg [117.6 to 143.7 mmHg], p = 0.006; and 70.9 mmHg [62.3 to 80.5 mmHg] vs 72.7 mmHg [63.8 to 82.9 mmHg], p < 0.001), and temperatures (36.6°C [36.4° to 36.8°C] vs 36.7°C [36.4° to 36.9°C], p<0.001). Other immediate postoperative vital signs were similar between cohorts.
Patient outcomes
Approximately 9% (92 of 1,029) of all undertriaged admissions had subsequent ICU admission occurring at median 54 hours [interquartile range 18 to 145 hours] after surgery. Compared with controls, undertriaged admissions had a lower incidence of prolonged ICU stay (5.5% vs 40.9%, p < 0.001) but longer hospital length of stay (6.4 days [3.4 to 12.4 days] vs 5.4 days [2.6 to 10.4 days], p < 0.001; Table 4). The undertriage cohort had a lower incidence of second surgery during admission (11.2% vs 15.1%, p<0.001), though the incidence of emergent second surgery was similar between cohorts (2.4% and 3.1%, p = 0.46), and the incidence of postoperative red cell transfusion was greater in the undertriage cohort (11.4% vs 8.8%, p = 0.05). The undertriage cohort had greater incidence of hospital mortality (1.7% vs 0.7%, p = 0.03), discharge to hospice (2.7% vs 0.7%, p < 0.001), cardiac arrest (1.4% vs 0.5%, p = 0.04), and persistent (lasting 72 hours or more) acute kidney injury with recovery of baseline renal function before discharge (6.0% vs 3.8%, p = 0.01) and without renal recovery before discharge (5.2% vs 2.8%, p = 0.002). Undertriage and control cohorts had similar total costs ($21.8K [$13.3K to $34.9K] vs $21.9K [$13.1K to $36.3K], p = 0.97). The value of care was lower in the undertriage cohort (0.8 [0.5 to 1.3] vs 1.2 [0.7 to 2.0], p < 0.001), as illustrated in Figure 2.
Model performance and explainability
Prolonged ICU stay predictions had area under the receiver operating characteristic curve of 0.920 (95% CI 0.916 to 0.923); hospital mortality predictions had area under the receiver operating characteristic curve of 0.925 (0.909 to 0.940) (Table 5). The area under the precision-recall curve was higher for prolonged ICU stay predictions than it was for hospital mortality predictions, which was poor (0.755 [0.734 to 0.770] vs 0.227 [0.175 to 0.304]), and consistent with greater prevalence of prolonged ICU stay (19.3% vs 1.0%).
Table 5.
Model Performance in Predicting Prolonged ICU Stay and Hospital Mortality
| Variable | Prolonged ICU stay | Hospital mortality |
|---|---|---|
| Prevalence, % | 19.3 | 1.02 |
| AUROC, median [IQR] | 0.920 [0.916–0.923] | 0.925 [0.909–0.940] |
| AUPRC, median [IQR] | 0.755 [0.734–0.770] | 0.227 [0.175–0.304] |
| Sensitivity, median [IQR] | 0.868 [0.836–0.881] | 0.889 [0.868–0.993] |
| Specificity, median [IQR] | 0.816 [0.809–0.848] | 0.819 [0.724–0.879] |
| PPV, median [IQR] | 0.531 [0.519–0.575] | 0.048 [0.032–0.069] |
| NPV, median [IQR] | 0.963 [0.955–0.967] | 0.999 [0.998–0.999] |
| F1 score, median [IQR] | 0.659 [0.650–0.686] | 0.091 [0.062–0.128] |
AUPRC, area under the precision-recall curve, AUROC, area under the receiver operating characteristic curve, PPV, positive predictive value, NPV, negative predictive value.
SHAP values for predicting both hospital mortality and prolonged ICU stay for individual example patients and for the aggregate patient population are illustrated in Figure 3. The top 10 most important features for predicting prolonged ICU stay were intraoperative red cell transfusions, intraoperative vital signs, primary surgical service, and presence in an ICU before surgery; these features had clinically intuitive associations with increasing or decreasing risk for prolonged ICU stay when applied to an individual patient (Fig. 3A) while Figure 3B shows same for the aggregate population. The top 10 most important features for predicting hospital mortality were primary surgeon, comorbidities, admission SOFA scores, intraoperative vital signs, and elective surgery; these features had clinically intuitive associations with increasing or decreasing risk for hospital mortality when applied to an individual patient (Fig. 3C) while Figure 3D shows same for the aggregate population.
Figure 3.

Model explainability as illustrated by Shapley values. This figure illustrates feature importance for predicting (A) prolonged ICU stay for an example patient, (B) prolonged ICU stay for the aggregate population, (C) hospital mortality for an example patient, and (D) hospital mortality for an example patient for aggregate population. Blue indicates low probability, red indicates high probability. CMS, Centers for Medicare and Medicaid Services; SOFA, Sequential Organ Failure Assessment score.
Sensitivity analysis
We performed a sensitivity analysis comparing undertriaged and control admissions while excluding patients who were discharged from the hospital on February 1, 2020 or later, as undertriage decisions for these patients may have been affected by COVID-19 pandemic–associated changes in ICU bed availability. Results of the sensitivity analysis mirrored the primary analysis (Table 6). Compared with pre–COVID-19 controls, the pre–COVID-19 undertriaged admissions had a lower incidence of prolonged ICU stay (5.2% vs 40.5%, p < 0.001) but longer hospital length of stay (6.4 [3.4 to 12.3] vs 5.4 [2.6 to 10.1] days, p < 0.001). The undertriage cohort had a lower incidence of second surgery during admission (10.0% vs 14.4%, p = 0.006), though the incidence of emergent second surgery was similar between cohorts (2.7% and 2.8%, p > 0.99), and the incidence of postoperative red cell transfusion was greater in the undertriage cohort (12.1% vs 8.3%, p = 0.006). The undertriage cohort had greater incidence of hospital mortality (1.6% vs 0.5%, p = 0.01), discharge to hospice (3.1% vs 0.5%, p < 0.001) and persistent acute kidney injury with recovery of baseline renal function before discharge (5.9% vs 3.7%, p = 0.03) and without renal recovery before discharge (5.0% vs 3.2%, p = 0.05). Undertriage and control cohorts had similar total costs ($21.8K [$13.3K to $33.9K] vs $21.6K [$13.2K to $35.7K], p = 0.99). Value of care was lower in the undertriage cohort (0.8 [0.5 to 1.3] vs 1.2 [0.7 to 1.9], p < 0.001).
Table 6.
Sensitivity Analysis of Outcomes of Postoperative Admissions Undertriaged to Hospital Wards and Risk-Matched Controls
| Outcomes | Undertriage (N=767) |
Undertriage control (N=1,930) |
p Value |
|---|---|---|---|
| Resource use | |||
| ICU admission for ≥48 h, n (%) | 40 (5.2) | 781 (40.5) | <0.001* |
| ICU length of stay, d, median [IQR] | 0.0 [0.0–0.0] | 1.2 [0.0–3.9] | <0.001* |
| Mechanical ventilation for ≥48 h, n (%) | 12 (1.6) | 26 (1.3) | 0.84 |
| Postoperative vasopressors within 2 h of surgery, n (%) | 1 (0.1) | 12 (0.6) | 0.17 |
| Second surgery during admission, n (%) | 77 (10.0) | 277 (14.4) | 0.006* |
| Hours between surgeries, median [IQR] | 92.0 [47.0–148.0] | 72.0 [41.0–141.0] | 0.35 |
| Had emergent second surgery during admission, n (%) | 21 (2.7) | 54 (2.8) | >0.99 |
| Had postoperative red cell transfusion, n (%) | 93 (12.1) | 160 (8.3) | 0.006 |
| Red cell transfusion during admission, n (%) | 133 (17.3) | 218 (11.3) | <0.001* |
| Hospital length of stay, d, median [IQR] | 6.4 [3.4–12.3] | 5.4 [2.6–10.1] | <0.001* |
| Complication, n (%) | |||
| Hospital mortality | 12 (1.6) | 9 (0.5) | 0.01* |
| Discharge to hospice | 24 (3.1) | 9 (0.5) | <0.001* |
| Cardiac arrest | 9 (1.2) | 10 (0.5) | 0.11 |
| Acute kidney injury | |||
| Rapid reversal | 80 (10.4) | 200 (10.4) | 0.99 |
| Persistent, with renal recovery | 45 (5.9) | 71 (3.7) | 0.03* |
| Persistent, without renal recovery | 38 (5.0) | 61 (3.2) | 0.05* |
| Charge and cost | |||
| Professional service charges, $K, median [IQR] | 12.2 [8.2–20.0] | 14.7 [9.0–28.3] | <0.001* |
| Charges for hospital admission, $K, median [IQR] | 109.4 [71.5–164.1] | 113.1 [75.3–172.5] | 0.11 |
| Cost for hospital admission, $K, median [IQR] | 21.8 [13.3–33.9] | 21.6 [13.2–35.7] | 0.99 |
| Value of care, median [IQR] | 0.8 [0.5–1.3] | 1.2 [0.7–1.9] | <0.001* |
Data excludes patients discharged from the hospital on or after February 1, 2020 who may have been affected by coronavirus disease 2019 pandemic–associated changes in ICU bed availability. p Values were adjusted for multiple comparisons using the Benjamini–Hochberg procedure. p Values correspond to significance tests comparing cohorts by each variable in the Outcomes column.
Statistically significant.
IQR, interquartile range.
DISCUSSION
Of ICU admissions, 5% were overtriaged, largely characterized by lesser chronic disease burden but greater initial acute illness severity that lessened between the admission and index operation. Overtriaged admissions often had a second surgery, but few of these were emergent, suggesting that planned reoperations contributed to overtriage decisions. While overtriage and control cohorts had similar outcomes, total costs were approximately $5K greater after overtriage, conferring low value of care. As for ward admissions, 12% were undertriaged, largely characterized by greater age, greater proportions of female patients and patients self-identifying as Black or African American, greater acute and chronic illness severity, and shorter duration of surgery. The undertriage cohort had greater incidence of almost all measured complications and greater lengths of hospital stays. Although we cannot ascertain the degree to which undertriage-associated mortality and morbidity was preventable, earlier work suggests that more than 80% of all ward arrests are preceded by signs and symptoms of decompensation, and the underlying cause is often treatable or preventable.13–15 Total costs were similar between undertriaged admissions and controls, also conferring low value of care. These results were observed in a heterogenous cohort of postoperative admissions from 13 different surgical services. The wide range of patient and surgery types in this study may have compromised model performance, but was intended to optimize generalizability of a triage classification system that can be applied to any postoperative patient. Our results should be interpreted in the context that overtriage may be associated with increased costs, but undertriage is a more egregious error because it is associated with increased mortality and threatens our pledge to first, do no harm.
Our findings are consistent with previous work in which postoperative overtriage was associated with low value of care and in which undertriage was associated with increased mortality and morbidity.3,5 In addition, the incidence of overtriage and undertriage in the current study (5.0% and 12.0%, respectively) were similar to previously reported incidences (4.9% and 10.6%, respectively). There are 2 major differences between the current study and earlier work. First, the patients and providers were different, separated geographically. Second, the patient acuity assessments herein were performed with explainable deep learning models rather than random forests.
Unlike random forest modeling, deep learning is well suited to generating a continuous stream of acuity assessments that could inform continuous triage recommendations after major surgery. For example, the recurrent neural network architecture with gated return units allows the model to continually update its predictions as new, streaming information becomes available.10 Lack of explainability has tempered enthusiasm for clinical application of deep learning; the SHAP values described herein are intended to promote explainability by quantifying the degree and direction to which individual features affect model predictions. A small set of preoperative hospital station and primary surgical service features had important associations with prolonged ICU stay estimations. A larger set of features, primarily representing illness severity, had important associations with hospital mortality estimations. These results are consistent with clinical intuition and scientific literature, which are important factors in gaining clinician trust.1,16
Several elements of this study require further attention before decision support based on the proposed triage classification system can be safely and effectively implemented in clinical settings. In this study, approximately 16% of all hospital beds were ICU beds (129 of 787). In the US, approximately 9% to 10% of all hospital beds are ICU beds.17 At hospitals with fewer ICU beds, the optimal risk thresholds for assigning overtriage and undertriage classifications may be different. Some patients may require ICU admission for frequent neurovascular examinations or continuous invasive monitoring, despite low risk for prolonged ICU admission or hospital mortality; these patients may be more likely to be classified as overtriaged. Some pertinent variables, like free text descriptions of estimated blood loss in operative reports or nursing communications for frequent neurovascular checks, remain unavailable for analysis until we implement validated natural language processing methods. These variables, along with others that are difficult to measure or model in retrospective EHR data (eg hospital bed control dynamics, important indicators of patient physiologic status that were unmeasured due to cognitive or systems-based errors), allow for residual confounding in identifying risk-matched controls; mitigating these sources of confounding would require an experimental trial design with randomization. In addition, retrospective data is unaffected by delayed clinical documentation (eg documenting comorbidities present on admission), which could degrade real-time model performance. Some potential informative features (eg pulmonary function testing) were not available for modeling but could affect the distributions of triage classifications. Diagnostic uncertainty may render ICU admission appropriate for a patient who has low risk for prolonged critical illness or death, and diagnostic uncertainty is not represented explicitly in our postoperative triage classification framework. Predicting rare events like mortality remains difficult, as evident in the poor area under the precision-recall curve for mortality predictions in our study. It may be possible to overcome this challenge by training separate mortality prediction models on separate sets of surgical procedures with different risk profiles so that a single model is not simultaneously generating mortality predictions for, as an example, mastectomies and liver transplants. Larger training datasets would be needed to implement this multimodel approach. Finally, SHAP values do not imply causality, and so they must be interpreted cautiously as modifiable risk factors. Mechanistic models that combine observational data with mathematic models of physiology to estimate outcome probabilities can help establish evidence for potential cause-and-effect relationships, but have not yet been reported in decision support context.18–21 Causal inference will be especially important in further investigation regarding observed associations between undertriage, female sex, and Black or African American race in addressing equity in triage decisions.
CONCLUSIONS
Postoperative overtriage, representing approximately 5% of all ICU admissions, is associated with low value of care. Postoperative undertriage, representing approximately 12% of all ward admissions, is associated with increased mortality and morbidity and low value of care. Overtriage and undertriage classifications were derived from patient acuity assessments generated by an explainable deep learning model using EHR data available at the end of surgery, suggesting opportunities for automated decision support. Before clinical implementation, further investigation is required to test performance in settings with few ICU beds and when using prospective data that is subject to delays in documentation.
Supplementary Material
Support:
This work was supported by the National Institutes of Health [grant number K23GM140268] and the Thomas H Maren Junior Investigator Fund. Dr Bihorac’s institution is supported by the NIH (grant numbers R01 GM110240, R21 EB 027344, R01 NS120924, R01 EB029699, R01 DK121730
Disclosures outside the scope of this work: Dr Guirgis is a paid consultant for Abbott Laboratories. Dr Bihorac reports the following patents: University of Florida, University of Florida Research Foundation Inc, assignee, method and apparatus for prediction of complications after surgery, US patent application number 20200161000, filed 6/1/2018; University of Florida Research Foundation, Inc, assignee, systems and methods for providing an acuity score for critically ill or injured patients, US patent WO2020172607A12020; University of Florida Research Foundation, Inc, assignee, method and apparatus for pervasive patient monitoring, US Patent Application Number 20190326013. Filed 4/18/2019.
Abbreviations and Acronyms
- COVID-19
coronavirus disease 2019
- EHR
electronic health record
- SHAP
Shaply Additive Explanations
- SOFA
Sequential Organ Failure Assessment
Footnotes
Disclosure Information: Nothing to disclose.
Disclaimer: The content is solely the responsibility of the authors and does not necessarily represent the official views of the National Institutes of Health.
Supplemental digital content is available for this article.
Contributor Information
Tyler J Loftus, University of Florida Intelligent Critical Care Center, Gainesville, FL; Department of Surgery, University of Florida Health, Gainesville, FL.
Matthew M Ruppert, University of Florida Intelligent Critical Care Center, Gainesville, FL; Department of Medicine, University of Florida Health, Gainesville, FL.
Benjamin Shickel, University of Florida Intelligent Critical Care Center, Gainesville, FL; Department of Medicine, University of Florida Health, Gainesville, FL.
Tezcan Ozrazgat-Baslanti, University of Florida Intelligent Critical Care Center, Gainesville, FL; Department of Medicine, University of Florida Health, Gainesville, FL.
Jeremy A Balch, University of Florida Intelligent Critical Care Center, Gainesville, FL; Department of Surgery, University of Florida Health, Gainesville, FL; Biomedical Engineering, University of Florida, Gainesville, FL.; Computer and Information Science and Engineering, University of Florida, Gainesville, FL. Electrical and Computer Engineering, University of Florida, Gainesville, FL.
Die Hu, University of Florida Intelligent Critical Care Center, Gainesville, FL; Department of Surgery, University of Florida Health, Gainesville, FL.
Adnan Javed, Department of Emergency Medicine, University of Florida College of Medicine, Jacksonville, FL; Department of Critical Care Medicine, University of Florida College of Medicine, Jacksonville, FL.
Firas Madbak, Department of Surgery, University of Florida College of Medicine, Jacksonville, FL.
David J Skarupa, Department of Surgery, University of Florida College of Medicine, Jacksonville, FL.
Faheem Guirgis, Department of Emergency Medicine, University of Florida College of Medicine, Jacksonville, FL.
Philip A Efron, Department of Surgery, University of Florida Health, Gainesville, FL.
Patrick J Tighe, Department of Anesthesiology, University of Florida Health, Gainesville, FL; Department of Orthopedics, University of Florida Health, Gainesville, FL; Department of Information Systems/Operations Management, University of Florida Health, Gainesville, FL.
William R Hogan, Department of Health Outcomes and Biomedical Informatics, College of Medicine, University of Florida, Gainesville, FL..
Parisa Rashidi, University of Florida Intelligent Critical Care Center, Gainesville, FL; Biomedical Engineering, University of Florida, Gainesville, FL.; Computer and Information Science and Engineering, University of Florida, Gainesville, FL. Electrical and Computer Engineering, University of Florida, Gainesville, FL.
Gilbert R Upchurch, Jr, Department of Surgery, University of Florida Health, Gainesville, FL.
Azra Bihorac, University of Florida Intelligent Critical Care Center, Gainesville, FL; Department of Surgery, University of Florida Health, Gainesville, FL; Department of Medicine, University of Florida Health, Gainesville, FL.
REFERENCES
- 1.Loftus TJ, Balch JA, Ruppert MM, et al. Aligning patient acuity with resource intensity after major surgery: A scoping review. Ann Surg 2022;275:332–339. [DOI] [PMC free article] [PubMed] [Google Scholar]
- 2.Elixhauser A, Andrews RM. Profile of inpatient operating room procedures in US hospitals in 2007. Arch Surg 2010;145:1201–1208. [DOI] [PubMed] [Google Scholar]
- 3.Loftus TJ, Ruppert MM, Ozrazgat-Baslanti T, et al. Association of postoperative undertriage to hospital wards with mortality and morbidity. JAMA Netw Open 2021;4:e2131669. [DOI] [PMC free article] [PubMed] [Google Scholar]
- 4.Iapichino G, Corbella D, Minelli C, et al. Reasons for refusal of admission to intensive care and impact on mortality. Intens Care Med 2010;36:1772–1779. [DOI] [PubMed] [Google Scholar]
- 5.Loftus TJ, Ruppert MM, Ozrazgat-Baslanti T, et al. Postoperative overtriage to an intensive care unit is associated with low value of care. Ann Surg. Published online July 6, 2022. [DOI] [PMC free article] [PubMed] [Google Scholar]
- 6.Datta S, Loftus TJ, Ruppert MM, et al. Added value of intraoperative data for predicting postoperative complications: Development and validation of a MySurgeryRisk extension. Revised November 8, 2019. Available at: arXiv:1910.12895v2. Accessed May 5, 2022. [Google Scholar]
- 7.Bihorac A, Ozrazgat-Baslanti T, Ebadi A, et al. MySurgeryRisk: Development and validation of a machine-learning risk algorithm for major complications and death after surgery. Ann Surg 2019;269:652–662. [DOI] [PMC free article] [PubMed] [Google Scholar]
- 8.Collins GS, Reitsma JB, Altman DG, Moons KG. Transparent reporting of a multivariable prediction model for individual prognosis or diagnosis (TRIPOD): The TRIPOD statement. Br J Surg 2015;102:148–158. [DOI] [PubMed] [Google Scholar]
- 9.Finlayson SG, Subbaswamy A, Singh K, et al. The clinician and dataset shift in artificial intelligence. N Engl J Med 2021;385:283–286. [DOI] [PMC free article] [PubMed] [Google Scholar]
- 10.Shickel B, Loftus TJ, Adhikari L, Ozrazgat-Baslanti T, Bihorac A, Rashidi P. DeepSOFA: A continuous acuity score for critically ill patients using clinically interpretable deep learning. Sci Rep 2019;9:1879. [DOI] [PMC free article] [PubMed] [Google Scholar]
- 11.Lundberg SM, Lee S-I. A unified approach to interpreting model predictions. Advances in Neural Information Processing Systems 2017;4765–4774. [Google Scholar]
- 12.Yount KW, Turrentine FE, Lau CL, Jones RS. Putting the value framework to work in surgery. J Am Coll Surg 2015;220:596–604. [DOI] [PubMed] [Google Scholar]
- 13.Berlot G, Pangher A, Petrucci L, Bussani R, Lucangelo U. Anticipating events of in-hospital cardiac arrest. Eur J Emerg Med 2004;11:24–28. [DOI] [PubMed] [Google Scholar]
- 14.Schein RM, Hazday N, Pena M, Ruben BH, Sprung CL. Clinical antecedents to in-hospital cardiopulmonary arrest. Chest 1990;98:1388–1392. [DOI] [PubMed] [Google Scholar]
- 15.Fry BT, Smith ME, Thumma JR, et al. Ten-year trends in surgical mortality, complications, and failure to rescue in Medicare beneficiaries. Ann Surg 2020;271:855–861. [DOI] [PubMed] [Google Scholar]
- 16.Murdoch WJ, Singh C, Kumbier K, Abbasi-Asl R, Yu B. Definitions, methods, and applications in interpretable machine learning. Proc Natl Acad Sci USA 2019;116:22071–22080. [DOI] [PMC free article] [PubMed] [Google Scholar]
- 17.Wunsch H, Angus DC, Harrison DA, et al. Variation in critical care services across North America and Western Europe. Crit Care Med 2008;36:2787–93, e1. [DOI] [PubMed] [Google Scholar]
- 18.Ma X, Imai T, Shinohara E, et al. EHR2CCAS: A framework for mapping EHR to disease knowledge presenting causal chain of disorders - chronic kidney disease example. J Biomed Inform 2021;115:103692. [DOI] [PubMed] [Google Scholar]
- 19.Kleinberg S, Hripcsak G. A review of causal inference for biomedical informatics. J Biomed Inform 2011;44:1102–1112. [DOI] [PMC free article] [PubMed] [Google Scholar]
- 20.Prosperi M, Guo Y, Bian J. Bagged random causal networks for interventional queries on observational biomedical datasets. J Biomed Inform 2021;115:103689. [DOI] [PMC free article] [PubMed] [Google Scholar]
- 21.Castro DC, Walker I, Glocker B. Causality matters in medical imaging. Nat Commun 2020;11:3673. [DOI] [PMC free article] [PubMed] [Google Scholar]
Associated Data
This section collects any data citations, data availability statements, or supplementary materials included in this article.