

Abstract
Background
Changes in population diet are likely to reduce cardiovascular disease and cancer, but the effect of dietary advice is uncertain. This review is an update of a previous review published in 2007.
Objectives
To assess the effects of providing dietary advice to achieve sustained dietary changes or improved cardiovascular risk profile among healthy adults.
Search methods
We searched the Cochrane Central Register of Controlled Trials, the Database of Abstracts of Reviews of Effects (DARE) and the HTA database on The Cochrane Library (Issue 4, 2010). We searched MEDLINE (Ovid) (1950 to week 2 October 2010) and EMBASE (Ovid) (1980 to Week 42 2010). Additional searches were done on CAB Health (1972 to December 1999), CVRCT registry (2000), CCT (2000) and SIGLE (1980 to 2000). Dissertation abstracts and reference lists of articles were checked and researchers were contacted.
Selection criteria
Randomised studies with no more than 20% loss to follow‐up, lasting at least three months and involving healthy adults comparing dietary advice with no advice or minimal advice. Trials involving children, trials to reduce weight or those involving supplementation were excluded.
Data collection and analysis
Two review authors independently assessed trial quality and extracted data. Study authors were contacted for additional information.
Main results
Forty‐four trials with 52 intervention arms (comparisons) comparing dietary advice with no advice were included in the review; 18,175 participants or clusters were randomised. Twenty‐nine of the 44 included trials were conducted in the USA. Dietary advice reduced total serum cholesterol by 0.15 mmol/L (95% CI 0.06 to 0.23) and LDL cholesterol by 0.16 mmol/L (95% CI 0.08 to 0.24) after 3 to 24 months. Mean HDL cholesterol levels and triglyceride levels were unchanged. Dietary advice reduced blood pressure by 2.61 mm Hg systolic (95% CI 1.31 to 3.91) and 1.45 mm Hg diastolic (95% CI 0.68 to 2.22) and 24‐hour urinary sodium excretion by 40.9 mmol (95% CI 25.3 to 56.5) after 3 to 36 months but there was heterogeneity between trials for the latter outcome. Three trials reported plasma antioxidants, where small increases were seen in lutein and β‐cryptoxanthin, but there was heterogeneity in the trial effects. Self‐reported dietary intake may be subject to reporting bias, and there was significant heterogeneity in all the following analyses. Compared to no advice, dietary advice increased fruit and vegetable intake by 1.18 servings/day (95% CI 0.65 to 1.71). Dietary fibre intake increased with advice by 6.5 g/day (95% CI 2.2 to 10.82), while total dietary fat as a percentage of total energy intake fell by 4.48% (95% CI 2.47 to 6.48) with dietary advice, and saturated fat intake fell by 2.39% (95% CI 1.4 to 3.37).
Two trials analysed incident cardiovascular disease (CVD) events (TOHP I/II). Follow‐up was 77% complete at 10 to 15 years after the end of the intervention period and estimates of event rates lacked precision but suggested that sodium restriction advice probably led to a reduction in cardiovascular events (combined fatal plus non‐fatal events) plus revascularisation (TOHP I hazards ratio (HR) 0.59, 95% CI 0.33 to 1.08; TOHP II HR 0.81, 95% CI 0.59 to 1.12).
Authors' conclusions
Dietary advice appears to be effective in bringing about modest beneficial changes in diet and cardiovascular risk factors over approximately 12 months, but longer‐term effects are not known.
Keywords: Adult; Humans; Diet; Blood Pressure; Blood Pressure/physiology; Cardiovascular Diseases; Cardiovascular Diseases/prevention & control; Cholesterol; Cholesterol/blood; Diet, Fat‐Restricted; Diet, Sodium‐Restricted; Dietetics; Dietetics/methods; Randomized Controlled Trials as Topic
Plain language summary
Dietary advice for reducing cardiovascular risk
Diet is an important determinant of chronic disease risk, particularly heart disease. This review assessed the effects of providing dietary advice to healthy adults in order to produce sustained improvements in their diets. Whether dietary improvement would reduce the risk factors associated with heart disease was also examined. We found 44 trials in which healthy adults were randomly assigned to receive dietary advice or no dietary advice. The dietary improvements recommended to the people in the intervention groups centred largely on the reduction of salt and fat intake and an increase in the intake of fruit, vegetables and fibre. Advice was delivered in a variety of ways, including one‐to‐one contact, group sessions and written materials. There were variations in intensity of the intervention, ranging from one contact per study participant to 50 hours of counselling over four years. The duration of the trials ranged from three months to four years, with a median follow‐up period of 12 months. There was some evidence of greater effectiveness in people told that they were at risk of heart disease or cancer. Modest improvements were shown in cardiovascular risk factors, such as blood pressure and total and LDL‐cholesterol levels. In the trials that separated effects by gender, women tended to make larger reductions in fat intake but there was insufficient evidence to show whether this translated to a larger reduction in total cholesterol levels. Two trials followed people up 10 to 15 years after the end of the trials and showed that the beneficial changes in cardiovascular risk factors may have resulted in a reduced incidence of heart disease, stroke or heart attack, although more evidence is needed to confirm this.
Background
Dietary change is an important component of any strategy to achieve population level reductions in the burden of cardiovascular disease (CVD). Several Cochrane reviews (Hooper 2004a; Hooper 2004b; Hooper 2012; Kelly 2004; Kelly 2007) have considered the effectiveness of different aspects of dietary intake on the level of cardiovascular risk. However, an important question is how individuals and communities can be encouraged and supported to reduce their risk of cardiovascular disease by making changes in their diet.
Public health policy in the UK and elsewhere advocates dietary change as a means to improve population health (DOH 2004). There remains some uncertainty about whether dietary advice given to healthy individuals is effective in achieving change (FHSG 1994; Hooper 2004a; Hooper 2004b; Kelly 2004; Ramsay 1991). In this review we aimed to quantify the impact of dietary advice given to healthy, free living adults and to identify factors that influence the effectiveness of dietary advice. We have excluded weight reduction trials because although obesity is a risk factor for cardiovascular disease and a major public health problem, other systematic reviews which address obesity are registered with Cochrane Review groups (for example Curioni 2006; Flodgren 2010; Norris 2005; O'Halloran 2010; Oude Luttikhuis 2009; Waters 2011) and other health technology research organisations (Avenell 2004). We have also excluded trials involving supplementation, free foods or drinks or financial inducements because we are interested in the effects of advice rather than other interventions.
Dietary factors in risk of cardiovascular disease (CVD)
Dietary pattern is an important determinant of chronic disease risk and overall mortality (Knoops 2004; Trichopoulou 2005). Although drug treatment, such as lipid‐lowering with statins, may be appropriate among individuals at high risk of CVD (Yusuf 2009), adoption of a healthy diet is preferable to long‐term medication in the general population in order to prevent or delay the onset of disease and to reduce the burden on health services.
Dietary advice to reduce risk of cardiovascular disease (CVD)
Advice that encourages consumption of a diet that is relatively lower in any one or more of fat, saturated fatty acids, cholesterol or sodium; or relatively higher in any one of fruit, vegetables, polyunsaturated fatty acids, monounsaturated fatty acids, fish, fibre or potassium is likely to reduce the risk of CVD and certain cancers (COMA 1994; DOH 2004; HSS 2005; WHO 2003). In almost all developed countries, intake of salt and saturated fat are undesirably high and should be reduced, while increases in intake of poly‐ and mono‐unsaturated fats and fruit and vegetables are needed (for example Dietary Guidelines for Americans 2010; DOH 2004; FSA 2006). Dietary advice can take many forms, including verbal or written, single or multiple contacts with individuals or groups, and may be delivered by health professionals or other agencies such as fitness consultants, trade unions or commercial organisations. The present review was concerned with trials of the effect of such advice in healthy European, North American, Australasian and Japanese populations.
How dietary advice might work
Dietary change has been shown to modify risk. For example, changes in the quantity and quality of dietary fat improve the lipid profile (Mensink 1992) and blood pressure is lowered by reducing sodium intake (Hooper 2004a) and increasing potassium intake (Cappuccio 1991). These findings are based on trials involving well‐motivated individuals, often in metabolic wards (Mensink 1992), living in institutions (Dayton 1969; Frantz 1989; Turpeinen 1979) or receiving treatment in a hospital clinic (Watts 1992).
High risk versus population strategies
Individuals found to be at high risk of CVD may have the motivation to make large changes in their dietary intake, although in practice such changes may be difficult for an individual to achieve, even in environments where healthy eating is the norm, and the changes may be difficult to maintain. More importantly, dietary changes in a minority of high risk individuals will have little effect on the overall population burden of cardiovascular disease. Rose has elegantly demonstrated how it is only changes in the overall population levels of total blood cholesterol level, for example, that can achieve a significant reduction in the population level burden of disease (Rose 1993). More recently, Barton and colleagues (Barton 2011) have demonstrated, using a spread sheet model, that small population shifts in mean intake of salt or in mean level of total cholesterol concentration would result in considerable reductions in cardiovascular events and very large savings to the health service in the UK. There are a variety of fiscal and legislative interventions that might be employed to change a population’s diet (NICE 2010), but they are outside the scope of this review.
Why it is important to do this review
Dietary change is an alternative to long‐term statin and other medication for reducing cardiovascular risk among healthy people. There is plentiful evidence that risk factor reduction using statins and blood pressure lowering drugs cuts the risk of heart attack and stroke among two broad groups. Those who have existing vascular disease (for secondary prevention) and those who are healthy but at high risk (for primary prevention) are likely to experience benefit from drug treatment that far outweighs the harms (HPS 2011; Law 2009; Taylor 2011). However, among healthy people at low risk there is less evidence that benefits exceed harms with long‐term drug‐based risk factor lowering. Recent systematic reviews differ in their interpretation of this evidence, suggesting on one hand that caution should be exercised in prescribing statins to individuals at low cardiovascular risk (Taylor 2011) and on the other hand that most people if not everyone over age 50 years, regardless of their cholesterol and blood pressure levels, are likely to benefit from drug treatment (CTT 2012; Law 2009). Trials of statin therapy in the largest systematic review to date have a median duration of five years (CTT 2012), whereas advocates of long‐term treatment suggest that many millions should take a statin daily for some 50 years. While It might turn out that the mass‐medication strategy is effective with respect to cardiovascular disease prevention across the whole risk factor distribution, and has no downside, there may be many who will opt for behaviour change rather than daily medication for various reasons, if given a balanced and evidence‐based choice.
This review addresses the important question of the effect of dietary advice among healthy people. Dietary advice is one of many strategies available to achieve health‐promoting change in dietary patterns in the population (O'Flaherty 2012; Thorogood 2007). The previous version of this review (Brunner 2007) collated 38 trials with 17,871 participants or clusters and found that various modalities of dietary advice appeared to be effective in bringing about modest beneficial changes in diet and cardiovascular risk factors over approximately 10 months. The longer‐term effects remained unclear. The present substantive update extends the literature search from November 2006 to October 2010 and adds six further studies plus longer follow‐up in one trial. The overall conclusions remain unchanged. The review includes estimates of the effects of intervention‐related reductions in serum cholesterol and blood pressure on the incidence of coronary heart disease and stroke.
Objectives
To assess the effects of providing dietary advice for obtaining sustained, desirable dietary changes or improvement in cardiovascular risk profile among healthy adults.
Methods
Criteria for considering studies for this review
Types of studies
We have included randomised controlled trials (RCTs) involving parallel group design, with allocation at either individual or group level. All trials involved dietary advice designed to reduce chronic disease risk and had at least three months of follow‐up from recruitment. Trials were excluded if there was more than 20% loss to follow‐up, unless there was an intention‐to‐treat analysis.
Types of participants
Participants were healthy community‐dwelling adults aged 18 years or older. Less than 25% of the participants in any trial had diagnosed cardiovascular disease (CVD) at recruitment. Reported use of pharmacological therapy (for example statins or diuretics) during the trial was no greater then 10% of participants in any arm of the trial. Trials involving pregnant women or children, trials to reduce weight or those involving supplementation were excluded.
Types of interventions
Dietary interventions involve verbal or written advice delivered in person or over the phone to individuals or small groups. The advice could include a combination of such approaches and be given by health professionals or other personnel. Trials could include additional interventions such as posters in a work canteen. We considered trials involving advice to decrease consumption of one or more of fat, saturated fatty acids, cholesterol or salt; or increase consumption of one or more of fruit, vegetables, polyunsaturated fatty acids, monounsaturated fatty acids, fish, fibre or potassium; or both. We have restricted this review to interventions involving only advice on diet to minimise confounding. Multiple interventions, such as those involving advice on physical activity, were excluded. Trials of weight reducing diets were excluded. The control group received no or minimal dietary advice.
Types of outcome measures
For all outcome measures the preferred measure of effect was the estimated mean net change in the outcome variable over the duration of the trial. The net change was the change in the outcome measure in the intervention group minus the change in the control group.
Primary outcomes
1. Cardiovascular risk factors: resting blood pressure, blood lipids and lipoproteins (cholesterol), blood or red cell folate and homocysteine. 2. Bio‐markers of dietary intake: urinary sodium, urinary potassium and blood diet‐derived antioxidants such as β‐carotene.
Secondary outcomes
Self‐reported measures of dietary intake, including fat, fat fractions, dietary fibre, fish, fruit and vegetables, vitamin C (ascorbic acid), vitamin E (tocopherols), carotenoids, flavonoids and folic acid.
Follow‐up
Trials were included if they had at least three months follow‐up from baseline. The longest follow‐up duration was used provided loss to follow‐up was less than 20% for the outcome measure of interest, unless there was an intention‐to‐treat analysis.
Search methods for identification of studies
Electronic searches
We searched the Cochrane Central Register of Controlled Trials, the Database of Abstracts of Reviews of Effects (DARE) and the HTA database on The Cochrane Library (Issue 4, 2010). We searched MEDLINE (Ovid) (1950 to week 2 October 2010) and EMBASE (Ovid) (1980 to Week 42 2010).
Additional searches were done on CAB Health (January 1972 to December 1999), CVRCT Registry (December 2000), INST ED‐Bibliomap and INST ED‐EPPI‐Centre (December 2000), Current Controlled Trials (December 2000) and SIGLE (January 1980 to June 2000) for earlier updates of this review.
The search strategies used for The Cochrane Library, MEDLINE and EMBASE for the original review and previous updates are presented in Appendix 1, and for the 2010 update in Appendix 2. The RCT filter as recommended in the Cochrane Handbook for Systematic Reviews of Interventions has been applied (Lefebvre 2011).
Handsearching and other sources
In the original review and this latest update, bibliographies of systematic reviews addressing food‐based dietary interventions relevant to CVD were checked as a source of RCTs. Cochrane Review Groups in areas related to this review include the Diabetes Group, Stroke Group, Renal Group, Hypertension Group and Peripheral Vascular Disease Group. In the original review these groups were contacted and asked to search their trials registers for relevant trials.
Experts in the field were contacted for references to studies not yet identified by the search process. Experts were defined as members of the Cochrane Heart Group, persons who served as an author (not necessarily the primary author) on more than one trial meeting the inclusion criteria for the review, the contact author for any relevant trial or the contact author for any relevant systematic review. No language restrictions were applied and evaluations of all relevant non‐English articles were obtained.
Data collection and analysis
Selection of studies
For the original search the titles and then the abstracts of potentially relevant references were read independently by two review authors. Articles were rejected only if both review authors determined from the title or abstract that the article was not a report of a randomised controlled trial; or the trial did not address food‐based dietary advice relevant to CVD; or the trial was of less than three months duration; or the intervention was multi‐factorial.
The results of the updated searches were checked by one review author to eliminate those studies that were definitely not relevant to the review. Remaining records were independently checked by two review authors. All papers that were thought to be of relevance were obtained and read by two review authors independently. Two review authors independently selected trials to be included in the review using the predetermined inclusion criteria. A proforma was used to determine study inclusion status. Disagreements were resolved by discussion or by consultation with a third review author.
Data extraction and management
Data on participants, interventions, outcomes and trial quality were extracted independently by two review authors using a proforma. Disagreements were resolved by discussion. Chief investigators were contacted to provide additional relevant information. Data on potential effect modifiers were abstracted, including the setting of the trial (work site, community, home or healthcare facility), duration of the intervention and the follow‐up, intensity of advice giving (number of scheduled contacts) and proportion of participants who were women.
Assessment of methodological quality of included studies
Quality assessment was based on reporting of the randomisation procedure, allocation concealment and blinding of outcome assessment. Allocation concealment (concealing group assignment) was considered adequate if participants were randomised individually after recruitment was complete. Allocation concealment was considered inadequate in cluster randomised trials where all participants at a given location were assigned to the same intervention or control group. Trial personnel and participants in trials of dietary advice, as with other behavioural interventions, cannot be blinded to the nature of the intervention. Where the report of the trial method indicated that outcome measures were determined without knowledge of group assignment, blinding of outcome assessment was considered adequate.
Measures of intervention effect
All outcomes were continuously distributed. We compared net differences between baseline and follow‐up measurements and calculated the difference in means and 95% confidence interval for each outcome measure (Deeks 2011). We combined net differences across studies using a random‐effects model. Where standard deviation differences were not reported in the source papers, we made allowances for within participant correlation from baseline to follow‐up measurements by using the correlation coefficient between the two (see Deeks 2011 for details and Follmann 1992). In the latest update, data 10 to 15 years after completion of the intervention were available for two trials already included in the review, which now report clinical events (TOHP I; TOHP II). Adjusted hazard ratios were reported for these two trials and we presented the results in narrative form.
Unit of analysis issues
Studies with multiple intervention groups
Data for the control group were used for each intervention group comparison. The weight assigned to the control group was reduced by dividing the control group N by the number of intervention groups.
Cross‐over trials
Data for the two periods were combined only if the study design ensured minimal carry‐over effects.
Cluster randomised trials
Cluster randomised trials were analysed using the unit of randomisation (cluster) as the number of observations. Where necessary, individual level means and standard deviations adjusted for clustering were utilised together with the number of clusters in the denominator, in order to weight the trials appropriately.
Missing data
If a trial collected an outcome measure at more than one time point, the longest period of follow‐up with 20% or fewer dropouts was utilised.
Assessment of reporting biases
The primary outcome measurements, apart from blood pressure, depended on laboratory analysis. Potential reporting bias was likely to be important only in the case of trial personnel involved in blood pressure measurement. Secondary outcomes in this review were the self‐reported measures of dietary intake. Measures of diet were considered to be, at best, weak estimates of actual behaviour and behaviour change.
Subgroup analysis and investigation of heterogeneity
For each outcome, a test of heterogeneity was carried out using the I2 statistic. If we detected substantial heterogeneity, we looked for possible explanations (for example participants and intervention). Regardless of the magnitude of heterogeneity, where six or more trials provided data for a given outcome the results were grouped according to five potential effect‐modifying factors.
Gender: women, men, mixed.
Disease risk group: general population, high CVD risk, high cancer risk.
Intervention setting: healthcare, community or workplace or home.
Intervention intensity: low, high (more than three scheduled personal contacts with participants enrolled in the intervention arm(s) of a trial).
Trial duration: short, long (follow‐up at 12 months or more).
Results
Description of studies
Results of search
In earlier versions of this review, the searches up to the year 2006 generated 45,100 hits. Screening of titles and abstracts identified 299 papers for formal inclusion or exclusion. In the original review 23 trials met the inclusion criteria. When the review was updated in the year 2006, 15 more trials met the inclusion criteria so 38 trials were then included, a substantial increase on the 23 included in the original review. The latest update from the year 2006 to 2010 generated 23,300 further hits, and screening the titles and abstracts identified 306 papers for formal inclusion or exclusion. Of these, seven studies met the inclusion criteria; five of these were new trials (Ammerman 2003; Anderssen 2007; Beckman 1995; ENCORE; Silman 1983), one was a report of longer‐term follow‐up of two trials already included in the review (TOHP I; TOHP II), and one reported data from a previously identified ongoing study (Bowen 2004). The PRISMA flow diagram for the most recent update (from the years 2006 to 2010) is presented in Figure 1. Forty‐four trials are now included in this review.
1.

Study flow diagram for 2010 update.
All five new trials reported one of the primary outcomes and were included in the meta‐analyses. Lipid levels were reported in four of five trials (Ammerman 2003; Anderssen 2007; Beckman 1995; ENCORE), systolic and diastolic blood pressure in three (Anderssen 2007; ENCORE; Silman 1983) and two reported urinary sodium and potassium (Beckman 1995; ENCORE). The trial identified from previous searching as an ongoing trial reported dietary intake of fat, fruit and vegetables and fibre (Bowen 2009). Long‐term follow‐up of two trials previously included in the review (TOHP I; TOHP II) reported clinical events 10 to 15 years after the end of the intervention period.
Details of the 44 studies now included in the review are shown in the table 'Characteristics of included studies'. Reasons for exclusion for the majority of studies included no randomisation, no dietary advice intervention, multifactorial interventions and the control group did not receive minimal intervention or no intervention. Details and reasons for exclusion for the studies which most closely missed the strict inclusion criteria are presented in the table 'Characteristics of excluded studies'.
Included studies
Details of methods, participants, interventions and outcome measures are presented in the included studies table. Forty‐four trials with 52 trial arms were included with 18,175 participants or clusters randomised. Twenty‐nine of the 44 included trials were conducted in the USA.
Weight change
Twenty‐four of the 33 individually randomised trials provided information on initial weight or weight loss during follow‐up. Baseline body mass index (BMI) was approximately 30 kg/m2 in two trials (Cheng 2004; Cox 1996) while other trials involved participants with lower BMI. Net mean weight loss in the intervention groups during follow‐up was 1 kg or less in 14 trials (Anderson high fibre; Anderson low fibre; Baron men 1990; Baron women 1990; Bloemberg 1991; Brekke 2005; Cheng 2004; ENCORE; Hellenius 1993; John 2002; Maskarinec 1999; Neil dietitian1995; Neil nurse 1995; Sacerdote 2006; Smith‐Warner 2000; Takahashi 2006; van der Veen 2002), 1.1 kg in one (Schatzkin 2000) and 1.8 kg in one trial (Henderson WHTV 1990). Two trials showed more substantial weight loss during the trial with the intervention, of 2.7 kg (Beckman 1995) and 5.2 kg (Anderssen 2007).
Gender
Twenty‐nine trials enrolled men and women. Of these, one presented the findings by gender (Baron men 1990; Baron women 1990). Ten trials enrolled women only and five men only.
Disease risk group
Eighteen trials enrolled participants without screening, of which three involved American women with high prevalence of food poverty (Coates WHT MP 1999; Cox 1996; Havas 1998), two recruited American women through direct contact and mailings (Elder promotora; Elder tailored; Gann 2003), three involved clients of American health maintenance organisations (Kristal 2000; Lutz non‐tailored; Stevens 2003), two recruited from healthcare settings in Italy and the UK (John 2002; Sacerdote 2006), two recruited from American churches (Bowen 2009; Fuemmeler 2006) and three from US worksites (Beresford 2006; Buller 1999; Sorensen worksite).
Nineteen trials enrolled participants on the basis of CVD disease risk factor screening, of which eight involved cholesterol screening (Ammerman 2003; Anderson high fibre; Bloemberg 1991; Cheng 2004; Hellenius 1993; Keyserling 1997; Neil dietitian1995; van der Veen 2002), eight blood pressure screening (Anderssen 2007; Beckman 1995; ENCORE; Koopman 1990; Little 2004; Silman 1983; TOHP I; TOHP II) and one plasma homocysteine screening (Riddell 2000). One trial enrolled siblings of coronary heart disease (CHD) patients diagnosed before 60 years of age with at least one other risk factor (for example high cholesterol or blood pressure levels) (Moy 2001) and one recruited first degree relatives of type‐2 diabetic patients (Brekke 2005).
Three trials enrolled people who were at increased risk of breast cancer (Djuric combination; Djuric high F&V; Henderson WHTV 1990; Maskarinec 1999), one trial enrolled people at increased risk of cervical cancer (Rock 2001), two trials enrolled people at increased risk of colorectal cancer (Schatzkin 2000; Smith‐Warner 2000) and one trial enrolled car workers being screened for colorectal cancer (Tilley 1999).
Intervention setting
Most studies involved interventions in healthcare settings (30 studies), while others were set in the work place (four studies), community centres (seven studies) or exclusively in the home (three studies) using telephone and mail (Kristal 2000; Lutz non‐tailored; Lutz tailored 1999; Lutz tailored&goals; Rock 2001).
Intervention intensity
Eighteen trials involved an intervention design with between one and three scheduled contacts. Twenty‐six trials involved a design with between four brief interventions and 50 hours of individual counselling over four years (Schatzkin 2000).
Trial duration
The modal duration of follow‐up was 12 months (16 studies). There were eight short duration trials: five of three months (Ammerman 2003; Baron men 1990; Baron women 1990; Elder promotora; Elder tailored; Koopman 1990; Riddell 2000) and three of four months (Cheng 2004; ENCORE; Keyserling 1997). Twenty‐three studies contributed results for 12 to 48 months of follow‐up.
Six or more trials provided results for serum total cholesterol, blood pressure, total dietary fat, and fruit and vegetable intake and five subgroup analyses, as above, were displayed to explore effect modification.
Risk of bias in included studies
In general, details of the methods utilised in the included studies in this review were not well reported (Moher 2001). The risk of bias of the included studies as reported in the source papers was summarised in Table 1 for the original review and previous updates, and also in the risk of bias tables for the six new trials.
1. Risk of bias of included studies.
| Study ID | Randomisation | Alloc. concealment | Blinding? | Loss to follow‐up |
| Ammerman | Unclear | Unclear | Unclear | 13% loss to follow‐up at 3 months, 27% at 6 months. Data have been analysed at 3 months |
| Anderson | Stratified systematic random procedure | Unclear | Unclear | 17.5% loss to follow‐up over 12 months |
| Anderssen | Unclear | Unclear | Unclear | No losses to follow‐up were reported |
| Baron | Unclear | Unclear | Unclear | 18% loss to follow‐up at 3 months |
| Beckmann | Unclear | Unclear | Unclear | No details, stated used ITT analysis |
| Beresford | Random numbers | Unclear. | Interviewer and participants blind to group allocation | 14% of individuals lost to follow‐up over 12 months |
| Bloemberg | Unclear | Unclear | Outcome assessors | 1% loss to follow‐up over 6 months |
| Bowen | Stratified randomisation of religious organisations by denomination, size, baseline response rate, percentage of families and education level. | Unclear | Unclear | 9.4% of the intervention group and 11% of the control group were lost to follow‐up at 12 months |
| Brekke | Minimisation method for small clinical trials (Altman) to balance a large number of strata | Unclear | Unclear | 8.5% of individuals lost to follow‐up over 12 months |
| Buller | Unclear | Adequate. Project statistician | Unclear | Clusters analysed, but response rate to follow‐up surveys for individuals only 64% at 6 months |
| Cheng | Random number table | Unclear | Unclear | 16% of individuals lost to follow‐up at 4 months |
| Coates WHR MP | Unclear | Unclear | Unclear | 19% of the intervention group lost to follow‐up at 6 months, at 12 months loss to follow‐up was 33%, at 2 years 76% |
| Cox | Lottery method | Unclear | Unclear | None reported from the CVD arm of the trial |
| Djuric | Unclear | Unclear | Unclear | 16.3% of individuals lost to follow‐up over 12 months, 37% at 2 years. Data were analysed at 12 months |
| Elder | Unclear | Unclear | Unclear | 12.3% loss to follow‐up at 12 weeks, 21.5% at 12 months. Data have been analysed at 12 weeks |
| ENCORE | Computer programme | Adequate ‐ sealed envelopes | Outcome assessors | No losses in the intervention group, 2% loss to follow‐up in the control group over 4 months |
| Fuemmeler | Unclear | Unclear | Unclear | Clusters analysed, no loss of clusters, 16% of individuals lost to follow‐up over 12 months |
| Gann | Random number table | Unclear | Unclear | 16.9% of individuals lost to follow‐up over 12 months |
| Havas | Unclear | Unclear | Unclear | I of 16 sites excluded ‐ 6.25% |
| Hellenius | Unclear | Unclear | Unclear | 2% loss to follow‐up over 6 months |
| Henderson WHT V | Unclear | Unclear | Unclear | 5.3% loss to follow‐up over 24 months |
| John | Computer generated randomisation list | Unclear | Unclear | 7.7% of individuals lost to follow‐up over 6 months |
| Keyserling | Unclear | Unclear | Unclear | 8% loss to follow‐up for blood analyses |
| Koopman | Unclear | Unclear | Unclear | 14% loss to follow‐up over 3 months |
| Kristal | Unclear | Unclear | Unclear | 13.5% loss to follow‐up over 12 months |
| Little | Random number table | Adequate ‐ opaque sealed envelopes | Unclear | 14% lost to follow‐up for prompt plus salt and control group at 6 months. 27% loss to follow‐up in the prompt group ‐ these data were excluded |
| Lutz | Unclear | Unclear | Unclear | 19% loss to follow‐up at 6 months |
| Maskarinec | Unclear | Unclear | Unclear | 12% loss to follow‐up over 6 months |
| Moy | Unclear | Unclear | Unclear | 23% lost to follow‐up over 12 months but authors used ITT analysis |
| Neil | List of consecutive random treatment assignments | Unclear | Outcome assessors | 9.7% loss to follow‐up |
| Riddell | Unclear | Unclear | Unclear | 4.5% loss to follow‐up at 12 weeks |
| Rock | Unclear | Unclear | Unclear | 5.4% of individuals lost to follow‐up over 6 months |
| Sacerdote | Random numbers generated by computer | Unclear | Outcome assessors | 6.4% lost to follow‐up over 12 months |
| Schatzkin | Computer program of random numbers | Adequate. Telephone coordinating centre | Unclear | 8.4% loss to follow‐up over 4 years |
| Silman | Unclear | Unclear | Unclear | 16.6% in the intervention group and 6.3% in the control group were lost to follow‐up for the outcome BP over 12 months |
| Smith‐Warner | Unclear | Unclear | Unclear | 8% loss to follow‐up at 12 months |
| Sorensen | Unclear | Unclear | Unclear | 3.9% individuals lost to follow‐up at 19.5 months |
| Stevens | Unclear | Unclear | Unclear | 13% lost to follow‐up over 12 months |
| Takahashi | Unclear | Unclear | Unclear | 2.9% loss to follow‐up for questionnaire‐based outcomes, 17.2% for blood pressure outcomes over 12 months |
| Tilley | Random number table | Unclear | Unclear | 1.6% individuals lost to follow‐up at 12 months, 3.5% at 24 months |
| TOHP I | Unclear | Unclear | Outcome assessors | 20% loss to follow‐up over 12 months |
| TOHP II | Unclear | Adequate. Telephone coordinating centre or opaque envelopes | Outcome assessors | 7.5% loss to follow‐up at 18 months |
| van der Veen | Unclear | Unclear | Unclear | Clusters analysed, no loss of clusters but 9% of individuals lost to follow‐up over 12 months |
Randomisation
All trials involved randomisation but the methods were poorly described.
Allocation concealment
Four of the 33 individually randomised trials appeared to have used an adequate allocation concealment method (ENCORE; Little 2004; Schatzkin 2000; TOHP II). Eleven studies involved cluster randomisation and allocation concealment was considered adequate in one case (Buller 1999).
Blinding of outcome assessment
Blinding of participants to the intervention was not possible in trials of behavioural advice, however outcome assessment could be conducted by trial personnel without knowledge of group allocation. Primary outcomes in this review were CVD risk factors and biomarkers of dietary intake. With the exception of blood pressure, these outcomes were relatively free of the risk of information bias. There was some indication of blinding in the reports of 13 trials (Anderson high fibre; Anderson low fibre; Beresford 1997; Bloemberg 1991; Coates WHT MP 1999; ENCORE; Hellenius 1993; Keyserling 1997; Maskarinec 1999; Neil dietitian1995; Neil nurse 1995; Riddell 2000; Sacerdote 2006; Smith‐Warner 2000; TOHP I). The secondary outcomes were self‐reported measures of dietary intake, commonly based on a food frequency questionnaire. In one case (ENCORE) there was an adequate description of the procedures used to blind the assessors of dietary intake during data collection or analysis.
Unit of analysis issues
Eleven trials were cluster randomised. In one community trial a cross‐over design was used such that each site acted as its own control and the site was the unit of analysis (Havas 1998). In a work place trial 41 pairs of employee cliques (informal social networks) were the unit of randomisation and analysis (Buller 1999). In two further work place trials, worksite was the unit of randomisation but data were analysed at the level of the individual. We used the worksite as the denominator for the meta‐analysis (Tilley 1999; TOHP I). Another worksite trial analysed data at the level of the cluster (Beresford 2006). Three trials based in clinics used physician practice as the unit of randomisation but analysed the data at an individual level. Analysis allowed for random effects of clinic and physician practice, with the physician nested within the clinic. We used the physician as the denominator for the meta‐analysis (Beresford 1997; Keyserling 1997; van der Veen 2002). One trial randomised health departments, where analysis was at the individual level, allowing for random effects of the health department (Ammerman 2003). The denominator used in this review was the health department. Two trials were based in American churches where data were analysed at the individual level taking account of clustering (Bowen 2009; Fuemmeler 2006). We used churches as the denominator in the meta‐analysis. This provided a conservative estimate of effect.
Loss to follow‐up
Our inclusion criteria specified that loss to follow‐up was no more than 20%. We used the longest reported follow‐up data for each trial in the analysis meeting these inclusion criteria. Dropout rose to more than 20% at longer follow‐up in several trials (Ammerman 2003; Baron men 1990; Baron women 1990; Coates WHT MP 1999; Djuric combination; Djuric high F&V; Elder promotora; Elder tailored; TOHP I) and the proportion taking lipid‐lowering medication exceeded 10% after four months in another (Keyserling 1997).
Effects of interventions
Cardiovascular risk factors and dietary variables
For the variables fruit and vegetable consumption, dietary fibre, high density lipoprotein (HDL) cholesterol, urinary potassium and micronutrients, an increase in value from baseline to follow‐up indicated improvement with the dietary intervention. Summary statistics were based on a random‐effects model.
Any dietary advice versus no dietary advice (comparison 01)
Blood pressure and urinary sodium and potassium
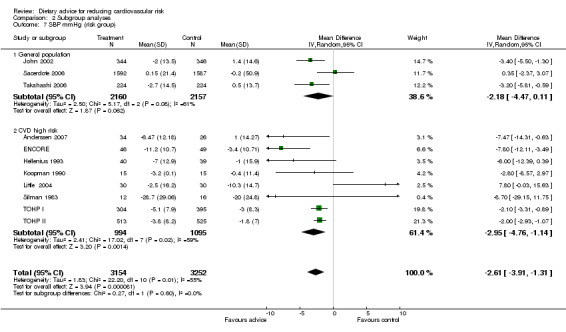
Systolic blood pressure and diastolic blood pressure were reported in 11 studies (6406 participants randomised). Three trials focused on salt reduction (Silman 1983; TOHP I; TOHP II), one on salt reduction plus increased dietary fibre and polyunsaturated fatty acid intakes (Koopman 1990) and one on sodium reduction and increased intake of vitamin C and carotene by increasing fruit and vegetable intake (Takahashi 2006). One trial focused on increasing fruit and vegetable intake (John 2002) and the others more broadly on healthy eating advice (Anderssen 2007; ENCORE; Hellenius 1993; Little 2004; Sacerdote 2006). Initial mean blood pressure in the control group of these studies was in the range 125/84 to 161/98 mm Hg (Table 2).
2. Initial mean level of risk factors in control group of included studies.
| Study ID | Cholesterol mmol/l | Blood pressure mmHg |
| Ammerman 2003 | 6.63 | not available |
| Anderson 1992 | 5.9 | not available |
| Anderssen 2007 | 6.4 | 134/90 |
| Baron 1990 men | 4.8 | not available |
| Baron 1990 women | 4.9 | not available |
| Beckmann 1995 | 6.12 | mean standing BP 112 |
| Bloemberg 1991 | 7.0 | not available |
| Brekke 2005 | 4.95 | not available |
| Coates 1999 HT MP | 5.7 | not available |
| Cheng 2004 | 6.0 | not available |
| Djuric 2006 | 4.43 | not available |
| ENCORE | 5.33 | 138/86 |
| Hellenius 1993 | 6.0 | 130/82 |
| John 2002 | 5.12 | 129/80 |
| Keyserling 1997 | 6.5 | not available |
| Koopman 1990 | not available | 144/95 |
| Little 2004 | not available | 154/93 |
| Moy 2001 | not available | not available |
| Neil 1995 | 7.4 | not available |
| Sacerdote 2006 | not available | 129/79 |
| Silman | not available | 161/98 |
| Stevens 2003 | 6.01 | not available |
| Takahashi 2006 | not available | 128/76 |
| TOHP I | not available | 125/84 |
| TOHP II 1997 | not available | 127/86 |
| van der Veen 2002 | 6.6 | not available |
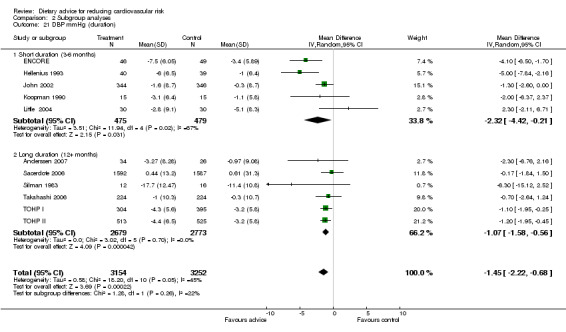
Systolic blood pressure was reduced by 2.61 mm Hg (difference in means ‐2.61, 95% CI ‐3.91 to ‐1.31) and diastolic blood pressure by 1.45 mm Hg (difference in means ‐1.45, 95% CI ‐2.22 to ‐0.68) (Analysis 1.2) with dietary advice (Analysis 1.1; Analysis 1.2).
1.1. Analysis.
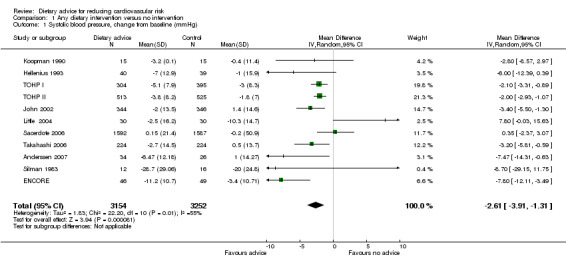
Comparison 1 Any dietary intervention versus no intervention, Outcome 1 Systolic blood pressure, change from baseline (mmHg).
1.2. Analysis.
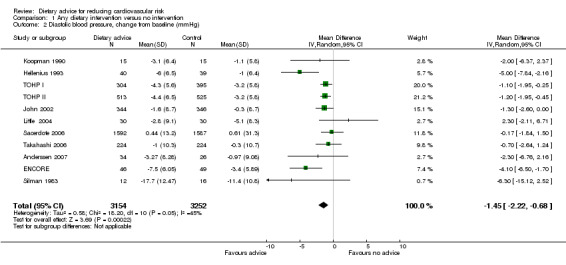
Comparison 1 Any dietary intervention versus no intervention, Outcome 2 Diastolic blood pressure, change from baseline (mmHg).
One further study that focused on salt reduction reported mean blood pressure both supine and standing (Beckman 1995). Results from this study could not be combined with those above. The authors found an 8 to 10 mm Hg difference between the intervention and control groups at 3, 6 and 12 months for both standing and supine blood pressure.
Twenty‐four hour urinary sodium output was reported in four trials of salt reduction (Beckman 1995; Koopman 1990; TOHP I; TOHP II) and one of the DASH diet (ENCORE). The loss to follow‐up was too great for this outcome in a further trial and so these data did not contribute to the analysis (Silman 1983). Five trials with 1670 participants randomised contributed to the analysis. Urinary sodium output was reduced by 40.92 mmol/24 hr (difference in means ‐40.92, 95% CI ‐56.54 to ‐25.29) but there was substantial heterogeneity between trials for this outcome (I2 = 88%) (Analysis 1.3).
1.3. Analysis.
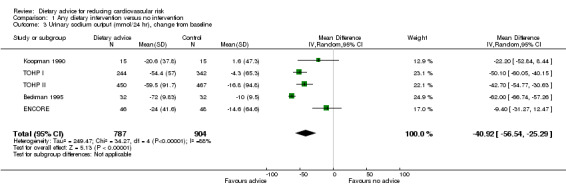
Comparison 1 Any dietary intervention versus no intervention, Outcome 3 Urinary sodium output (mmol/24 hr), change from baseline.
Twenty‐four hour urinary potassium output was reported in only two trials with 158 participants randomised (Beckman 1995; ENCORE). Dietary advice markedly increased potassium output in one trial (ENCORE) and had no effect in the other (Beckman 1995) (difference in means 10.81 mmol/24hr, 95% CI ‐3.92 to 25.54) (Analysis 1.4).
1.4. Analysis.

Comparison 1 Any dietary intervention versus no intervention, Outcome 4 Urinary potassium output (mmol/24hr), change from baseline.
Blood lipids
Total blood cholesterol was reported in 18 studies (22 trial arms, 3044 participants or clusters randomised). All trials involved healthy eating advice designed to lower cholesterol, except two trials and one trial arm that focused on increasing fruit and vegetable intake (Djuric high F&V; John 2002; Maskarinec 1999). Fibre intake was emphasised in three trial arms (Anderson high fibre; Baron men 1990; Baron women 1990). Initial mean total cholesterol in the control group of the trials was in the range 4.4 to 7.4 mmol/L (Table 2).
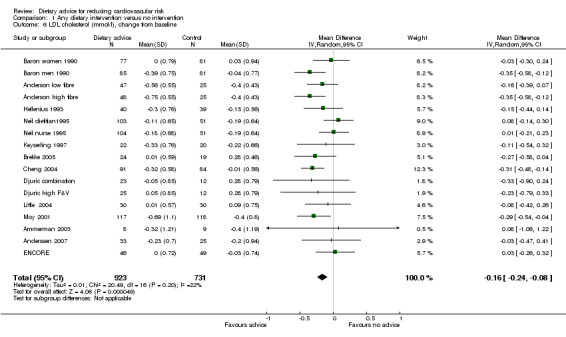
There was a small but significant reduction in total cholesterol with advice of 0.15 mmol/L (difference in means ‐0.15, 95% CI ‐0.23 to ‐0.06) (Analysis 1.5). There was a similar reduction in low density lipoprotein (LDL) cholesterol in 13 studies (17 trial arms, 1654 participants or clusters randomised) of 0.16 mmol/L (difference in means ‐0.16, 95% CI ‐0.24 to ‐0.08) (Analysis 1.6). There was no effect of advice on HDL cholesterol in 12 studies (16 trial arms, 1700 participants randomised) (Analysis 1.7). Triglyceride levels were reported in seven studies (8 trial arms, 648 participants randomised) where dietary advice had no effect (Analysis 1.8).
1.5. Analysis.
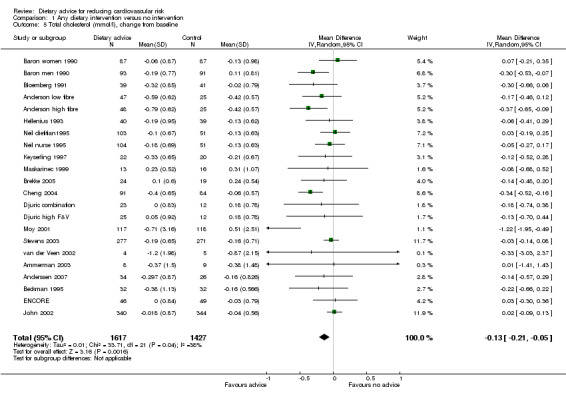
Comparison 1 Any dietary intervention versus no intervention, Outcome 5 Total cholesterol (mmol/l), change from baseline.
1.6. Analysis.
Comparison 1 Any dietary intervention versus no intervention, Outcome 6 LDL cholesterol (mmol/l), change from baseline.
1.7. Analysis.

Comparison 1 Any dietary intervention versus no intervention, Outcome 7 HDL cholesterol (mmol/l), change from baseline.
1.8. Analysis.

Comparison 1 Any dietary intervention versus no intervention, Outcome 8 Triglycerides (mmol/l), change from baseline.
Other biomarkers
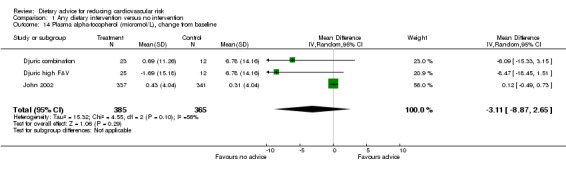
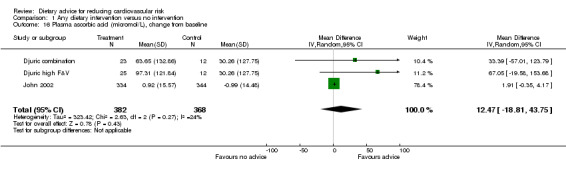
Plasma α‐carotene and β‐carotene were reported in three trials (4 trial arms, 779 and 765 participants randomised respectively) all of which focused on increasing fruit and vegetable intake (Djuric combination; Djuric high F&V; John 2002; Rock 2001). There was heterogeneity in the trial effects ( I2 = 68% to 100%) and changes with the dietary intervention were in the expected direction but did not reach statistical significance (Analysis 1.9; Analysis 1.10). These trials also reported plasma lycopene, lutein and β‐cryptoxanthin. There were small increases in both lutein (difference in means 0.02 μmol/L, 95% CI 0.01 to 0.04) (Analysis 1.12) and β‐cryptoxanthin (difference in means 0.07 μmol/L, 95% CI 0.02 to 0.11) (Analysis 1.13) with the dietary intervention which were statistically significant. There was no effect of dietary advice on plasma lycopene (Analysis 1.11).
1.9. Analysis.
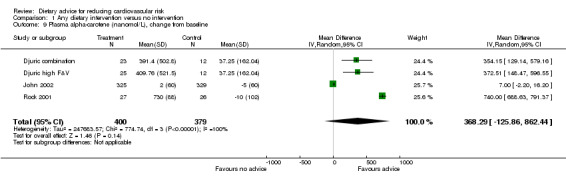
Comparison 1 Any dietary intervention versus no intervention, Outcome 9 Plasma alpha‐carotene (nanomol/L), change from baseline.
1.10. Analysis.
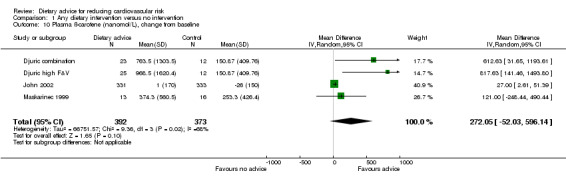
Comparison 1 Any dietary intervention versus no intervention, Outcome 10 Plasma ß‐carotene (nanomol/L), change from baseline.
1.12. Analysis.

Comparison 1 Any dietary intervention versus no intervention, Outcome 12 Plasma lutein (micromol/L), change from baseline.
1.13. Analysis.

Comparison 1 Any dietary intervention versus no intervention, Outcome 13 Plasma beta‐cryptoxanthin (micromol/L), change from baseline.
1.11. Analysis.
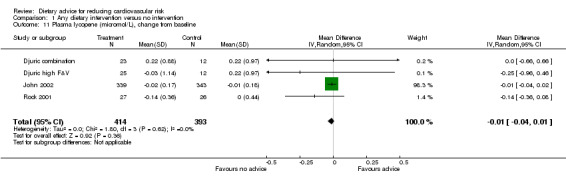
Comparison 1 Any dietary intervention versus no intervention, Outcome 11 Plasma lycopene (micromol/L), change from baseline.
Plasma α‐tocopherol, γ‐tocopherol and plasma ascorbic acid were reported in two trials (3 trial arms, 750 participants randomised). There was no effect of dietary advice on α‐tocopherol or γ‐tocopherol (Analysis 1.14; Analysis 1.15). There was an increase in plasma ascorbic acid with dietary advice but this did not reach statistical significance (Analysis 1.16).
1.14. Analysis.
Comparison 1 Any dietary intervention versus no intervention, Outcome 14 Plasma alpha‐tocopherol (micromol/L), change from baseline.
1.15. Analysis.

Comparison 1 Any dietary intervention versus no intervention, Outcome 15 Plasma gamma‐tocopherol (micromol/L), change from baseline.
1.16. Analysis.
Comparison 1 Any dietary intervention versus no intervention, Outcome 16 Plasma ascorbic acid (micromol/L), change from baseline.
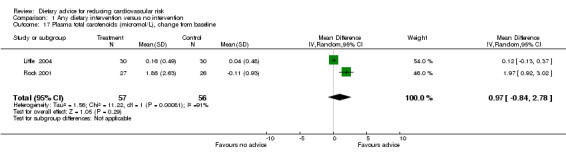
Total plasma carotenoids were measured in two trials (113 participants randomised) where the effect of dietary advice was in the expected direction but was not statistically significant. There was substantial heterogeneity for this outcome ( I2 = 91%) (Analysis 1.17).
1.17. Analysis.
Comparison 1 Any dietary intervention versus no intervention, Outcome 17 Plasma total carotenoids (micromol/L), change from baseline.
One trial (Riddell 2000) which focused on increasing intake of folate rich foods measured red cell folate, plasma folate and plasma homocysteine levels. Red cell folate increased with the intervention (mean difference 74 nmol/L, 95% CI ‐44.16 to 192.16) but this did not reach statistical significance. For serum folate, the authors found a statistically significant increase with the intervention (ratio of geometric means of the intervention relative to the control group at week 12 adjusted for baseline differences 1.52, 95% CI 1.28 to 1.8). Homocysteine levels were reduced with the intervention but this did not reach statistical significance (ratio of geometric means of the intervention relative to the control group at week 12 adjusted for baseline differences 0.91, 95% CI 0.8 to 1.03).
Dietary fat and dietary saturated fatty acids
Total dietary fat intake was reported in 21 studies (23 trial arms, 6364 participants or clusters randomised). All data were presented as changes from baseline with the exception of one trial (Elder promotora, Elder tailored) where only final follow‐up data were available. Dietary advice reflected consensus healthy eating guidelines in 10 trial arms (Anderssen 2007; Anderson low fibre; Beresford 1997; Bloemberg 1991; Bowen 2009; Brekke 2005; Cox 1996; ENCORE; Hellenius 1993; Little 2004; Stevens 2003; Tilley 1999; van der Veen 2002). Five trials aimed to reduce fat intake to 20% or less of calories (Coates WHT MP 1999; Gann 2003; Henderson WHTV 1990; Moy 2001; Schatzkin 2000). One trial focused on increasing fruit and vegetable intake (Schatzkin 2000) and one on reducing salt and increasing fruit and vegetable intake (Takahashi 2006).
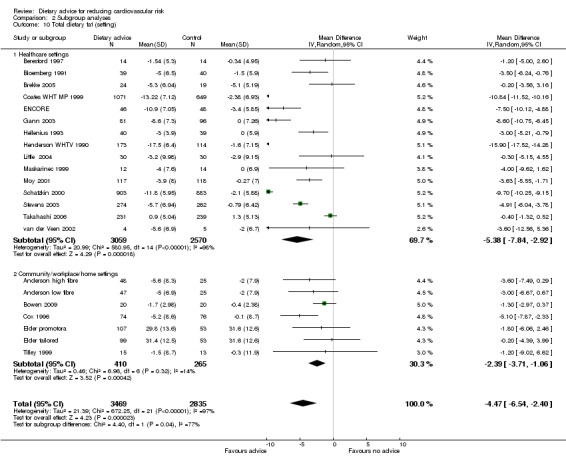
Total dietary fat intake expressed as a percentage of total calories fell by 4.48% with intervention overall (difference in means ‐4.48%, 95% CI ‐6.48 to ‐2.47) (Analysis 1.18). There was substantial heterogeneity ( I2 = 97%) in the trial effects, with the largest effects seen in four of the five trials that aimed to reduce fat intake to 20% or less of calories. The Women's Health Trial Minority Populations study, based in Georgia, Alabama and Florida (Coates WHT MP 1999), obtained a large reduction in total fat intake (10.8%) whereas another trial among US low income women (Cox 1996) was less effective (5.1% reduction). Advice to follow the DASH diet (high in low fat diary products and fruits and vegetables, rich in fibre and lower in fats) obtained a large reduction in total fat intake of 10.9% (ENCORE). A trial among predominantly male US car workers (Tilley 1999) obtained a non‐significant reduction in fat intake (1.2%).
1.18. Analysis.

Comparison 1 Any dietary intervention versus no intervention, Outcome 18 Total dietary fat (% Kcal).
Saturated fatty acid intake was reported in a subset of 11 of these trials (13 trial arms, 3251 participants randomised). Saturated fatty acid intake was reduced by 2.39% with dietary advice (difference in means ‐2.39%, 95% CI ‐3.37 to ‐1.4) (Analysis 1.19). There was heterogeneity ( I2 = 91%) in the trial effects, with a large effect seen in a trial that recruited women with increased risk of breast cancer (Henderson WHTV 1990).
1.19. Analysis.
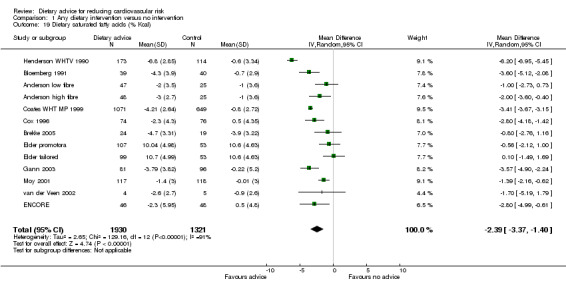
Comparison 1 Any dietary intervention versus no intervention, Outcome 19 Dietary saturated fatty acids (% Kcal).
Fruit and vegetables
Sixteen studies (19 trial arms, 8456 participants or clusters randomised) reported the combined outcome of servings of fruit and vegetables per day. All trials aimed to increase the number of fruit and vegetable servings eaten. Six trials also aimed to reduce fat intake (Bowen 2009; Kristal 2000; Sacerdote 2006; Schatzkin 2000; Stevens 2003; Tilley 1999). For one study (Schatzkin 2000), servings of fruit and vegetables were expressed as intake per 1000 calories rather than servings per day. The data provided for this study were multiplied by the mean number of calories consumed per day as reported.
Fruit and vegetable intake in those given dietary intervention increased by a difference in means of 1.18 servings (95% CI 0.65 to 1.71) (Analysis 1.20). There was heterogeneity ( I2 = 97%) in the trial effects, with a large effect seen in a trial of men and women at increased risk of colorectal cancer (Smith‐Warner 2000) and in women at increased risk of cervical cancer (Rock 2001). Three US trials with low income and blue collar participants (Buller 1999; Havas 1998; Tilley 1999) obtained small increases in mean fruit and vegetable intake (range 0.24 to 0.43 servings per day).
1.20. Analysis.
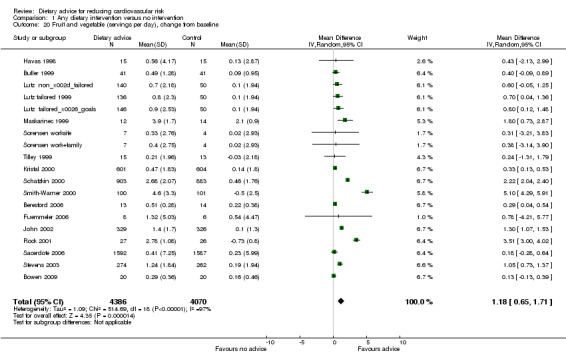
Comparison 1 Any dietary intervention versus no intervention, Outcome 20 Fruit and vegetable (servings per day), change from baseline.
Intakes of fruit and vegetables were reported separately in eight trials (9 trial arms, 4439 participants or clusters randomised) for fruit and in seven trials (8 trial arms, 4412 participants or clusters randomised) for vegetables. There was an increase in both fruit intake alone (difference in means 0.67, 95% CI 0.07 to 1.28) (Analysis 1.21) and vegetable intake alone (difference in means 0.92, 95% CI 0.34 to 1.49) (Analysis 1.22) with the intervention. There was significant heterogeneity (I2 = 97% to 98%) in both sets of trials. A further trial reported medians and the interquartile range for each of these outcomes so that data were not combined. The data from this trial were consistent with the others showing an increase in both fruit and vegetable intake with the intervention (ENCORE).
1.21. Analysis.
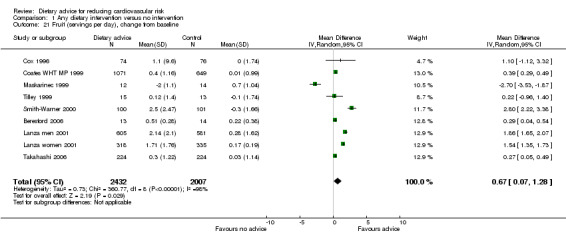
Comparison 1 Any dietary intervention versus no intervention, Outcome 21 Fruit (servings per day), change from baseline.
1.22. Analysis.
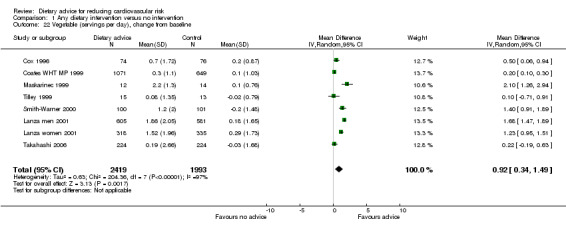
Comparison 1 Any dietary intervention versus no intervention, Outcome 22 Vegetable (servings per day), change from baseline.
Dietary fibre
Dietary fibre intake was reported in eight studies (11 trial arms, 3105 participants randomised). Participants in these trials were given dietary advice that included fat reduction as well as fibre advice, with the exception of one that focused on increasing fruit and vegetable intake (Maskarinec 1999) and another that focused on increasing folate rich foods (Riddell 2000). For one study (Schatzkin 2000), fibre intake was expressed per 1000 calories rather than servings per day. The data provided for this study were multiplied by the mean number of calories consumed per day as reported. A further study reported results in a similar way but data on total calorie intake were not provided and so the data were not combined (Bowen 2009). The results from this trial showed a statistically significant increase in fibre intake with the intervention.
People given the dietary intervention increased dietary fibre intake by 6.5 grams per day (difference in means) compared to those on control treatment (95% CI 2.2 to 10.82) (Analysis 1.23). There was heterogeneity ( I2 = 98%) in the trial effects, with a large effect seen in a four year trial of individuals at increased risk of colorectal cancer (Schatzkin 2000).
1.23. Analysis.
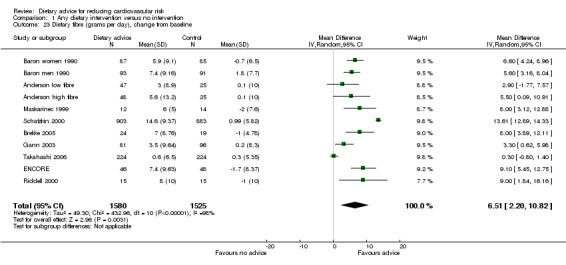
Comparison 1 Any dietary intervention versus no intervention, Outcome 23 Dietary fibre (grams per day), change from baseline.
Dietary intake of micronutrients
Three trials (5 trial arms, 2335 participants randomised) reported dietary intake of vitamin C (ascorbic acid). Dietary intake of vitamin C increased by 53.39 mg/day (difference in means) with dietary advice (95% CI 31.97 to 74.80) but there was significant heterogeneity in trial effects (I2 = 89%) (Analysis 1.24).
1.24. Analysis.
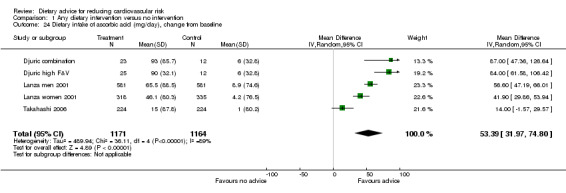
Comparison 1 Any dietary intervention versus no intervention, Outcome 24 Dietary intake of ascorbic acid (mg/day), change from baseline.
Dietary intake of β‐carotene was reported in two trials (3 trial arms, 542 participants randomised). There was an increase of 3.39 mg/day (difference in means) (95% CI 1.20 to 5.59) but again there was heterogeneity in the trial effects ( I2 = 93%) (Analysis 1.25).
1.25. Analysis.
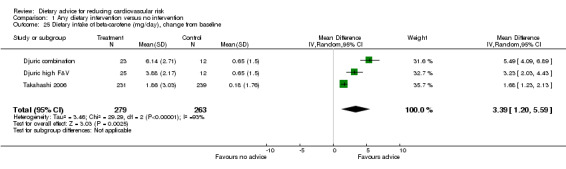
Comparison 1 Any dietary intervention versus no intervention, Outcome 25 Dietary intake of beta‐carotene (mg/day), change from baseline.
Two trials (Lanza men 2001; Lanza women 2001; Riddell 2000) reported dietary intake of folate, one of these trials focused specifically on increasing the intake of folate rich foods (Riddell 2000). There was a statistically significant increase in dietary folate with the interventions (difference in means 173.3, 95% CI 101.1 to 245.7) (Analysis 1.26) but there was significant heterogeneity in the trial effects (I2 = 96%), where the trial that focused on increasing folate intake showed much larger effects ( Riddell 2000). One of these trials also reported vitamin E intake (Lanza men 2001; Lanza women 2001) but found no change in vitamin E intake with the intervention. No intervention effect was seen on dietary intake of α and δ‐tocopherol in another trial (Djuric combination; Djuric high F&V).
1.26. Analysis.

Comparison 1 Any dietary intervention versus no intervention, Outcome 26 Dietary intake of folate (μg/day), change from baseline.
Clinical events
Long‐term follow‐up of two trials in the original review (TOHP I; TOHP II) reporting clinical events were available for the latest update. The authors kindly provided hazard ratio (HR) for each trial adjusted for clinic, age, sex, race and differences in follow‐up. Data from TOHP II were presented for sodium only versus the usual care arm thereby omitting the effects of weight loss. Results from these two trials were presented in Table 3. There was a reduction in the combined CVD endpoint (myocardial infarction, stroke, revascularisation or CVD death) with the intervention for both trials, although this did not reach statistical significance (TOHP I HR 0.59, 95% CI 0.33 to 1.08), TOHP II HR 0.81 (95% CI 0.59, 1.12). Estimates were also provided for non‐fatal events and CVD mortality separately. There was a reduced risk of non‐fatal myocardial infarction with the intervention in TOHP I but not TOHP II (TOHP I HR 0.3, 95% CI 0.1 to 0.95). It was important to note that these data were collected many years after the end of each intervention period for TOHP I and II, and it was unclear how participants may have changed their dietary patterns during this period.
3. Clinical events reported from long‐term follow‐up of participants recruited to TOHP I and TOHP II.
| TOHP I | Hazard Ratio | 95% Confidence Interval | P value |
| CVD combined endpoint | 0.59 | 0.33, 1.08 | 0.086 |
| Non‐fatal MI | 0.3 | 0.1, 0.95 | 0.041 |
| Non‐fatal stroke | 2.1 | 0.49, 8.96 | 0.32 |
| Revascularisation | 0.67 | 0.28, 1.61 | 0.37 |
| CVD mortality | 0.17 | 0.02, 1.41 | 0.1 |
| TOHP II | Hazard Ratio | 95% Confidence Interval | P value |
| CVD combined endpoint | 0.81 | 0.59, 1.12 | 0.2 |
| Non‐fatal MI | 0.9 | 0.55, 1.46 | 0.66 |
| Non‐fatal stroke | 0.5 | 0.18, 1.36 | 0.18 |
| Revascularisation | 0.68 | 0.41, 1.14 | 0.14 |
| CVD mortality | 0.9 | 0.36, 2.28 | 0.83 |
Subgroup analyses (Comparison 02)
Eight or more trials provided results for total blood cholesterol, blood pressure, total dietary fat and fruit and vegetable intake. We presented subgroup analyses of these outcomes, for gender, disease risk group, intervention setting, intervention intensity and trial duration. These subgroup findings should be treated with caution as self‐reported outcomes are subject to reporting bias and subgroup analyses in aggregated data without formal statistical interaction tests may generate spurious false positive and false negative findings.
Gender
Analysis 2.1; Analysis 2.2; Analysis 2.3
2.1. Analysis.
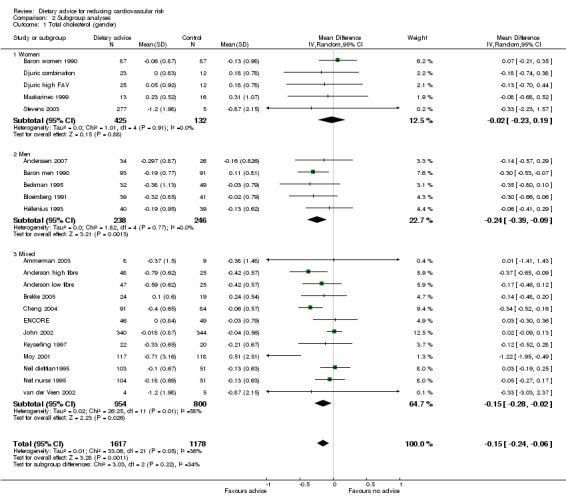
Comparison 2 Subgroup analyses, Outcome 1 Total cholesterol (gender).
2.2. Analysis.
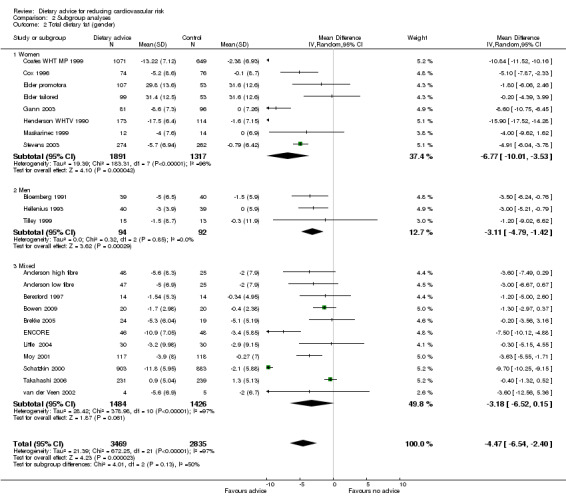
Comparison 2 Subgroup analyses, Outcome 2 Total dietary fat (gender).
2.3. Analysis.
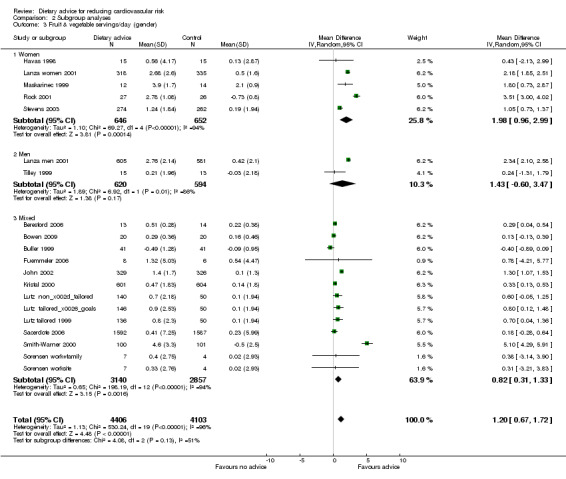
Comparison 2 Subgroup analyses, Outcome 3 Fruit & vegetable servings/day (gender).
In general, women were more likely than men to report reduced dietary fat intake and increased fruit and vegetable intakes. Men, unlike women, achieved modest but significant cholesterol‐lowering effects. There were large intervention effects on fat intake in the two Women's Health Trial pilot studies (Coates WHT MP 1999; Henderson WHTV 1990).
Disease risk group
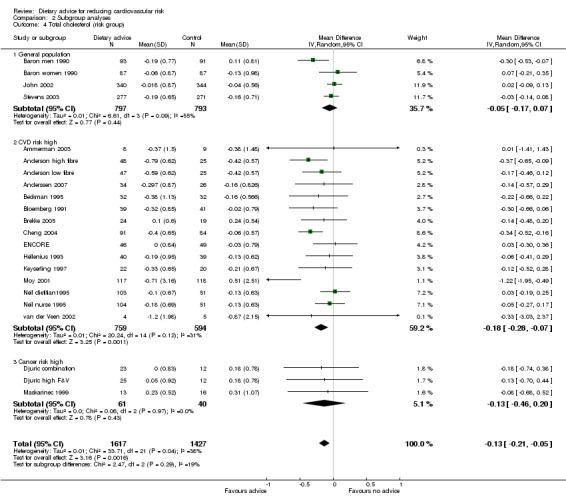
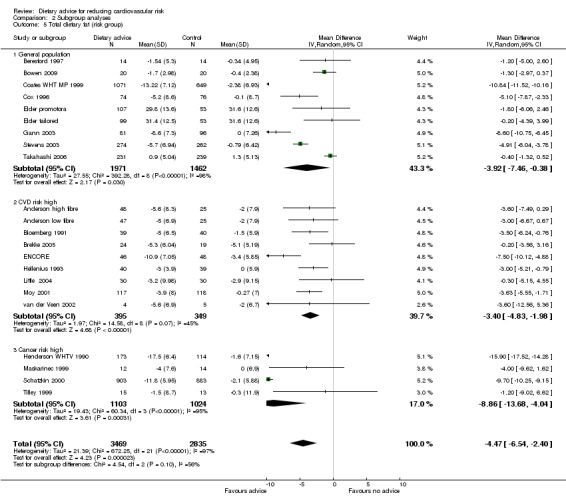
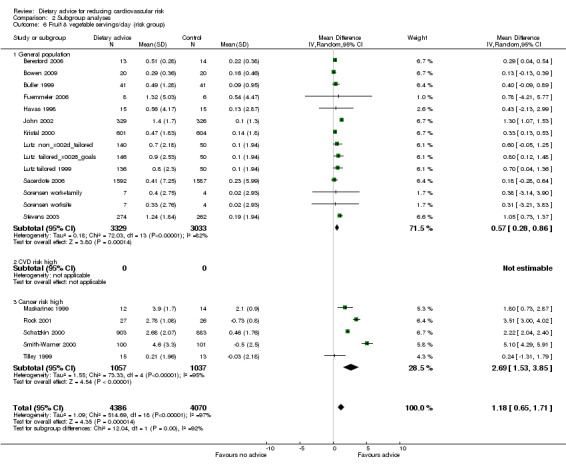
Analysis 2.4; Analysis 2.5; Analysis 2.6; Analysis 2.7; Analysis 2.8 Participants at higher risk of CVD did not report greater reductions in dietary fat intake but there was a tendency for greater reductions in total cholesterol. Reductions in total dietary fat intake were reported more frequently in those at high risk of cancer and there was a statistically significantly greater reported intake of fruit and vegetables in this group (2.69 servings/day, 95% CI 1.53 to 3.85) compared to the general population (0.57 servings/day, 95% CI 0.28 to 0.86). One trial with participants at increased risk of colorectal cancer obtained a mean net increase in consumption of 5.1 servings per day (Smith‐Warner 2000). There were no statistically significant differences in systolic or diastolic blood pressure between the general population and those at high risk of CVD, although there was a tendency for greater reductions in diastolic blood pressure in those at high risk of CVD.
2.4. Analysis.
Comparison 2 Subgroup analyses, Outcome 4 Total cholesterol (risk group).
2.5. Analysis.
Comparison 2 Subgroup analyses, Outcome 5 Total dietary fat (risk group).
2.6. Analysis.
Comparison 2 Subgroup analyses, Outcome 6 Fruit & vegetable servings/day (risk group).
2.7. Analysis.
Comparison 2 Subgroup analyses, Outcome 7 SBP mmHg (risk group).
2.8. Analysis.

Comparison 2 Subgroup analyses, Outcome 8 DBP mmHg (risk group).
Intervention setting
Analysis 2.9; Analysis 2.10; Analysis 2.11 Trials conducted in healthcare settings tended to show greater reporting of reduced dietary fat and increased fruit and vegetable consumption than work place or community settings. However, this trend was not seen for reductions in blood cholesterol.
2.9. Analysis.
Comparison 2 Subgroup analyses, Outcome 9 Total cholesterol (setting).
2.10. Analysis.
Comparison 2 Subgroup analyses, Outcome 10 Total dietary fat (setting).
2.11. Analysis.

Comparison 2 Subgroup analyses, Outcome 11 Fruit & vegetable servings/day (setting).
Intervention intensity
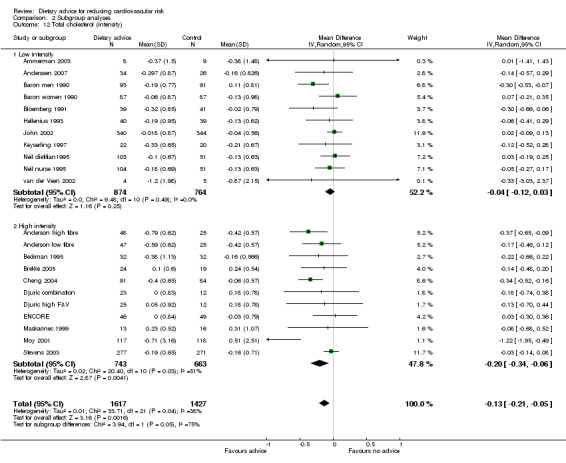
Analysis 2.12; Analysis 2.13; Analysis 2.14; Analysis 2.15; Analysis 2.16 Overall, high intensity interventions, involving more than three scheduled personal contacts with participants enrolled in the intervention arm(s) of a trial, tended to be associated with larger effects than low intensity interventions. The difference in effect size between subgroups was statistically significant for total dietary fat (high intensity, difference in means ‐5.47%, 95% CI ‐7.49 to ‐3.45; low intensity, difference in means ‐1.68%, 95% CI ‐3.13 to ‐0.23), and total cholesterol (high intensity, difference in means ‐0.2, 95% CI ‐0.34 to ‐0.06, low intensity, difference in means ‐0.04, 95% CI ‐0.12 to 0.03). However, there was heterogeneity in the effects within the high intensity subgroup for both of these outcomes. A similar pattern was seen for reported fruit and vegetable intake. However, no differences in blood cholesterol or blood pressure reductions were found.
2.12. Analysis.
Comparison 2 Subgroup analyses, Outcome 12 Total cholesterol (intensity).
2.13. Analysis.
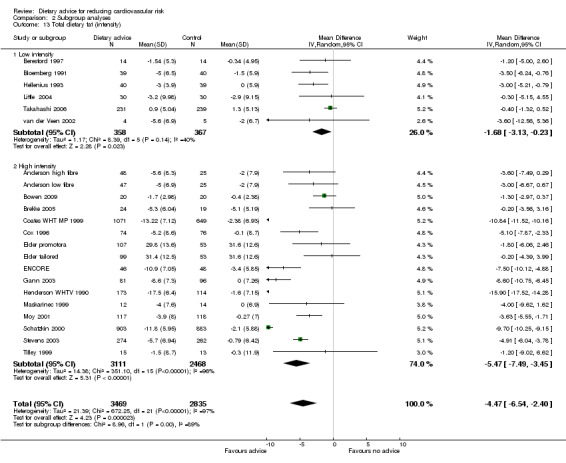
Comparison 2 Subgroup analyses, Outcome 13 Total dietary fat (intensity).
2.14. Analysis.
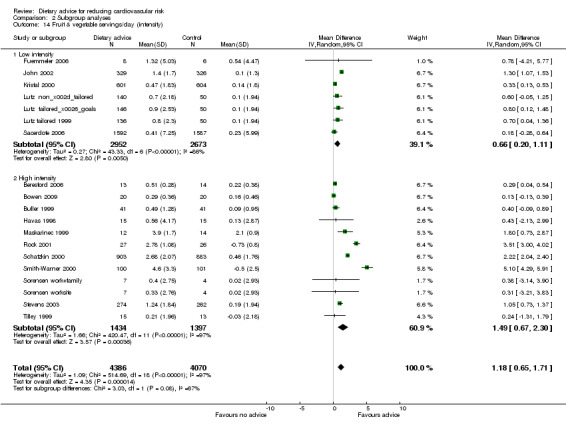
Comparison 2 Subgroup analyses, Outcome 14 Fruit & vegetable servings/day (intensity).
2.15. Analysis.
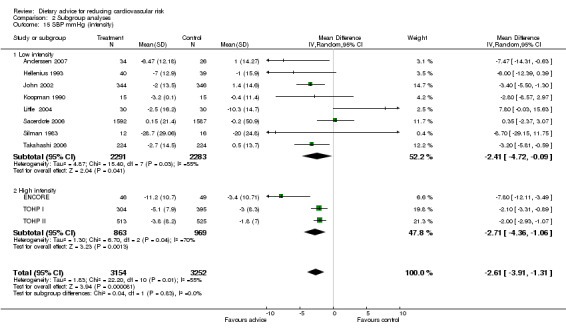
Comparison 2 Subgroup analyses, Outcome 15 SBP mmHg (intensity).
2.16. Analysis.
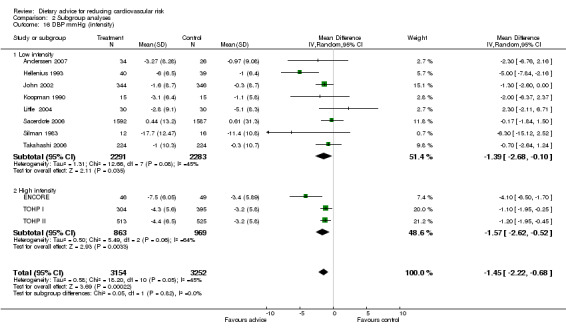
Comparison 2 Subgroup analyses, Outcome 16 DBP mmHg (intensity).
Trial duration
Analysis 2.17; Analysis 2.18; Analysis 2.19; Analysis 2.20; Analysis 2.21 The trial duration used in these analyses was the maximum trial follow‐up period where non‐participation at that follow‐up was less than 20% for the outcome of interest (see 'Loss to follow‐up' above). Overall, there was no evidence that longer duration trials, with follow up at 12 months or more, obtained smaller reported dietary changes or blood cholesterol and blood pressure changes.
2.17. Analysis.
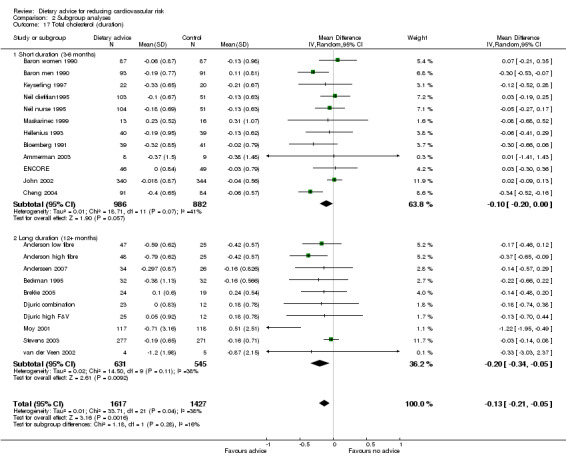
Comparison 2 Subgroup analyses, Outcome 17 Total cholesterol (duration).
2.18. Analysis.
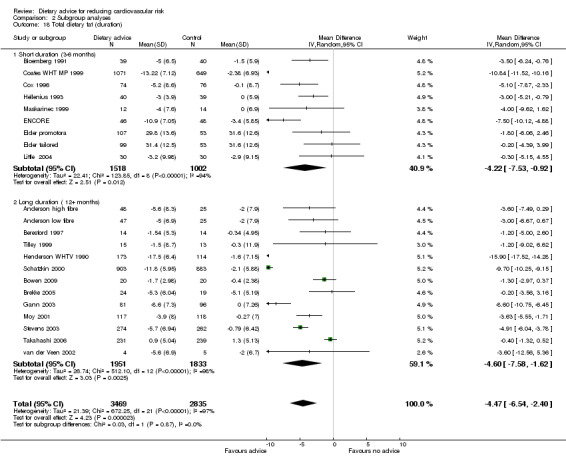
Comparison 2 Subgroup analyses, Outcome 18 Total dietary fat (duration).
2.19. Analysis.
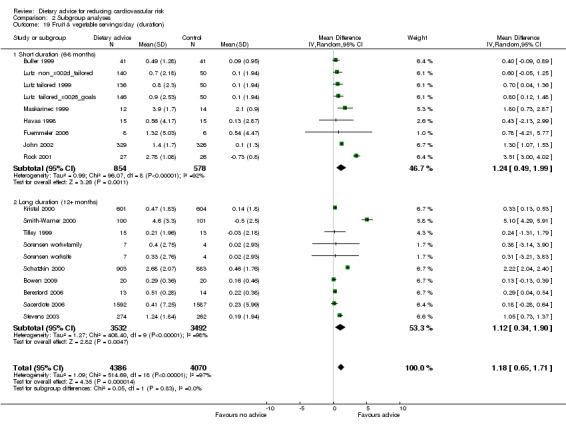
Comparison 2 Subgroup analyses, Outcome 19 Fruit & vegetable servings/day (duration).
2.20. Analysis.
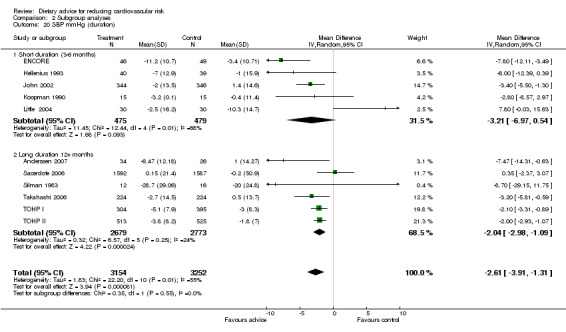
Comparison 2 Subgroup analyses, Outcome 20 SBP mmHg (duration).
2.21. Analysis.
Comparison 2 Subgroup analyses, Outcome 21 DBP mmHg (duration).
Discussion
The aim of this review is to evaluate the evidence for the sustained effectiveness of dietary advice in adults free of disease.
Summary of main results
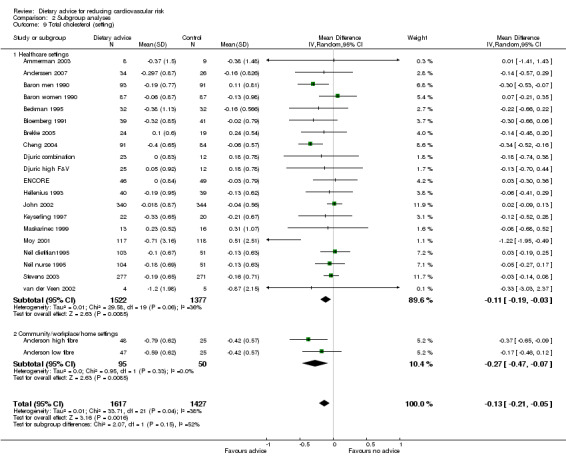
The review shows that dietary advice promotes modestly beneficial changes in reported dietary intake (lower salt and fat, higher fibre, and fruit and vegetables) and in some cardiovascular risk factors (blood pressure, total cholesterol, LDL cholesterol). The trial participants were healthy adults studied for at least three months and up to four years (median duration 12 months). There was some evidence that dietary advice was more effective when individuals were recruited on the basis of increased risk of CVD or cancer, but beneficial changes were obtained when individuals were not screened at recruitment.
Advice to reduce fat intake (total and saturated fatty acids) and to increase dietary fibre, fruit and vegetable consumption was associated with a reduction over three to 24 months of follow‐up for blood total cholesterol of 0.15 mmol/L and for LDL cholesterol 0.16 mmol/L. Advice to reduce salt intake or reduce fat and increase fruit and vegetable and fibre consumption over three to 36 months of follow‐up was associated with a reduction in blood pressure of 2.61 mm Hg systolic and 1.45 mm Hg diastolic. Advice to reduce salt intake was associated with a reduced 24‐hour urinary sodium excretion of 40.9 mmol, but there was significant heterogeneity between trials.
Reported fruit and vegetable intake increased by 1.18 servings per day with dietary intervention over six to 48 months of follow‐up. Dietary fibre intake increased with intervention over three to 48 months by 6.5 g per day. Reported total dietary fat intake expressed as a percentage of total calorie intake fell by 4.48% with the intervention over three to 48 months. The corresponding reduction in saturated fatty acid intake was 2.39%.
Overall completeness and applicability of evidence
More than 10,000 randomised individuals or clusters contributed data to most of the outcomes discussed in this review, including the 'objective' outcomes blood cholesterol, blood pressure and urinary sodium output. For total dietary fat and fruit and vegetable intake this number was approximately 14,800. There was a lack of evidence in relation to plasma triglycerides and folate. Since the search for the original review to the year 2000, three new trials measuring plasma antioxidants have been included, with over 700 participants randomised (Djuric combination; Djuric high F&V; John 2002; Rock 2001). Small changes were seen with the intervention for lutein and β‐cryptoxanthin but there was heterogeneity in the trial effects. With the advent of new trials, evidence for changes in plasma antioxidants with dietary advice will be more complete.
Dietary changes are effective in modifying risk when adherence is high, but there has been uncertainty about the effects of giving advice to healthy adults. Trials involving well‐motivated individuals being fed controlled diets in metabolic wards (Mensink 1992), institutions (Dayton 1969; Frantz 1989; Turpeinen 1979), or the community (Appel 1997) do not assess the real‐world effect of dietary advice. This review assembles the evidence that dietary advice is effective in less selected participants drawn from communities and work places.
A number of gaps in the evidence of the effects of dietary advice are apparent in the studies identified to date. In the original review (searching to year 2000) it was noted that there was a lack of high quality trials of cholesterol lowering by diet among unscreened healthy adults. Since this time, several trials have been published and included in the review, one based in the UK showing no effect of the intervention on cholesterol levels (John 2002), three based in the US showing effects in the desirable direction in one trial but not statistically significant (Stevens 2003), and no effect of the intervention in the remaining two (Ammerman 2003; ENCORE). A further trial from Norway showed a reduction in total cholesterol with dietary advice but this did not reach statistical significance (Anderssen 2007). In addition, we found no evidence from countries other than the USA of the effect of cholesterol lowering dietary interventions provided outside healthcare settings. This is surprising, given the importance of population cholesterol levels for cardiovascular disease prevention, but in part reflects the narrow inclusion criteria used in this review. Speculatively, it may be more efficient to provide dietary advice together with other forms of healthy eating promotion in the community or work place (Thorogood 2007). We did not identify trials meeting the inclusion criteria that used quality of life outcomes or economic evaluation.
Five US trials (11,427 participants) provided evidence of the effect of dietary advice, limited to dietary fat and fruit and vegetable intake, among low income women (Coates WHT MP 1999; Cox 1996; Havas 1998) and blue collar workers (Buller 1999; Tilley 1999). One trial showed a large reduction in fat intake at six months among minority ethnic group and low socioeconomic class women (Coates WHT MP 1999). The two trials involving American, predominantly male, blue collar workers were not effective in increasing fruit and vegetable intake at six months (Buller 1999) or two years (Tilley 1999).
Although there are 12 trials of advice to increase fruit and vegetable intake among unscreened healthy adults, only two were based outside the USA (John 2002; Sacerdote 2006).
Overall quality, strength and consistency of evidence
The majority of trials were conducted in the USA (29 trials). Most trials involved individual randomisation (33). There were 11 cluster randomised trials, eight were based in the USA, three in work places, three in healthcare settings and two in community centres, and one was based in a healthcare setting in the Netherlands (van der Veen 2002). To limit selection bias we restricted loss to follow‐up to 20% and as a consequence data from shorter follow‐up periods often had to be utilised for the longer duration trials. Descriptions of the trials, including methods used in randomisation, allocation concealment and blinding of outcome assessment, were in general poor in comparison with the CONSORT recommendations (Moher 2001). Only four of the individually randomised trials and one of the cluster randomised trials showed evidence of adequate allocation concealment.
The primary outcomes (blood pressure, lipids and other biomarkers) used in this review are broadly free of information bias. For urinary sodium output, short‐term salt restriction, or over‐compliance bias, before the follow‐up urine sample may have been large enough to contribute to the large observed intervention effect. The four trials with both blood pressure and urinary sodium measures showed some evidence of inconsistency in that large reductions in sodium output in two trials of salt restriction (TOHP I; TOHP II) were not associated with large reductions in blood pressure. A further trial of salt restriction (Koopman 1990) was small and of short (three months) duration. Conversely, large reductions in blood pressure and small changes in urinary sodium were found in the remaining trial where the intervention was not solely salt restriction (ENCORE).
The secondary outcome measures were based on self‐reported dietary intakes. Some of the intervention effects assessed by self‐report were substantial and may in part reflect information (reporting) bias, either on the part of participants or the trial personnel responsible for coding and analysing diet questionnaires. A particular weakness of the trial reports in this review is the absent or poor description of blinding of assessors to group allocation. Information bias may explain in part the discrepant findings for vitamin C, the only outcome measured both by self‐report and biomarker. Intake assessed by self‐report was found to increase substantially in response to the intervention, whereas the corresponding effect assessed by a plasma ascorbate assay was not significant. Self‐reported outcomes (and associated problems of recall bias) are more likely to show increases than biomarkers but, given the heterogeneity in all outcomes, it is difficult to make further comment.
Weight loss during the trials may potentially confound changes in dietary composition indexed by blood pressure and blood cholesterol. We excluded studies that had weight loss as a main aim; however weight loss as a consequence of the recommended dietary alteration could add to the apparent effect of dietary change by causing temporary reductions in blood pressure and cholesterol. Twenty‐four of the 33 individually randomised trial reports provided information on initial weight and weight loss and this was reassuring. Net mean weight loss in these intervention groups during the trials was in the range of 0 to 1.8 kg for 22 trials, but was more substantial in the remaining two at 2.7 kg (Beckman 1995) and 5.2 kg (Anderssen 2007).
Interventions varied considerably in terms of the nature of the dietary advice. Three main groups are evident, those giving broad healthy eating advice that followed consensus guidelines (COMA 1994; HSS 2005) on fat, fibre, fruit and vegetables (Ammerman 2003; Anderssen 2007; Anderson high fibre; Anderson low fibre; Baron men 1990; Baron women 1990; Beresford 1997; Bloemberg 1991; Bowen 2009; Brekke 2005; Cheng 2004; Cox 1996; Djuric combination; Djuric high F&V; Elder promotora; Elder tailored; ENCORE; Fuemmeler 2006; Gann 2003; Hellenius 1993; Henderson WHTV 1990; Keyserling 1997; Kristal 2000; Little 2004; Moy 2001; Neil dietitian1995; Neil nurse 1995; Sacerdote 2006; Schatzkin 2000; Stevens 2003; Takahashi 2006; Tilley 1999; van der Veen 2002); those focused on increasing fruit and vegetable consumption along the lines of '5‐a‐day' campaigns (Beresford 2006; Buller 1999; Havas 1998; John 2002; Lutz non‐tailored; Lutz tailored 1999; Lutz tailored&goals; Maskarinec 1999; Rock 2001; Smith‐Warner 2000; Sorensen work+family; Sorensen worksite); and those that emphasised salt restriction (Beckman 1995; Koopman 1990; Silman 1983; TOHP I; TOHP II). Another trial aimed to reduce fat consumption to 20% of energy or less among low income women (Coates WHT MP 1999) and another aimed to increase folate rich food consumption (Riddell 2000). The trials involving broad healthy eating advice were consistent in their modest effects on blood total cholesterol reduction. The two Women's Health Trials (Coates WHT MP 1999; Henderson WHTV 1990) achieved very large reductions in dietary fat intake, but blood cholesterol was not measured. Trial interventions that advised an increase in fruit and vegetable consumption obtained similar increases in intake, with the exception of two that obtained much larger reported effects among participants presumably motivated by awareness of their increased risk of colorectal cancer (Schatzkin 2000; Smith‐Warner 2000).
The intervention varied considerably among the included trials in terms of the mode of delivery of the dietary advice. Our subgroup analysis of the effect of intensity, based on the frequency of scheduled contacts, provide some evidence that higher intensity intervention is associated with larger dietary changes, particularly for dietary fat intake and total cholesterol. Lower intensity interventions are more likely to be adopted in routine health care. There was heterogeneity in the effects within the subgroup of high intensity trials largely due to those with participants at increased cancer risk (Henderson WHTV 1990; Schatzkin 2000; Smith‐Warner 2000). We expected to find that the effect of the intervention would decline with duration of the trial. There was no evidence that this was the case when comparing longer duration trials with follow‐up at 12 months or more with those of shorter duration.
Of the 44 trials with 52 intervention arms meeting the inclusion criteria, 22 (24 intervention arms, 8835 participants or clusters randomised) recruited participants without some form of screening to identify people at elevated risk of disease compared to the general population. By design, participants were predominantly free of diagnosed chronic disease and not taking lipid‐lowering or hypotensive medication, but there was evidence of a greater effect of advice in the trials with increased cancer risk participants. This may be a sign of greater motivation among these participants compared with those in healthy population trials, and it may be that some of the effects reported here would be smaller for dietary advice offered to a healthy population.
Potential biases in the review process
Two aspects of selection bias are relevant to this review. First, our decision was to restrict the review to trials of dietary intervention alone to avoid the potential confounding effects due to other behavioural interventions, such as exercise advice, on our primary outcomes. The effect of this restriction may also be to overestimate the effectiveness of dietary advice if in practice it is given simultaneously with other health‐promotion interventions. Second, we decided to limit dropout to 20% or less to avoid selection bias in effect estimation rather than to perform sensitivity analysis to examine the consequences of varying dropout rates. The effect of this restriction has been to exclude a number of well‐known trials with a relatively high dropout rate (for example Boyd 1990; HPTR 1990). In addition, we may be biasing our findings by limiting our evidence to trials with conscientious participants.
Agreements and disagreements with other studies or reviews
Two Cochrane reviews have examined interventions to reduce blood pressure in normotensive people. One studied the efficacy of reduced sodium intake rather than the effectiveness of advice to reduce sodium intake, and hence selected only trials that showed a reduction in sodium excretion of at least 40 mmol/24 hours (He 2004). The authors found a median reduction in normotensive people of 74 mmol/24 hours that was associated with a fall of 2.03 mm Hg (95% CI ‐2.56 to 1.50) in systolic and 0.99 mm Hg (95% CI ‐1.40 to 0.57) in diastolic pressure. Another Cochrane review included trials of interventions aimed at sodium reduction, of at least six months duration (Hooper 2004a). Three trials in normotensives were identified giving a mean reduction in sodium excretion of 35 mmol/24 hours (95% CI ‐47.2 to 23.9) and a mean reduction of systolic pressure of 1.1mm Hg (95% CI ‐1.8 to 0.4) and of diastolic pressure of 0.6 mm Hg (95% CI ‐1.5 to 0.3). The fall in sodium excretion is compatible with our findings of a fall in sodium excretion of 40.9 mmol/24 hours (95% CI 25.3 to 56.5). However, we have found a slightly larger effect on blood pressure with a fall in systolic pressure of 2.61 mm Hg (95% CI 1.31 to 3.91) and diastolic pressure of 1.45 mm Hg (95% CI 0.68 to 2.22). Hooper et al concluded that "resulting falls of 1.1 mm Hg systolic and 0.6 mmHg in diastolic blood pressure may be useful at a population level; however the intensity of intervention applied to individuals required to achieve this is not realistic for community control of high blood pressure". In our review, two large studies targeting salt reduction (TOHP I; TOHP II) and a smaller trial of healthy eating advice (ENCORE) involved intensive interventions whereas the remaining eight studies involved low intensity interventions. In subgroup analysis there was no evidence of an effect of intervention intensity on outcome although there was heterogeneity in the trial effects possibly reflecting the different intervention types. Given that the evidence of effectiveness of low intensity interventions is limited, and given the importance of processed food as a source of sodium, we agree with Hooper et al that "changes in food production and catering practices" are needed (Hooper 2004a).
A further Cochrane review (Hooper 2012) examined the effectiveness of interventions to reduce dietary fat but has focused on mortality and cardiovascular events and not changes in lipid levels, although these were included as tertiary outcomes. Within healthcare, a Cochrane review has assessed the effects of dietary advice given by a dietitian compared with other health professionals (Thompson 2003), concluding that dietitians were better than doctors at lowering blood cholesterol but not other diet‐related outcomes, in the short to medium term.
Authors' conclusions
Implications for practice.
We made estimates of the effects of reductions in serum cholesterol and blood pressure on the incidence of coronary heart disease and stroke. Based on a meta‐analysis of randomised controlled trials of statins in primary prevention with a mean duration of five years, a reduction of 1.0 mmol/L in serum LDL cholesterol will reduce the incidence of myocardial infarction or coronary death (major CHD) by approximately 23% and fatal or non‐fatal stroke by 17% (Baigent 2005). The corresponding effects of a blood pressure reduction of 10 mm Hg systolic and 5 mm Hg diastolic, in trials of mean duration 4.5 years, are a 21% reduction in major CHD and a 46% reduction in stroke (Law 2009). Applying these estimates to our summary effects, dietary intervention may reduce major CHD incidence by 11% (4% due to cholesterol lowering) and stroke by 19% (3% due to cholesterol lowering). The estimates assume that the observed changes in dietary habits are sustained for five years and that the reductions in risk attributable to the changes in cholesterol and blood pressure can be combined additively.
Our review suggests that people without the motivation stimulated by a clinical diagnosis of cardiovascular disease are likely to make modest changes in their intake of individual nutrients and related risk factors in response to dietary advice. When aggregated across the entire dietary pattern, however, several small changes in food habits may lead to greater health gains than the above estimates would suggest. In support of this view, the Lyon Diet Heart trial of a Mediterranean‐type diet obtained a reduction of more than 50%, compared to the control group, in the recurrence of fatal and non‐fatal CVD over four years of study (De Lorgeril 1999). Further, adopting a healthy dietary pattern early in life is likely to maximise the benefits of reduced exposure to adverse vascular risk factors. In the Bogalusa study (USA) of 10‐year olds, fat intake was correlated with blood cholesterol levels and sodium intake with systolic blood pressure (Frank 1978).
The public health significance of national dietary patterns is substantial. Here we have assembled the evidence on the effectiveness of dietary advice given to individuals and small groups in a variety of settings. The review shows that brief interventions are modestly effective in reducing blood lipid levels, blood pressure and dietary fat intake, and increasing fruit and vegetable intake. Variation in the nature and combination of the messages given across the included studies meant that it was not possible to identify 'best advice'. The extent of dietary change is influenced by the intensity and duration of intervention, and by perceived disease risk. There appears to be little if any gain in effectiveness by locating health promotion in primary care in contrast to work places and other non‐healthcare settings. Brief dietary interventions aimed at the whole population are likely to produce health gain; however, the workload and cost to the UK National Health Service and other healthcare systems requires careful assessment (Brunner 2006).
Implications for research.
Questions remain about the most effective way to promote dietary change among healthy adults. Systematic research is needed on the effectiveness of non‐individualised modes of dietary health promotion at the population and community level (Thorogood 2007). There is a shortage of evidence on the effectiveness of minimal interventions, and their specific components, to promote dietary change in UK healthcare and other settings. High quality trials with follow‐up for one year or more are notably sparse. Trials utilising quality of life outcomes or cost‐effectiveness evaluation are lacking. If health promotion is targeted in deprived areas (DOH 2004) with a high proportion of minority ethnic groups, it may be that dietary change will depend as much on wider determinants, particularly access and availability of healthy foods (Morris 2004), as it will on information and motivation.
What's new
| Date | Event | Description |
|---|---|---|
| 20 November 2013 | New citation required but conclusions have not changed | Nicola Wilson added to the citation |
| 20 November 2013 | Amended | Author Nicola Wilson has been added to the citation of this review as she contributed significantly to it's authorship |
History
Protocol first published: Issue 2, 2000 Review first published: Issue 4, 2005
| Date | Event | Description |
|---|---|---|
| 1 February 2013 | New citation required but conclusions have not changed | More up to date search found 5 new trials for inclusion, plus 1 long term follow up, and 1 previously identified ongoing trial. |
| 22 February 2012 | New search has been performed | The searching has been updated from November 2006 to October 2010. From 23,300 further hits, 7 additional studies met the inclusion criteria (5 new trials, one report of long term follow‐up or TOHP I&II, and one previously identified ongoing trial). The review now contains 44 trials (18,175 participants or clusters randomised). The conclusions remain essentially unchanged and strengthen those from previous updates. |
| 8 September 2008 | Amended | Converted to new review format. |
| 30 July 2007 | New citation required and conclusions have changed | Substantive amendment |
Acknowledgements
We are grateful to Gillian Hewitt who contributed to the original iteration of this review (first published in Issue 4, 2005), by carrying out literature searches, library research and appraisal of abstracts, and to Margaret Burke for conducting the searches for the 2007 update and Nicole Martin who conducted the searches for the 2010 update. With thanks to Drs Sorensen and Stoddard from the Treatwell 5‐a‐day study for providing additional data. With thanks to Drs Coates, Feng, Kuniyuki and Bowen for providing additional data from their study, the Women's Health Trial Feasibility Study in Minority Populations. With thanks to Dr Maskarinec for clarifying the nature of the intervention setting in her study, and Dr Ross Prentice for clarifying the nature of the intervention settings in the Women's Health Trial Vanguard Study and Feasibility Study in Minority Populations. With thanks to Dr Beresford for providing additional data for the Seattle 5‐a‐day worksite programme, and to Dr Djuric for providing additional data from the Nutrition and Breast Health Study. With thanks to Dr Bowen for providing additional data for the Eating for a Healthy Life study, and Dr Blumental for providing additional data for the ENCORE study. We are also grateful to Dr Cook for providing adjusted hazard ratios for clinical events for the long term follow‐up of TOHP I and II, and Dr Anderssen for providing additional data on the Oslo Diet and Exercise study. We are grateful for the contributions of Annie Beaumont, Sam Pearson and Jean Persaud to the review process.
Appendices
Appendix 1. Search strategies 2006
The Cochrane Library
#1 MeSH descriptor Diet, Atherogenic explode all trees #2 MeSH descriptor Diet, Fat‐Restricted this term only #3 MeSH descriptor Diet, Sodium‐Restricted this term only #4 MeSH descriptor Dietary Fats explode all trees #5 MeSH descriptor Dietary Fiber this term only #6 MeSH descriptor Potassium, Dietary this term only #7 MeSH descriptor Sodium, Dietary explode all trees #8 MeSH descriptor Ascorbic Acid explode all trees #9 MeSH descriptor beta Carotene this term only #10 MeSH descriptor FOLIC ACID explode all trees #11 MeSH descriptor VITAMIN E explode all trees #12 MeSH descriptor FISH OILS explode all trees #13 MeSH descriptor PLANT OILS explode all trees #14 MeSH descriptor DAIRY PRODUCTS explode all trees #15 MeSH descriptor FRUIT explode all trees #16 MeSH descriptor MEAT explode all trees #17 MeSH descriptor VEGETABLES explode all trees #18 MeSH descriptor Fats, Unsaturated explode all trees #19 MeSH descriptor Fatty Acids, Unsaturated explode all trees #20 (#1 or #2 or #3 or #4 or #5 or #6 or #7 or #8 or #9 or #10) #21 (#11 or #12 or #13 or #14 or #15 or #16 or #17 or #18 or #19) #22 diet* #23 food* #24 (lipid near/6 modifi* ) #25 (lipid* near/6 low* ) #26 (lipid* near/6 reduc* ) #27 (fat* near/6 low* ) #28 (fat* near/6 modifi* ) #29 (fat* near/6 animal ) #30 (fat* near/6 acid* ) #31 (fat* near/6 saturat* ) #32 (fat* near/6 unsaturat* ) #33 (oil* near/6 olive ) #34 (oil* near/6 rape* ) #35 (oil* near/6 sunflower* ) #36 (oil* near/6 linseed* ) #37 (oil* near/6 saturat* ) #38 (oil* near/6 unsaturat* ) #39 polyunsaturate* #40 monounsaturate* #41 omega* #42 (fat or fats or oil* ) #43 omega3* #44 omega‐3* #45 (omega* near/6 fat* ) #46 (diet* or food* ) #47 margarine* #48 butter #49 meat #50 fish #51 vegetable* #52 fruit* #53 legum* #54 soy* #55 (#22 or #23 or #24 or #25 or #26 or #27 or #28 or #29 or #30) #56 (#31 or #32 or #33 or #34 or #35 or #36 or #37 or #38 or #39 or #40) #57 (#41 or #42 or #43 or #44 or #45 or #46 or #47 or #48 or #49 or #50) #58 (#51 or #52 or #53 or #54) #59 (#55 or #56 or #57 or #58) #60 (#20 or #21 or #59) #61 MeSH descriptor HEALTH EDUCATION explode all trees #62 MeSH descriptor COUNSELING explode all trees #63 MeSH descriptor COMMUNICATION explode all trees #64 MeSH descriptor PRACTICE GUIDELINES this term only #65 MeSH descriptor BEHAVIOR THERAPY explode all trees #66 (#61 or #62 or #63 or #64 or #65) #67 (#60 and #66) #68 counsel* #69 advice #70 leaflet* #71 video* #72 (poster or posters ) #73 (educate* or educational ) #74 MeSH descriptor Life Style explode all trees #75 MeSH descriptor Risk Reduction Behavior this term only #76 (lifestyle near/6 change* ) #77 (lifestyle near/6 program* ) #78 (diet* near/6 change* ) #79 (#61 or #62 or #63 or #64 or #65 or #66 or #67 or #68 or #69 or #70) #80 (#71 or #72 or #73 or #74 or #75 or #76 or #77) #81 (#80 and #60) #82 (health next behavi* near/6 intervention* ) #83 guideline* #84 brief next intervention* #85 diet* next therap* in Abstract #86 MeSH descriptor diet therapy this term only #87 (diet near/6 plan ) #88 diet* next therap* in Record Title #89 diet* next intervention* #90 diet* next treatment* #91 MeSH descriptor food habits this term only #92 (behavi* near/3 change* ) #93 motivat* #94 MeSH descriptor motivation this term only #95 (#82 or #83 or #84 or #85 or #86 or #87 or #88 or #89 or #90 or #91 or #92 or #93 or #94) #96 (#95 and #60) #97 (#96 or #81)
MEDLINE (Ovid)
1 exp Communication/ 2 exp Counseling/ 3 exp Health Education/ 4 Life Style/ 5 Practice Guidelines/ 6 (diet$ adj1 (therap$ or educat$ or counsel$ or intervention$ or treatment$)).tw. 7 (nutriti$ adj1 (therap$ or educat$ or counsel$ or intervention$)).tw. 8 (health adj1 (therap$ or counsel$ or educat$)).tw. 9 (intake$ adj3 (increas$ or decreas$ or reduc$ or rais$ or low$ or chang$ or restrict$ or high$)).tw. 10 (intake$ adj3 (increas$ or decreas$ or reduc$ or rais$ or low$ or chang$ or restrict$ or high$)).tw. 11 (consumption adj3 (increas$ or decreas$ or reduc$ or rais$ or low$ or chang$ or restrict$ or high$)).tw. 12 ((salt or sodium) adj3 (decreas$ or reduc$ or low$ or chang$ or restrict$)).tw. 13 ((fish or fruit$ or vegetable$) adj3 (increas$ or rais$ or chang$ or high$)).tw. 14 (diet$ adj3 chang$).tw. 15 (lifestyle$ adj3 chang$).tw. 16 guideline$.tw. 17 (group adj counsel$).tw. 18 (brief adj intervention$).tw. 19 (health adj behav$ adj intervention$).tw. 20 advice.tw. 21 leaflet$.tw. 22 video$.tw. 23 ((fat or fats or cholesterol) adj3 (decreas$ or reduc$ or low$ or chang$ or restrict$)).tw. 24 or/1‐23 25 diet/ 26 Diet, Atherogenic/ 27 Diet, Mediterranean/ 28 exp Energy Intake/ 29 exp Dietary Fats/ 30 Dietary Fiber/ 31 Potassium, Dietary/ 32 exp Sodium, Dietary/ 33 exp Ascorbic Acid/ 34 beta Carotene/ 35 exp Folic Acid/ 36 exp Vitamin E/ 37 exp Fish Oils/ 38 exp Plant Oils/ 39 exp Dairy Products/ 40 exp Fruit/ 41 exp Meat/ 42 exp Vegetables/ 43 exp Fatty Acids, Unsaturated/ 44 Food Habits/ 45 diet$.tw. 46 food$.tw. 47 (lipid$ adj3 (low$ or reduc$ or modifi$)).tw. 48 polyunsaturat$.tw. 49 (polyunsaturat$ or poly‐unsaturat$).tw. 50 (monunsaturat$ or mono‐unsaturat$).tw. 51 (omega$ adj3 fat$).tw. 52 (omega3 or omega‐3).tw. 53 marg?rine$.tw. 54 butter$.tw. 55 (meat or meats).tw. 56 fish.tw. 57 vegetable$.tw. 58 fruit$.tw. 59 legum$.tw. 60 soy$.tw. 61 bean$.tw. 62 oat$.tw. 63 grain$.tw. 64 starch$.tw. 65 exp Dietary Carbohydrates/ 66 carbohydrate$.tw. 67 roughage.tw. 68 ((non‐starch or nonstarch) adj (poly‐saccharhide$ or polysaccharide$)).tw. 69 (nut or nuts).tw. 70 lard$.tw. 71 salt.tw. 72 (antioxidant$ or anti‐oxidant$).tw. 73 folic.tw. 74 folate$.tw. 75 ascorb$.tw. 76 tocopherol$.tw. 77 alphatocopherol$.tw. 78 vitamin c.tw. 79 vitamin e.tw. 80 (betacarotene or beta‐carotene or crotenoid$).tw. 81 (betacarotene or beta‐carotene or carotenoid$).tw. 82 (sodium adj2 intake$).tw. 83 (potassium adj2 intake$).tw. 84 (fat$ adj3 (low$ or modifi$ or animal$ or vegetable$ or acid$ or saturat$ or unsaturat$)).tw. 85 (oil$ adj3 (vegetable$ or olive$ or rape$ or sunflow$ or linseed$ or saturat$ or unsaturat$)).tw. 86 or/25‐85 87 exp diet therapy/ 88 24 and 86 89 87 or 88 90 exp animals/ not human/ 91 89 not 90 92 exp child/ not exp adult/ 93 91 not 92
EMBASE (Ovid)
1 exp Interpersonal Communication/ 2 exp Counseling/ 3 exp Health Education/ 4 Life Style/ 5 Practice Guideline/ 6 (diet$ adj1 (therap$ or educat$ or counsel$ or intervention$ or treatment$)).tw. 7 (nutriti$ adj1 (therap$ or educat$ or counsel$ or intervention$)).tw. 8 (health adj1 (therap$ or counsel$ or educat$)).tw. 9 (intake$ adj3 (increas$ or decreas$ or reduc$ or rais$ or low$ or chang$ or restrict$ or high$)).tw. 10 (intake$ adj3 (increas$ or decreas$ or reduc$ or rais$ or low$ or chang$ or restrict$ or high$)).tw. 11 (consumption adj3 (increas$ or decreas$ or reduc$ or rais$ or low$ or chang$ or restrict$ or high$)).tw. 12 ((salt or sodium) adj3 (decreas$ or reduc$ or low$ or chang$ or restrict$)).tw. 13 ((fish or fruit$ or vegetable$) adj3 (increas$ or rais$ or chang$ or high$)).tw. 14 (diet$ adj3 chang$).tw. 15 (lifestyle$ adj3 chang$).tw. 16 guideline$.tw. 17 (group adj counsel$).tw. 18 (brief adj intervention$).tw. 19 (health adj behav$ adj intervention$).tw. 20 advice.tw. 21 leaflet$.tw. 22 video$.tw. 23 ((fat or fats or cholesterol) adj3 (decreas$ or reduc$ or low$ or chang$ or restrict$)).tw. 24 or/1‐23 25 diet/ 26 Diet, Atherogenic/ 27 Mediterranean Diet/ 28 low calory diet/ 29 exp lipid diet/ 30 exp Dietary Intake/ 31 exp Dietary Fats/ 32 Dietary Fiber/ 33 Potassium, Dietary/ 34 exp Sodium, Dietary/ 35 exp Ascorbic Acid/ 36 beta Carotene/ 37 exp Folic Acid/ 38 exp Vitamin E/ 39 exp Fish Oils/ 40 exp Plant Oils/ 41 exp Dairy Products/ 42 exp Fruit/ 43 exp Meat/ 44 exp Vegetables/ 45 exp Unsaturated Fatty Acid/ 46 exp alpha tocopherol/ 47 exp edible oil/ 48 exp vegetable oil/ 49 exp essential fatty acid/ 50 exp saturated fatty acid/ 51 Feeding behavior/ 52 diet$.tw. 53 food$.tw. 54 (lipid$ adj3 (low$ or reduc$ or modifi$)).tw. 55 polyunsaturat$.tw. 56 (polyunsaturat$ or poly‐unsaturat$).tw. 57 (monunsaturat$ or mono‐unsaturat$).tw. 58 (omega$ adj3 fat$).tw. 59 (omega3 or omega‐3).tw. 60 marg?rine$.tw. 61 butter$.tw. 62 (meat or meats).tw. 63 fish.tw. 64 vegetable$.tw. 65 fruit$.tw. 66 legum$.tw. 67 soy$.tw. 68 bean$.tw. 69 oat$.tw. 70 grain$.tw. 71 starch$.tw. 72 exp Dietary Carbohydrates/ 73 carbohydrate$.tw. 74 roughage.tw. 75 ((non‐starch or nonstarch) adj (poly‐saccharhide$ or polysaccharide$)).tw. 76 (nut or nuts).tw. 77 lard$.tw. 78 salt.tw. 79 (antioxidant$ or anti‐oxidant$).tw. 80 folic.tw. 81 folate$.tw. 82 ascorb$.tw. 83 tocopherol$.tw. 84 alphatocopherol$.tw. 85 vitamin c.tw. 86 vitamin e.tw. 87 (betacarotene or beta‐carotene or crotenoid$).tw. 88 (betacarotene or beta‐carotene or carotenoid$).tw. 89 (sodium adj2 intake$).tw. 90 (potassium adj2 intake$).tw. 91 (fat$ adj3 (low$ or modifi$ or animal$ or vegetable$ or acid$ or saturat$ or unsaturat$)).tw. 92 (oil$ adj3 (vegetable$ or olive$ or rape$ or sunflow$ or linseed$ or saturat$ or unsaturat$)).tw. 93 or/25‐92 94 exp diet therapy/ 95 24 and 93 96 94 or 95 97 exp child/ not Adult/ 98 96 not 97
Appendix 2. Search strategies 2010
CENTRAL, DARE and HTA
#1 MeSH descriptor Diet, Atherogenic this term only #2 MeSH descriptor Diet, Fat‐Restricted this term only #3 MeSH descriptor Diet, Sodium‐Restricted this term only #4 MeSH descriptor Dietary Fats explode all trees #5 MeSH descriptor Dietary Fiber this term only #6 MeSH descriptor Potassium, Dietary this term only #7 MeSH descriptor Sodium, Dietary explode all trees #8 MeSH descriptor Ascorbic Acid explode all trees #9 MeSH descriptor beta Carotene this term only #10 MeSH descriptor FOLIC ACID explode all trees #11 MeSH descriptor VITAMIN E explode all trees #12 MeSH descriptor FISH OILS explode all trees #13 MeSH descriptor PLANT OILS explode all trees #14 MeSH descriptor DAIRY PRODUCTS explode all trees #15 MeSH descriptor FRUIT explode all trees #16 MeSH descriptor MEAT explode all trees #17 MeSH descriptor VEGETABLES explode all trees #18 MeSH descriptor Fats, Unsaturated explode all trees #19 MeSH descriptor Fatty Acids, Unsaturated explode all trees #20 diet* in All Text #21 food* in All Text #22 (lipid in All Text near/6 modifi* in All Text) #23 (lipid* in All Text near/6 low* in All Text) #24 (lipid* in All Text near/6 reduc* in All Text) #25 (fat* in All Text near/6 low* in All Text) #26 (fat* in All Text near/6 modifi* in All Text) #27 (fat* in All Text near/6 animal in All Text) #28 (fat* in All Text near/6 acid* in All Text) #29 (fat* in All Text near/6 saturat* in All Text) #30 (fat* in All Text near/6 unsaturat* in All Text) #31 (oil* in All Text near/6 olive in All Text) #32 (oil* in All Text near/6 rape* in All Text) #33 (oil* in All Text near/6 sunflower* in All Text) #34 (oil* in All Text near/6 linseed* in All Text) #35 (oil* in All Text near/6 saturat* in All Text) #36 (oil* in All Text near/6 unsaturat* in All Text) #37 polyunsaturate* in All Text #38 monounsaturate* in All Text #39 omega* in All Text #40 (fat in All Text or fats in All Text or oil* in All Text) #41 omega3* in All Text #42 omega‐3* in All Text #43 (omega* in All Text near/6 fat* in All Text) #44 (diet* in All Text or food* in All Text) #45 margarine* in All Text #46 butter in All Text #47 meat in All Text #48 fish in All Text #49 vegetable* in All Text #50 fruit* in All Text #51 legum* in All Text #52 soy* in All Text #53 MeSH descriptor HEALTH EDUCATION explode all trees #54 MeSH descriptor COUNSELING explode all trees #55 MeSH descriptor COMMUNICATION explode all trees #56 MeSH descriptor PRACTICE GUIDELINES as topic this term only #57 MeSH descriptor BEHAVIOR THERAPY explode all trees #58 counsel* in All Text #59 advice in All Text #60 leaflet* in All Text #61 video* in All Text #62 (poster in All Text or posters in All Text) #63 (educate* in All Text or educational in All Text) #64 MeSH descriptor Life Style explode all trees #65 MeSH descriptor Risk Reduction Behavior this term only #66 (lifestyle in All Text near/6 change* in All Text) #67 (lifestyle in All Text near/6 program* in All Text) #68 (diet* in All Text near/6 change* in All Text) #69 (health next behavi* in All Text near/6 intervention* in All Text) #70 guideline* in All Text #71 brief next intervention* in All Text #72 diet* next therap* in All Text #73 MeSH descriptor diet therapy this term only #74 (diet in All Text near/6 plan in All Text) #75 diet* next intervention* in All Text #76 diet* next treatment* in All Text #77 MeSH descriptor food habits this term only #78 (behavi* in All Text near/3 change* in All Text) #79 motivat* in All Text #80 MeSH descriptor motivation this term only #81 (#1 or #2 or #3 or #4 or #5 or #6 or #7 or #8 or #9 or #10) #82 (#11 or #12 or #13 or #14 or #15 or #16 or #17 or #18 or #19) #83 (#20 or #21 or #22 or #23 or #24 or #25 or #26 or #27 or #28 or #29) #84 (#30 or #31 or #32 or #33 or #34 or #35 or #36 or #37 or #38 or #39) #85 (#40 or #41 or #42 or #43 or #44 or #45 or #46 or #47 or #48 or #49 or #50 or #51 or #52) #86 (#81 or #82 or #83 or #84 or #85) #87 (#53 or #54 or #55 or #56 or #57 or #58 or #59) #88 (#60 or #61 or #62 or #63 or #64 or #65 or #66 or #67 or #68 or #69) #89 (#70 or #71 or #72 or #73 or #74 or #75 or #76 or #77 or #78 or #79 or #80) #90 (#87 or #88 or #89) #91 (#86 and #90)
MEDLINE (Ovid)
1. exp Communication/ 2. exp Counseling/ 3. exp Health Education/ 4. Life Style/ 5. Practice Guidelines as Topic/ 6. (diet* adj1 (therap* or educat* or counsel* or intervention* or treatment*)).tw. 7. (nutriti* adj1 (therap* or educat* or counsel* or intervention*)).tw. 8. (health adj1 (therap* or counsel* or educat*)).tw. 9. (intake* adj3 (increas* or decreas* or reduc* or rais* or low* or chang* or restrict* or high*)).tw. 10. (consumption adj3 (increas* or decreas* or reduc* or rais* or low* or chang* or restrict* or high*)).tw. 11. ((salt or sodium) adj3 (decreas* or reduc* or low* or chang* or restrict*)).tw. 12. ((fish or fruit* or vegetable*) adj3 (increas* or rais* or chang* or high*)).tw. 13. (diet* adj3 chang*).tw. 14. (lifestyle* adj3 chang*).tw. 15. guideline*.tw. 16. (group adj counsel*).tw. 17. (brief adj intervention*).tw. 18. (health adj behav* adj intervention*).tw. 19. advice.tw. 20. leaflet*.tw. 21. video*.tw. 22. ((fat or fats or cholesterol) adj3 (decreas* or reduc* or low* or chang* or restrict*)).tw. 23. or/1‐22 24. Diet/ 25. Diet, Atherogenic/ 26. Diet, Mediterranean/ 27. exp Energy Intake/ 28. exp Dietary Fats/ 29. Dietary Fiber/ 30. Potassium, Dietary/ 31. exp Sodium, Dietary/ 32. exp Ascorbic Acid/ 33. beta Carotene/ 34. exp Folic Acid/ 35. exp Vitamin E/ 36. exp Fish Oils/ 37. exp Plant Oils/ 38. exp Dairy Products/ 39. exp Fruit/ 40. exp Meat/ 41. exp Vegetables/ 42. exp Fatty Acids, Unsaturated/ 43. Food Habits/ 44. diet*.tw. 45. food*.tw. 46. (lipid* adj3 (low* or reduc* or modifi*)).tw. 47. (polyunsaturat* or poly‐unsaturat*).tw. 48. (monunsaturat* or mono‐unsaturat*).tw. 49. (omega* adj3 fat*).tw. 50. (omega3 or omega‐3).tw. 51. marg?rine*.tw. 52. butter*.tw. 53. (meat or meats).tw. 54. fish.tw. 55. vegetable*.tw. 56. fruit*.tw. 57. legum*.tw. 58. soy*.tw. 59. bean*.tw. 60. oat*.tw. 61. grain*.tw. 62. starch*.tw. 63. exp Dietary Carbohydrates/ 64. carbohydrate*.tw. 65. roughage.tw. 66. ((non‐starch or nonstarch) adj (poly‐saccharhide* or polysaccharide*)).tw. 67. (nut or nuts).tw. 68. lard*.tw. 69. salt.tw. 70. (antioxidant* or anti‐oxidant*).tw. 71. folic.tw. 72. folate*.tw. 73. ascorb*.tw. 74. tocopherol*.tw. 75. alphatocopherol*.tw. 76. vitamin c.tw. 77. vitamin e.tw. 78. (betacarotene or beta‐carotene or crotenoid*).tw. 79. carotenoid*.tw. 80. (sodium adj2 intake*).tw. 81. (potassium adj2 intake*).tw. 82. (fat* adj3 (low* or modifi* or animal* or vegetable* or acid* or saturat* or unsaturat*)).tw. 83. (oil* adj3 (vegetable* or olive* or rape* or sunflow* or linseed* or saturat* or unsaturat*)).tw. 84. or/24‐83 85. exp Diet Therapy/ 86. 23 and 84 87. 85 or 86 88. randomized controlled trial.pt. 89. controlled clinical trial.pt. 90. randomized.ab. 91. placebo.ab. 92. drug therapy.fs. 93. randomly.ab. 94. trial.ab. 95. groups.ab. 96. 88 or 89 or 90 or 91 or 92 or 93 or 94 or 95 97. exp animals/ not humans.sh. 98. 96 not 97 99. 87 and 98 100. exp child/ not exp adult/ 101. 99 not 100 102. ("20061116" or "20061117" or "20061118" or "20061119" or 2006112* or 2006113* or 2007* or 2008* or 2009* or 2010*).ed. 103. 101 and 102
EMBASE (Ovid)
1. exp interpersonal communication/ 2. exp counseling/ 3. exp health education/ 4. lifestyle/ 5. practice guideline/ 6. (diet$ adj1 (therap$ or educat$ or counsel$ or intervention$ or treatment$)).tw. 7. (nutriti$ adj1 (therap$ or educat$ or counsel$ or intervention$)).tw. 8. (health adj1 (therap$ or counsel$ or educat$)).tw. 9. (intake$ adj3 (increas$ or decreas$ or reduc$ or rais$ or low$ or chang$ or restrict$ or high$)).tw. 10. (consumption adj3 (increas$ or decreas$ or reduc$ or rais$ or low$ or chang$ or restrict$ or high$)).tw. 11. ((salt or sodium) adj3 (decreas$ or reduc$ or low$ or chang$ or restrict$)).tw. 12. ((fish or fruit$ or vegetable$) adj3 (increas$ or rais$ or chang$ or high$)).tw. 13. (diet$ adj3 chang$).tw. 14. (lifestyle$ adj3 chang$).tw. 15. guideline$.tw. 16. (group adj counsel$).tw. 17. (brief adj intervention$).tw. 18. (health adj behav$ adj intervention$).tw. 19. advice.tw. 20. leaflet$.tw. 21. video$.tw. 22. ((fat or fats or cholesterol) adj3 (decreas$ or reduc$ or low$ or chang$ or restrict$)).tw. 23. or/1‐22 24. diet/ 25. atherogenic diet/ 26. Mediterranean diet/ 27. low calory diet/ 28. exp lipid diet/ 29. exp dietary intake/ 30. exp fat intake/ 31. dietary fiber/ 32. potassium intake/ 33. sodium intake/ 34. exp ascorbic acid/ 35. beta carotene/ 36. folic acid/ 37. alpha tocopherol/ 38. fish oil/ 39. exp vegetable oil/ 40. exp dairy product/ 41. exp fruit/ 42. exp meat/ 43. exp vegetable/ 44. exp unsaturated fatty acid/ 45. exp edible oil/ 46. exp vegetable oil/ 47. exp essential fatty acid/ 48. saturated fatty acid/ 49. feeding behavior/ 50. diet$.tw. 51. food$.tw. 52. (lipid$ adj3 (low$ or reduc$ or modifi$)).tw. 53. (polyunsaturat$ or poly‐unsaturat$).tw. 54. (monunsaturat$ or mono‐unsaturat$).tw. 55. (omega$ adj3 fat$).tw. 56. (omega3 or omega‐3).tw. 57. marg?rine$.tw. 58. butter$.tw. 59. (meat or meats).tw. 60. fish.tw. 61. vegetable$.tw. 62. fruit$.tw. 63. legum$.tw. 64. soy$.tw. 65. bean$.tw. 66. oat$.tw. 67. grain$.tw. 68. starch$.tw. 69. carbohydrate diet/ 70. carbohydrate$.tw. 71. roughage.tw. 72. ((non‐starch or nonstarch) adj (poly‐saccharhide$ or polysaccharide$)).tw. 73. (nut or nuts).tw. 74. lard$.tw. 75. salt.tw. 76. (antioxidant$ or anti‐oxidant$).tw. 77. folic.tw. 78. folate$.tw. 79. ascorb$.tw. 80. tocopherol$.tw. 81. alphatocopherol$.tw. 82. vitamin c.tw. 83. vitamin e.tw. 84. (betacarotene or beta‐carotene or crotenoid$).tw. 85. carotenoid$.tw. 86. (sodium adj2 intake$).tw. 87. (potassium adj2 intake$).tw. 88. (fat$ adj3 (low$ or modifi$ or animal$ or vegetable$ or acid$ or saturat$ or unsaturat$)).tw. 89. (oil$ adj3 (vegetable$ or olive$ or rape$ or sunflow$ or linseed$ or saturat$ or unsaturat$)).tw. 90. or/24‐89 91. exp diet therapy/ 92. 23 and 90 93. 91 or 92 94. exp child/ not Adult/ 95. 93 not 94 96. random$.tw. 97. factorial$.tw. 98. crossover$.tw. 99. cross over$.tw. 100. cross‐over$.tw. 101. placebo$.tw. 102. (doubl$ adj blind$).tw. 103. (singl$ adj blind$).tw. 104. assign$.tw. 105. allocat$.tw. 106. volunteer$.tw. 107. crossover procedure/ 108. double blind procedure/ 109. randomized controlled trial/ 110. single blind procedure/ 111. 96 or 97 or 98 or 99 or 100 or 101 or 102 or 103 or 104 or 105 or 106 or 107 or 108 or 109 or 110 112. (animal/ or nonhuman/) not human/ 113. 111 not 112 114. 95 and 113 115. ("200646" or "200647" or "200648" or "200649" or "200650" or "200651" or "200652" or 2007* or 2008* or 2009* or 2010*).em. 116. 114 and 115
Data and analyses
Comparison 1. Any dietary intervention versus no intervention.
| Outcome or subgroup title | No. of studies | No. of participants | Statistical method | Effect size |
|---|---|---|---|---|
| 1 Systolic blood pressure, change from baseline (mmHg) | 11 | 6406 | Mean Difference (IV, Random, 95% CI) | ‐2.61 [‐3.91, ‐1.31] |
| 2 Diastolic blood pressure, change from baseline (mmHg) | 11 | 6406 | Mean Difference (IV, Random, 95% CI) | ‐1.45 [‐2.22, ‐0.68] |
| 3 Urinary sodium output (mmol/24 hr), change from baseline | 5 | 1691 | Mean Difference (IV, Random, 95% CI) | ‐40.92 [‐56.54, ‐25.29] |
| 4 Urinary potassium output (mmol/24hr), change from baseline | 2 | 158 | Mean Difference (IV, Random, 95% CI) | 10.81 [‐3.92, 25.54] |
| 5 Total cholesterol (mmol/l), change from baseline | 22 | 3044 | Mean Difference (IV, Random, 95% CI) | ‐0.13 [‐0.21, ‐0.05] |
| 6 LDL cholesterol (mmol/l), change from baseline | 17 | 1654 | Mean Difference (IV, Random, 95% CI) | ‐0.16 [‐0.24, ‐0.08] |
| 7 HDL cholesterol (mmol/l), change from baseline | 16 | 1700 | Mean Difference (IV, Random, 95% CI) | ‐0.00 [‐0.02, 0.02] |
| 8 Triglycerides (mmol/l), change from baseline | 8 | 648 | Mean Difference (IV, Random, 95% CI) | ‐0.02 [‐0.13, 0.08] |
| 9 Plasma alpha‐carotene (nanomol/L), change from baseline | 4 | 779 | Mean Difference (IV, Random, 95% CI) | 368.29 [‐125.86, 862.44] |
| 10 Plasma ß‐carotene (nanomol/L), change from baseline | 4 | 765 | Mean Difference (IV, Random, 95% CI) | 272.05 [‐52.03, 596.14] |
| 11 Plasma lycopene (micromol/L), change from baseline | 4 | 807 | Mean Difference (IV, Random, 95% CI) | ‐0.01 [‐0.04, 0.01] |
| 12 Plasma lutein (micromol/L), change from baseline | 4 | 798 | Mean Difference (IV, Random, 95% CI) | 0.02 [0.00, 0.04] |
| 13 Plasma beta‐cryptoxanthin (micromol/L), change from baseline | 4 | 772 | Mean Difference (IV, Random, 95% CI) | 0.07 [0.02, 0.11] |
| 14 Plasma alpha‐tocopherol (micromol/L), change from baseline | 3 | 750 | Mean Difference (IV, Random, 95% CI) | ‐3.11 [‐8.87, 2.65] |
| 15 Plasma gamma‐tocopherol (micromol/L), change from baseline | 3 | 750 | Mean Difference (IV, Random, 95% CI) | ‐0.33 [‐1.07, 0.41] |
| 16 Plasma ascorbic acid (micromol/L), change from baseline | 3 | 750 | Mean Difference (IV, Random, 95% CI) | 12.47 [‐18.81, 43.75] |
| 17 Plasma total carotenoids (micromol/L), change from baseline | 2 | 113 | Mean Difference (IV, Random, 95% CI) | 0.97 [‐0.84, 2.78] |
| 18 Total dietary fat (% Kcal) | 23 | 6364 | Mean Difference (IV, Random, 95% CI) | ‐4.48 [‐6.48, ‐2.47] |
| 19 Dietary saturated fatty acids (% Kcal) | 13 | 3251 | Mean Difference (IV, Random, 95% CI) | ‐2.39 [‐3.37, ‐1.40] |
| 20 Fruit and vegetable (servings per day), change from baseline | 19 | 8456 | Mean Difference (IV, Random, 95% CI) | 1.18 [0.65, 1.71] |
| 21 Fruit (servings per day), change from baseline | 9 | 4439 | Mean Difference (IV, Random, 95% CI) | 0.67 [0.07, 1.28] |
| 22 Vegetable (servings per day), change from baseline | 8 | 4412 | Mean Difference (IV, Random, 95% CI) | 0.92 [0.34, 1.49] |
| 23 Dietary fibre (grams per day), change from baseline | 11 | 3105 | Mean Difference (IV, Random, 95% CI) | 6.51 [2.20, 10.82] |
| 24 Dietary intake of ascorbic acid (mg/day), change from baseline | 5 | 2335 | Mean Difference (IV, Random, 95% CI) | 53.39 [31.97, 74.80] |
| 25 Dietary intake of beta‐carotene (mg/day), change from baseline | 3 | 542 | Mean Difference (IV, Random, 95% CI) | 3.39 [1.20, 5.59] |
| 26 Dietary intake of folate (μg/day), change from baseline | 3 | 1869 | Mean Difference (IV, Random, 95% CI) | 173.40 [101.06, 245.74] |
Comparison 2. Subgroup analyses.
| Outcome or subgroup title | No. of studies | No. of participants | Statistical method | Effect size |
|---|---|---|---|---|
| 1 Total cholesterol (gender) | 22 | 2795 | Mean Difference (IV, Random, 95% CI) | ‐0.15 [‐0.24, ‐0.06] |
| 1.1 Women | 5 | 557 | Mean Difference (IV, Random, 95% CI) | ‐0.02 [‐0.23, 0.19] |
| 1.2 Men | 5 | 484 | Mean Difference (IV, Random, 95% CI) | ‐0.24 [‐0.39, ‐0.09] |
| 1.3 Mixed | 12 | 1754 | Mean Difference (IV, Random, 95% CI) | ‐0.15 [‐0.28, ‐0.02] |
| 2 Total dietary fat (gender) | 22 | 6304 | Mean Difference (IV, Random, 95% CI) | ‐4.47 [‐6.54, ‐2.40] |
| 2.1 Women | 8 | 3208 | Mean Difference (IV, Random, 95% CI) | ‐6.77 [‐10.01, ‐3.53] |
| 2.2 Men | 3 | 186 | Mean Difference (IV, Random, 95% CI) | ‐3.11 [‐4.79, ‐1.42] |
| 2.3 Mixed | 11 | 2910 | Mean Difference (IV, Random, 95% CI) | ‐3.18 [‐6.52, 0.15] |
| 3 Fruit & vegetable servings/day (gender) | 20 | 8509 | Mean Difference (IV, Random, 95% CI) | 1.20 [0.67, 1.72] |
| 3.1 Women | 5 | 1298 | Mean Difference (IV, Random, 95% CI) | 1.98 [0.96, 2.99] |
| 3.2 Men | 2 | 1214 | Mean Difference (IV, Random, 95% CI) | 1.43 [‐0.60, 3.47] |
| 3.3 Mixed | 13 | 5997 | Mean Difference (IV, Random, 95% CI) | 0.82 [0.31, 1.33] |
| 4 Total cholesterol (risk group) | 22 | 3044 | Mean Difference (IV, Random, 95% CI) | ‐0.13 [‐0.21, ‐0.05] |
| 4.1 General population | 4 | 1590 | Mean Difference (IV, Random, 95% CI) | ‐0.05 [‐0.17, 0.07] |
| 4.2 CVD risk high | 15 | 1353 | Mean Difference (IV, Random, 95% CI) | ‐0.18 [‐0.28, ‐0.07] |
| 4.3 Cancer risk high | 3 | 101 | Mean Difference (IV, Random, 95% CI) | ‐0.13 [‐0.46, 0.20] |
| 5 Total dietary fat (risk group) | 22 | 6304 | Mean Difference (IV, Random, 95% CI) | ‐4.47 [‐6.54, ‐2.40] |
| 5.1 General population | 9 | 3433 | Mean Difference (IV, Random, 95% CI) | ‐3.92 [‐7.46, ‐0.38] |
| 5.2 CVD risk high | 9 | 744 | Mean Difference (IV, Random, 95% CI) | ‐3.40 [‐4.83, ‐1.98] |
| 5.3 Cancer risk high | 4 | 2127 | Mean Difference (IV, Random, 95% CI) | ‐8.86 [‐13.68, ‐4.04] |
| 6 Fruit & vegetable servings/day (risk group) | 19 | 8456 | Mean Difference (IV, Random, 95% CI) | 1.18 [0.65, 1.71] |
| 6.1 General population | 14 | 6362 | Mean Difference (IV, Random, 95% CI) | 0.57 [0.28, 0.86] |
| 6.2 CVD risk high | 0 | 0 | Mean Difference (IV, Random, 95% CI) | 0.0 [0.0, 0.0] |
| 6.3 Cancer risk high | 5 | 2094 | Mean Difference (IV, Random, 95% CI) | 2.69 [1.53, 3.85] |
| 7 SBP mmHg (risk group) | 11 | 6406 | Mean Difference (IV, Random, 95% CI) | ‐2.61 [‐3.91, ‐1.31] |
| 7.1 General population | 3 | 4317 | Mean Difference (IV, Random, 95% CI) | ‐2.18 [‐4.47, 0.11] |
| 7.2 CVD high risk | 8 | 2089 | Mean Difference (IV, Random, 95% CI) | ‐2.95 [‐4.76, ‐1.14] |
| 8 DBP mmHg (risk group) | 11 | 6406 | Mean Difference (IV, Random, 95% CI) | ‐1.45 [‐2.22, ‐0.68] |
| 8.1 General population | 3 | 4317 | Mean Difference (IV, Random, 95% CI) | ‐0.84 [‐1.74, 0.07] |
| 8.2 CVD high risk | 8 | 2089 | Mean Difference (IV, Random, 95% CI) | ‐1.97 [‐3.12, ‐0.82] |
| 9 Total cholesterol (setting) | 22 | 3044 | Mean Difference (IV, Random, 95% CI) | ‐0.13 [‐0.21, ‐0.05] |
| 9.1 Healthcare settings | 20 | 2899 | Mean Difference (IV, Random, 95% CI) | ‐0.11 [‐0.19, ‐0.03] |
| 9.2 Community/workplace/home settings | 2 | 145 | Mean Difference (IV, Random, 95% CI) | ‐0.27 [‐0.47, ‐0.07] |
| 10 Total dietary fat (setting) | 22 | 6304 | Mean Difference (IV, Random, 95% CI) | ‐4.47 [‐6.54, ‐2.40] |
| 10.1 Healthcare settings | 15 | 5629 | Mean Difference (IV, Random, 95% CI) | ‐5.38 [‐7.84, ‐2.92] |
| 10.2 Community/workplace/home settings | 7 | 675 | Mean Difference (IV, Random, 95% CI) | ‐2.39 [‐3.71, ‐1.06] |
| 11 Fruit & vegetable servings/day (setting) | 19 | 8456 | Mean Difference (IV, Random, 95% CI) | 1.18 [0.65, 1.71] |
| 11.1 Healthcare settings | 6 | 6383 | Mean Difference (IV, Random, 95% CI) | 1.88 [1.07, 2.70] |
| 11.2 Community/workplace/home settings | 13 | 2073 | Mean Difference (IV, Random, 95% CI) | 0.76 [0.22, 1.30] |
| 12 Total cholesterol (intensity) | 22 | 3044 | Mean Difference (IV, Random, 95% CI) | ‐0.13 [‐0.21, ‐0.05] |
| 12.1 Low intensity | 11 | 1638 | Mean Difference (IV, Random, 95% CI) | ‐0.04 [‐0.12, 0.03] |
| 12.2 High intensity | 11 | 1406 | Mean Difference (IV, Random, 95% CI) | ‐0.20 [‐0.34, ‐0.06] |
| 13 Total dietary fat (intensity) | 22 | 6304 | Mean Difference (IV, Random, 95% CI) | ‐4.47 [‐6.54, ‐2.40] |
| 13.1 Low intensity | 6 | 725 | Mean Difference (IV, Random, 95% CI) | ‐1.68 [‐3.13, ‐0.23] |
| 13.2 High intensity | 16 | 5579 | Mean Difference (IV, Random, 95% CI) | ‐5.47 [‐7.49, ‐3.45] |
| 14 Fruit & vegetable servings/day (intensity) | 19 | 8456 | Mean Difference (IV, Random, 95% CI) | 1.18 [0.65, 1.71] |
| 14.1 Low intensity | 7 | 5625 | Mean Difference (IV, Random, 95% CI) | 0.66 [0.20, 1.11] |
| 14.2 High intensity | 12 | 2831 | Mean Difference (IV, Random, 95% CI) | 1.49 [0.67, 2.30] |
| 15 SBP mmHg (intensity) | 11 | 6406 | Mean Difference (IV, Random, 95% CI) | ‐2.61 [‐3.91, ‐1.31] |
| 15.1 Low intensity | 8 | 4574 | Mean Difference (IV, Random, 95% CI) | ‐2.41 [‐4.72, ‐0.09] |
| 15.2 High intensity | 3 | 1832 | Mean Difference (IV, Random, 95% CI) | ‐2.71 [‐4.36, ‐1.06] |
| 16 DBP mmHg (intensity) | 11 | 6406 | Mean Difference (IV, Random, 95% CI) | ‐1.45 [‐2.22, ‐0.68] |
| 16.1 Low intensity | 8 | 4574 | Mean Difference (IV, Random, 95% CI) | ‐1.39 [‐2.68, ‐0.10] |
| 16.2 High intensity | 3 | 1832 | Mean Difference (IV, Random, 95% CI) | ‐1.57 [‐2.62, ‐0.52] |
| 17 Total cholesterol (duration) | 22 | 3044 | Mean Difference (IV, Random, 95% CI) | ‐0.13 [‐0.21, ‐0.05] |
| 17.1 Short duration (3‐6 months) | 12 | 1868 | Mean Difference (IV, Random, 95% CI) | ‐0.10 [‐0.20, 0.00] |
| 17.2 Long duration (12+ months) | 10 | 1176 | Mean Difference (IV, Random, 95% CI) | ‐0.20 [‐0.34, ‐0.05] |
| 18 Total dietary fat (duration) | 22 | 6304 | Mean Difference (IV, Random, 95% CI) | ‐4.47 [‐6.54, ‐2.40] |
| 18.1 Short duration (3‐6 months) | 9 | 2520 | Mean Difference (IV, Random, 95% CI) | ‐4.22 [‐7.53, ‐0.92] |
| 18.2 Long duration ( 12+ months) | 13 | 3784 | Mean Difference (IV, Random, 95% CI) | ‐4.60 [‐7.58, ‐1.62] |
| 19 Fruit & vegetable servings/day (duration) | 19 | 8456 | Mean Difference (IV, Random, 95% CI) | 1.18 [0.65, 1.71] |
| 19.1 Short duration (6‐8 months) | 9 | 1432 | Mean Difference (IV, Random, 95% CI) | 1.24 [0.49, 1.99] |
| 19.2 Long duration (12+ months) | 10 | 7024 | Mean Difference (IV, Random, 95% CI) | 1.12 [0.34, 1.90] |
| 20 SBP mmHg (duration) | 11 | 6406 | Mean Difference (IV, Random, 95% CI) | ‐2.61 [‐3.91, ‐1.31] |
| 20.1 Short duration (3‐6 months) | 5 | 954 | Mean Difference (IV, Random, 95% CI) | ‐3.21 [‐6.97, 0.54] |
| 20.2 Long duration 12+ months | 6 | 5452 | Mean Difference (IV, Random, 95% CI) | ‐2.04 [‐2.98, ‐1.09] |
| 21 DBP mmHg (duration) | 11 | 6406 | Mean Difference (IV, Random, 95% CI) | ‐1.45 [‐2.22, ‐0.68] |
| 21.1 Short duration (3‐6 months) | 5 | 954 | Mean Difference (IV, Random, 95% CI) | ‐2.32 [‐4.42, ‐0.21] |
| 21.2 Long duration (12+ months) | 6 | 5452 | Mean Difference (IV, Random, 95% CI) | ‐1.07 [‐1.58, ‐0.56] |
Characteristics of studies
Characteristics of included studies [ordered by study ID]
Ammerman 2003.
| Methods | Cluster RCT in rural North Carolina, USA. County health department was the unit of randomisation. Randomisation was stratified by region (East/West) because of known demographic differences. All comparisons between study groups controlled for randomisation by health department by using mixed‐effects linear models. This approach adjusts for any lack of independence among observations from patients within each health department. Analysis was at individual level, allowing for random effects of the health department. The denominator used in this review is the health department. | |
| Participants | Participants with untreated hypercholesterolemia (total cholesterol >180mg/dL if checked in the last year), aged 20‐70 years, resident in the community and contactable by phone. Excluded participants on treatment for hypercholesterolemia (defined as taking lipid lowering medication or more than 2 diet counselling sessions by a health professional in the last 6 months), severe medical conditions, inability to speak or comprehend English. Participants were recruited from county health departments, there were 8 clusters (216 participants) in the intervention group, 9 clusters (252 participants) in the comparison group. The mean age was 54.5 years, and 29% of the participants were men. | |
| Interventions | Food for Heart Programme. All participants had a dietary risk assessment using a validated FFQ, the primary goals were to reduce the consumption of saturated fat and increase consumption of fruit and vegetables and complex carbohydrates. The programme comprised 3 counselling visits from public health nurses using the Food for Heart Programme ‐ a theory based dietary assessment and tailored counselling programme for lower income patients with high cholesterol. The intervention used the dietary risk assessments, illustrated goal sheets, educational pamphlets and a southern style cookbook. Visits took place at 0.5, 1.5 and 2.5 months. Due to >20% loss to follow‐up at 6 and 12 months data is only used in this review for 3 months follow‐up. After 3 months if cholesterol was still high participants were referred to a nutritionalist and at 6 months there was further re‐inforcement with phone calls and newsletters. The comparison group received a minimal intervention which comprised a dietary risk assessment by public health nurses and the nurses were instructed to provide counselling for high cholesterol as they usually do. The cluster design ensured the groups were not contaminated. | |
| Outcomes | Total cholesterol, LDL cholesterol. | |
| Notes | Only data at 3 months follow‐up were used due to high loss to follow‐up subsequently. Authors were contacted to provide data on HDL and triglycerides which are presented only in figures in the paper. They responded that they would try but have not yet provided this additional data. | |
| Risk of bias | ||
| Bias | Authors' judgement | Support for judgement |
| Random sequence generation (selection bias) | Unclear risk | Method used not stated. Randomisation was stratified by region (East/West) as demographic characteristics differed. |
| Allocation concealment (selection bias) | Unclear risk | Not stated. |
| Blinding of participants and personnel (performance bias) All outcomes | Unclear risk | No details. Cluster randomisation avoids contamination. |
| Blinding of outcome assessment (detection bias) All outcomes | Unclear risk | Unclear risk for outcomes of interest. Low risk of bias for dietary assessment questionnaire as interviewers were blinded to participants study group. |
| Incomplete outcome data (attrition bias) All outcomes | Unclear risk | High risk of bias for 12 month data as high losses to follow‐up. 3 month follow‐up data used in the analyses. |
| Selective reporting (reporting bias) | Low risk | All expected outcomes reported. |
| Other bias | Unclear risk | Insufficient information to judge. |
Anderson high fibre.
| Methods | RCT of parallel group design. The control group N is halved to take account of the 2 intervention arms. | |
| Participants | High risk ‐ total cholesterol 5.2‐7.8 mmol/L on 2 screenings 2 weeks apart. Recruited from major employers, churches and shopping centres in the USA. 177 participants randomised, 59.6% men, mean age 40.6 years. | |
| Interventions | Two interventions ‐ both AHA‐type cholesterol lowering diets. This trial arm included a high‐carbohydrate fibre diet (50 g/day). Both arms included a 10 week diet education seminar series (1 hour/week) followed by 30 minute individual counselling sessions, plus 4 home visits from dietitians. Comparison group received no intervention. Follow up at 12 months. | |
| Outcomes | Dietary fibre, total dietary fat and saturated fatty acids (% Kcal), total, HDL and LDL cholesterol. | |
| Notes | ||
| Risk of bias | ||
| Bias | Authors' judgement | Support for judgement |
| Random sequence generation (selection bias) | Unclear risk | See Table 1 |
| Allocation concealment (selection bias) | Unclear risk | See Table 1 |
| Blinding of participants and personnel (performance bias) All outcomes | Unclear risk | See Table 1 |
| Blinding of outcome assessment (detection bias) All outcomes | Unclear risk | See Table 1 |
| Incomplete outcome data (attrition bias) All outcomes | Unclear risk | See Table 1 |
Anderson low fibre.
| Methods | RCT of parallel group design. | |
| Participants | High risk ‐ total cholesterol 5.2‐7.8 mmol/L on 2 screenings 2 weeks apart. Recruited from major employers, churches and shopping centres in the USA. 177 participants randomised, 59.6% men, mean age 40.6 years. | |
| Interventions | Two interventions ‐ both AHA‐type cholesterol lowering diets. This trial arm included a recommended approximately. 15 g/day fibre diet. See 'Anderson high fibre' for further details of intervention. Follow‐up at 12 months. | |
| Outcomes | Dietary fibre, total dietary fat and saturated fatty acids (% Kcal), total, HDL and LDL cholesterol. | |
| Notes | ||
| Risk of bias | ||
| Bias | Authors' judgement | Support for judgement |
| Random sequence generation (selection bias) | Unclear risk | See Table 1 |
| Allocation concealment (selection bias) | Unclear risk | See Table 1 |
| Blinding of participants and personnel (performance bias) All outcomes | Unclear risk | See Table 1 |
| Blinding of outcome assessment (detection bias) All outcomes | Unclear risk | See Table 1 |
| Incomplete outcome data (attrition bias) All outcomes | Unclear risk | See Table 1 |
Anderssen 2007.
| Methods | RCT of parallel group design. | |
| Participants | Recruited from a community screening programme in Oslo, Norway. Participants (all men) had the metabolic syndrome (IDF definition) so were at high risk of CVD. Patients with CVD or diabetes or on drugs that would interfere with the test results were excluded. The study was a retrospective analysis of the Oslo Diet and Exercise study in men who met the definition of metabolic syndrome. Their mean age was 44.9 years. 34 participants were randomised to the diet only arm and 26 to the control arm. | |
| Interventions | Participants were randomised to diet only, exercise only, diet and exercise or control. Data are only analysed for the diet only and control arm in this review. The number of participants randomised to the control group was divided by the number of intervention groups to take account of this in the analysis. The diet only arm received individualised dietary counselling adapted to each persons diet history and CVD risk profile. Counselling was given to the intervention group and their spouses at the start, and to participants thereafter at 3 and 9 months. Participants in the control group were told not to change their lifestyle during the trial with the exception of smoking. Participants in the control group were told that after the 1 year intervention period they would be offered dietary advice and supervised exercise training. The follow‐up period was 1 year. | |
| Outcomes | Total cholesterol, LDL and HDL cholesterol, triglycerides, SBP, DBP, % energy from fat. | |
| Notes | Substudy of the Oslo Diet and Exercise Study. Data from the diet only arm were used. The authors kindly provided data on lipid levels and blood pressure presented in figure form in the paper. | |
| Risk of bias | ||
| Bias | Authors' judgement | Support for judgement |
| Random sequence generation (selection bias) | Unclear risk | A retrospective analysis of men in the Oslo Diet and Exercise Study (ODES) with the metabolic syndrome. In this trial a pre‐randomised sequence of 4 possible intervention groups was prepared using simple randomisation without blocking. |
| Allocation concealment (selection bias) | Unclear risk | No details. |
| Blinding of participants and personnel (performance bias) All outcomes | Unclear risk | Participants in the control group were told that after 1 year they would be offered dietary advice and supervised physical training so they were not blinded. However, it is extremely difficult to blind participants to behavioural interventions so we have not classified this as at high risk of bias. |
| Blinding of outcome assessment (detection bias) All outcomes | Unclear risk | No details. |
| Incomplete outcome data (attrition bias) All outcomes | Low risk | No losses to follow‐up were recorded. |
| Selective reporting (reporting bias) | Unclear risk | All expected outcomes reported. |
| Other bias | Unclear risk | Insufficient information to judge. |
Baron men 1990.
| Methods | RCT of parallel group design. | |
| Participants | Healthy individuals recruited from GP lists in Abingdon, Oxfordshire. 437 subjects randomised, 51% men with mean age 41.9 years. Men and women have been analysed separately. | |
| Interventions | Intervention administered by practice nurse. Individual or group session lasting 30 minutes on dietary advice to decrease total fat intake to 30‐35% of calories and increase dietary fibre. A booklet was also given to participants on basic ideas of diet, recipes and advice concerning local restaurants. There was a brief follow‐up session at 1 and 3 months. The comparison group were told they were part of a nutrition survey but were offered no dietary advice. Follow up at 3 and 12 months (3 month data used as follow‐up less than 80% at 12 months). | |
| Outcomes | Total cholesterol, HDL and LDL cholesterol, dietary fibre. | |
| Notes | ||
| Risk of bias | ||
| Bias | Authors' judgement | Support for judgement |
| Random sequence generation (selection bias) | Unclear risk | See Table 1 |
| Allocation concealment (selection bias) | Unclear risk | See Table 1 |
| Blinding of participants and personnel (performance bias) All outcomes | Unclear risk | See Table 1 |
| Blinding of outcome assessment (detection bias) All outcomes | Unclear risk | See Table 1 |
| Incomplete outcome data (attrition bias) All outcomes | Unclear risk | See Table 1 |
Baron women 1990.
| Methods | RCT of parallel group design. | |
| Participants | Healthy individuals recruited from GP lists in Abingdon, Oxfordshire. 437 subjects randomised, 49% women with mean age 41.5 years. Men and women have been analysed separately. | |
| Interventions | See Baron 1990 for details of intervention. Follow‐up at 3 and 12 months (3 month data used as follow‐up less than 80% at 12 months). | |
| Outcomes | Total cholesterol, HDL and LDL cholesterol, dietary fibre. | |
| Notes | ||
| Risk of bias | ||
| Bias | Authors' judgement | Support for judgement |
| Random sequence generation (selection bias) | Unclear risk | See Table 1 |
| Allocation concealment (selection bias) | Unclear risk | See Table 1 |
| Blinding of participants and personnel (performance bias) All outcomes | Unclear risk | See Table 1 |
| Blinding of outcome assessment (detection bias) All outcomes | Unclear risk | See Table 1 |
| Incomplete outcome data (attrition bias) All outcomes | Unclear risk | See Table 1 |
Beckman 1995.
| Methods | RCT of parallel group design. | |
| Participants | Recruited from a community screening programme in Oslo, Norway. Participants (all men) aged 40‐56 years had uncomplicated and untreated mild to moderate hypertension so were at high risk of CVD. Participants were otherwise healthy normal ECG, normal renal function and no chronic drug treatment. 22% were smokers but none quit during the study. | |
| Interventions | Participants were instructed individually by a nutritionalist to lower salt intake. This included advice not to add salt at the table or during cooking, avoid processed foods and other foods high in salt and increase consumption of fruit and vegetables to increase potassium levels. Visits for blood pressure checks by the nutritionalist at 1 and 2 weeks, 3, 6 and 12 months so presumably some reinforcement. At 3 months advice was also given to reduce body weight in those with a BMI >27 and reduce saturated fat intake in those with cholesterol above the 50th percentile. To increase compliance, free unsalted bread, sausages, cheese and margarine were provided for the first 2 weeks of the intervention. The control group received no advice and came to the clinic for blood pressure checks. At 12 months everyone received the intervention. Follow‐up at 12 months. | |
| Outcomes | Urinary sodium and potassium, total cholesterol, HDL cholesterol and triglycerides, mean BP (supine and standing). | |
| Notes | 2 control groups, a blood pressure control group and time control group. The blood pressure control group was used in the analyses. Mean blood pressure both supine and standing was measured rather than SBP and DBP. These data were not incorporated in the meta‐analyses but dealt with descriptively. The longest follow‐up period is 18 months but after 12 months the control groups also received dietary advice so 12 month follow‐up data is used. | |
| Risk of bias | ||
| Bias | Authors' judgement | Support for judgement |
| Random sequence generation (selection bias) | Unclear risk | No details |
| Allocation concealment (selection bias) | Unclear risk | No details |
| Blinding of participants and personnel (performance bias) All outcomes | Unclear risk | No details |
| Blinding of outcome assessment (detection bias) All outcomes | Unclear risk | Possibly. In random order, subjects belonging to the intervention group and the control group were seen in the outpatient clinic by the nutritionist for BP measurement. |
| Incomplete outcome data (attrition bias) All outcomes | Low risk | No details given, assume no losses to follow‐up. Stated that ITT analysis was used. |
| Selective reporting (reporting bias) | Unclear risk | All expected outcomes reported. |
| Other bias | Unclear risk | Insufficient information to judge. |
Beresford 1997.
| Methods | Cluster RCT. Physician practice was unit of randomisation. Analysis was at individual level, allowing for random effects of clinic and physician practice, with physician nested within clinic. The denominator used in this review is the physician. | |
| Participants | 28 GP practices in 6 primary care clinics in the USA. Participants attending routine visits without major illness were recruited. 2111 participants, 32% men, 25.5% greater than 65 years. | |
| Interventions | Low intensity dietary intervention to increase fibre and reduce fat intake. Self‐help booklet developed by the authors based on behavioural change principles from social learning theory and a brief motivational message from the physician. The control group received no intervention. Follow‐up at 12 months. | |
| Outcomes | Total dietary fat (% Kcal). | |
| Notes | ||
| Risk of bias | ||
| Bias | Authors' judgement | Support for judgement |
| Random sequence generation (selection bias) | Unclear risk | See Table 1 |
| Allocation concealment (selection bias) | Unclear risk | See Table 1 |
| Blinding of participants and personnel (performance bias) All outcomes | Unclear risk | See Table 1 |
| Blinding of outcome assessment (detection bias) All outcomes | Unclear risk | See Table 1 |
| Incomplete outcome data (attrition bias) All outcomes | Unclear risk | See Table 1 |
Beresford 2006.
| Methods | Cluster RCT. Worksite was the unit of randomisation. Blocking criteria included baseline survey response rates, type and size of worksite and % of female employees. Analysis was at the level of the cluster. | |
| Participants | 28 worksites (educational, medical and other) were randomised. All worksites with food serving cafeterias and with between 250 and 2000 employees within the greater metropolitan area of Seattle, USA were eligible. | |
| Interventions | The Special Intervention developed around the stages of change model addressing both the work environment and individual behaviour change. Each worksite had an employee advisory board (EAB) using a protocol specifying minimum activities required at each worksite and general structure for organising and implementing the intervention activities. The EAB met with a member of the research group approximately every 2 weeks, who provided materials, assisted with activities and participated in EAB meetings. The EABs took responsibility for tailoring the intervention. Intervention messages included increasing awareness about 5 a day and introducing the idea of eating more F&V in the workplace. The intervention targeted transition points from precontemplation to contemplation, contemplation to preparation, preparation to action and action to maintainance. The control group received a minimal intervention which encouraged eating more F&V using posters and brochures, newsletters, food demonstrations and a self help manual. Follow‐up was at 24 months. | |
| Outcomes | Fruit and vegetable servings/day. | |
| Notes | ||
| Risk of bias | ||
| Bias | Authors' judgement | Support for judgement |
| Random sequence generation (selection bias) | Unclear risk | See Table 1 |
| Allocation concealment (selection bias) | Unclear risk | See Table 1 |
| Blinding of participants and personnel (performance bias) All outcomes | Unclear risk | See Table 1 |
| Blinding of outcome assessment (detection bias) All outcomes | Unclear risk | See Table 1 |
| Incomplete outcome data (attrition bias) All outcomes | Unclear risk | See Table 1 |
Bloemberg 1991.
| Methods | RCT of parallel group design. | |
| Participants | High risk ‐ total cholesterol 6.5‐10.0 mmol/L. 80 Dutch men randomised, mean age 47 years. | |
| Interventions | Individualised dietary advice from a dietitian with the aim to lower plasma cholesterol by 1mmol/L. After one week, advice reinforced by 2 follow‐up calls. Information on healthy diet also mailed to participants on 5 occasions. Intervention lasted 6 months. No details regarding the comparison group. Follow‐up at 6 months. | |
| Outcomes | Total dietary fat and saturated fat (% Kcal), total cholesterol. | |
| Notes | ||
| Risk of bias | ||
| Bias | Authors' judgement | Support for judgement |
| Random sequence generation (selection bias) | Unclear risk | See Table 1 |
| Allocation concealment (selection bias) | Unclear risk | See Table 1 |
| Blinding of participants and personnel (performance bias) All outcomes | Unclear risk | See Table 1 |
| Blinding of outcome assessment (detection bias) All outcomes | Unclear risk | See Table 1 |
| Incomplete outcome data (attrition bias) All outcomes | Unclear risk | See Table 1 |
Bowen 2009.
| Methods | Cluster RCT where religious organisations in Seattle were the unit of randomisation. Called the Eating for a Healthy Life project. | |
| Participants | Members of religious organisations (cluster RCT where 40 religious organisations were randomised ‐ 2175 individuals). 100 households were drawn at random from each religious organisation (RO) list and further samples as required to complete the cohort. Individuals had to be active members of the RO, at least 18 years, English speakers, resident in the area for the next 12 months, had phone number and address, and had agreed to be contacted for follow‐up. The sample size calculation of 20 pairs of ROs assumed an intra‐class correlation of 0.015 for the primary outcome fruit and fibre questionnaire based on previous data. Data is analysed at the level of the individual using regression analyses which allowed for adjustment of random RO‐level variation in addition to variation from individual respondents. The denominator used in this review is the RO.The mean age of the participants was 54 (15.9) years (range 18‐100) with approximately equal numbers in the 30‐50 year and 50‐79 year age groups. 86% of the participants were female. | |
| Interventions | Intervention package of self‐help books and motivational messages and social interactions designed to change dietary behaviours (lowering fat and increasing F&V consumption). Materials were based on social learning theory and trans‐theoretical models of behavioural change. The dietary intervention package was implemented for 9 months in each intervention RO. A healthy eating coordinator was assigned to each RO to help deliver the intervention. Intervention components included a volunteer advisory board, interpersonal support, dietary change mailings, social activities, healthy eating sessions and print advertisements. The spacing out of individual components was determined by the advisory boards for each RO appropriate for each RO climate. The intervention was targeted at the primary food preparer in each household, but all intervention components were made available to the entire RO membership. The intervention period was 9 months with follow‐up at 12 months. The control ROs received the intervention after 12 months. | |
| Outcomes | Primary outcomes were fat and F&V related behaviours using the Fat and Fibre Behaviour (FFB) Questionnaire. In 30% of the sample fat % energy intake, fruit and vegetable servings/day and dietary fibre (g/1000Kcal) were measured. | |
| Notes | ||
| Risk of bias | ||
| Bias | Authors' judgement | Support for judgement |
| Random sequence generation (selection bias) | Unclear risk | Stratified randomisation of religious organisations by denomination, size, baseline response rate, percentage of families and education level. |
| Allocation concealment (selection bias) | Unclear risk | No details |
| Blinding of participants and personnel (performance bias) All outcomes | Unclear risk | No details. Cluster randomisation avoids contamination. |
| Blinding of outcome assessment (detection bias) All outcomes | Unclear risk | No details |
| Incomplete outcome data (attrition bias) All outcomes | Low risk | Losses to follow‐up were similar for each group (9.4% of the intervention group and 11% of the control group were lost to follow‐up at 12 months). |
| Selective reporting (reporting bias) | Unclear risk | All expected outcomes reported. |
| Other bias | Unclear risk | Insufficient information to judge. |
Brekke 2005.
| Methods | RCT of parallel group design. | |
| Participants | Non‐diabetic first degree relatives of type‐2 diabetic patients aged 25‐55 with a medical history free of CHD recruited from outpatients clinics from questionnaires concerning family history of diabetes and advertisements in newspapers in the Goteborg area, Sweden. Exclusion criteria were diabetes (fasting blood glucose >6.1 mmol/L or 2 hour blood glucose >11.1 mmol/L or both), BMI>35, diseases or medications affecting glucose or lipid metabolism. 77 participants randomised, 60% men, mean age 43 years. | |
| Interventions | Two intervention arms ‐ diet and diet plus exercise and control group. This review is concerned only with the diet intervention. Dietary advice aimed to decrease saturated fat (goal 10% of energy), increase monosaturated fat (goal 10‐15% of energy) and n‐3 fatty acids (goal 1% energy) from fatty fish and vegetable origin and for vegetables to take up one third of the lunch or dinner plate, increasing fruit and soluble fibre consumption as much as possible and increasing the intake of low GI foods. Dietician performed group counselling (3‐11 participants/group with members of household who prepare food), sessions lasted 1‐2 hours. There were 2 dietary education sessions 1‐2 weeks apart at the beginning of the study. During the 16 week intervention period there was intensive follow‐up with unannounced phone calls every 10 days (8 calls per person). Control group participants received a letter informing them to continue with their usual lifestyle. Follow‐up was at 2 years. For ethical reasons after 1 year the control group began the intervention and were followed for a further 2 years. This review uses the follow‐up data at 12 months. | |
| Outcomes | Plasma total cholesterol, LDL and HDL cholesterol and triglycerides (mmol/L), total fat %Kcal and saturated fat %Kcal, dietary fibre (g/1000Kcal ‐ converted to g/day by assuming Kcal intake of 2000). | |
| Notes | ||
| Risk of bias | ||
| Bias | Authors' judgement | Support for judgement |
| Random sequence generation (selection bias) | Unclear risk | See Table 1 |
| Allocation concealment (selection bias) | Unclear risk | See Table 1 |
| Blinding of participants and personnel (performance bias) All outcomes | Unclear risk | See Table 1 |
| Blinding of outcome assessment (detection bias) All outcomes | Unclear risk | See Table 1 |
| Incomplete outcome data (attrition bias) All outcomes | Unclear risk | See Table 1 |
Buller 1999.
| Methods | Cluster RCT. Employee cliques (informal social networks) were paired on several factors including mean fruit and vegetable consumption at baseline, ethnicity, sex composition, and size. One clique of each pair was randomly assigned to the intervention. Clique was the unit of analysis. | |
| Participants | 41 cluster pairs of cliques (informal social networks) of blue collar workers recruited from 10 public employers in Arizona. Clusters include 905 workers of low socioeconomic class, 75% men, mean age 42.1 years. | |
| Interventions | Peer education intervention to increase fruit and vegetable consumption. One employee from each clique was recruited as a peer educator. In addition there was a 5‐a‐day program using worksite mail, cafeteria promotions and speakers. The comparison group received this 5‐a‐day program but no peer education intervention. Follow‐up was at 6 months. | |
| Outcomes | Fruit and vegetable servings per day. | |
| Notes | ||
| Risk of bias | ||
| Bias | Authors' judgement | Support for judgement |
| Random sequence generation (selection bias) | Unclear risk | See Table 1 |
| Allocation concealment (selection bias) | Unclear risk | See Table 1 |
| Blinding of participants and personnel (performance bias) All outcomes | Unclear risk | See Table 1 |
| Blinding of outcome assessment (detection bias) All outcomes | Unclear risk | See Table 1 |
| Incomplete outcome data (attrition bias) All outcomes | Unclear risk | See Table 1 |
Cheng 2004.
| Methods | RCT of parallel group design. | |
| Participants | Participants with hypercholesterolaemia recruited from an urban academic primary care practice in Philadelphia. Participants were either referred by phycians or referred themselves from posters in the practice. None of the participants were on lipid lowering medications and none had prior formal nutritional counselling. 208 participants randomised, 28.6% men, mean age 53.8 years (range 25‐101). | |
| Interventions | The intervention used the Food for Heart Programme, a core component of which is the dietary risk assessment ‐ a food frequency questionnare based on the 20 foods highest in saturated fat and cholesterol in the American diet. The dietary risk assessment has 4 categories (meats, side dishes/desserts/snacks, dairy/eggs, fats/oils) each of which formed the basis of a brief focused visit to the practice. The intervention was administed by a research assistant with no background in nutrition. Problem foods were identified and advice sheets with suggestions for more healthy substitutes were given as well as a cook book with low fat recipes. The control group received no intervention. Follow‐up was at 4 months. | |
| Outcomes | Plasma total cholesterol, LDL and HDL cholesterol (mmol/L) | |
| Notes | ||
| Risk of bias | ||
| Bias | Authors' judgement | Support for judgement |
| Random sequence generation (selection bias) | Unclear risk | See Table 1 |
| Allocation concealment (selection bias) | Unclear risk | See Table 1 |
| Blinding of participants and personnel (performance bias) All outcomes | Unclear risk | See Table 1 |
| Blinding of outcome assessment (detection bias) All outcomes | Unclear risk | See Table 1 |
| Incomplete outcome data (attrition bias) All outcomes | Unclear risk | See Table 1 |
Coates WHT MP 1999.
| Methods | RCT of parallel group design. | |
| Participants | Post‐menopausal women from minority and low socioeconomic class populations consuming at least 35% of energy from fat. Women recruited from clinics in Georgia, Alabama and Florida. Women had no major chronic disease and were not on lipid‐lowering medication. 2208 women randomised (60% to the intervention), mean age 60 years. | |
| Interventions | Intervention to reduce fat intake to 20% energy or less. A nutritionalist assigned fat gram goals to each participant. Group sessions were held weekly for 6 weeks, fortnightly for 6 weeks, and monthly for 9 months and then quarterly. Sessions included nutritional information and behavioural change strategies. Elements of the program were enhanced or added to meet the needs of a diverse population. The comparison group received "dietary guidelines for Americans" but were not counselled. Intervention lasted for 2 years, with follow‐up at 6, 12 and 18 months. Data abstracted for 6 months follow‐up as thereafter follow‐up was poor. | |
| Outcomes | Total dietary fat and saturated fat (% Kcal), fruit servings per day, vegetable servings per day. | |
| Notes | ||
| Risk of bias | ||
| Bias | Authors' judgement | Support for judgement |
| Random sequence generation (selection bias) | Unclear risk | See Table 1 |
| Allocation concealment (selection bias) | Unclear risk | See Table 1 |
| Blinding of participants and personnel (performance bias) All outcomes | Unclear risk | See Table 1 |
| Blinding of outcome assessment (detection bias) All outcomes | Unclear risk | See Table 1 |
| Incomplete outcome data (attrition bias) All outcomes | Unclear risk | See Table 1 |
Cox 1996.
| Methods | RCT of parallel group design. | |
| Participants | Women with poor diet with high fat content from low income families in USA. 150 women randomised, mean age 29 years, 69% black. | |
| Interventions | Education series emphasising the prevention of cardiovascular disease and cancer by dietary and lifestyle changes. Encouraged to decrease total and saturated fat intake, decrease salt intake, and increase consumption of low fat milk products, fruit and vegetables, soluble fibre, complex carbohydrates, antioxidant nutrients, calcium and potassium. Comparison group were taught about money management but received no information on health or nutrition. Follow‐up at 6 months. | |
| Outcomes | Total dietary fat and saturated fat (% Kcal), fruit servings per day, vegetable servings per day. | |
| Notes | ||
| Risk of bias | ||
| Bias | Authors' judgement | Support for judgement |
| Random sequence generation (selection bias) | Unclear risk | See Table 1 |
| Allocation concealment (selection bias) | Unclear risk | See Table 1 |
| Blinding of participants and personnel (performance bias) All outcomes | Unclear risk | See Table 1 |
| Blinding of outcome assessment (detection bias) All outcomes | Unclear risk | See Table 1 |
| Incomplete outcome data (attrition bias) All outcomes | Unclear risk | See Table 1 |
Djuric combination.
| Methods | RCT of parallel group design. The control group N is halved to take account of the two intervention arms. | |
| Participants | Premenopausal women with at least one first degree relative with breast cancer, and consuming >25% fat of total energy and < 5/day F&V. The study was based in the USA. Women were required to be in good general health with no expected changes lifestyle or the use of oral contraceptives. Women taking supplements were excluded. Women were recruited through community advertising for the Nutrition and Breast Health Study. 127 women were randomised to 3 intervention arms (high F&V, low fat and a combination of low fat and high F&V) and a control. Mean age was 37 years (range 21‐50). | |
| Interventions | 2x2 factorial trial design ‐ 3 intervention arms, high F&V intake, low fat and a combination of high F&V and low fat. The low fat arm was excluded from our analyses due to high loss to follow‐up (leaving 82 participants randomised). The other intervention arms received individualised counselling every 2 weeks initially by a trained dietician, then monthly, and monthly group meetings for the intervention period of 12 months. The goal for the high F&V arm was to increase F&V to 9 servings/day in a specified variety to increase carotenoid intake. The goal for the combination arm was to decrease fat to 15% total energy from fat and increase F&V to 9 servings/day. Monthly meetings provided additional education on a variety of topics consistent with their dietary assignment. The control group received no dietary counselling and were told they should continue their usual diet. They received a one page daily food guide pyramid as a guide for healthy eating but this was not discussed. Follow‐up was at 12 months. Longer‐term follow‐up (2 years) was reported by the authors (Radakovich 2006) but loss to follow‐up was greater than 20%. | |
| Outcomes | Plasma total cholesterol, LDL and HDL cholesterol and triglycerides (mg/dL converted to mmol/L). Plasma alpha and beta‐carotene, lutein, lycopene, beta‐cryptoxanthin, alpha and gamma‐tocopherol and ascorbic acid (µg/mL converted to µmol/L). Dietary intake of beta‐carotene, ascorbic acid and alpha and gamma‐tocopherol (µg/1000kcal/day). | |
| Notes | ||
| Risk of bias | ||
| Bias | Authors' judgement | Support for judgement |
| Random sequence generation (selection bias) | Unclear risk | See Table 1 |
| Allocation concealment (selection bias) | Unclear risk | See Table 1 |
| Blinding of participants and personnel (performance bias) All outcomes | Unclear risk | See Table 1 |
| Blinding of outcome assessment (detection bias) All outcomes | Unclear risk | See Table 1 |
| Incomplete outcome data (attrition bias) All outcomes | Unclear risk | See Table 1 |
Djuric high F&V.
| Methods | RCT of parallel group design. The control group N is halved to take account of the two intervention arms. | |
| Participants | Premenopausal women with at least one first degree relative with breast cancer, and consuming >25% fat of total energy and < 5/day F&V. The study was based in the USA. Women were required to be in good general health with no expected changes lifestyle or the use of oral contraceptives. Women taking supplements were excluded. Women were recruited through community advertising for the Nutrition and Breast Health Study. 127 women were randomised to 3 intervention arms (high F&V, low fat and a combination of low fat and high F&V) and a control. Mean age was 37 years (range 21‐50). | |
| Interventions | see Djuric combination for details. | |
| Outcomes | Plasma total cholesterol, LDL and HDL cholesterol and triglycerides (mg/dL converted to mmol/L). Plasma alpha and beta carotene, lutein, lycopene, beta‐cryptoxanthin, alpha and gamma‐tocopherol and ascorbic acid (µg/mL converted to µmol/L). Dietary intake of beta‐carotene, ascorbic acid and alpha and gamma‐tocopherol (µg/1000kcal/day). | |
| Notes | ||
| Risk of bias | ||
| Bias | Authors' judgement | Support for judgement |
| Random sequence generation (selection bias) | Unclear risk | See Table 1 |
| Allocation concealment (selection bias) | Unclear risk | See Table 1 |
| Blinding of participants and personnel (performance bias) All outcomes | Unclear risk | See Table 1 |
| Blinding of outcome assessment (detection bias) All outcomes | Unclear risk | See Table 1 |
| Incomplete outcome data (attrition bias) All outcomes | Unclear risk | See Table 1 |
Elder promotora.
| Methods | RCT of parallel group design. The control group N is halved to take account of the two intervention arms. | |
| Participants | Spanish dominant latinas from central and southern regions of San Diego county. Women were recruited and assessed for eligibility using random digit dialing using a telephone list of Hispanic surname households. 357 women randomised, mean age 40 years. | |
| Interventions | Two intervention arms to decrease dietary fat and increase fibre ‐ promotora and tailored. In the promotora arm participants received weekly visits or phone calls from promotoras (lay health advisors) over a 14 week period and 12 tailored newsletters with homework assignments mailed weekly. Promotoras worked with individuals to negotiate behaviour change and provide support and encouragement and the weekly newsletters were used to guide discussions. The tailored arm received the 12 weekly newsletters and homework assignments created by using baseline assessments for each individual. They provided feedback on assessments as well as personalised goal setting and dealing with identified barriers. The last newsletter contained information from the 12 week assessment and included changes achieved and steps to continue or maintain the change process. The control group received newsletters in Spanish covering the same content area, but they were off the shelf materials readily available to the public. Follow‐up was at 12 months but data for this review were taken at 12 weeks due to the high loss to follow‐up at 6 and 12 months. | |
| Outcomes | Total dietary fat and saturated fat (grams, converted to % energy from fat by using Kcal intakes provided in the report). Only follow‐up data were provided for these outcomes. | |
| Notes | ||
| Risk of bias | ||
| Bias | Authors' judgement | Support for judgement |
| Random sequence generation (selection bias) | Unclear risk | See Table 1 |
| Allocation concealment (selection bias) | Unclear risk | See Table 1 |
| Blinding of participants and personnel (performance bias) All outcomes | Unclear risk | See Table 1 |
| Blinding of outcome assessment (detection bias) All outcomes | Unclear risk | See Table 1 |
| Incomplete outcome data (attrition bias) All outcomes | Unclear risk | See Table 1 |
Elder tailored.
| Methods | RCT of parallel group design. The control group N is halved to take account of the two intervention arms. | |
| Participants | Spanish dominant latinas from central and southern regions of San Diego county. Women were recruited and assessed for eligibility using random digit dialing using a telephone list of Hispanic surname households. 357 women randomised, mean age 40 years. | |
| Interventions | See Elder promotora for details. | |
| Outcomes | Total dietary fat and saturated fat (grams, converted to % energy from fat by using Kcal intakes provided in the report). Only follow‐up data were provided for these outcomes. | |
| Notes | ||
| Risk of bias | ||
| Bias | Authors' judgement | Support for judgement |
| Random sequence generation (selection bias) | Unclear risk | See Table 1 |
| Allocation concealment (selection bias) | Unclear risk | See Table 1 |
| Blinding of participants and personnel (performance bias) All outcomes | Unclear risk | See Table 1 |
| Blinding of outcome assessment (detection bias) All outcomes | Unclear risk | See Table 1 |
| Incomplete outcome data (attrition bias) All outcomes | Unclear risk | See Table 1 |
ENCORE.
| Methods | RCT of parallel group design. | |
| Participants | Participants were overweight or obese with untreated hypertension (SBP 130‐159, DBP 85‐99 mm Hg based on 4 screening visits) recruited from physician referrals, community screenings, mass media advertising in North Carolina, USA. 144 participants randomised (46 to DASH alone, 49 to control), the mean age was 52 years and 32.6% were men. | |
| Interventions | The DASH diet is high in low fat diary products and fruits and vegetables, rich in fibre and lower in fats. Participants in the intervention group received counselling on the DASH diet and provided feedback on their adherence in weekly group sessions. The goal of the sessions was to assist participants in learning how to buy and prepare appropriate foods, enhance their motivation to chose to eat these foods and to overcome any obstacles. A nutritionalist made the recommendations and small group sessions were held weekly (30‐45 minutes each) at the research centre. Immediately after randomisation and before the counselling sessions participants entered a 2 week controlled isocalorific feeding period to improve compliance with the DASH diet. The comparison group were asked to maintain their usual dietary and exercise habits. Follow‐up was at 4 months after the intervention period. | |
| Outcomes | Total, HDL and LDL cholesterol, triglycerides, SBP, DBP, urinary sodium and potassium, dietary intake of fat, fibre, fruits and vegetables. | |
| Notes | Two intervention groups ‐ DASH alone and DASH plus weight management. The review looks at only at the DASH alone arm. | |
| Risk of bias | ||
| Bias | Authors' judgement | Support for judgement |
| Random sequence generation (selection bias) | Low risk | Randomised in groups of 2‐5 participants using a computer program. |
| Allocation concealment (selection bias) | Low risk | Sealed envelopes used so allocation was concealed. |
| Blinding of participants and personnel (performance bias) All outcomes | Unclear risk | Participants were provided their treatment group assignments in sealed envelopes which suggests they were unblinded. However, blinding of participants and personnel for behavioural interventions is difficult and often not possible so we have not judged this as at high risk of bias. |
| Blinding of outcome assessment (detection bias) All outcomes | Low risk | Staff members performing the assessments were unaware of group assignment. |
| Incomplete outcome data (attrition bias) All outcomes | Low risk | Only one participant lost to follow‐up and ITT analysis used. |
| Selective reporting (reporting bias) | Low risk | All expected outcomes reported. |
| Other bias | Unclear risk | Insufficient information to judge. |
Fuemmeler 2006.
| Methods | Cluster RCT. Churches were paired according to size and socioeconomic status of congregants and urban or rural geography and then each pair was randomised to intervention or control. Churches were the unit of analysis. | |
| Participants | 14 black American churches with at least 200 congregants located near cancer society offices in California, Georgia, North and South Carolina, Delaware and Virginia, USA. Clusters contained 1020 individuals, 26.6% men, mean age 49.7 years. | |
| Interventions | The Body and Soul intervention designed to increase F&V consumption included a set of core church wide activities (e.g. serving F&V after church services, food demonstrations and taster tests, invited speakers, messages in pastors sermons), self help materials (cook book and video containing spiritual and secular motivational messages targeting F&V intake) and peer counselling based on the principles and techniques of motivational interviewing. Congregations nominated members to be part of an oversight committee responsible for implementing the Body and Soul intervention. The committee liased with the research team and members of the committee and peer counsellors were given training. The control group received the delayed intervention at 6 months. Follow‐up was at 6 months. | |
| Outcomes | F&V (servings/day). | |
| Notes | ||
| Risk of bias | ||
| Bias | Authors' judgement | Support for judgement |
| Allocation concealment (selection bias) | Unclear risk | B ‐ Unclear |
Gann 2003.
| Methods | RCT of parallel group design. | |
| Participants | Healthy women aged 20‐40 years recruited by direct mailings and advertising in downtown Chicago. Women who were on diets, were pregnant or planning pregnancy and those on oral contraceptives were excluded. 213 women randomised, mean age 33 years. | |
| Interventions | Low fat high fibre dietary intervention. Goals were to reduce total fat intake to <20%, increase total fibre intake to 25‐30g, increase F&V intake to >8 servings/day, to eat more complex carbohydrates (carbohydrate intake 60‐65% Kcal/day) and protein intake 15‐20% Kcal/day. Women were not encouraged to reduce calorie intake. Intervention included classroom nutrition education (18 group classes) plus individual counselling (2 individual meetings in 12 months) to provide women with the knowledge and behavioural skills necessary to make a permanent lifestyle change. To maximise the impact of the intervention sessions, appropriate food was prepared and served. Sessions included practice shopping, label reading, meal preparation techniques and eating out and convienience foods were discussed. The control group were told to follow their usual diet and received a leaflet on healthy eating. After 12 month intervention period they received some of the materials given to the intervention group. Follow‐up was at 12 months. | |
| Outcomes | Total fat %Kcal, saturated fat (g ‐ converted to %Kcal by using Kcal intake as reported), total dietary fibre (g/day). | |
| Notes | ||
| Risk of bias | ||
| Bias | Authors' judgement | Support for judgement |
| Random sequence generation (selection bias) | Unclear risk | See Table 1 |
| Allocation concealment (selection bias) | Unclear risk | See Table 1 |
| Blinding of participants and personnel (performance bias) All outcomes | Unclear risk | See Table 1 |
| Blinding of outcome assessment (detection bias) All outcomes | Unclear risk | See Table 1 |
| Incomplete outcome data (attrition bias) All outcomes | Unclear risk | See Table 1 |
Havas 1998.
| Methods | Cluster RCT of cross‐over design. Sites were switched 4 months after completion of phase 1. Each site acted as own control, using intention to treat analysis. Phase 1 participants were not eligible to enrol in phase 2. Specially employed peer educators conducted the intervention. | |
| Participants | Women on low incomes recruited from a government funded special supplemental nutrition program for women infants and children in Baltimore City. 16 sites where this program was carried out were randomised, involving 3122 women, of whom 40.5% were aged between 18‐24, 26.5% between 25‐29 and 33% 30 years or more. | |
| Interventions | Five a day promotional program where the goal was to increase fruit and vegetable consumption by at least half a serving per day. Peer educators delivered 2 types of nutrition education ‐ brief messages regarding increasing fruit and vegetable consumption at enrolment, and 3 group discussions of 45 minutes during the 6 month intervention period which included personal goal setting, overcoming perceived barriers and maintenance strategies. Printed materials, visual aids and booklets with recipes were distributed. Four individually tailored letters were sent over the 6 month period. Comparison group received no intervention. Follow‐up at 8 months. | |
| Outcomes | Fruit and vegetable servings per day. | |
| Notes | ||
| Risk of bias | ||
| Bias | Authors' judgement | Support for judgement |
| Random sequence generation (selection bias) | Unclear risk | See Table 1 |
| Allocation concealment (selection bias) | Unclear risk | See Table 1 |
| Blinding of participants and personnel (performance bias) All outcomes | Unclear risk | See Table 1 |
| Blinding of outcome assessment (detection bias) All outcomes | Unclear risk | See Table 1 |
| Incomplete outcome data (attrition bias) All outcomes | Unclear risk | See Table 1 |
Hellenius 1993.
| Methods | RCT of parallel group design. | |
| Participants | Moderate/high risk ‐ total cholesterol 5.2‐7.8 mmol/L, DBP less than or equal to 100 mm Hg, fasting triglycerides less than or equal to 5.6 mmol/L, fasting blood glucose less than or equal to 6.7 mmol/L, recruited from an ongoing prevention program in Sweden. 160 men randomised, mean age 46.2 years. | |
| Interventions | Three interventions ‐ dietary advice alone, exercise alone and diet plus exercise. This review is concerned only with the dietary intervention alone (40 men randomised). Physician provided individual verbal and written information about diet in accordance with consensus documents, and participants also met with a dietitian 2 weeks later for further advice concerning low fat diets. Compliance with the intervention was checked at 3 months. The comparison group were told to continue with their lifestyle as previously. Follow‐up at 6 months. | |
| Outcomes | Total dietary fat (% Kcal), total HDL and LDL cholesterol, triglycerides, SBP, DBP. | |
| Notes | ||
| Risk of bias | ||
| Bias | Authors' judgement | Support for judgement |
| Random sequence generation (selection bias) | Unclear risk | See Table 1 |
| Allocation concealment (selection bias) | Unclear risk | See Table 1 |
| Blinding of participants and personnel (performance bias) All outcomes | Unclear risk | See Table 1 |
| Blinding of outcome assessment (detection bias) All outcomes | Unclear risk | See Table 1 |
| Incomplete outcome data (attrition bias) All outcomes | Unclear risk | See Table 1 |
Henderson WHTV 1990.
| Methods | Multicentre RCT of parallel group design. | |
| Participants | High risk ‐ women recruited from clinical units in USA at increased risk of breast cancer (one or more of the following ‐ female first or second degree relative with breast cancer, one or more benign breast biopsies, first birth after the age of 30 or nulliparous, or history of breast biopsy with atypical epithelial hyperplasia. 303 women randomised, mean age 54.8 years. | |
| Interventions | Intervention to decrease fat intake to 20% of total calories and increase complex carbohydrate intake to ensure adequate levels of vitamins and minerals. Nutritionalist led group sessions providing information and behavioural skills to make lifestyle changes. Group sessions once a week for 8 weeks, twice a month for the next 6 months and then monthly for 12 months. Individual sessions at 2 and 12 weeks. No details regarding the comparison group. Follow‐up at 2 years. | |
| Outcomes | Total dietary fat (% Kcal). | |
| Notes | ||
| Risk of bias | ||
| Bias | Authors' judgement | Support for judgement |
| Random sequence generation (selection bias) | Unclear risk | See Table 1 |
| Allocation concealment (selection bias) | Unclear risk | See Table 1 |
| Blinding of participants and personnel (performance bias) All outcomes | Unclear risk | See Table 1 |
| Blinding of outcome assessment (detection bias) All outcomes | Unclear risk | See Table 1 |
| Incomplete outcome data (attrition bias) All outcomes | Unclear risk | See Table 1 |
John 2002.
| Methods | RCT of parallel group design. | |
| Participants | Participants recruited from primary health care centres in Oxfordshire, UK. Participants aged between 25 and 64 years with no chronic diseases were eligible. Those who were pregnant or attempting to conceive or on dietary supplements were excluded. 729 participants randomised, 49% men, mean age 46 (SD 10.1) years. | |
| Interventions | Brief negotiation method to increase F&V consumption to at least 5 portions/day. A trained research nurse discussed the benefits of eating more F&V and presented a pictorial portion guide. The brief negotiation method was used to encourage participants to identify specific and practical ways consistent with their habits and preferences of eating more F&V. Participants attended the health centre for 2 appointments 6 months apart and were phoned 2 weeks after the first appointment to reinforce the message and discuss any problems. At 3 months participants were sent a letter reinforcing the 5 a day message and a booklet with seasonal recipes and strategy check list of ways to increase additional portions of F&V. Participants were given a copy of their individualised action plan, a fridge magnet with the 5 a day logo, a portion guide and a 2 week self monitoring record book. The control group were asked to continue their usual diet and received the intervention after 6 months. Follow‐up was at 6 months. | |
| Outcomes | SBP and DBP (mm Hg), plasma total cholesterol (mmol/L), plasma alpha and beta‐carotene, lutein, lycopene, beta‐cryptoxanthin, alpha and gamma‐tocopherol and ascorbic acid (all µmols/L) and F&V (servings/day). | |
| Notes | ||
| Risk of bias | ||
| Bias | Authors' judgement | Support for judgement |
| Random sequence generation (selection bias) | Unclear risk | See Table 1 |
| Allocation concealment (selection bias) | Unclear risk | See Table 1 |
| Blinding of participants and personnel (performance bias) All outcomes | Unclear risk | See Table 1 |
| Blinding of outcome assessment (detection bias) All outcomes | Unclear risk | See Table 1 |
| Incomplete outcome data (attrition bias) All outcomes | Unclear risk | See Table 1 |
Keyserling 1997.
| Methods | Cluster RCT. Data were analysed at the level of the individual, allowing for the effect of physician clusters. The denominator used in this review is the physician. | |
| Participants | 42 primary care physicians from 21 community and rural health centres in North Carolina and Virginia were randomised. High risk patients with elevated LDL cholesterol (greater than 4.1 mmol/L or between 3.4 ‐4.1 mmol/L plus 2 more risk factors or known CHD) were identified during routine appointments. The number of participants was 372, 67% were female, mean age 56 years. | |
| Interventions | Food for heart program dietary intervention administered by physicians. All underwent a 90 minute training session. The intervention included a brief dietary assessment and three 5‐10 minute dietary counselling sessions including referral to a dietitian if LDL remained elevated at 4 months, and a prompt to consider lipid lowering drugs at 7 months if LDL remained elevated still. The comparison group was usual care. Follow‐up was at 4, 7 and 12 months. Four month data were abstracted as greater than 10% of participants were taking lipid lowering medication after this time. | |
| Outcomes | Total cholesterol and LDL cholesterol. | |
| Notes | ||
| Risk of bias | ||
| Bias | Authors' judgement | Support for judgement |
| Random sequence generation (selection bias) | Unclear risk | See Table 1 |
| Allocation concealment (selection bias) | Unclear risk | See Table 1 |
| Blinding of participants and personnel (performance bias) All outcomes | Unclear risk | See Table 1 |
| Blinding of outcome assessment (detection bias) All outcomes | Unclear risk | See Table 1 |
| Incomplete outcome data (attrition bias) All outcomes | Unclear risk | See Table 1 |
Koopman 1990.
| Methods | RCT of parallel group design. | |
| Participants | High risk ‐ mild to moderate hypertension (DBP 90‐110 mm Hg on 3 separate occasions). Participants recruited from a Dutch GP surgery ‐ 35 randomised, 46% men, mean age 45 years. | |
| Interventions | Pilot intervention of intensive dietary counselling by a dietitian in general practice. Participants visited 3 times and goals were to have a daily intake of 80‐100 mmol sodium, 30 g of fibre, 10‐12% of polyunsaturated fatty acids. Comparison group told they would see the dietitian in 3 months. Follow‐up at 3 months. | |
| Outcomes | SBP, DBP, urinary sodium. | |
| Notes | ||
| Risk of bias | ||
| Bias | Authors' judgement | Support for judgement |
| Random sequence generation (selection bias) | Unclear risk | See Table 1 |
| Allocation concealment (selection bias) | Unclear risk | See Table 1 |
| Blinding of participants and personnel (performance bias) All outcomes | Unclear risk | See Table 1 |
| Blinding of outcome assessment (detection bias) All outcomes | Unclear risk | See Table 1 |
| Incomplete outcome data (attrition bias) All outcomes | Unclear risk | See Table 1 |
Kristal 2000.
| Methods | RCT of parallel group design, individual randomisation stratified by age and sex. | |
| Participants | Participants were selected at random from enrollees from an American health maintenance organisation. 1459 subjects randomised, 50% men, mean age 45.8 years. | |
| Interventions | Self‐help manual of dietary change based on social learning theory designed to promote lower fat and higher fruit and vegetable consumption. Manual included dietary information, dietary analysis with behavioural feedback. Subjects also received a motivational phone call by a trained health educator and newsletters. No details regarding the control group. Follow‐up at 12 months. | |
| Outcomes | Fruit and vegetable servings per day. | |
| Notes | ||
| Risk of bias | ||
| Bias | Authors' judgement | Support for judgement |
| Random sequence generation (selection bias) | Unclear risk | See Table 1 |
| Allocation concealment (selection bias) | Unclear risk | See Table 1 |
| Blinding of participants and personnel (performance bias) All outcomes | Unclear risk | See Table 1 |
| Blinding of outcome assessment (detection bias) All outcomes | Unclear risk | See Table 1 |
| Incomplete outcome data (attrition bias) All outcomes | Unclear risk | See Table 1 |
Lanza men 2001.
| Methods | See Schatzkin 2000 for details. | |
| Participants | See Schatzkin 2000 for details. Data in this publication are analysed separately for men and women. | |
| Interventions | See Schatzkin 2000 for details. | |
| Outcomes | Unlike Schatzkin 2000, data are reported separately for men and women. Additional outcomes reported in this publication are fruit (g/day), vegetables (g/day) and dietary intake of vitamin C (mg/day), vitamin E (mg/day) and total carotenoids (µg/day). | |
| Notes | ||
| Risk of bias | ||
| Bias | Authors' judgement | Support for judgement |
| Random sequence generation (selection bias) | Unclear risk | See Table 1 |
| Allocation concealment (selection bias) | Unclear risk | See Table 1 |
| Blinding of participants and personnel (performance bias) All outcomes | Unclear risk | See Table 1 |
| Blinding of outcome assessment (detection bias) All outcomes | Unclear risk | See Table 1 |
| Incomplete outcome data (attrition bias) All outcomes | Unclear risk | See Table 1 |
Lanza women 2001.
| Methods | See Schatzkin 2000 for details. | |
| Participants | See Schatzkin 2000 for details. Data in this publication are analysed separately for men and women. | |
| Interventions | See Schatzkin 2000 for details. | |
| Outcomes | Unlike Schatzkin 2000, data are reported separately for men and women. Additional outcomes reported in this publication are fruit (g/day), vegetables (g/day) and dietary intake of vitamin C (mg/day), vitamin E (mg/day) and total carotenoids (µg/day). | |
| Notes | ||
| Risk of bias | ||
| Bias | Authors' judgement | Support for judgement |
| Random sequence generation (selection bias) | Unclear risk | See Table 1 |
| Allocation concealment (selection bias) | Unclear risk | See Table 1 |
| Blinding of participants and personnel (performance bias) All outcomes | Unclear risk | See Table 1 |
| Blinding of outcome assessment (detection bias) All outcomes | Unclear risk | See Table 1 |
| Incomplete outcome data (attrition bias) All outcomes | Unclear risk | See Table 1 |
Little 2004.
| Methods | RCT of parallel group design (2x2x2 factorial trial). | |
| Participants | Participants were recruited during the "watchful waiting" period for hypertension from 6 clinics in Southampton, UK. Inclusion criteria were one BP reading of >160/90 and not on antihypertensive treatment. Exclusion criteria were established hypertension and participants who were very ill or less able to change diet. 33 participants randomised to the prompts plus low salt intervention, 37 to the control (no intervention). Mean age was 55 (10) years, 56% were male. | |
| Interventions | 2x2x2 factorial design: no booklet or booklet, no advice to use low salt or advice to use low salt, no use of prompts or use of healthy lifestyle prompts. We excluded the booklet intervention as it was multifactorial (advice to reduce smoking, alcohol and weight as appropriate and exercise regularly). We also excluded the healthy lifestle prompts alone as loss to follow‐up was >20% for this intervention. Our analysis focused on the prompts plus low salt intervention with no intervention as the comparison group. Participants were given a pot of low sodium salt and asked to use it in cooking and on food in place of normal salt. The healthy lifestyle prompts included a fatty food swap sheet where participants were asked to swap foods listed in one column with lower fat foods from the other column. Participants were asked to take the sheet with them when shopping and place it in a prominent postion at home such as the fridge door. Fruit, vegetable and fibre daily prompt sheets gave options to increase consumption of these. The intervention(s) were administered by research nurses in GP surgeries. Interventions were reinforced at 4 weeks and 6 months. Control participants received no intervention. Follow‐up was at 6 months. | |
| Outcomes | SBP and DBP (mm Hg), Total cholesterol, LDL cholesterol and HDL cholesterol (mmol/L), total plasma carotenoids (mmol/L ‐ converted to µmol/L) and % energy from fat. | |
| Notes | F&V (g/day) were also measured in this trial, but we were unable to verify the data with the authors and have therefore excluded this outcome. | |
| Risk of bias | ||
| Bias | Authors' judgement | Support for judgement |
| Random sequence generation (selection bias) | Unclear risk | See Table 1 |
| Allocation concealment (selection bias) | Unclear risk | See Table 1 |
| Blinding of participants and personnel (performance bias) All outcomes | Unclear risk | See Table 1 |
| Blinding of outcome assessment (detection bias) All outcomes | Unclear risk | See Table 1 |
| Incomplete outcome data (attrition bias) All outcomes | Unclear risk | See Table 1 |
Lutz non‐tailored.
| Methods | RCT of parallel group design. The control group N is divided by 3 to take account of the 3 intervention arms. | |
| Participants | Healthy adults recruited from subscribers to an American health maintenance organisation. 710 participants randomised, 35.6% men, mean age 39.3 years. | |
| Interventions | Three interventions to increase fruit and vegetable consumption. The 3 interventions were non‐tailored newsletters, computer tailored newsletters taking into consideration individual baseline survey dietary information, and tailored newsletters with goal setting ‐ to increase fruit and vegetable consumption to 5 or more servings per day. The control group did not receive a newsletter. Newsletters were posted each month for 4 months to participants in the intervention groups. Follow‐up was at 6 months. | |
| Outcomes | Fruit and vegetable servings per day. | |
| Notes | ||
| Risk of bias | ||
| Bias | Authors' judgement | Support for judgement |
| Random sequence generation (selection bias) | Unclear risk | See Table 1 |
| Allocation concealment (selection bias) | Unclear risk | See Table 1 |
| Blinding of participants and personnel (performance bias) All outcomes | Unclear risk | See Table 1 |
| Blinding of outcome assessment (detection bias) All outcomes | Unclear risk | See Table 1 |
| Incomplete outcome data (attrition bias) All outcomes | Unclear risk | See Table 1 |
Lutz tailored&goals.
| Methods | RCT of parallel group design. The control group N is divided by 3 to take account of the 3 intervention arms. | |
| Participants | Healthy adults recruited from subscribers to a health maintenance organisation. 710 participants randomised, 35.6% men, mean age 39.3 years. | |
| Interventions | See 'Lutz non‐tailored' for details of intervention. Follow‐up was at 6 months. | |
| Outcomes | Fruit and vegetable servings per day. | |
| Notes | ||
| Risk of bias | ||
| Bias | Authors' judgement | Support for judgement |
| Random sequence generation (selection bias) | Unclear risk | See Table 1 |
| Allocation concealment (selection bias) | Unclear risk | See Table 1 |
| Blinding of participants and personnel (performance bias) All outcomes | Unclear risk | See Table 1 |
| Blinding of outcome assessment (detection bias) All outcomes | Unclear risk | See Table 1 |
| Incomplete outcome data (attrition bias) All outcomes | Unclear risk | See Table 1 |
Lutz tailored 1999.
| Methods | RCT of parallel group design. The control group N is divided by 3 to take account of the 3 intervention arms. | |
| Participants | Healthy adults recruited from subscribers to a health maintenance organisation. 710 participants randomised, 35.6% men, mean age 39.3 years. | |
| Interventions | See 'Lutz non‐tailored' for details of intervention. Follow‐up was at 6 months. | |
| Outcomes | Fruit and vegetable servings per day. | |
| Notes | ||
| Risk of bias | ||
| Bias | Authors' judgement | Support for judgement |
| Random sequence generation (selection bias) | Unclear risk | See Table 1 |
| Allocation concealment (selection bias) | Unclear risk | See Table 1 |
| Blinding of participants and personnel (performance bias) All outcomes | Unclear risk | See Table 1 |
| Blinding of outcome assessment (detection bias) All outcomes | Unclear risk | See Table 1 |
| Incomplete outcome data (attrition bias) All outcomes | Unclear risk | See Table 1 |
Maskarinec 1999.
| Methods | RCT of parallel group design. | |
| Participants | High risk ‐ at increased risk of breast cancer (greater than 50% mammographic densities) and less than 5‐a‐day. 33 women randomised, mean age 48.9 years, mostly of Asian decent. Based in Hawaii. | |
| Interventions | Individualised dietary counselling program with dietitian ‐ goal to incorporate 9 servings of fruit and vegetables in daily diet. Group meetings monthly for 6 months for cooking instructions and demonstrations. Participants logged their daily intake of fruit and vegetables. The comparison group received nutritional counselling on how to maintain a healthy diet. Follow‐up at 6 months. | |
| Outcomes | Total dietary fat (%Kcal), total cholesterol, fruit and vegetable servings per day, beta‐carotene. | |
| Notes | ||
| Risk of bias | ||
| Bias | Authors' judgement | Support for judgement |
| Random sequence generation (selection bias) | Unclear risk | See Table 1 |
| Allocation concealment (selection bias) | Unclear risk | See Table 1 |
| Blinding of participants and personnel (performance bias) All outcomes | Unclear risk | See Table 1 |
| Blinding of outcome assessment (detection bias) All outcomes | Unclear risk | See Table 1 |
| Incomplete outcome data (attrition bias) All outcomes | Unclear risk | See Table 1 |
Moy 2001.
| Methods | RCT of parallel group design. Randomisation was by family. | |
| Participants | Healthy 30‐59 year old brothers and sisters of patients with documented CHD diagnosed before the age of 60. Siblings with at least one of the following risk factors were eligible: LDL cholesterol ≥3.4 mmol/L, BP ≥140/90 mm Hg or current use of antihypertensives or current smoking. 235 individuals were randomised, 52% men, mean age 46 (SD 7) years. This study was based in the USA. | |
| Interventions | Intervention focused primarily on decreasing total fat consumption and daily monitoring. Nurse counselling followed the National Cholesterol Education Programme Adult Treatment Panel II Guidelines which recommend dietary intervention as the first line approach in the treatment of hypercholesterolaemia. Participants were seen individually and with family members every 6‐8 weeks by trained nurse counsellors (approximately 40 hours training by PI and dietician). Participants were given a "fat allowance" based on intake at baseline, current lifestyle and willingness to change. Participants were taught how to read food labels and use a fat counter to monitor and record total daily fat intake and negotiated their fat intake up or down with the nurse in counselling sessions. Physicians of siblings in the intervention group were asked explicitly not to manage dietary interventions. Participants in the usual care group were referred to physicians for dietary management. Physicians received specific detailed recommendations for risk factor management at baseline, 1 year and 2 years. Follow‐up was at 2 years. | |
| Outcomes | Plasma total cholesterol, LDL and HDL cholesterol and triglycerides (mmol/L), %Kcal from total fat and % Kcal from saturated fat. | |
| Notes | ||
| Risk of bias | ||
| Bias | Authors' judgement | Support for judgement |
| Random sequence generation (selection bias) | Unclear risk | See Table 1 |
| Allocation concealment (selection bias) | Unclear risk | See Table 1 |
| Blinding of participants and personnel (performance bias) All outcomes | Unclear risk | See Table 1 |
| Blinding of outcome assessment (detection bias) All outcomes | Unclear risk | See Table 1 |
| Incomplete outcome data (attrition bias) All outcomes | Unclear risk | See Table 1 |
Neil dietitian1995.
| Methods | RCT of parallel group design. The control group N is halved to take account of the two intervention arms. | |
| Participants | High risk ‐ total cholesterol 6 ‐ 8.5 mmol/L on repeat screening at a general practice in Oxfordshire. 309 subjects randomised, 53% men, median age 55 years. | |
| Interventions | Three interventions all containing advice to decrease total daily fat consumption to 30% or less. Participants were either randomised to receive advice from a dietitian or a nurse or to receive a leaflet containing dietary information by post. Those randomised to see the dietitian received an individual appointment of 30 minutes to discuss dietary habits and weight and offer advice to decrease fat consumption. At 8 weeks participants had a further 10 minute appointment. Those randomised to see the nurse also had an individual 30 minute appointment using a structure food frequency questionnaire and offered similar advice to the dietitian with a further 10 minute appointment at 8 weeks. The comparison group to these 2 interventions was the leaflet. Follow‐up was at 6 months. | |
| Outcomes | Total cholesterol, HDL and LDL cholesterol. | |
| Notes | ||
| Risk of bias | ||
| Bias | Authors' judgement | Support for judgement |
| Random sequence generation (selection bias) | Unclear risk | See Table 1 |
| Allocation concealment (selection bias) | Unclear risk | See Table 1 |
| Blinding of participants and personnel (performance bias) All outcomes | Unclear risk | See Table 1 |
| Blinding of outcome assessment (detection bias) All outcomes | Unclear risk | See Table 1 |
| Incomplete outcome data (attrition bias) All outcomes | Unclear risk | See Table 1 |
Neil nurse 1995.
| Methods | RCT of parallel group design. The control group N is halved to take account of the two intervention arms. | |
| Participants | High risk ‐ total cholesterol 6 ‐ 8.5 mmol/L on repeat screening at a general practice in Oxfordshire. 309 subjects randomised, 53% men, median age 55 years. | |
| Interventions | See 'Neil 1995 dietitian' for details of intervention. Follow‐up was at 6 months. | |
| Outcomes | Total cholesterol, HDL and LDL cholesterol. | |
| Notes | ||
| Risk of bias | ||
| Bias | Authors' judgement | Support for judgement |
| Random sequence generation (selection bias) | Unclear risk | See Table 1 |
| Allocation concealment (selection bias) | Unclear risk | See Table 1 |
| Blinding of participants and personnel (performance bias) All outcomes | Unclear risk | See Table 1 |
| Blinding of outcome assessment (detection bias) All outcomes | Unclear risk | See Table 1 |
| Incomplete outcome data (attrition bias) All outcomes | Unclear risk | See Table 1 |
Riddell 2000.
| Methods | RCT of parallel group design, individual randomisation stratified by sex. | |
| Participants | High risk ‐ men and women with elevated plasma total homocysteine (greater than or equal to 9 micromol/L). Sixty six subjects randomised aged 36‐71 years (61% men) recruited from advertisements in local newspapers. Fifteen subjects were randomised to the intervention of interest to this review ‐ increasing the consumption of folate rich foods, and 15 to the control group. Based in New Zealand. | |
| Interventions | Three interventions for decreasing homocysteine levels by increasing intake of folic acid ‐ the first was supplementation, the second was consumption of fortified breakfast cereals and the third was increased consumption of folate rich foods. This review is concerned only with the third intervention. Subjects were asked to increase their intake of folate rich foods to 600 micrograms per day. Subjects were provided with a list of folate rich foods and were given detailed dietary information by a dietitian at recruitment and randomisation and reinforced advice by fortnightly phone calls. Additional encouragement was given by phone when required. The control group continued to follow a fat modified diet which was also used as a run in before randomisation in the intervention groups. The intervention lasted for 12 weeks and follow‐up was 12 weeks. | |
| Outcomes | Red cell folate, serum folate, total homocysteine, dietary folate and dietary fibre. | |
| Notes | ||
| Risk of bias | ||
| Bias | Authors' judgement | Support for judgement |
| Random sequence generation (selection bias) | Unclear risk | See Table 1 |
| Allocation concealment (selection bias) | Unclear risk | See Table 1 |
| Blinding of participants and personnel (performance bias) All outcomes | Unclear risk | See Table 1 |
| Blinding of outcome assessment (detection bias) All outcomes | Unclear risk | See Table 1 |
| Incomplete outcome data (attrition bias) All outcomes | Unclear risk | See Table 1 |
Rock 2001.
| Methods | RCT of parallel group design. | |
| Participants | Premenopausal women with cervical intraepithelial neoplasia (a precancerous condition) recruited from primary care and gynecology medical practices in the USA. Women who were pregnant, lactating, were post menopausal, had a previous history of cancer or a current diagnosis of any malignancies were excluded. 56 women were randomised with a mean age of 27.8 (SD 6) years. | |
| Interventions | Aim was to increase F&V consumption to 8‐10 servings/day. Specific strategies and food choices were identified and targeted through individualised counselling and guidance utilising a self management approach based on social cognitive behavioural theories. A dietician administered the intervention where counselling was by phone or internet with a minimum of weekly contact or more frequent if problems arose. The counselling protocol was supplemented by monthly newsletters and incentives to promote retention. The control group were provided with newsletters and incentives of a more general nature without specific nutrition information or dietray guidance. Follow‐up was at 12 months but data are presented only for 6 months follow‐up. | |
| Outcomes | Plasma alpha and beta‐carotene, beta‐cryptoxanthin, leutin, lycopene and total carotenoids (micrmol/L). F&V servings/day. | |
| Notes | Table 1 in the paper provides dietary intake of micronutrients also but these are expressed only as medians and ranges. Contact authors to see if these data are available as means and SDs ‐ for a future update. | |
| Risk of bias | ||
| Bias | Authors' judgement | Support for judgement |
| Random sequence generation (selection bias) | Unclear risk | See Table 1 |
| Allocation concealment (selection bias) | Unclear risk | See Table 1 |
| Blinding of participants and personnel (performance bias) All outcomes | Unclear risk | See Table 1 |
| Blinding of outcome assessment (detection bias) All outcomes | Unclear risk | See Table 1 |
| Incomplete outcome data (attrition bias) All outcomes | Unclear risk | See Table 1 |
Sacerdote 2006.
| Methods | RCT of parallel group design. | |
| Participants | Healthy 18‐65 year olds recruited from GP clinics in Italy. Inclusion criteria were BMI<30 and no chronic or severe diseases. Those visiting the GP for GI complaint or with dietary restrictions were excluded. 3179 participants randomised (1592 intervention, 1587 control), mean age 44.5 (12.4) years, 50% male. | |
| Interventions | Personalised nutritional education intervention administered by a GP using a brochure based on Italian guidelines for correct nutrition, 1998. Intervention focused on the importance of increasing consumption of F&V (goal >5/day), fish (goal >1/week) and olive oil (goal ‐ use in place of other fats) and decreasing meat (goal <3/week), snacks and sweets. Participants randomised to the intervention visited the GP surgery 3 times over the 12 month intervention period ‐ interviews lasted 15 minutes each. Control participants recieved a "sham" intervention where they met the GP for a simpler non‐personalised conversation without the use of the brochure. Each GP took part in a 4 day training course on nutrition carried out by clinical nutritionalists. Follow‐up was at 12 months. | |
| Outcomes | SBP and DBP (mm Hg) and fruit and vegetable servings/week (converted to servings/day). | |
| Notes | ||
| Risk of bias | ||
| Bias | Authors' judgement | Support for judgement |
| Random sequence generation (selection bias) | Unclear risk | See Table 1 |
| Allocation concealment (selection bias) | Unclear risk | See Table 1 |
| Blinding of participants and personnel (performance bias) All outcomes | Unclear risk | See Table 1 |
| Blinding of outcome assessment (detection bias) All outcomes | Unclear risk | See Table 1 |
| Incomplete outcome data (attrition bias) All outcomes | Unclear risk | See Table 1 |
Schatzkin 2000.
| Methods | RCT of parallel group design. | |
| Participants | High risk ‐ one or more colorectal adenomas removed within 6 months before recruitment. Referrals from endoscopists. 2079 randomised, 64.5% men, mean age 61 years. American multicentre study. | |
| Interventions | Intensive counselling to follow a low fat (less than 20% calories), high fibre (18 g/1000 cals) diet and to increase fruit and vegetable consumption to 3.5 servings /1000 cals. Nutritional information and behavioural modification techniques. More than 50 hours counselling sessions over 4 years. Comparison group were given a standard brochure on healthy eating. Follow‐up at 4 years. | |
| Outcomes | Total dietary fat (% Kcals), dietary fibre, fruit and vegetable servings per day. | |
| Notes | ||
| Risk of bias | ||
| Bias | Authors' judgement | Support for judgement |
| Random sequence generation (selection bias) | Unclear risk | See Table 1 |
| Allocation concealment (selection bias) | Unclear risk | See Table 1 |
| Blinding of participants and personnel (performance bias) All outcomes | Unclear risk | See Table 1 |
| Blinding of outcome assessment (detection bias) All outcomes | Unclear risk | See Table 1 |
| Incomplete outcome data (attrition bias) All outcomes | Unclear risk | See Table 1 |
Silman 1983.
| Methods | RCT of parallel group design. | |
| Participants | Participants had persistent untreated hypertension for at least 13 months prior to the trial where DBP was between 95 and 104 mm Hg. Participants between the age of 50‐64 years were recruited from 2 GP surgeries in East London, 28 were randomised, 12 to the intervention and 16 to the control group. | |
| Interventions | The intervention group received general health education plus specific advice to reduce salt intake. The diet was developed to produce a daily intake of 100mMol sodium which had been previously tested on a group of laundry workers in East London. The aim was to produce a diet appropriate to the population of East London with specific advice given on sandwich fillings and other foods consumed during working hours. Advice was given at GP surgeries. General health education advice included quitting smoking, reducing stress and the need for regular exercise. The comparison group received general health education only. Follow up was at 1,2,3,6 and 12 months. | |
| Outcomes | SBP, DBP | |
| Notes | The study also examined the effects of the intervention on urinary sodium and potassium but the loss to follow‐up was too high for these outcomes and so the data is not used. | |
| Risk of bias | ||
| Bias | Authors' judgement | Support for judgement |
| Random sequence generation (selection bias) | Unclear risk | No details |
| Allocation concealment (selection bias) | Unclear risk | No details |
| Blinding of participants and personnel (performance bias) All outcomes | Unclear risk | No details |
| Blinding of outcome assessment (detection bias) All outcomes | Unclear risk | No details |
| Incomplete outcome data (attrition bias) All outcomes | Unclear risk | 16.6% in the intervention group and 6.3% in the control group were lost to follow‐up for the outcome BP over 12 months. The authors state that there were different non‐attenders at the various visits so they checked baseline values for attenders and non‐attenders at each visit. |
| Selective reporting (reporting bias) | Unclear risk | All expected outcomes reported. |
| Other bias | Unclear risk | Insufficient information to judge. |
Smith‐Warner 2000.
| Methods | RCT of parallel group design, individual randomisation stratified by sex. | |
| Participants | High risk ‐ men and women with recent history (previous 5 years) of colorectal adenomas recruited from a gastroenterology clinic in Minnesota. 201 participants randomised, 71% men, mean age 59.3 years. | |
| Interventions | Participants were asked to increase fruit and vegetable consumption to at least 8 servings per day. Clinic visits at 3, 6, 9 and 12 months to reinforce this plus 4 additional individual diet intervention appointments. Intervention used behaviour modification strategies derived from social learning theory and nutritional counselling focused on goal setting. The control group continued their usual diet and were seen at 3, 6, 9 and 12 month clinic visits. Follow‐up at 12 months. | |
| Outcomes | Fruit and vegetable servings per day. | |
| Notes | ||
| Risk of bias | ||
| Bias | Authors' judgement | Support for judgement |
| Random sequence generation (selection bias) | Unclear risk | See Table 1 |
| Allocation concealment (selection bias) | Unclear risk | See Table 1 |
| Blinding of participants and personnel (performance bias) All outcomes | Unclear risk | See Table 1 |
| Blinding of outcome assessment (detection bias) All outcomes | Unclear risk | See Table 1 |
| Incomplete outcome data (attrition bias) All outcomes | Unclear risk | See Table 1 |
Sorensen work+family.
| Methods | Cluster RCT. Data were analysed at the level of the individual, allowing for clustering within worksites. The denominator used in this review is the worksite. The control group N is halved to take account of the two intervention arms. | |
| Participants | 22 worksites in USA randomised including 1359 employees at community health centres. 84% women, participants described as healthy and from racially and ethnically diverse backgrounds. No details regarding age. | |
| Interventions | Two interventions to increase fruit and vegetable consumption ‐ one based at the worksite only, where workers participated in program planning whose aims were to change individual behaviour and make changes in the worksite environment. The other intervention included the worksite intervention plus a family intervention involving a written learn at home program, an annual newsletter, annual family festival and periodic mailings. The comparison group received a minimal intervention comprising exposure to national media campaigns and a 1 hour general nutrition presentation. This minimal intervention was received also by both intervention groups. Follow‐up was at 19.5 months. | |
| Outcomes | Fruit and vegetable servings per day. | |
| Notes | ||
| Risk of bias | ||
| Bias | Authors' judgement | Support for judgement |
| Random sequence generation (selection bias) | Unclear risk | See Table 1 |
| Allocation concealment (selection bias) | Unclear risk | See Table 1 |
| Blinding of participants and personnel (performance bias) All outcomes | Unclear risk | See Table 1 |
| Blinding of outcome assessment (detection bias) All outcomes | Unclear risk | See Table 1 |
| Incomplete outcome data (attrition bias) All outcomes | Unclear risk | See Table 1 |
Sorensen worksite.
| Methods | Cluster RCT. Data were analysed at the level of the individual, allowing for clustering within worksites. The denominator used in this review is the worksite. The control group N is halved to take account of the two intervention arms. | |
| Participants | 22 worksites in USA randomised including 1359 employees at community health centres. 84% women, participants described as healthy and from racially and ethnically diverse backgrounds. No details regarding age. | |
| Interventions | See ''Sorensen work+family' for details of intervention. Follow‐up was at 19.5 months. | |
| Outcomes | Fruit and vegetable servings per day. | |
| Notes | ||
| Risk of bias | ||
| Bias | Authors' judgement | Support for judgement |
| Random sequence generation (selection bias) | Unclear risk | See Table 1 |
| Allocation concealment (selection bias) | Unclear risk | See Table 1 |
| Blinding of participants and personnel (performance bias) All outcomes | Unclear risk | See Table 1 |
| Blinding of outcome assessment (detection bias) All outcomes | Unclear risk | See Table 1 |
| Incomplete outcome data (attrition bias) All outcomes | Unclear risk | See Table 1 |
Stevens 2003.
| Methods | RCT of parallel group design. | |
| Participants | Healthy women ‐ members of a HMO in Oregon, USA. Women aged 40‐70 (mean 53.8) years who had a negative result on a recent screening mammogram. Women were only included if their total cholesterol level was 5.2mmol/L or greater (authors chose the top half of the cholesterol distribution to increase the probability of detecting dietary change), and were willing to change dietary patterns and were willing to consider regular breast self‐exam (control condition ‐ recruitment emphasised cancer prevention and control). Women were excluded if they were taking statins or had treatment for cancer in the previous year. 616 women were randomised (308 intervention, 308 control). | |
| Interventions | The dietary intervention combined strategies from motivational interviewing, problem solving and social cognitive theory. Experienced masters degree level counsellors provided individual counselling based in a research clinic. The first individual counselling session (45 mins) focused on decreasing fat and increasing fruit and vegetables and wholegrains. Participants were provided feedback from a baseline questionnaire and asked to select one of two goals (decreasing fat or increasing fruit and vegetables). The second counselling session (45 mins) 2‐3 weeks later focused on the goal participants had not chosen at the first session. Telephone support was given 2‐3 weeks after the second session and again 2‐3 weeks later (5‐10 mins each). Participants randomised to the control arm received an intervention focused on breast self examination where individuals received one counselling session and 2 follow‐up phone calls but no dietary recommendations. Follow‐up was at 12 months. | |
| Outcomes | Total cholesterol (mg/dL converted to mmol/L), % energy from fat and F&V (servings/day). | |
| Notes | ||
| Risk of bias | ||
| Bias | Authors' judgement | Support for judgement |
| Random sequence generation (selection bias) | Unclear risk | See Table 1 |
| Allocation concealment (selection bias) | Unclear risk | See Table 1 |
| Blinding of participants and personnel (performance bias) All outcomes | Unclear risk | See Table 1 |
| Blinding of outcome assessment (detection bias) All outcomes | Unclear risk | See Table 1 |
| Incomplete outcome data (attrition bias) All outcomes | Unclear risk | See Table 1 |
Takahashi 2006.
| Methods | RCT of cross‐over design but data analysed and presented as a parallel group design at time of cross‐over at 12 months. | |
| Participants | Participants from 2 rural villages in Japan recruited through public magazines and posters. Individuals were eligible if they were aged between 40 and 69 and had physician permission to participate if under medical treatment or dietary control. 550 participants randomised, 32% men, mean age 56 years. Of the participants in the control group at baseline, 9.6% had hypertension, 2.9% had diabetes and 9.6% had hyperlipidaemia. | |
| Interventions | Tailored dietary intervention to encourage a decrease in sodium intake and an increase in vitamin C and carotene intake via increasing F&V consumption. Dietary goals were to decrease salt to less than 8 and 10g/day in women and men respectively and increase carotene intake to more than 5000 µg/day and vitamin C intake to more than 200mg/day. The intervention consisted of 2 individualised dietary counselling sessions at baseline and 5 months (15 minutes each), a group lecture half‐way through the intervention, and 2 newsletters. Control subjects recieved the intervention at 12 months (cross‐over period). Follow‐up data were presented at 12 months. | |
| Outcomes | SBP and DBP (mmHg), fruit and vegetable intake (g/day converted to servings/day using a typical 80g serving), dietary fibre (g/day), dietary intake of vitamin C (mg/day), alpha and beta‐carotene (µg/day). | |
| Notes | ||
| Risk of bias | ||
| Bias | Authors' judgement | Support for judgement |
| Random sequence generation (selection bias) | Unclear risk | See Table 1 |
| Allocation concealment (selection bias) | Unclear risk | See Table 1 |
| Blinding of participants and personnel (performance bias) All outcomes | Unclear risk | See Table 1 |
| Blinding of outcome assessment (detection bias) All outcomes | Unclear risk | See Table 1 |
| Incomplete outcome data (attrition bias) All outcomes | Unclear risk | See Table 1 |
Tilley 1999.
| Methods | Cluster RCT. Data were analysed at the level of the individual, allowing for difference in covariates between control and treatment worksites. The denominator used in this review is the worksite. | |
| Participants | 28 car industry worksites in USA randomised. 5042 automobile employees believed to be at increased risk of colorectal cancer. 96% men, mean age 55.5 years. | |
| Interventions | Screening programme for colorectal cancer plus nutritional intervention and educational booklet. Nutritional intervention included worksite classes encouraging increased fruit and vegetable and fibre and reduced fat consumption, self help materials and feedback from food frequency questionnaires. Newsletters were mailed quarterly. The intervention was repeated in year 2 of the trial. The control group received the screening program only. Follow‐up at 12 months and 2 years. 2 year follow‐up was used in the analysis. | |
| Outcomes | Total dietary fat (% Kcal), fruit and vegetable servings per day. | |
| Notes | ||
| Risk of bias | ||
| Bias | Authors' judgement | Support for judgement |
| Random sequence generation (selection bias) | Unclear risk | See Table 1 |
| Allocation concealment (selection bias) | Unclear risk | See Table 1 |
| Blinding of participants and personnel (performance bias) All outcomes | Unclear risk | See Table 1 |
| Blinding of outcome assessment (detection bias) All outcomes | Unclear risk | See Table 1 |
| Incomplete outcome data (attrition bias) All outcomes | Unclear risk | See Table 1 |
TOHP I.
| Methods | Multicentre RCT of parallel group design. | |
| Participants | High risk ‐ DBP 80‐89 mmHg not on antihypertensive medication recruited from 10 medical centres in the USA. 2182 participants randomised overall, 744 to the sodium reduction trial. 71.3% were men, age range 30‐54 years. | |
| Interventions | Several non‐pharmacological interventions aimed at reducing blood pressure. This review is concerned only with the intervention to reduce sodium. Intervention administered by trained professionals and involved participant education and motivation, skills to change behaviour, goal setting and problem solving. The objective was to decrease urinary sodium to less than 80 mmol/24 hours. The intervention included 8 group and 2 individual sessions in the first 3 months with less frequent counselling thereafter but a minimum contact of 1 individual meeting every 2 months. No details given regarding the comparison group. Follow‐up at 6, 12 and 18 months. Data abstracted for 12 months for urinary sodium and 18 months for blood pressure. | |
| Outcomes | SBP, DBP, urinary sodium, clinical events from long‐term follow‐up at 10‐15 years (Cook 2007). | |
| Notes | ||
| Risk of bias | ||
| Bias | Authors' judgement | Support for judgement |
| Random sequence generation (selection bias) | Unclear risk | See Table 1 |
| Allocation concealment (selection bias) | Unclear risk | See Table 1 |
| Blinding of participants and personnel (performance bias) All outcomes | Unclear risk | See Table 1 |
| Blinding of outcome assessment (detection bias) All outcomes | Unclear risk | See Table 1 |
| Incomplete outcome data (attrition bias) All outcomes | Unclear risk | See Table 1 |
TOHP II.
| Methods | Multicentre RCT of parallel group design. | |
| Participants | High risk ‐ moderately overweight with high normal DBP ‐ 83‐89 mm Hg recruited from 9 medical centres in the USA. 2382 participants randomised, 66.6% men, mean age 43.7 years. | |
| Interventions | Two interventions ‐ one to promote weight loss, the other to reduce sodium intake. This review is concerned only with the latter. Goal was to reduce sodium intake to 80 mmol/day. Group sessions and counselling weekly for 10 weeks, then 4 monthly sessions followed by 1 or 2 monthly contacts and refresher sessions offered. Sessions provided core knowledge and behavioural skills to reduce sodium intake. Intervention administered by trained dietitians, psychologists and health counsellors. Comparison group received no active intervention. Follow‐up was at 6, 18 and 36 months. The 3 year follow‐up was used in the analysis. | |
| Outcomes | SBP, DBP, urinary sodium, clinical events from long‐term follow‐up at 10‐15 years (Cook 2007). | |
| Notes | ||
| Risk of bias | ||
| Bias | Authors' judgement | Support for judgement |
| Random sequence generation (selection bias) | Unclear risk | See Table 1 |
| Allocation concealment (selection bias) | Unclear risk | See Table 1 |
| Blinding of participants and personnel (performance bias) All outcomes | Unclear risk | See Table 1 |
| Blinding of outcome assessment (detection bias) All outcomes | Unclear risk | See Table 1 |
| Incomplete outcome data (attrition bias) All outcomes | Unclear risk | See Table 1 |
van der Veen 2002.
| Methods | Cluster RCT. Data were analysed at the level of the individual, allowing for clustering within GP practices. The denominator used in this review is the GP practice. | |
| Participants | Participants at elevated risk of CVD recruited from 9 GP practices joining the Nijmegen Monitoring Project, University Medical Centre St Radboud, Netherlands. Eligibility criteria included a dietary fat intake of >37% or saturated fat intake of >12%, hypertension, diabetes, total cholesterol ≥6.2mmol/L but no manifest CVD. 89% of control participants had hypertension at baseline, and 7% had diabetes. The 9 GP practices included 143 individuals, 26.5% men, mean age 58 years. | |
| Interventions | Stage matched nutrition counselling performed by GPs with selective referral to dieticians if patients reached the action stage (stages of change model). In precontemplation counselling is aimed at raising consiousness about dietary behaviour and on motivation to change dietary behaviour in the contemplation stage. Individuals met with the GP on 3 occasions 2 weeks apart for approximately 10 minutes. If participants reached the action stage and were referred to the dietician there were 3 appointments ‐ the first was 30‐40 minutes, the other 2 were 10‐15 minutes, appointments were 2‐8 weeks apart. Counselling focused on decreasing saturated fat intake and was tailored to the individual. Participants in the control group received usual care. Follow‐up was at 12 months. | |
| Outcomes | Plasma total cholesterol (mg/dl converted to mmol/l), total fat %Kcal and saturated fat %Kcal. | |
| Notes | ||
| Risk of bias | ||
| Bias | Authors' judgement | Support for judgement |
| Random sequence generation (selection bias) | Unclear risk | See Table 1 |
| Allocation concealment (selection bias) | Unclear risk | See Table 1 |
| Blinding of participants and personnel (performance bias) All outcomes | Unclear risk | See Table 1 |
| Blinding of outcome assessment (detection bias) All outcomes | Unclear risk | See Table 1 |
| Incomplete outcome data (attrition bias) All outcomes | Unclear risk | See Table 1 |
F&V = fruit and vegetables
Characteristics of excluded studies [ordered by study ID]
| Study | Reason for exclusion |
|---|---|
| Anderson 2001 | Greater than 20% of participants were lost to follow‐up. |
| Appel 2001 | Greater than 10% of participants were taking antihypertensive drugs during the course of the trial. |
| Bhargava 2004 | Greater than 20% of participants were lost to follow‐up. |
| Boyd 1990 | Outcomes are reported in only 70% of those participants randomised. |
| Braeckman 1999 | Additional data were provided by the authors to allow analysis in meta‐view but unfortunately the numbers of participants followed up for the outcomes of interest were poor at approximately 60% of those randomised. |
| Burke 2005 | Greater than 25% of participants had a history of CVD. |
| Cappuccio 2006 | Control group did not receive minimal intervention or no intervention. |
| Chalmers 1986 | Data available in the published report could not be used as the baseline data and changes in DBP with the intervention relative to baseline were missing. The authors were contacted, but unfortunately these data could not be retrieved given the age of this study. |
| Colombo 2005 | Control group did not receive minimal intervention or no intervention. |
| Djuric 2009 | Differential loss to follow‐up of 23% in the intervention group. |
| Due 2008 | Control group did not receive minimal intervention or no intervention. |
| Eid 2006 | Greater than 25% of participants had verified CVD at baseline. |
| Estruch 2006 | Greater than 50% of participants had type‐2 diabetes at baseline. |
| Fehily 1983 | Data available in the published report could not be used as the baseline data and changes in total, HDL and LDL cholesterol with the intervention relative to baseline were missing. This additional data was requested from the authors but there was no response after several attempts to contact them. |
| Fitzgibbon 2004 | Greater than 20% of participants were lost to follow‐up. |
| Fries 2005 | Greater than 20% of participants were lost to follow‐up. |
| Havas 2003 | 20% of participants were pregnant during the trial. Pregnancy was an exclusion criteria. |
| Hellenius 1997 | Longer‐term follow‐up of Hellenius 1993 which is included in the review. These data are excluded as further advice is given in both the intervention and control group at 6 months if participants still had raised CVD risk factors, 10/40 in the intervention group and 15/39 in the control group. Follow‐up at 18 months is therefore not used and the 6 month follow‐up data (Hellenius 1993) is included in the review. |
| Henkin 2000 | RCT of effect of dietitian advice over and above physician advice. Control group did not receive minimal intervention or no intervention. |
| HPTR 1990 | Data available in the published report could not be used as the variance at baseline for SBP, DBP and urinary sodium was missing. This additional data was requested from the authors but there was no response after several attempts to contact them. |
| Hunt 2001 | Data available in the published report on F&V could not be used as the variance at baseline and follow‐up were missing. Authors were contacted but they were unable to provide missing data. |
| Hyman 1998 | Data available in the published report on total cholesterol could not be used as the variance at follow‐up was missing. Authors were contacted but they were unable to provide missing data. |
| Iso 2002 | Control group did not receive minimal intervention or no intervention. |
| Korhonen 2003 | RCT of weight loss, alcohol reduction and exercise. |
| Larsen 2010 | Greater than 20% of participants were lost to follow‐up and the ITT analysis was for the weight loss outcome only. |
| Leduc 1994 | Study published in abstract form only. No information regarding the participation rate or nature of the intervention. We were unable to contact the authors for further information. |
| Marcus 2001 | Greater than 20% of participants were lost to follow‐up. |
| Martin 2006 | Greater than 20% of participants were lost to follow‐up. |
| Ni Mhurchu 1998 | Greater than 20% of participants were lost to follow‐up. |
| Ockene 1999 | Variance of outcome variables not available at follow‐up. More than 10% of the control group were taking lipid lowering medication during the trial. |
| Resnicow 2001 | Data available in the published report on F&V consumption could not be used as the variance at baseline and follow‐up and the number of individuals available at follow‐up were missing. Authors were contacted but they were unable to provide missing data. |
| Richards 2006 | Greater than 20% of participants were lost to follow‐up. |
| Sartorelli 2005 | Intervention included advice to increase exercise (multifactorial intervention). The exercise advice tended to increase walking for 30min/day (42% intervention group versus 24% control group, P=0.15 at 1 year). |
| Simon 1997 | Greater than 20% of participants were lost to follow‐up. |
| Smith 1997 | Data available in the published report on dietary fat as a percentage of energy could not be used as there were missing variances at baseline and follow‐up. Authors were contacted but they were unable to provide missing data. |
| Sorensen 1992 | Data available in the published report on dietary fat as a percentage of energy and dietary fibre could not be used as there were missing variances at baseline and follow‐up. Authors were contacted but they were unable to provide missing data due to the age of the study. |
| Torjesen 1997 | Participants were selected to be overweight or obese, and the primary aim of the trial was weight loss. |
| WHI 2006 | There was extensive use of medications during the trial. Greater than 10% were on statins (11.8% in the intervention arm, 12.1% in the control arm), and antihypertensive medication (42.5% in the intervention group, 43.2% in the control group). |
| Willaing 2004 | Control group did not receive minimal intervention or no intervention. |
| Williams‐Piehota | Greater than 20% of participants were lost to follow‐up. |
Contributions of authors
Eric Brunner, Margaret Thorogood and Karen Rees wrote the original review.
For the 2007 update:
Karen Rees screened titles and abstracts, selected studies, abstracted data, analysed the data and co‐wrote the review;
Kirsten Ward selected studies and abstracted data;
Eric Brunner selected studies, gave advice and co‐wrote the review.
For the 2010 update:
Karen Rees selected studies, abstracted data, analysed the data and co‐wrote the review;
Mariana Dyokova selected studies and abstracted data;
Nicola Wilson screened titles and abstracts;
Eric Brunner gave advice and co‐wrote the review;
Margaret Thorogood co‐wrote the review.
Sources of support
Internal sources
Department of Epidemiology and Public Health, University College London, UK.
University of Warwick Medical School, UK.
Department of Epidemiology and Population Health, London School of Hygiene and Tropical Medicine, UK.
External sources
Coronary Prevention Group, UK.
Department of Health Cochrane Review Incentive Scheme 2006, UK.
NIHR Cochrane Programme Grant, UK.
Declarations of interest
None known
Edited (no change to conclusions)
References
References to studies included in this review
Ammerman 2003 {published data only}
- Ammerman AS, Keyserling TC, Atwood JR, Hosking JD, Zayed H, Krasny C. A randomized controlled trial of a public health nurse directed treatment program for rural patients with high blood cholesterol. Preventive Medicine 2003;36:340‐51. [DOI] [PubMed] [Google Scholar]
- Keyserling TC, Ammerman AS, Atwood JR, Hosking JD, Krasny C, Zayed H, Worthy BH. A cholesterol intervention program for public health nurses in the rural southeast: description of the intervention, study design, and baseline results. Public Health Nursing 1999;16(3):156‐67. [DOI] [PubMed] [Google Scholar]
Anderson high fibre {published data only}
- Anderson JW, Garrity TF, Wood CL, Whitis SE, Smith BM, Oeltgen PR. Prospective, randomized, controlled comparison of the effects of low‐fat and low‐fat plus high‐fiber diets on serum lipid concentrations. American Journal of Clinical Nutrition 1992;56(5):887‐94. [DOI] [PubMed] [Google Scholar]
Anderson low fibre {published data only}
- Anderson JW, Garrity TF, Wood CL, Whitis SE, Smith BM, Oeltgen PR. Prospective, randomized, controlled comparison of the effects of low‐fat and low‐fat plus high‐fiber diets on serum lipid concentrations. American Journal of Clinical Nutrition 1992;56(5):887‐94. [DOI] [PubMed] [Google Scholar]
Anderssen 2007 {published and unpublished data}
- Anderssen SA, Carroll S, Urdal P, Holme I. Combined diet and exercise intervention reverses the metabolic syndrome in middle‐aged males: results from the Oslo Diet and Exercise Study. Scandinavian Journal of Medicine & Science in Sports 2007;17(6):687‐95. [DOI] [PubMed] [Google Scholar]
Baron men 1990 {published data only}
- Baron JA, Gleason R, Crowe B, Mann JI. Preliminary trial of the effect of general practice based nutritional advice. British Journal of General Practice 1990;40(333):137‐41. [PMC free article] [PubMed] [Google Scholar]
Baron women 1990 {published data only}
- Baron JA, Gleason R, Crowe B, Mann JI. Preliminary trial of the effect of general practice based nutritional advice. British Journal of General Practice 1990;40(333):137‐41. [PMC free article] [PubMed] [Google Scholar]
Beckman 1995 {published data only}
- Beckmann SL, Os I, Kjeldsen SE, Eide IK, Westheim AS, Hjermann I. Effect of dietary counselling on blood pressure and arterial plasma catecholamines in primary hypertension. American Journal of Hypertension 1995;8(7):704‐11. [DOI] [PubMed] [Google Scholar]
Beresford 1997 {published data only}
- Beresford SAA, Curry SJ, Kristal AR, Lazovich D, Feng Z, Wagner EH. A dietary intervention in primary care practice: the eating patterns study. American Journal of Public Health 1997;87(4):610‐6. [DOI] [PMC free article] [PubMed] [Google Scholar]
Beresford 2006 {published and unpublished data}
- Beresford SA, Johnson KC, Ritenbaugh C, Lasser NL, Snetselaar LG, Black HR, et al. Low‐fat dietary pattern and risk of colorectal cancer: the Women's Health Initiative Randomized Controlled Dietary Modification Trial. JAMA 2006;295(6):643‐54. [DOI] [PubMed] [Google Scholar]
Bloemberg 1991 {published data only}
- Bloemberg BPM, Kromhout D, Goddijn HE, Jansen A, Obermann‐deBoer GL. The impact of the guidelines for a healthy diet of the Netherlands Nutrition Council on total and high density lipoprotein cholesterol in hypercholesterolemic free‐living men. American Journal of Epidemiology 1991;134(1):39‐48. [DOI] [PubMed] [Google Scholar]
Bowen 2009 {published and unpublished data}
- Bowen DJ, Beresford SA, Christensen CL, Kuniyuki AA, McLerran D, Feng Z, et al. Effects of a multilevel dietary intervention in religious organizations. American Journal of Health Promotion 2009;24(1):15‐22. [DOI] [PubMed] [Google Scholar]
- Bowen DJ, Beresford SA, Vu T, Feng Z, Tinker L, Hart A, Jr, et al. Baseline data and design for a randomized intervention study of dietary change in religious organizations. Preventive Medicine 2004;39(3):602‐11. [DOI] [PubMed] [Google Scholar]
- Hart A, Bowen DJ, Christensen CL, Mafune R, Campbell MK, Saleeba A, et al. Process evaluation results from the Eating for a Healthy Life study. American Journal of Health Promotion 2009;231(5):324‐7. [DOI] [PubMed] [Google Scholar]
Brekke 2005 {published data only}
- Brekke HK, Jansson PA, Lenner RA. Long‐term (1‐ and 2‐year) effects of lifestyle intervention in type 2 diabetes relatives. Diabetes Research & Clinical Practice 2005 Dec;70(3):225‐34. [DOI] [PubMed] [Google Scholar]
- Brekke HK, Jansson PA, Månsson JE, Lenner RA. Lifestyle changes can be achieved through counseling and follow‐up in first‐degree relatives of patients with type 2 diabetes. Journal of the American Dietetic Association 2003;103(7):835‐43. [DOI] [PubMed] [Google Scholar]
- Brekke HK, Lenner RA, Taskinen MR, Mansson JE, Funahashi T, Matsuzawa Y, et al. Lifestyle modification improves risk factors in type 2 diabetes relatives. Diabetes Research & Clinical Practice 2005 Apr;68(1):18‐28. [DOI] [PubMed] [Google Scholar]
Buller 1999 {published data only}
- Buller DB, Morrill C, Taren D, Aickin M, Sennott‐Miller L, Buller MK, et al. Randomized trial testing the effect of peer education at increasing fruit and vegetable intake. Journal of the National Cancer Institute 1999;91(17):1491‐500. [DOI] [PubMed] [Google Scholar]
Cheng 2004 {published data only}
- Cheng C, Graziani C, Diamond JJ. Cholesterol‐lowering effect of the Food for Heart Nutrition Education Program. Journal of the American Dietetic Association 2004;104(12):1868‐72. [DOI] [PubMed] [Google Scholar]
Coates WHT MP 1999 {published and unpublished data}
- Bowen D, Clifford CK, Coates R, Evans M, Fenf Z, Fouad M, et al. The women's health trial feasibility study in minority populations: design and baseline descriptions. Annals of Epidemiology 1996;6:507‐19. [DOI] [PubMed] [Google Scholar]
- Coates RJ, Bowen DJ, Kristal AR, Feng Z, Oberman A, Hall WD, et al. The women's health trial feasibility study in minority populations: changes in dietary intakes. American Journal of Epidemiology 1999;149(12):1104‐12. [DOI] [PubMed] [Google Scholar]
Cox 1996 {published data only}
- Cox RH, Gonzales‐Vigilar MCRV, Novascone MA, Silva‐Barbeau I. Impact of cancer intervention on diet related cardiovascular disease risks of white and African‐American EFNEP clients. Journal of Nutrition Education 1996;28:209‐18. [Google Scholar]
Djuric combination {published and unpublished data}
- Djuric Z, Ren J, Mekhovich O, Venkatranamoorthy R, Heilbrun LK. Effects of high fruit‐vegetable and/or low‐fat intervention on plasma micronutrient levels. Journal of the American College of Nutrition 2006;25(3):178‐87. [DOI] [PubMed] [Google Scholar]
- Radakovich K, Heilbrun LK, Venkatranamamoorthy R, Lababidi S, Klurfeld DM, Djuric Z. Women participating in a dietary intervention trial maintain dietary changes without much effect on household members. Nutrition and Cancer 2006;55(1):44‐52. [DOI] [PubMed] [Google Scholar]
Djuric high F&V {published and unpublished data}
- Djuric Z, Ren J, Mekhovich O, Venkatranamoorthy R, Heilbrun LK. Effects of high fruit‐vegetable and/or low‐fat intervention on plasma micronutrient levels. Journal of the American College of Nutrition 2006 Jun;25(3):178‐87. [DOI] [PubMed] [Google Scholar]
- Radakovich K, Heilbrun LK, Venkatranamamoorthy R, Lababidi S, Klurfeld DM, Djuric Z. Women participating in a dietary intervention trial maintain dietary changes without much effect on household members. Nutrition and Cancer 2006;55(1):44‐52. [DOI] [PubMed] [Google Scholar]
Elder promotora {published data only}
- Elder JP, Ayala GX, Campbell NR, Arredondo EM, Slymen DJ, Baquero B, et al. Long‐term effects of a communication intervention for Spanish‐dominant Latinas. American Journal of Preventive Medicine 2006 Aug;31(2):159‐66. [DOI] [PubMed] [Google Scholar]
Elder tailored {published data only}
- Elder JP, Ayala GX, Campbell NR, Arredondo EM, Slymen DJ, Baquero B, et al. Long‐term effects of a communication intervention for Spanish‐dominant latinas. American Journal of Preventive Medicine 2006 Aug;31(2):159‐66. [DOI] [PubMed] [Google Scholar]
ENCORE {published and unpublished data}
- Blumenthal JA, Babyak MA, Hinderliter A, Watkins LL, Craighead L, Lin PH, et al. Effects of the DASH diet alone and in combination with exercise and weight loss on blood pressure and cardiovascular biomarkers in men and women with high blood pressure: the ENCORE study. Archives of Internal Medicine 2010;170(2):126‐35. [DOI] [PMC free article] [PubMed] [Google Scholar]
- Blumenthal JA, Babyak MA, Sherwood A, Craighead L, Lin PH, Johnson J, et al. Effects of the dietary approaches to stop hypertension diet alone and in combination with exercise and caloric restriction on insulin sensitivity and lipids. Hypertension 2010;55(5):1199‐205. [DOI] [PMC free article] [PubMed] [Google Scholar]
Fuemmeler 2006 {published data only}
- Fuemmeler BF, Masse LC, Yaroch AL, Resnicow K, Campbell MK, Carr C, et al. Psychosocial mediation of fruit and vegetable consumption in the body and soul effectiveness trial. Health Psychology 2006;25(4):474‐83. [DOI] [PubMed] [Google Scholar]
Gann 2003 {published data only}
- Gann PH, Chatterton RT, Gapstur SM, Liu K, Garside D, Giovanazzi S, et al. The effects of a low‐fat/high‐fiber diet on sex hormone levels and menstrual cycling in premenopausal women: a 12‐month randomized trial (the diet and hormone study). Cancer 2003;98:1870‐9. [DOI] [PubMed] [Google Scholar]
Havas 1998 {published data only}
- Havas S, Anliker J, Damron D, Langenberg P, Ballesteros M, Feldman R. Final results of the Maryland WIC 5‐a‐day promotion program. American Journal of Public Health 1998;88(8):1161‐7. [DOI] [PMC free article] [PubMed] [Google Scholar]
Hellenius 1993 {published data only}
- Hellenius ML, Faire U, Berglund B, Hamsten A, Krakau I. Diet and exercise are equally effective in reducing risk for cardiovascular disease. Results from a randomised controlled study in men with slightly to moderately raised cardiovascular risk factors. Atherosclerosis 1993;103:81‐91. [DOI] [PubMed] [Google Scholar]
Henderson WHTV 1990 {published data only}
- Gorbach SL, Morrill‐LaBrode A, Woods MN, Dwyer JT, Selles WD, Henderson M, et al. Changes in food patterns during a low‐fat dietary intervention in women. Journal of the American Dietetic Association 1990;90(6):802‐9. [PubMed] [Google Scholar]
- Henderson MM, Kushi LH, Thompson DJ, Gorbach SL, Clifford CK, Insull WJ, et al. Feasibility of a randomized trial of a low‐fat diet for the prevention of breast cancer: dietary compliance in the Women's Health Trial Vanguard Study. Preventive Medicine 1990;19(2):115‐33. [DOI] [PubMed] [Google Scholar]
- Insull W, Henderson MM, Prentice RL, Thompson DJ, Clifford C, Goldman S, et al. Results of a randomized feasibility study of a low‐fat diet. Archives of Internal Medicine 1990;150(2):421‐7. [PubMed] [Google Scholar]
John 2002 {published data only}
- John JH, Ziebland S, Yudkin P, Roe LS, Neil HA. Effects of fruit and vegetable consumption on plasma antioxidant concentrations and blood pressure: a randomised controlled trial. Lancet 2002;359(9322):1969‐74. [DOI] [PubMed] [Google Scholar]
Keyserling 1997 {published data only}
- Keyserling TC, Ammerman AS, Davis CE, Mok MC, Garrett J, Simpson R. A randomized controlled trial of a physician‐directed treatment program for low‐income patients with high blood cholesterol: The Southeast Cholesterol Project. Archives of Family Medicine 1997;6(2):135‐45. [DOI] [PubMed] [Google Scholar]
Koopman 1990 {published data only}
- Koopman H, Spreeuwenberg C, Westerman RF, Donker AJM. Dietary treatment of patients with mild to moderate hypertension in a general practice: a pilot intervention study (1). The first three months. Journal of Human Hypertension 1990;4(4):368‐71. [PubMed] [Google Scholar]
Kristal 2000 {published data only}
- Kristal AR, Curry SJ, Shattuck AL, Feng Z, Li S. A randomized trial of a tailored, self‐help dietary intervention: The Puget Sound Eating Patterns Study. Preventive Medicine 2000;31(4):380‐9. [DOI] [PubMed] [Google Scholar]
Lanza men 2001 {published data only}
- Lanza E, Schatzkin A, Daston C, Corle D, Freedman L, Ballard‐Barbash R, et al. Implementation of a 4‐y, high‐fiber, high‐fruit‐and‐vegetable, low‐fat dietary intervention: results of dietary changes in the Polyp Prevention Trial. American Journal of Clinical Nutrition 2001;74(3):387‐401. [DOI] [PubMed] [Google Scholar]
- Schatzkin A, Lanza E, Corle D, Lance P, Iber F, Caan B, et al. Lack of effect of a low‐fat, high‐fiber diet on the recurrence of colorectal adenomas. New England Journal of Medicine 2000;342(16):1149‐55. [DOI] [PubMed] [Google Scholar]
Lanza women 2001 {published data only}
- Lanza E, Schatzkin A, Daston C, Corle D, Freedman L, Ballard‐Barbash R, et al. Implementation of a 4‐y, high‐fiber, high‐fruit‐and‐vegetable, low‐fat dietary intervention: results of dietary changes in the Polyp Prevention Trial. American Journal of Clinical Nutrition 2001;74(3):387‐401. [DOI] [PubMed] [Google Scholar]
- Schatzkin A, Lanza E, Corle D, Lance P, Iber F, Caan B, et al. Lack of effect of a low‐fat, high‐fiber diet on the recurrence of colorectal adenomas. New England Journal of Medicine 2000;342(16):1149‐55. [DOI] [PubMed] [Google Scholar]
Little 2004 {published data only}
- Little P, Kelly J, Barnett J, Dorward M, Margetts B, Warm D. Randomised controlled factorial trial of dietary advice for patients with a single high blood pressure reading in primary care. BMJ 2004;328(7447):1054. [DOI] [PMC free article] [PubMed] [Google Scholar]
Lutz non‐tailored {published data only}
- Lutz SF, Ammerman AS, Atwood JR, Campbell MK, DeVellis RF, Rosamond WD. Innovative newsletter interventions improve fruit and vegetable consumption in healthy adults. Journal of the American Dietetic Association 1999;99(6):705‐9. [DOI] [PubMed] [Google Scholar]
Lutz tailored&goals {published data only}
- Lutz SF, Ammerman AS, Atwood JR, Campbell MK, DeVellis RF, Rosamond WD. Innovative newsletter interventions improve fruit and vegetable consumption in healthy adults. Journal of the American Dietetic Association 1999;99(6):705‐9. [DOI] [PubMed] [Google Scholar]
Lutz tailored 1999 {published data only}
- Lutz SF, Ammerman AS, Atwood JR, Campbell MK, DeVellis RF, Rosamond WD. Innovative newsletter interventions improve fruit and vegetable consumption in healthy adults. Journal of the American Dietetic Association 1999;99(6):705‐9. [DOI] [PubMed] [Google Scholar]
Maskarinec 1999 {published data only}
- Maskarinec G, Chan CL, Meng L, Franke AA, Cooney RV. Exploring the feasibility and effects of a high‐fruit and ‐vegetable diet in healthy women. Cancer Epidemiology, Biomarkers & Prevention 1999;8(10):919‐24. [PubMed] [Google Scholar]
Moy 2001 {published data only}
- Moy TF, Yanek LR, Raquen˜o JV, Bezirdjian PJ, Blumenthal RS, Wilder LB, et al. Dietary counseling for high blood cholesterol in families at risk of coronary disease. Preventive Cardiology 2001;4(4):158‐64. [DOI] [PubMed] [Google Scholar]
Neil dietitian1995 {published data only}
- Neil HAW, Roe L, Godlee RJP, Moore JW, Clark GMG, Brown J, et al. Randomised trial of lipid lowering dietary advice in general practice:the effects on serum lipids, lipoproteins, and antioxidants. BMJ 1995;310:569‐73. [DOI] [PMC free article] [PubMed] [Google Scholar]
Neil nurse 1995 {published data only}
- Neil HAW, Roe L, Godlee RJP, Moore JW, Clark GMG, Brown J, et al. Randomised trial of lipid lowering dietary advice in general practice:the effects on serum lipids, lipoproteins, and antioxidants. BMJ 1995;310:569‐73. [DOI] [PMC free article] [PubMed] [Google Scholar]
Riddell 2000 {published data only}
- Riddell LJ, Chisholm A, Williams S, Mann JI. Dietary strategies for lowering homocysteine concentrations. American Journal of Clinical Nutrition 2000;71(6):1448‐54. [DOI] [PubMed] [Google Scholar]
Rock 2001 {published data only}
- Rock CL, Moskowitz A, Huizar B, Saenz CC, Clark JT, Daly TL, et al. High vegetable and fruit diet intervention in premenopausal women with cervical intraepithelial neoplasia. Journal of the American Dietetic Association 2001;101(10):1167‐74. [DOI] [PubMed] [Google Scholar]
Sacerdote 2006 {published data only}
- Sacerdote C, Fiorini L, Rosato R, Audenino M, Valpreda M, Vineis P. Randomized controlled trial: Effect of nutritional counselling in general practice. International Journal of Epidemiology 2006;35(2):409‐15. [DOI] [PubMed] [Google Scholar]
Schatzkin 2000 {published data only}
- Schatzkin A, Lanza E, Corle D, Lance P, Iber F, Caan B, et al. The Polyp Prevention Trial Study Group: Lack of effect of a low‐fat, high fibre diet on the recurrence of colorectal adenomas. New England Journal of Medicine 2000;342(16):1149‐55. [DOI] [PubMed] [Google Scholar]
- Schatzkin A, Lanza E, Freedman LS, Tangrea J, Cooper MR, Marshall JR, et al. The polyp prevention trial I: Rationale, design, recruitment and baseline participant characteristics. Cancer Epidemiology, Biomarkers & Prevention 1996;5:375‐83. [PubMed] [Google Scholar]
Silman 1983 {published data only}
- Silman AJ, Mitchell P, Locke C, Humpherson P. Evaluation of the effectiveness of a low sodium diet in the treatment of mild to moderate hypertension. Lancet 1983;28:1179‐82. [DOI] [PubMed] [Google Scholar]
Smith‐Warner 2000 {published data only}
- Smith‐Warner SA, Elmer PJ, Tharp TM, Fosdick L, Randall B, Gross M, et al. Increasing vegetable and fruit intake: Randomized intervention and monitoring in an at‐risk population. Cancer Epidemiology, Biomarkers & Prevention 2000;9(3):307‐17. [PubMed] [Google Scholar]
Sorensen work+family {published and unpublished data}
- Sorensen G, Stoddard A, Peterson K, Cohen N, Hunt MK, Stein E, et al. Increasing fruit and vegetable consumption through worksites and families in the Treatwell 5‐a‐day study. American Journal of Public Health 1999;89(1):54‐60. [DOI] [PMC free article] [PubMed] [Google Scholar]
Sorensen worksite {published and unpublished data}
- Sorensen G, Stoddard A, Peterson K, Cohen N, Hunt MK, Stein E, et al. Increasing fruit and vegetable consumption through worksites and families in the Treatwell 5‐a‐day study. American Journal of Public Health 1999;89(1):54‐60. [DOI] [PMC free article] [PubMed] [Google Scholar]
Stevens 2003 {published data only}
- Stevens VJ, Glasgow RE, Toobert DJ, Karanja N, Smith KS. One‐year results from a brief, computer‐assisted intervention to decrease consumption of fat and increase consumption of fruits and vegetables. Preventive Medicine 2003;36(5):594‐600. [DOI] [PubMed] [Google Scholar]
Takahashi 2006 {published data only}
- Takahashi Y, Sasaki S, Okubo S, Hayashi M, Tsugane S. Blood pressure change in a free‐living population‐based dietary modification study in Japan. Journal of Hypertension 2006;24(3):451‐8. [DOI] [PubMed] [Google Scholar]
- Takashashi Y, Sasaki S, Takahashi M, Okubo S, Hayashi M, Tsugane S. A population‐based intervention trial in a high risk area for stomach cancer and stroke: changes in intakes and related biomarkers. Preventive Medicine 2003;37(5):432‐41. [DOI] [PubMed] [Google Scholar]
Tilley 1999 {published data only}
- Tilley BC, Glanz K, Kristal AR, Hirst K, Li S, Vernon SW, et al. Nutrition intervention for high‐risk auto workers: results of the Next Step Trial. Preventive Medicine 1999;28(3):284‐92. [DOI] [PubMed] [Google Scholar]
- Tilley BC, Vernon SW, Glanz K, Myers R, Sanders K, Lu M, et al. Worksite cancer screening and nutrition intervention for high‐risk auto workers: design and baseline findings of the Next Step Trial. Preventive Medicine 1997;26:227‐35. [DOI] [PubMed] [Google Scholar]
TOHP I {published and unpublished data}
- Cook NR, Cutler JA, Obarzanek E, Buring JE, Rexrode KM, Kumanyika SK, et al. Long term effects of dietary sodium reduction on cardiovascular disease outcomes: observational follow‐up of the trials of hypertension prevention (TOHP). BMJ 2007;334(7599):885‐8. [DOI] [PMC free article] [PubMed] [Google Scholar]
- Whelton PK, Hebert PR, Cutler JA, Applegate WB, Eberlein KA, Klag MJ, et al. Baseline characteristics of participants in phase 1 of the trials of hypertension prevention. Annals of Epidemiology 1992;2:295‐310. [DOI] [PubMed] [Google Scholar]
- Whelton PK, Kumanyika SK, Cook NR, Cutler JA, Borhani NO, Hennekens CH, et al. Efficacy of nonpharmacologic interventions in adults with high‐normal blood pressure: results from phase 1 of the Trials of Hypertension Prevention. Trials of hypertension prevention collaborative research group. American Journal of Clinical Nutrition 1997;65(2 Suppl):652s‐60s. [DOI] [PubMed] [Google Scholar]
TOHP II {published and unpublished data}
- Cook NR, Cutler JA, Obarzanek E, Buring JE, Rexrode KM, Kumanyika SK, et al. Long term effects of dietary sodium reduction on cardiovascular disease outcomes: observational follow‐up of the trials of hypertension prevention (TOHP). BMJ 2007;334(7599):885‐8. [DOI] [PMC free article] [PubMed] [Google Scholar]
- Whelton PK, Appel L, Charleston J, Dalcin A, Haythornthwaite J, Rosofsky W, et al. Effects of weight loss and sodium reduction intervention on blood pressure and hypertension incidence in overweight people with high‐normal blood pressure. The trials of hypertension prevention, phase II. Archives of Internal Medicine 1997;157(6):657‐67. [PubMed] [Google Scholar]
van der Veen 2002 {published data only}
- Veen J, Bakx C, Hoogen H, Verheijden M, Bosch W, Ween C, et al. Stage‐matched nutrition guidance for patients at elevated risk for cardiovascular disease: a randomized intervention study in family practice. Journal of Family Practice 2002;51(9):751‐8. [PubMed] [Google Scholar]
References to studies excluded from this review
Anderson 2001 {published data only}
- Anderson JV, Bybee DI, Brown RM, McLean DF, Garcia EM, Breer ML, et al. 5 a day fruit and vegetable intervention improves consumption in a low income population. Journal of the American Dietetic Association 2001;101(2):195‐202. [DOI] [PubMed] [Google Scholar]
Appel 2001 {published data only}
- Appel LJ, Espeland MA, Easter L, Wilson AC, Folmar S, Lacy CR. Effects of reduced sodium intake on hypertension control in older individuals: results from the Trial of Nonpharmacologic Interventions in the Elderly (TONE). Archives of Internal Medicine 2001;161(5):685‐93. [DOI] [PubMed] [Google Scholar]
Bhargava 2004 {published data only}
- Bhargava A, Hays J. Behavioral variables and education are predictors of dietary change in the Women's Health Trial: Feasibility Study in Minority Populations. Preventive Medicine 2004;38(4):442‐51. [DOI] [PubMed] [Google Scholar]
Boyd 1990 {published data only}
- Boyd NF, Cousins M, Beaton M, Kriukov V, Lockwood G, Tritchler D. Quantitative changes in dietary fat intake and serum cholesterol in women: results from a randomized, controlled trial. American Journal of Clinical Nutrition 1990;52(3):470‐6. [DOI] [PubMed] [Google Scholar]
Braeckman 1999 {published and unpublished data}
- Braeckman L, Bacquer D, Maes L, Backer G. Effects of a low‐intensity worksite‐based nutrition intervention. Occupational Medicine 1999;49(8):549‐55. [DOI] [PubMed] [Google Scholar]
Burke 2005 {published data only}
- Burke LE, Dunbar‐Jacob J, Orchard TJ, Sereika SM. Improving adherence to a cholesterol‐lowering diet: a behavioral intervention study. Patient Education & Counseling 2005;57(1):134‐42. [DOI] [PubMed] [Google Scholar]
Cappuccio 2006 {published data only}
- Cappuccio FP, Kerry SM, Micah FB, Plange‐Rhule J, Eastwood JB. A community programme to reduce salt intake and blood pressure in Ghana. BMC Public Health 2006;6:13. [DOI] [PMC free article] [PubMed] [Google Scholar]
Chalmers 1986 {published data only}
- Chalmers J, Morgan T, Doyle A, Dickson B, Hopper J, Mathews J, et al. Australian National Health and Medical Research Council dietary salt study in mild hypertension. Journal of Hypertension. Supplement 1986;4(6):S629‐37. [PubMed] [Google Scholar]
Colombo 2005 {published data only}
- Colombo C, Muti P, Pala V, Cavalleri A, Venturelli E, Locardi M, et al. Plant‐based diet, serum fatty acid profile, and free radicals in postmenopausal women: the diet and androgens (DIANA) randomized trial. International Journal of Biological Markers 2005 Jul;20(3):169‐76. [DOI] [PubMed] [Google Scholar]
Djuric 2009 {published data only}
- Djuric Z, Ren J, Blythe J, VanLoon G, Sen A. A Mediterranean dietary intervention in healthy American women changes plasma carotenoids and fatty acids in distinct clusters. Nutrition Research 2009;29(3):156‐63. [DOI] [PMC free article] [PubMed] [Google Scholar]
Due 2008 {published data only}
- Due A, Larsen TM, Mu H, Hermansen K, Stender S, Astrup A. Comparison of 3 ad libitum diets for weight‐loss maintenance, risk of cardiovascular disease, and diabetes: a 6‐mo randomized, controlled trial. American Journal of Clinical Nutrition 2008;88(5):1232‐41. [DOI] [PubMed] [Google Scholar]
Eid 2006 {published data only}
- Eid HMA, Arnesen H, Hjerkinn EM, Lyberg T, Ellingsen I, Seljeflot I. Effect of diet and omega‐3 fatty acid intervention on asymmetric dimethylarginine. Nutrition and Metabolism 2006;3:1‐10. [DOI] [PMC free article] [PubMed] [Google Scholar]
Estruch 2006 {published data only}
- Estruch R, Martinez‐Gonzalez MA, Corella D, Salas‐Salvado J, Ruiz‐Gutierrez V, Covas MI, et al. Effects of a Mediterranean‐style diet on cardiovascular risk factors: a randomized trial. Annals of Internal Medicine 2006;145(1):1‐11. [DOI] [PubMed] [Google Scholar]
Fehily 1983 {published data only}
- Fehily AM, Burr ML, Phillips KM, Deadman NM. The effect of fatty fish on plasma lipid and lipoprotein concentrations. American Journal of Clinical Nutrition 1983;38(3):349‐51. [DOI] [PubMed] [Google Scholar]
Fitzgibbon 2004 {published data only}
- Fitzgibbon ML, Gapstur SM, Knight SJ. Results of Mujeres Felices por ser Saludables: a dietary/breast health randomized clinical trial for Latino women. Annals of Behavioral Medicine 2004;28(2):95‐104. [DOI] [PubMed] [Google Scholar]
Fries 2005 {published data only}
- Fries E, Edinboro P, McClish D, Manion L, Bowen D, Beresford SA, et al. Randomized trial of a low‐intensity dietary intervention in rural residents: the Rural Physician Cancer Prevention Project. American Journal of Preventive Medicine 2005;28(2):162‐8. [DOI] [PubMed] [Google Scholar]
Havas 2003 {published data only}
- Havas S, Anliker J, Greenberg D, Block G, Block T, Blik C, et al. Final results of the Maryland WIC Food for Life Program. Preventive Medicine 2003;37(5):406‐16. [DOI] [PubMed] [Google Scholar]
Hellenius 1997 {published data only}
- Hellenius ML, Krakau I, DeYear FU. Favourable long‐term effects from advice on diet and exercise given to healthy men with raised cardiovascular risks. Nutrition, Metabolism, and Cardiovascular Diseases 1997;7:293‐300. [Google Scholar]
Henkin 2000 {published data only}
- Henkin Y, Shai I, Zuk R, Brickner D, Zuilli I, Neumann L, et al. Dietary treatment of hypercholesterolemia: do dietitians do it better? A randomized, controlled trial. American Journal of Medicine 2000;109(7):549‐55. [DOI] [PubMed] [Google Scholar]
HPTR 1990 {published data only}
- Hypertension Prevention Trial Research Group. The Hypertension Prevention Trial: three‐year effects of dietary changes on blood pressure. Archives of Internal Medicine 1990;150(1):153‐62. [PubMed] [Google Scholar]
Hunt 2001 {published data only}
- Hunt MK, Lobb R, Delichatsios HK, Stone C, Emmons K, Gillman MW. Process evaluation of a clinical preventive nutrition intervention. Preventive Medicine 2001;33(2 Pt 1):82‐90. [DOI] [PubMed] [Google Scholar]
Hyman 1998 {published data only}
- Hyman DJ, Ho KSI, Dunn JK, Simons‐Morton D. Dietary intervention for cholesterol reduction in public clinic patients. American Journal of Preventive Medicine 1998;15(2):139‐45. [DOI] [PubMed] [Google Scholar]
Iso 2002 {published data only}
- Iso H, Imano H, Nakagawa Y, Kiyama M, Kitamura A, Sato S, et al. One‐year community‐based education program for hypercholesterolemia in middle‐aged Japanese: a long‐term outcome at 8‐year follow‐up. Atherosclerosis 2002;164(1):195‐202. [DOI] [PubMed] [Google Scholar]
Korhonen 2003 {published data only}
- Korhonen M, Kastarinen M, Uusitupa M, Puska P, Nissinen A. The effect of intensified diet counseling on the diet of hypertensive subjects in primary health care: a 2‐year open randomized controlled trial of lifestyle intervention against hypertension in eastern Finland. Preventive Medicine 2003;36(1):8‐16. [DOI] [PubMed] [Google Scholar]
Larsen 2010 {published data only}
- Larsen TM, Dalskov S, Baak M, Jebb S, Kafatos A, Pfeiffer A, et al. The Diet, Obesity and Genes (Diogenes) Dietary Study in eight European countries ‐ a comprehensive design for long‐term intervention. Obesity Reviews 2010;11(1):76‐91. [DOI] [PubMed] [Google Scholar]
- Larsen TM, Dalskov S‐M, Baak M, Jebb SA, Papadaki A, Pfeiffer AFH, et al. for the Diet, Obesity, and Genes (Diogenes) Project. Diets with high or low protein content and glycemic index for weight‐loss maintenance. New England Journal of Medicine 2010;363:2102‐13. [DOI] [PMC free article] [PubMed] [Google Scholar]
Leduc 1994 {published data only}
- Leduc CP, Cherniak D, Faucher J. Effectiveness of a group dietary intervention on hypercholesterolemia: a randomised controlled clinical trial. Atherosclerosis 1994;109(1‐2):149. [Google Scholar]
Marcus 2001 {published data only}
- Marcus AC, Heimendinger J, Wolfe P, Fairclough D, Rimer BK, Morra M, et al. A randomized trial of a brief intervention to increase fruit and vegetable intake: a replication study among callers to the CIS. Preventive Medicine 2001;33(3):204‐16. [DOI] [PubMed] [Google Scholar]
Martin 2006 {published data only}
- Martin LJ, Greenberg CV, Kriukov V, Minkin S, Jenkins DJ, Boyd NF. Intervention with a low‐fat, high‐carbohydrate diet does not influence the timing of menopause. American Journal of Clinical Nutrition 2006 Oct;84(4):920‐8. [DOI] [PubMed] [Google Scholar]
Ni Mhurchu 1998 {published data only}
- Ni Mhurchu C, Margetts BM, Speller V. Randomised clinical trial comparing the effectiveness of two dietary interventions for patients with hyperlipidaemia. Clinical Science 1998;95:479‐87. [PubMed] [Google Scholar]
Ockene 1999 {published data only}
- Ockene IS, Hebert JR, Ockene JK, Saperia GM, Stanek E, Nicolosi R, et al. Effect of physician‐delivered nutrition counseling training and an office‐support program on saturated fat intake, weight, and serum lipid measurements in a hyperlipidemic population: Worcester Area Trial for Counseling in Hyperlipidemia (WATCH). Archives of Internal Medicine 1999;159(7):725‐31. [DOI] [PubMed] [Google Scholar]
Resnicow 2001 {published data only}
- Resnicow K, Jackson A, Wang T, De AK, McCarty F, Dudley WN, et al. A motivational interviewing intervention to increase fruit and vegetable intake through Black churches: results of the Eat for Life trial. American Journal of Public Health 2001;91(10):1686‐93. [DOI] [PMC free article] [PubMed] [Google Scholar]
Richards 2006 {published data only}
- Richards A, Kattelmann KK, Ren C. Motivating 18‐ to 24‐year‐olds to increase their fruit and vegetable consumption. Journal of the American Dietetic Association 2006;106(9):1405‐11. [DOI] [PubMed] [Google Scholar]
Sartorelli 2005 {published data only}
- Sartorelli DS, Sciarra EC, Franco LJ, Cardoso MA. Beneficial effects of short‐term nutritional counselling at the primary health‐care level among Brazilian adults. Public Health Nutrition 2005;8(7):820‐5. [DOI] [PubMed] [Google Scholar]
Simon 1997 {published data only}
- Simon MS, Heilbrun LK, Boomer‐Allison, Kresge C, Depper J, Kim PN, et al. A randomized trial of a low‐fat dietary intervention in women at high risk for breast cancer. Nutrition and Cancer 1997;27(2):136‐42. [DOI] [PubMed] [Google Scholar]
Smith 1997 {published data only}
- Smith AM, Owen N, Baghurst KI. Influence of socioeconomic status on the effectiveness of dietary counselling in healthy volunteers. Journal of Nutrition Education 1997;29(1):27‐35. [Google Scholar]
Sorensen 1992 {published data only}
- Sorensen G, Morris DM, Hunt MK, Hebert JR, Harris DR, Stoddard A, et al. Work‐site nutrition intervention and employees' dietary habits: the Treatwell program. American Journal of Public Health 1992;82(6):877‐80. [DOI] [PMC free article] [PubMed] [Google Scholar]
Torjesen 1997 {published data only}
- Torjesen PA, Birkeland KI, Anderssen SA, Hjermann I, Holme I, Urdal P. Lifestyle changes may reverse development of the insulin resistance syndrome. The Oslo Diet and Exercise Study: a randomized trial. Diabetes Care 1997;20(1):26‐31. [DOI] [PubMed] [Google Scholar]
WHI 2006 {published data only}
- Beresford SA, Johnson KC, Ritenbaugh C, Lasser NL, Snetselaar LG, Black HR, et al. Low‐fat dietary pattern and risk of colorectal cancer: the Women's Health Initiative Randomized Controlled Dietary Modification Trial. JAMA 2006;295(6):643‐54. [DOI] [PubMed] [Google Scholar]
- Howard BV, Van HL, Hsia J, Manson JE, Stefanick ML, Wassertheil‐Smoller S, et al. Low‐fat dietary pattern and risk of cardiovascular disease: the Women's Health Initiative Randomized Controlled Dietary Modification Trial. JAMA 2006;295(6):655‐66. [DOI] [PubMed] [Google Scholar]
- Prentice RL, Caan B, Chlebowski RT, Patterson R, Kuller LH, Ockene JK, et al. Low‐fat dietary pattern and risk of invasive breast cancer: the Women's Health Initiative Randomized Controlled Dietary Modification Trial. JAMA 2006;295(6):629‐42. [DOI] [PubMed] [Google Scholar]
Willaing 2004 {published data only}
- Willaing I, Ladelund S, Jorgensen T, Simonsen T, Nielsen LM. Nutritional counselling in primary health care: a randomized comparison of an intervention by general practitioner or dietician. European Journal of Cardiovascular Prevention & Rehabilitation 2004;11(6):513‐20. [DOI] [PubMed] [Google Scholar]
Williams‐Piehota {published data only}
- Williams‐Piehota P, Pizarro J, Navarro Silvera SA, Mowad L, Salovey P. Need for cognition and message complexity in motivating fruit and vegetable intake among callers to the cancer information service. Health Communication 2006;19(1):75‐84. [DOI] [PubMed] [Google Scholar]
Additional references
Appel 1997
- Appel LJ, Moore TJ, Obarzanek E, Vollmer WM, Svetkey LP, Sacks FM, et al. A clinical trial of the effects of dietary patterns on blood pressure. New England Journal of Medicine 1997;336:1117‐24. [DOI] [PubMed] [Google Scholar]
Avenell 2004
- Avenell A, Broom J, Brown TJ, Poobalan A, Aucott L, Stearns SC, et al. Systematic review of the long‐term effects and economic consequences of treatments for obesity and implications for health improvement. Health Technology Assessment. Winchester, UK, 2004; Vol. 8, issue 21:iii‐iv, 1‐182. [DOI] [PubMed]
Baigent 2005
- Baigent C, Keech A, Kearney PM, Blackwell L, Buck G, Pollicino C, et al. Cholesterol Treatment Trialists' (CTT) Collaborators. Efficacy and safety of cholesterol‐lowering treatment: prospective meta‐analysis of data from 90,056 participants in 14 randomised trials of statins. Lancet 2005;366(9493):1267‐78. [DOI] [PubMed] [Google Scholar]
Barton 2011
- Barton P, Andronis l, Briggs A, McPherson K, Capewell S. Effectiveness and cost effectiveness of cardiovascular disease prevention in whole populations: modelling study. BMJ 2011;343:d4044. [DOI: 10.1136/bmj.d4044] [DOI] [PMC free article] [PubMed] [Google Scholar]
Bowen 2004
- Bowen DJ, Beresford SA, Vu T, Feng Z, Tinker L, Hart A, Jr, et al. Baseline data and design for a randomized intervention study of dietary change in religious organizations. Preventive Medicine 2004;39(3):602‐11. [DOI] [PubMed] [Google Scholar]
Brunner 2006
- Brunner EJ. Commentary: What is the best way to promote healthy eating?. International Journal of Epidemiology 2006;35:414‐7. [MEDLINE: ] [DOI] [PubMed] [Google Scholar]
Brunner 2007
- Brunner E, Rees K, Ward K, Burke M, Thorogood M. Dietary advice for reducing cardiovascular risk. Cochrane Database of Systematic Reviews 2007, Issue 4. [DOI: 10.1002/14651858.CD002128.pub3] [DOI] [PubMed] [Google Scholar]
Cappuccio 1991
- Cappuccio FP, MacGregor GA. Does potassium supplementation lower blood pressure? A meta‐analysis of published trials. Journal of Hypertension 1991;9:465‐73. [DOI] [PubMed] [Google Scholar]
COMA 1994
- Committee on Medical Aspects of Food Policy. Nutritional Aspects of Cardiovascular Disease. London: HMSO, 1994. [Google Scholar]
CTT 2012
- Cholesterol Treatment Trialists' (CTT) Collaborators. The effects of lowering LDL cholesterol with statin therapy in people at low risk of vascular disease: meta‐analysis of individual data from 27 randomised trials. Lancet 2012;380(9841):581‐90. [DOI] [PMC free article] [PubMed] [Google Scholar]
Curioni 2006
- Curioni C, André C, Veras R. Weight reduction for primary prevention of stroke in adults with overweight or obesity. Cochrane Database of Systematic Reviews 2006, Issue 4. [DOI: 10.1002/14651858.CD006062.pub2] [DOI] [PMC free article] [PubMed] [Google Scholar]
Dayton 1969
- Dayton S, Pearce M. Prevention of coronary heart disease and other complications of atherosclerosis by modified diet. American Journal of Medicine 1969;46:751‐62. [DOI] [PubMed] [Google Scholar]
De Lorgeril 1999
- Lorgeril M, Salen P, Martin J‐L, Monjaud I, Delaye J, Mamelle N. Mediterranean diet, traditional risk factors, and the rate of cardiovascular complications after myocardial infarction. Final report of the Lyon Diet Heart Study. Circulation 1999;99(6):778‐85. [DOI] [PubMed] [Google Scholar]
Deeks 2011
- Deeks JJ, Higgins, JPT, Altman DG, editors. Chapter 9: Analysing data and undertaking meta‐analyses. In: Higgins JPT, Green S editor(s). Cochrane Handbook for Systematic Reviews of Interventions. Version 5.1.0 (updated March 2011). The Cochrane Collaboration, 2011. Available from www.cochrane‐handbook.org, 2011. [Google Scholar]
Dietary Guidelines for Americans 2010
- Dietary Guidelines for Americans. http://www.cnpp.usda.gov/publications/dietaryguidelines/2010/policydoc/execsumm.pdf 2010.
DOH 2004
- Department of Health. Choosing health: making healthier choices easier. London: Department of Health, 2004. [CM6374; http://webarchive.nationalarchives.gov.uk/+/dh.gov.uk/en/publicationsandstatistics/publications/publicationspolicyandguidance/dh_4094550] [Google Scholar]
FHSG 1994
- Family Heart Study Group. Randomised controlled trial evaluating cardiovascular screening and intervention in general practice: principal results of British family heart study. BMJ 1994;308:313‐20. [PMC free article] [PubMed] [Google Scholar]
Flodgren 2010
- Flodgren G, Deane K, Dickinson HO, Kirk S, Alberti H, Beyer FR, et al. Interventions to change the behaviour of health professionals and the organisation of care to promote weight reduction in overweight and obese adults. Cochrane Database of Systematic Reviews 2010, Issue 3. [DOI: 10.1002/14651858.CD000984.pub2] [DOI] [PMC free article] [PubMed] [Google Scholar]
Follmann 1992
- Follman D, Elliot P, Suh I, Cutler J. Variance imputation for overviews of clinical trials with continuous response. Journal of Clinical Epidemiology 1992;45:769‐73. [DOI] [PubMed] [Google Scholar]
Frank 1978
- Frank GC, Berenson GS, Webber LS. Dietary studies and the relationship of diet to cardiovascular disease risk factor variables in 10‐year‐old children‐‐The Bogalusa Heart Study. The American Journal of Clinical Nutrition 1978;31(2):328‐40. [DOI] [PubMed] [Google Scholar]
Frantz 1989
- Frantz DIJ, Dawson AE, Ashman LP, Gatewood CL, Bartsch EG, Kuba K, et al. Test of effect of lipid lowering by diet on cardiovascular risk. Arteriosclerosis 1989;9:129‐35. [DOI] [PubMed] [Google Scholar]
FSA 2006
- FSA Nutrient and Food Based Guidelines for UK Institutions. http://www.eatbalanced.com/media/3625/fsa_nutrition_guideuk.pdf 2006.
He 2004
- He FJ, MacGregor GA. Effect of longer‐term modest salt reduction on blood pressure. Cochrane Database of Systematic Reviews 2004, Issue 1. [DOI: 10.1002/14651858.CD004937] [DOI] [PubMed] [Google Scholar]
Hooper 2004a
- Hooper L, Bartlett C, Davey Smith G, Ebrahim S. Advice to reduce dietary salt for prevention of cardiovascular disease. Cochrane Database of Systematic Reviews 2004, Issue 1. [DOI: 10.1002/14651858.CD003656.pub2] [DOI] [PMC free article] [PubMed] [Google Scholar]
Hooper 2004b
- Hooper L, Thompson RL, Harrison RA, Summerbell CD, Moore H, Worthington HV, et al. Omega 3 fatty acids for prevention and treatment of cardiovascular disease. Cochrane Database of Systematic Reviews 2004, Issue 4. [DOI: 10.1002/14651858.CD003177.pub2] [DOI] [PMC free article] [PubMed] [Google Scholar]
Hooper 2012
- Hooper L, Summerbell CD, Thompson R, Sills D, Roberts FG, Moore HJ, Davey Smith G. Reduced or modified dietary fat for preventing cardiovascular disease. Cochrane Database of Systematic Reviews 2012, Issue 5. [DOI: 10.1002/14651858.CD002137] [DOI] [PMC free article] [PubMed] [Google Scholar]
HPS 2011
- Heart Protection Study Collaborative Group. Effects on 11‐year mortality and morbidity of lowering LDL cholesterol with simvastatin for about 5 years in 20536 high‐risk individuals: a randomised controlled trial. Lancet 2011;378(9808):2013‐20. [DOI: 10.1016/S0140-6736(11)61125-2] [DOI] [PMC free article] [PubMed] [Google Scholar]
HSS 2005
- US Dept of Health and Human Services, US Dept of Agriculture. Dietary guidelines for Americans. http://www.healthierus.gov/dietaryguidelines/ [accessed 19 5 2005]. Washington: US Government Printing Office, 2005.
Kelly 2004
- Kelly S, Frost G, Whittaker V, Summerbell C. Low glycaemic index diets for coronary heart disease. Cochrane Database of Systematic Reviews 2004, Issue 4. [DOI: 10.1002/14651858.CD004467.pub2] [DOI] [PubMed] [Google Scholar]
Kelly 2007
- Kelly SAM, Summerbell CD, Brynes A, Whittaker V, Frost G. Wholegrain cereals for coronary heart disease. Cochrane Database of Systematic Reviews 2007, Issue 2. [DOI: 10.1002/14651858.CD005051.pub2] [DOI] [PubMed] [Google Scholar]
Knoops 2004
- Knoops KTB, Groot LCPM, Kromhout D, Perrin AE, Moreiras‐Varela O, Menotti A, et al. Mediterranean diet, lifestyle factors, and 10 year mortality in elderly European men and women. JAMA 2004;12:1433‐9. [DOI] [PubMed] [Google Scholar]
Law 2009
- Law MR, Morris JK, Wald NJ. Use of blood pressure lowering drugs in the prevention of cardiovascular disease: meta‐analysis of 147 randomised trials in the context of expectations from prospective epidemiological studies. BMJ 2009;338:b1665. DOI: 10.1136. [DOI] [PMC free article] [PubMed] [Google Scholar]
Lefebvre 2011
- Lefebvre C, Manheimer E, Glanville J. Chapter 6: Searching for studies. In: Higgins JPT, Green S editor(s). Cochrane Handbook for Systematic Reviews of Interventions. Version 5.1 (updated March 2011). The Cochrane Collaboration, 2011. Available from www.cochrane‐handbook.org, 2011. [Google Scholar]
Mensink 1992
- Mensink RP, Zock PL, Katan MB, Hornstra G. Effect of dietary cis and trans fatty acids on serum lipoprotein (a) levels in humans. Journal of Lipid Research 1992;33:1493‐501. [PubMed] [Google Scholar]
Moher 2001
- Moher D, Schulz KF, Altman DG. The CONSORT statement: revised recommendations for improving the quality of reports on parallel‐group randomised trial. Lancet 2001;357:1191‐4. [PubMed] [Google Scholar]
Morris 2004
- Morris JN, Deeming C. Minimum incomes for healthy living (MIHL): next thrust in UK social policy?. Policy and Politics 2004;32:441‐54. [Google Scholar]
NICE 2010
- Prevention of cardiovascular disease. NICE Public Health Guidance (PH25) 2010.
Norris 2005
- Norris SL, Zhang X, Avenell A, Gregg E, Schmid CH, Lau J. Long‐term non‐pharmacological weight loss interventions for adults with prediabetes. Cochrane Database of Systematic Reviews 2005, Issue 2. [DOI: 10.1002/14651858.CD005270] [DOI] [PubMed] [Google Scholar]
O'Flaherty 2012
- O´Flaherty M, Flores‐Mateo G, Nnoaham K, Lloyd‐Williams F, Capewell S. Potential cardiovascular mortality reductions with stricter food policies in the United Kingdom of Great Britain and Northern Ireland. Bulletin of the World Health Organization 2012;90:522–31. [DOI: 10.2471/BLT.12.000712] [DOI] [PMC free article] [PubMed] [Google Scholar]
O'Halloran 2010
- Christie J, O'Halloran P, Caan W, Cardwell CR, Young T, Rao M. Workplace‐based organisational interventions to prevent and control obesity by improving dietary intake and/or increasing physical activity. Cochrane Database of Systematic Reviews 2010, Issue 6. [DOI: 10.1002/14651858.CD008546] [DOI] [Google Scholar]
Oude Luttikhuis 2009
- Oude Luttikhuis H, Baur L, Jansen H, Shrewsbury VA, O'Malley C, Stolk RP, Summerbell CD. Interventions for treating obesity in children. Cochrane Database of Systematic Reviews 2009, Issue 1. [DOI: 10.1002/14651858.CD001872.pub2] [DOI] [PubMed] [Google Scholar]
Ramsay 1991
- Ramsay LE, Yeo WW, Jackson PR. Dietary reduction of serum cholesterol concentration: time to think again. BMJ 1991;303:953‐7. [DOI] [PMC free article] [PubMed] [Google Scholar]
Rose 1993
- Rose G. The Strategy of Preventative Medicine. Oxford University Press, 1993. [Google Scholar]
Taylor 2011
- Taylor F, Ward K, Moore THM, Burke M, Davey Smith G, Casas JP, Ebrahim S. Statins for the primary prevention of cardiovascular disease. Cochrane Database of Systematic Reviews 2011, Issue 1. [DOI: 10.1002/14651858.CD004816.pub4] [DOI] [PMC free article] [PubMed] [Google Scholar]
Thompson 2003
- Thompson RL, Summerbell CD, Hooper L, Higgins JPT, Little PS, Talbot D, et al. Dietary advice given by a dietitian versus other health professional or self‐help resources to reduce blood cholesterol. Cochrane Database of Systematic Reviews 2003, Issue 3. [DOI: 10.1002/14651858.CD001366] [DOI] [PubMed] [Google Scholar]
Thorogood 2007
- Thorogood M, Simera I, Dowler E, Summerbell C, Brunner EJ. A systematic review of population and community dietary interventions to prevent cancer. Nutrition Research Reviews 2007;20:74‐88. [doi: 10.1017/S0954422407733073] [DOI] [PubMed] [Google Scholar]
Trichopoulou 2005
- Trichopoulou A, Orfanos P, Norat T, Bueno‐de‐Mesquita B, Ocke MC, Peeters PH, et al. Modified Mediterranean diet and survival: EPIC‐elderly prospective cohort study. BMJ 2005;330:991‐5. [DOI] [PMC free article] [PubMed] [Google Scholar]
Turpeinen 1979
- Turpeinen O, Karvonen MJ, Pekkarinen M, Miettinen M, Elosuo R, Paavilainen E. Dietary prevention of coronary heart disease: the Finnish mental hospital study. International Journal of Epidemiology 1979;8:99‐118. [DOI] [PubMed] [Google Scholar]
Waters 2011
- Waters E, Silva‐Sanigorski A, Hall BJ, Brown T, Campbell KJ, Gao Y, Armstrong R, Prosser L, Summerbell CD. Interventions for preventing obesity in children. Cochrane Database of Systematic Reviews 2011, Issue 12. [DOI: 10.1002/14651858.CD001871.pub3] [DOI] [PubMed] [Google Scholar]
Watts 1992
- Watts GF, Lewis B, Brunt JNH, Lewis ES, Coltart DJ, Smith LDR, et al. Effects on coronary artery disease of lipid‐lowering diet, or diet plus cholestyramine, in the St Thomas' Atherosclerosis Regression Study (STARS). Lancet 1992;339:563‐9. [DOI] [PubMed] [Google Scholar]
WHO 2003
- World Health Organization. Technical Report Series No 916: Diet, nutrition and the prevention of chronic diseases. Report of the joint WHO/FAO expert consultation. Geneva: World Health Organization, 2003. [PubMed] [Google Scholar]
Yusuf 2009
- Yusuf S, Lonn E, Bosch J. Lipid lowering for primary prevention. Lancet 2009;373(9670):1152‐5. [DOI] [PubMed] [Google Scholar]