Abstract
Chemotherapy-induced cardiac toxicity is an undesirable yet very common effect that increases the risk of death and reduce the quality of life of individuals undergoing chemotherapy. However, no feasible methods and techniques are available to monitor and detect the degree of cardiotoxicity at an early stage. Therefore, in this project, we aim to develop a fluorescent nanoprobe to image the toxicity within the cardiac tissue induced by an anticancer drug. We have observed that vascular cell adhesion molecule 1 (VCAM1) protein alone with collagen was overly expressed within the heart, when an animal was treated with doxorubicin (DOX), because of inflammation in the epithelial cells. We hypothesize that developing a VCAM1-targeted peptide-based (VHPKQHRGGSKGC) fluorescent nanoprobe can detect and visualize the affected heart. In this regard, we prepared a poly(lactic-co-glycolic acid) (PLGA) nanoparticle linked with VCAM1 peptide and rhodamine B (PLGA–VCAM1–RhB). Selective binding and higher accumulation of the PLGA–VCAM1–RhB nanoprobes were detected in DOX-treated human cardiomyocyte cells (HCMs) compared to the untreated cells. For in vivo studies, DOX (5 mg/kg) was injected via the tail vein once in two weeks for 6 weeks (3 injection total). PLGA–VCAM1–RhB and PLGA–RhB were injected via the tail vein after 1 week of the last dose of DOX, and images were taken 4 h after administration. A higher fluorescent signal of PLGA–RhB–VCAM-1 (48.62% ± 12.79%) was observed in DOX-treated animals compared to the untreated control PLGA–RhB (10.61% ± 4.90) within the heart, indicating the specificity and targeting ability of PLGA–VCAM1–RhB to the inflamed tissues. The quantified fluorescence intensity of the homogenized cardiac tissue of PLGA–RhB–VCAM1 showed 156% higher intensity than the healthy control group. We conclude that PLGA–VCAM1–RhB has the potential to bind inflamed cardiac cells, thereby detecting DOX-induced cardiotoxicity and damaged heart at an early stage.
Keywords: targeting nanoparticle, diagnosis, chemotherapy, cardiotoxicity, VCAM1, imaging
Graphical Abstract
1. INTRODUCTION
Several cancer chemotherapeutic agents can produce cardiovascular (CV) toxicity. Anthracycline (DOX, epirubicin, and idarubicin), HER-2 inhibitor (Trastuzumab), anti-VEGF therapy agents (tyrosine kinase inhibitor, imatinib, dasatinib, nilotinib, bosutinib, sunitinib, sorafenib, axitinib, and ponatinib), and immunotherapy agents can produce CV toxicity. CV toxicity can result in acute heart failure (HF), cardiomyopathy (decreased left ventricular ejection fraction (LVEF)), myocarditis, hypertension (HTN), and atherosclerosis.1,2 The majority of the patients receiving DOX chemotherapy develop cardiomyopathy within the first year of treatment as a dose-dependent side effect.3 The heart failure-related mortality rate among the patients who received DOX ranged from 27 to 60%.4,5 It is an enormous challenge for oncologists to continue the anticancer therapy with minimum or no cardiovascular side effects, as cardiotoxicity is often asymptomatic until late stages.6,7
The currently established guidelines for screening and detecting chemotherapy-related cardiotoxicity include the noninvasive assessment of left ventricular (LV) ejection fraction (EF) for detecting myocardial dysfunction, biochemical markers such as troponin T for myocardial injury, ST2 for myocardial fibrosis, and B-natriuretic peptide (BNP) for myocardial stretch.8–12 However, none of these methods are capable of detecting cardiotoxicity at an early stage or are specific for chemotherapy-related cardiotoxicity. Therefore, the ability to detect the cardiovascular side effects at an early stage and in real time is crucial for selecting the appropriate therapy, dose amount, and interval between the dosages.13,14 Early and real-time detection of cardiotoxicity has the potential to decrease the mortality rate, improve quality of life, and halt further development of cardiovascular dysfunctions of cancer patients treated with chemotherapeutics.
Vascular cell adhesion molecule-1 (VCAM1) was initially identified as a cell adhesion molecule that helps regulate inflammation-associated vascular adhesion.15 Proinflammatory cytokines and oxidative stress activate VCAM-1 expression; excessive VCAM1 also produces chronic inflammation and diseases in some cases.15,16 Overexpression of VCAM1 was found in trastuzumab- and cisplatin-induced cardiotoxicity.17,18 Furthermore, oxidative stress plays a vital role in producing chemotherapy-induced cardiotoxicity.19 VCAM1 has also been found to be associated with heart failure and chronic heart failure.20,21 Hence, we hypothesized that VCAM1 protein expression will be increased as a result of DOX-induced cardiotoxicity.
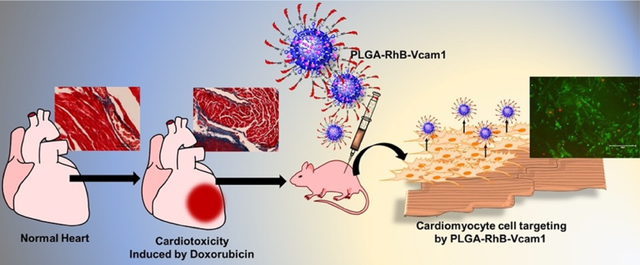
In this study, we have developed an injectable fluorescent nanoprobe to visualize cardiotoxicity by targeting VCAM1 protein, known as an inflammatory biomarker induced by anticancer drugs. The nanoparticle is composed of a biodegradable polymer, PLGA, that is chemically linked with the VCAM1 protein-targeted peptide and fluorescence dye Rhodamine B (PLGA–RhB–VCAM1). PLGA is a well-studied, biocompatible polymer approved by US FDA for drug delivery. The PLGA nanosphere plays a critical role in forming the core and facilitates the hydrophilic small molecules, dye and peptide, attached on the surface. In addition to this, the PLGA particle enhances retention in biological systems by increasing the circulating half-life of the individual small molecules. The peptide is a targeting moiety that binds with the VCAM1 protein in an inflamed heart, and RhB fluorescence dye is used to visualize the particles as well as the tissue where the particle is bound. In this study, we used DOX as a model chemotherapeutic drug as it is well studied and produces irreversible cardiotoxicity. Cardiac tissue lysates were also subjected to western blotting to observe the VCAM1 expression. The western blotting analysis of the heart tissue of a DOX-treated animal shows over 50% more VCAM1 protein expression compared to that of the heart from an untreated animal (Figure 1). This indicates that DOX-mediated cardiotoxicity resulted in the generation of excessive VCAM1 protein, and this protein can be used as a marker for chemotherapeutic induced cardiotoxicity. The imaging potentiality of VCAM1-targeted nanoprobes has been observed in both in vitro and in vivo experiments in human cardiomyocyte (HCM) cell lines and animals, respectively, to show the potentiality to bind injured tissues and to visualize the inflamed regions within the heart tissue. We also observed that the nanoprobe was stable in a simulated body fluid environment for at least 6 h and did not demonstrate any significant cytotoxicity when tested in vitro. Histological studies show that treating mice with DOX resulted in excessive collagen deposition, indicating cardiac fibrosis. The imaging modality was examined in both in vitro and in vivo and cardiotoxic mice models. Using this nanoprobe, we will be able to monitor the toxicity within cardiac cells externally and quantify the degree of toxicity by measuring the intensity and area coverage of fluorescence in the heart. This study could potentially allow patients to have an early diagnosis of chemotherapy-induced cardiotoxicity.
Figure 1.
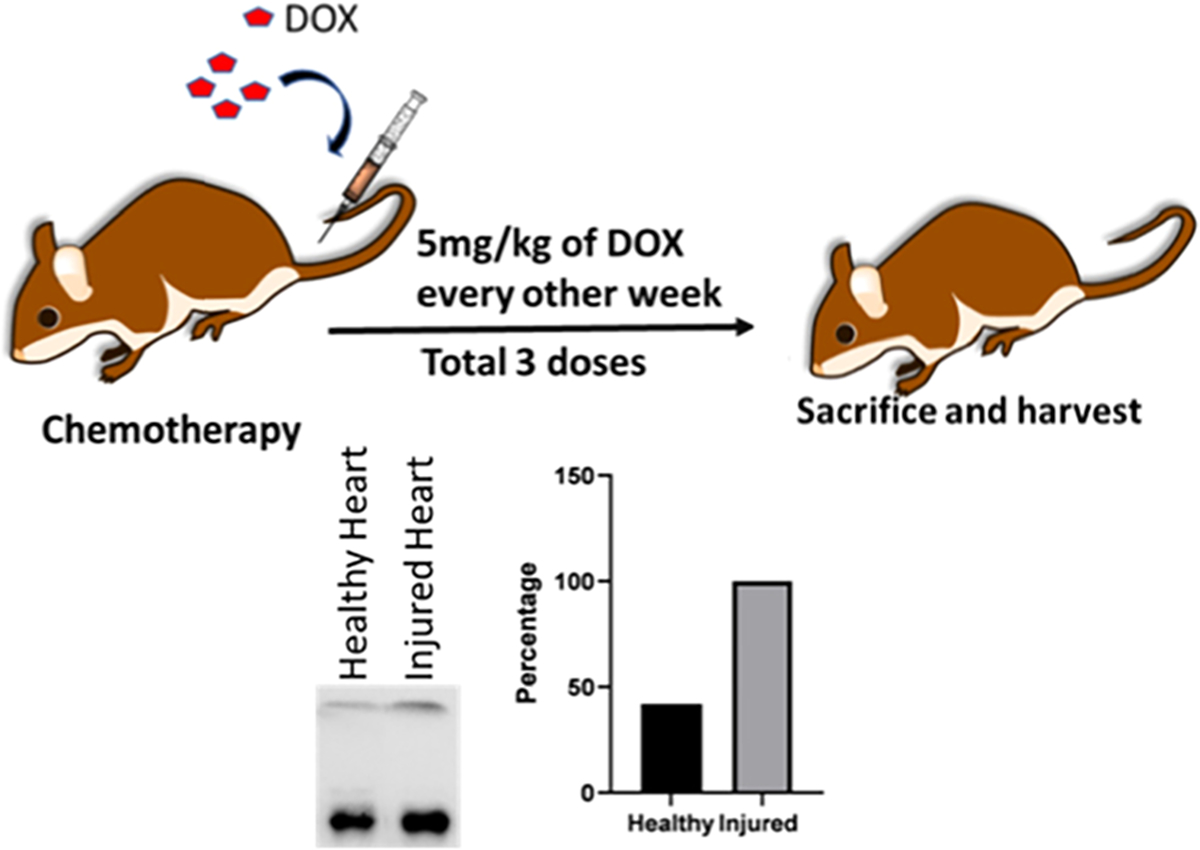
Mice were treated with a DOX dose of 5 mg/kg/week for 3 weeks prior to sacrificing and harvesting the heart. Western blot analysis of the cardiac tissue lysate shows more VCAM1 expression in injured heart treated with DOX than the healthy heart. Quantitative analysis of western blot data shows that the injured heart had 58.12% more expression of VCAM1 than the healthy heart.
2. MATERIALS AND METHODS
2.1. Materials.
PLGA (lactide: glycolide monomer ratio of 50:50; molecular weight, 12,000 Da), Polyvinyl alcohol (PVA) and Rhodamine B were purchased from Sigma–Aldrich (St. Louis, MO). VCAM1 protein was custom-synthesized and obtained from GenScript (Piscatawy, NJ). Cell culture reagents, including myocyte growth medium, supplement pack, were purchased from PromoCell (Heidelberg, Germany). Phosphate-buffered saline, penicillin–streptomycin, trypsin/EDTA, and penicillin were purchased from Gibco BRL. Vybrant MTT Cell Proliferation Assay Kit, WGA (wheat germ agglutinin), Hoechst, trichrome staining kit, and all organic solvents were purchased from Thermo Fisher Scientific, Fremont, USA. All the solvents were either HPLC-grade or American Chemical Society analytical-grade reagents. VCAM1 rabbit polyclonal antibody, secondary antirabbit antibody conjugated with Alexa 488 fluorophore, and mouse troponin I ELISA kit were purchased from Abclonal (Woburn, MA). Distilled water was of Milli-Q quality (Millipore, USA-Bedford, MD).
2.2. Synthesis of PLGA–VCAM1–RhB Nanoparticles.
2.2.1. Synthesis of PLGA–RhB.
509 mg of PLGA was dissolved in 5 mL of DCM with EDC (10 mg) and NHS (6 mg) Then, the reaction was set up overnight at room temperature. The next day, methanol/ethyl ether cosolvent (50/50 v/v) was added to precipitate the PLGA–NHS reactant and was stored in the refrigerator. Then, the solution was centrifuged for 10 min at 1700 rpm, followed by the removal of the supernatant. After washing, PLGA–NHS was lyophilized using a freeze-dryer. Then, 209 mg of PLGA–NHS and RhB (0.092 mg) was dissolved in DCM, and after overnight reaction, it was washed with cold methanol/ethyl ether cosolvent (50/50 v/v). After washing, the supernatant was discarded, and the precipitate was dried in a lyophilizer overnight to obtain PLGA–RhB.
2.2.2. Synthesis of PLGA–VCAM1.
PLGA–NHS (187 mg) and VCAM1 (0.024 mg) were dissolved in 6 mL of DCM solvent in the presence of EDC and NHS, and the mixture was magnetically stirred overnight at room temperature. The following day, the reactants were washed using a mixture of cold methanol and ethyl ether (50/50 v/v), causing the PLGA–VCAM1 conjugate to precipitate. The supernatant was discarded, and the sediment was lyophilized under high vacuum for 24 h.
2.2.3. Preparation of Nanoparticles.
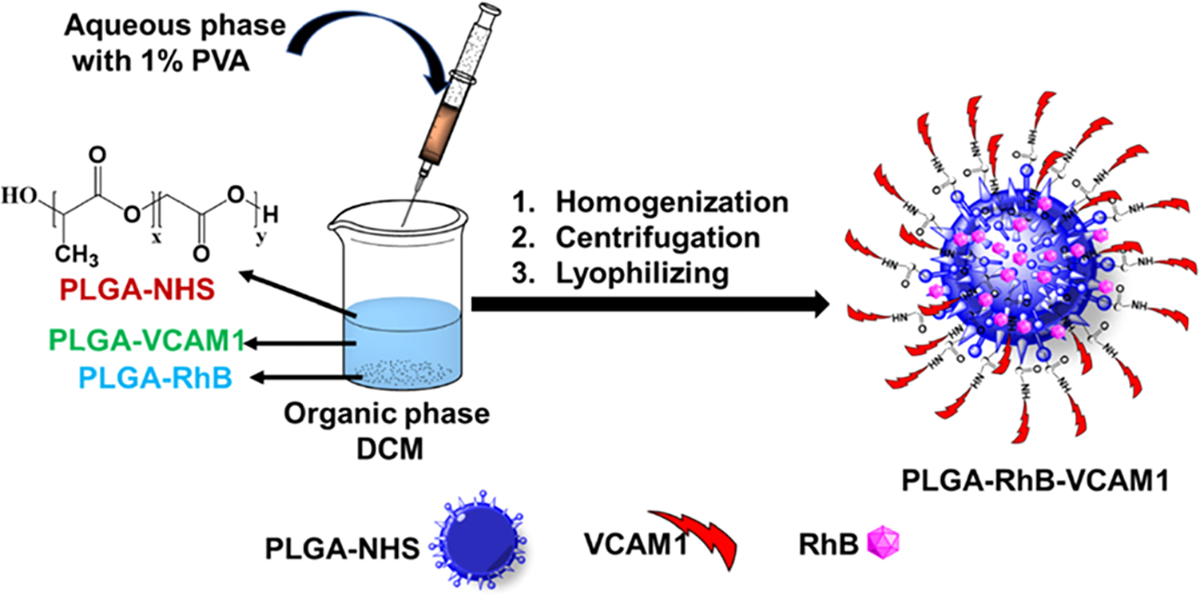
The nanoparticles were prepared using the W/O emulsion method, and the method is briefly presented in Scheme 1. To synthesize the targeting PLGA–RhB–VCAM1 nanoprobe, PLGA–NHS (16 mg), PLGA–RhB (2 mg), and PLGA–VCAM1 (2 mg) were dissolved in 5 mL of DCM. To make nontargeting PLGA–RhB nanoparticles, PLGA–NHS (16 mg) and PLGA–RhB (2 mg) were dissolved in DCM. 1% PVA was added slowly at high stirring speeds into the DCM mixture. The reaction was allowed to sit overnight at room temperature, followed by centrifugation for 30 min at 3900 rpm to separate the dispersed and continuous phases.22 Then, the supernatant was removed, followed by lyophilizing the particle under high vacuum for 24–48 h, and characterized by dynamic light scattering and zeta potential measurements to measure the particle size and zeta potential values.
Scheme 1. The Schematic Flow Shows the Process of Preparing the Nanoparticle via an Emulsion Formation Method.
2.3. Particle Characterization.
The size and zeta potential of the nanoparticles were characterized using a dynamic light scattering (DLS) instrument (Zetasizer Nano ZS, Malvern Instruments, UK) at 25 °C and a 173° scattering angle. The particles were dispersed in water at a concentration of 1 mg/mL to conduct the analysis. We have also observed the interaction between the PLGA–VCAM1 particle and VCAM1 protein using both size and zeta potential measurements. The mixture of the PLGA–VCAM1 particle and VCAM1 protein was dissolved in water and incubated at 37 °C for 30 min before measurement. The particle was also characterized using SEM and proton NMR to demonstrate the physical and chemical properties of the constructs and nanoprobe.
2.4. Stability of the Particle.
To investigate the stability of the nanoprobe, both the fluorescence intensity and the average size of the PLGA–RhB–VCAM1 particle were analyzed. The imaging nanoprobe was dissolved in PBS and PBS with 10% FBS and incubated for various durations from 0 to 6 h, but size and fluorescence intensity were measured at 0, 2, 4, and 6 h. PLGA–RhB–VCAM1 was dissolved in two different solutions at 1 mg/mL concentration, and the average diameter of the particle was then measured using DLS. The stability of the nanoparticles was examined by measuring the fluorescence intensity of RhB in both PBS and PBS with 10% FBS (V/V), which was also measured up to 6 h using a fluorometer at 450 nm for excitation and 625 nm for emission.
2.5. In Vitro Cytotoxicity.
For in vitro cytotoxicity study, human cardiomyocyte (HCM) cells were cultured according to the method published earlier.23 In brief, HCM cells were cultured at 37 °C in a humidified atmosphere containing 5% CO2 in myocyte growth media (PromoCell, Heidelberg, Germany) with a supplement. 5000 cells per well were seeded in a 96-well plate and incubated overnight. Two concentrations of DOX (2 and 0.5 μM) and 10 μL of PLGA–RhB and 10 μL of PLGA–RhB–VCAM1 were added to the cells and were kept in the incubator for 2 h. To examine the toxicity of the nanoparticles, the particle was dissolved in PBS at 1 mg/mL concentration, and 10 μL of each solution was added to the cells that were not treated with DOX. To measure cytotoxicity, an MTT assay kit (Vybrant MTT cell proliferation assay kit, Thermo Fisher) was used according to the manufacturer’s instructions.24 10 μL of the MTT solution was mixed with 100 μL of the culture medium. After 4 h of incubation, 100 μL of SDS–HCl solution was added to each well and thoroughly mixed. The plate was then incubated for another 12 h in a humidified chamber, and afterward, the sample was mixed followed by measuring the absorbance at 570 nm.25 Healthy cells without DOX treatment were used as a control; background absorbance was subtracted from each value, and the cell viability percentage was measured.
2.6. Cellular Uptake of PLGA Nanoprobe.
The cellular uptake of RhB–VCAM1 and PLGA nanoparticles was observed under a microscope using HCM cells. To conjugate RhB with VCAM1, both VCAM1 and RhB were dissolved in DCM with EDC and NHS and kept stirring overnight. Then, RhB–VCAM1 was collected after solvent evaporation and lyophilization. The images of cellular internalization of PLGA–RhB–VCAM1 were captured using a fluorescence microscope. 1000 cells were seeded in each well in a 48-well plate and were treated with 0.5 μM of DOX in growth media for 1–3 days to create an inflammation. After the DOX treatment, 10 μL each of RhB, RhB–VCAM1, PLGA–RhB, and PLGA–RhB–VCAM1 were added to the cells. After 2 h of incubation, the cells were stained with WGA and Hoechst, and images were taken under an EVOS M5000 cell imager (Thermo Fisher, USA) to observe the cellular internalization profile of the particles.
2.7. In Vivo Imaging Analysis.
Six- to seven-week-old C57BL/6 mice (21–25 g) were purchased from Jackson Laboratory (Bar Harbor, ME, USA) and kept under specific pathogen-free conditions. All experiments were performed after approval from the Institutional Animal Care and Use Committee (IACUC) of the University of Texas at El Paso (Protocol no. A-201910-1). DOX was intravenously injected at a dose of 5 mg/kg via the tail vein every week for 3 weeks with a cumulative dose of 15 mg/kg. Seven days after the last treatment, the mice were injected with the nanoparticles (PLGA–RhB and PLGA–RhB–VCAM1) via the tail vein. After 6 h of injection, the mice were sacrificed, organs were harvested, and blood was collected for further analysis. Immediately after harvesting, fluorescent images of the heart were taken by a ChemiDoc imager (BioRad Laboratory, USA) with an image filter for Rhodamine B and 15 s exposure time. The heart of a healthy mouse without treatment was used as a negative control.
2.8. Assessment of Cardiotoxicity and Measurement of VCAM1 Protein.
WB (Western blot) was conducted with the proteins collected from HCM cell lysates and from the heart tissue. The hearts were homogenized mechanically with RIPA buffer and centrifuged at 4 °C at 12000 rpm for 20 min. The supernatant was collected carefully without disturbing the pellet and used for WB analysis to measure the VCAM1 protein content. The cell lysate was also collected from the HCM cell treated with DOX. The protein concentrations were estimated by the Bradford method, where equal concentrations of protein were loaded in each well, and β actin was used as a control. The serum of the different groups of mice was measured for troponin I by ELISA to confirm the cardiotoxicity.
2.9. Histology of Tissue.
Immunohistochemistry, hematoxylin and eosin (H&E) staining, and trichrome staining of the tissue were conducted according to the method reported earlier.24 The tissue was dehydrated in increasing concentrations of ethanol, followed by xylene and then paraffin emersion. The paraffin-embedded tissue was sectioned at 5 μm thickness.26 Immunohistochemistry was done to measure the expression of VCAM1. H&E staining was done to examine the tissue morphology and to visualize any sign of inflammation. Fibrosis was measured in the tissue by trichrome staining following the manufacturer’s instruction.
2.10. Statistics.
GraphPad Prism 9 software was used for the statistical analysis of the data and to generate graphs. Statistically significant differences among experimental conditions were evaluated by t test. P < 0.05 was accepted as statistically significant. Error bars represent standard deviation.
3. RESULTS AND DISCUSSION
3.1. Synthesis and Particle Characterization.
PLGA–RhB–VCAM1 particles were synthesized to detect chemotherapy-induced cardiotoxicity. Here, RhB is used as a fluorescent dye to visualize the accumulation of the particles, and VCAM1 peptide is used as a targeting agent to bind with VCAM1 protein. This imaging nanoprobe binds with VCAM1, a possible marker for cardiac injury.
The free PLGA nanoparticles were found to have an average diameter of 200.13 nm. After conjugating with VCAM1 and RhB, the particle size increased by 29.21%. The VCAM1-conjugated PLGA nanoparticle had an average particle size of 241.43 ± 1.72 nm in diameter, with a polydispersity index (PDI) of 0.28 ± 0.031, and a zeta potential of −3.33 ± 0.16 mV. However, the average size of PLGA nanoparticles was 203.9 ± 0.16 nm in diameter (PDI: 0.383 ± 0.009), and zeta potential was −14.33 ± 0.737 mV (Figure 2). The changes in the particle size and zeta potential of the nanoparticles confirm the presence of the peptide and fluorescent dye on the surface that resulted in an increment of the size. The SEM image confirms the smooth surface and size of the nanoparticle. According to previous research, the size of an imaging particle that ranges from 300 to 400 nm is optimum for myocardial imaging.27 The stability of PLGA–VCAM1–RhB was measured by monitoring the changes in the fluorescence intensity and particle sizes of the nanoparticles. The particle size and zeta potential of the PLGA–RhB–VCAM1 nanoparticle-conjugated protein were 244.83 ± 7.90 nm (in diameter) and −5.57 ± 0.41 mV, respectively. The negative shift of zeta potential of the particle confirms the proper conjugation of the VCAM1 protein with the VCAM1 peptide present on the nanoparticle surface, as VCAM1 protein is negatively charged.28,29 However, there was no significant difference in size between the lone nanoparticle and the nanoparticle conjugated with protein. However, proton NMR analysis of PLGA–RhB–VCAM1 (Figure 2), PLGA, PLGA–RhB, and VCAM1 (Figure S1) confirms the conjugation of the particle.
Figure 2.
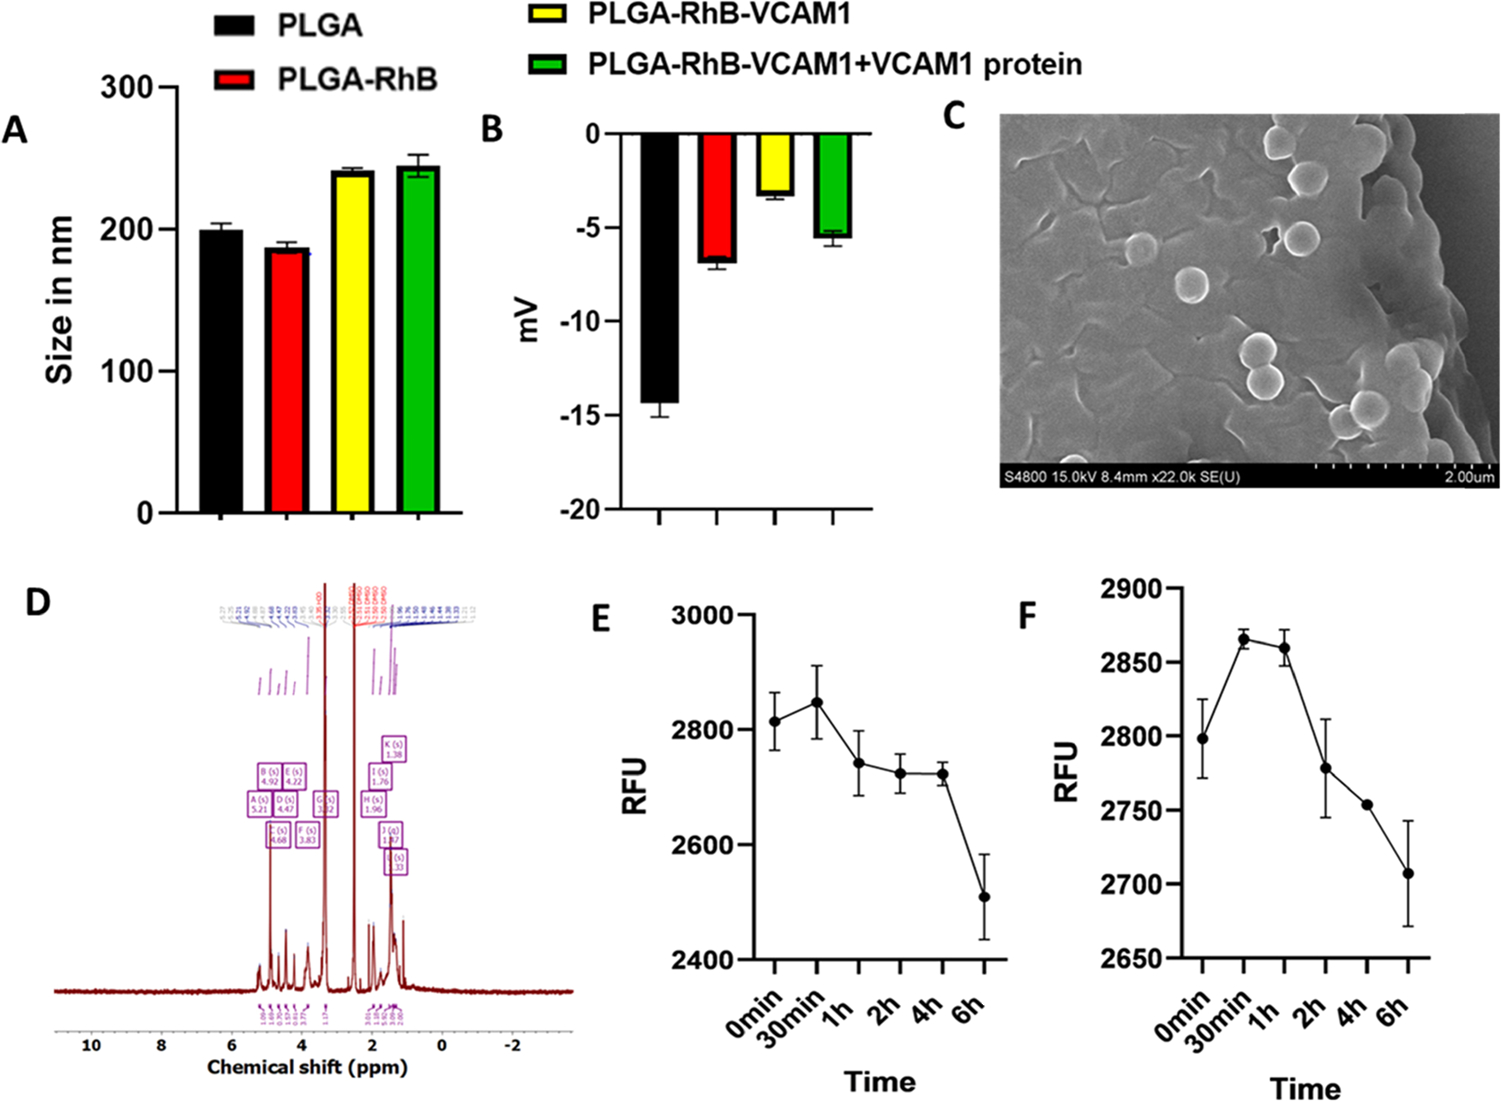
Characterization of the nanoprobe. Particle size (A), zeta potential (B), stability in PBS(C), and stability in FBS (10%) (D). Particle size and zeta potential of the PLGA–RhB–VCAM1 nanoparticle were 241.43 nm and −3.33 mV, respectively, whereas the PLGA nanoparticle measured only 200.1333 nm for size and −14.3 mV for zeta potential (A, B). Change in the zeta potential of PLGA–RhB–VCAM1 + VCAM1 protein indicates the conjugation of the protein with the peptide present in the particle. SEM image (C) and NMR (D) of the PLGA–VCAM1–RhB nanoparticle. Stability of the nanoprobe (PLGA–RhB–VCAM1) was measured in PBS and 10% FBS up to 6 h (E, F). The fluorescence intensity was expressed in RFU (relative fluorescence unit). In both solutions, the fluorescence intensity was observed to decrease with time. After 6 h of incubation, the intensity of the particles was decreased in PBS by 2.99 in PBS and 3.25% in 10% FBS.
The stability of the nanoparticle was examined in PBS and PBS + 10% FBS (a solution used to mimic the body’s environment). FBS is found in blood; therefore, it was used to simulate an interaction between the nanoparticle and blood. At 30 min time point, the particle showed the highest fluorescence activity. After 6 h of incubation, the fluorescence intensity of the particles was decreased by 2.99% in PBS and 3.25% in PBS + 10% FBS (Figure 2). More specifically the intensities were 2814.00, 2847.67, 2741.67, 2723.67, 2722.67, 2509.00, and 2798.19, 2865.52, 2859.62, 2778.19, 2753.90, and 2707.14 RFU at 0 min, 30 min, 1 h, 2 h, 4 h, and 6 h in PBS and PBS + 10% FBS, respectively. The results demonstrated that the fluorescence intensity of the PLGA nanoprobe slowly decreased over time and was stable in both solutions at least for 6 h. The fluorescence spectrum of PLGA–RhB–VCAM1 was also measured and at 1 mg/mL concentration, it gave the highest peak at 600 nm wavelength (Figure S2). As 1 mg/mL nanoparticle contains 0.2 mg/mL RhB, the spectrum of 0.2 mg/mL RhB was also taken.
3.2. Creating Inflamed Cells and Measuring In Vitro Cytotoxicity of Nanoparticles.
DOX is widely used in cancer chemotherapeutics, and the cardiac damage caused by DOX is irreversible. Therefore, in this study, we used DOX as a model molecule at a low and high dose/concentration and in order to determine the threshold for HCM injury versus death. In this regard, two different concentrations were considered to figure out the optimum dose and time in creating chronic in vitro toxicity. To assess the toxicity of DOX, an MTT cell viability assay was conducted. The objective of this in vitro experiment was to produce cellular inflammation rather than cell death. Cell viability of DOX-treated cells was compared with that of the untreated healthy HCM cells. The live cells quantified after 2, 4, 6, and 8 h of treatment with 2 μM of DOX were 45.299, 44.19,29.29, and 18.02% (Figure 3). Cell viability with 0.5 μM of DOX was 82.09, 68.09, 53.98, and 50.31% after 2, 4, 6, and 8 h of incubation, respectively. More than 50 and 70% of cells died after 2 and 8 h of DOX treatment with 2 μM concentration, leading us to conclude that this concentration is too toxic to the cell. In the following experiment, we used a 0.5 μM concentration of DOX for the in vitro study.
Figure 3.
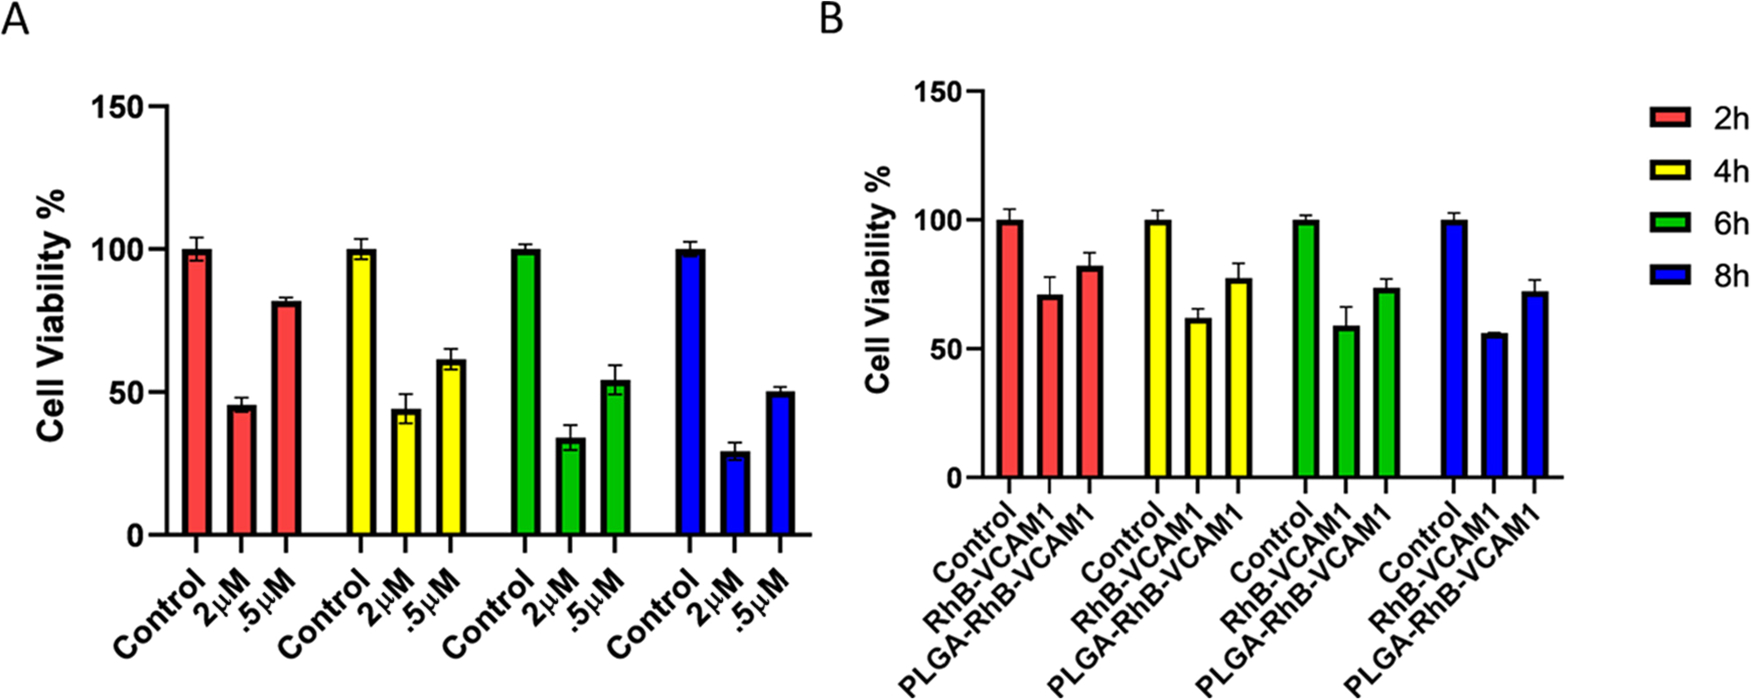
Cell viability was measured using MTT colorimetric assay after treating the cells with different concentrations (2 and 0.5 μM) of DOX, PLGA–RhB–VCAM1, and PLGA–RhB (A, B). Cell viability decreased up to 29.29 and 50.31% with 2 and 0.5 μM of DOX treatment, respectively, after 8 h (A). The toxicity study of the nanoparticles shows that the PLGA–RhB–VCAM1 nanoparticle is relatively nontoxic to the cell; here, the study was done in cells without DOX exposure. Error bar represents mean ± SD, where n = 6.
Cytotoxicity of the nanoparticles was also measured in HCM cells (Figure 3). MTT colorimetric assay was conducted following the same protocol mentioned above. 20 μL of the particle-containing solution was added to each well and incubated for 2, 4, 6, and 8 h, separately. PLGA–RhB–VCAM1 demonstrated lower toxicity than PLGA–RhB in healthy cells. PLGA–RhB–VCAM1 was found to be relatively less toxic compared to the healthy control and PLGA–RhB particle. The possible reason for the lower cell viability of PLGA–RhB is that, the same number of nanoparticles was used to measure the toxicity; hence, the quantity of dye was more in the PLGA–RhB group. PLGA is a nontoxic, biodegradable polymer, but RhB has some toxic effects,30,31 which is the reason why PLGA–RhB has a lower cell viability than PLGA–RhB–VCAM1.
A microscopic image of cells was taken after adding the nanoparticles. Figure 4 shows the changes in cell number as well as morphological changes while undergoing treatment with 0.5 μM concentration for 48 h. At lower magnification (4× and 10×), it covers more area, and a smaller number of cells are visible than the control due to the death of the cells. With 20× magnification, the morphological changes are clearly visible. There are visibly more granules and vacuoles in the treated than in the untreated group. Cytosolic vacuoles and granules were found as morphological changes in the DOX-treated cells, which is a clear indication of cytotoxicity and cell death.32 This finding supports the data found in the MTT assay.
Figure 4.
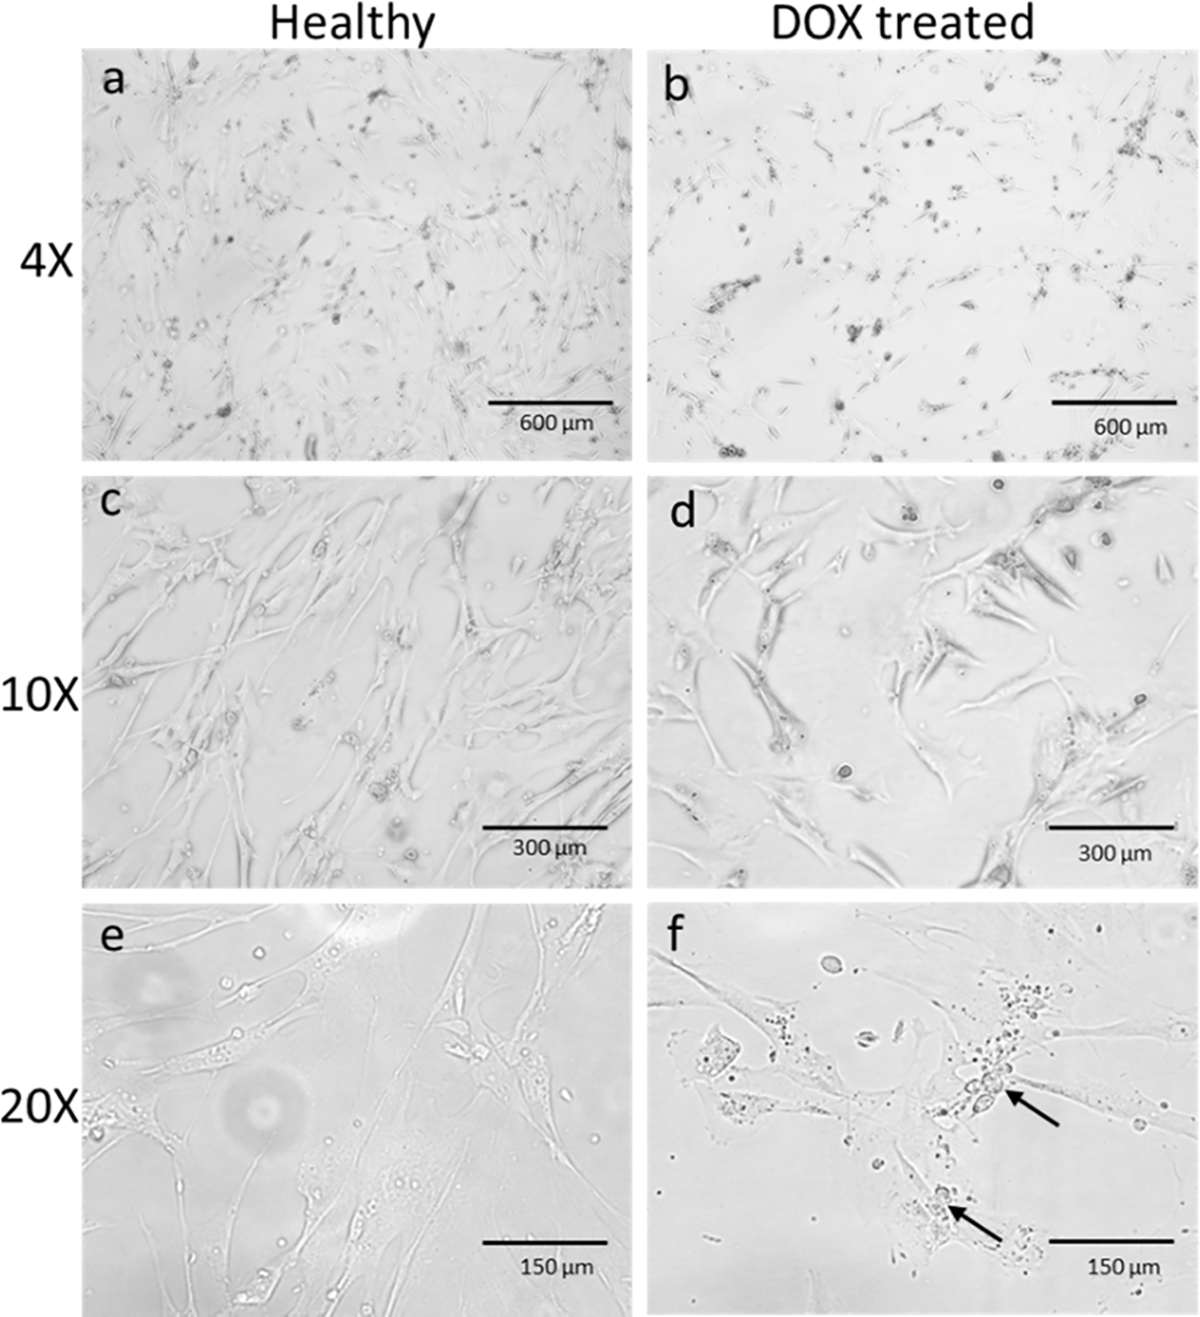
HCM cells were treated with 0.5 μM of DOX for 48 h. (a) and (b) are the microscopic images of HCM in 4× magnification. Fewer cells were observed in treated cells (b) than the untreated healthy ones (a). A decrease in the number of cells was observed clearly in 10× magnification (c, d). In (e) and (f), the cells were observed under 20× magnification. Morphological changes like vacuoles and granules were seen (arrow marked) in the inflamed cells under 20× magnification compared to healthy cells.
3.3. Increasing Accumulation of Nanoparticles with Inflamed Cardiac Cells.
To confirm our hypothesis, we first treated the cells with 0.5 μM of DOX for 24, 48, and 72 h. The cells were also subjected to treatment with 5 and 10 μM of DOX concentration to create acute toxicity. After treatment, the cell lysate was collected to perform the western blotting for evaluating VCAM1 expression. The western blotting data showed that the expression of the VCAM1 protein greatly decreased when treated with 5 and 10 μM of DOX (Figure 5A). However, there was more VCAM1 protein in the cells treated with 0.5 μM DOX, and the expression of VCAM1 increases with the increment of treatment duration. No expression of VCAM1 protein was observed in the healthy cell. Cells were also subjected to treatment for a similar time period to check if the high dose of DOX produces VCAM1 after 6 h time period. The cells were treated with 2, 5, and 10 μM for 24 h, and protein was collected for WB. No significant difference of VCAM1 expression was observed within this time period to DOX exposure, which confirms our hypothesis that acute toxicity due to DOX exposure is not significantly related with VCAM1 expression (Figure S3). Researchers found that DOX produces substantial cardiac damage in both acute and chronic conditions.33 Our study suggests that VCAM1 overexpression is mostly related with chronic damage rather than acute. These data demonstrate that VCAM1 is more prominent in chronic toxicity, unlike acute toxicity, and the healthy cell does not express that particular protein. As the objective of this study is to detect the toxicity induced by chemotherapeutics, from these findings, we can conclude that the chronic inflammation from DOX treatment likely causes the overexpression of VCAM1 protein in the heart.
Figure 5.
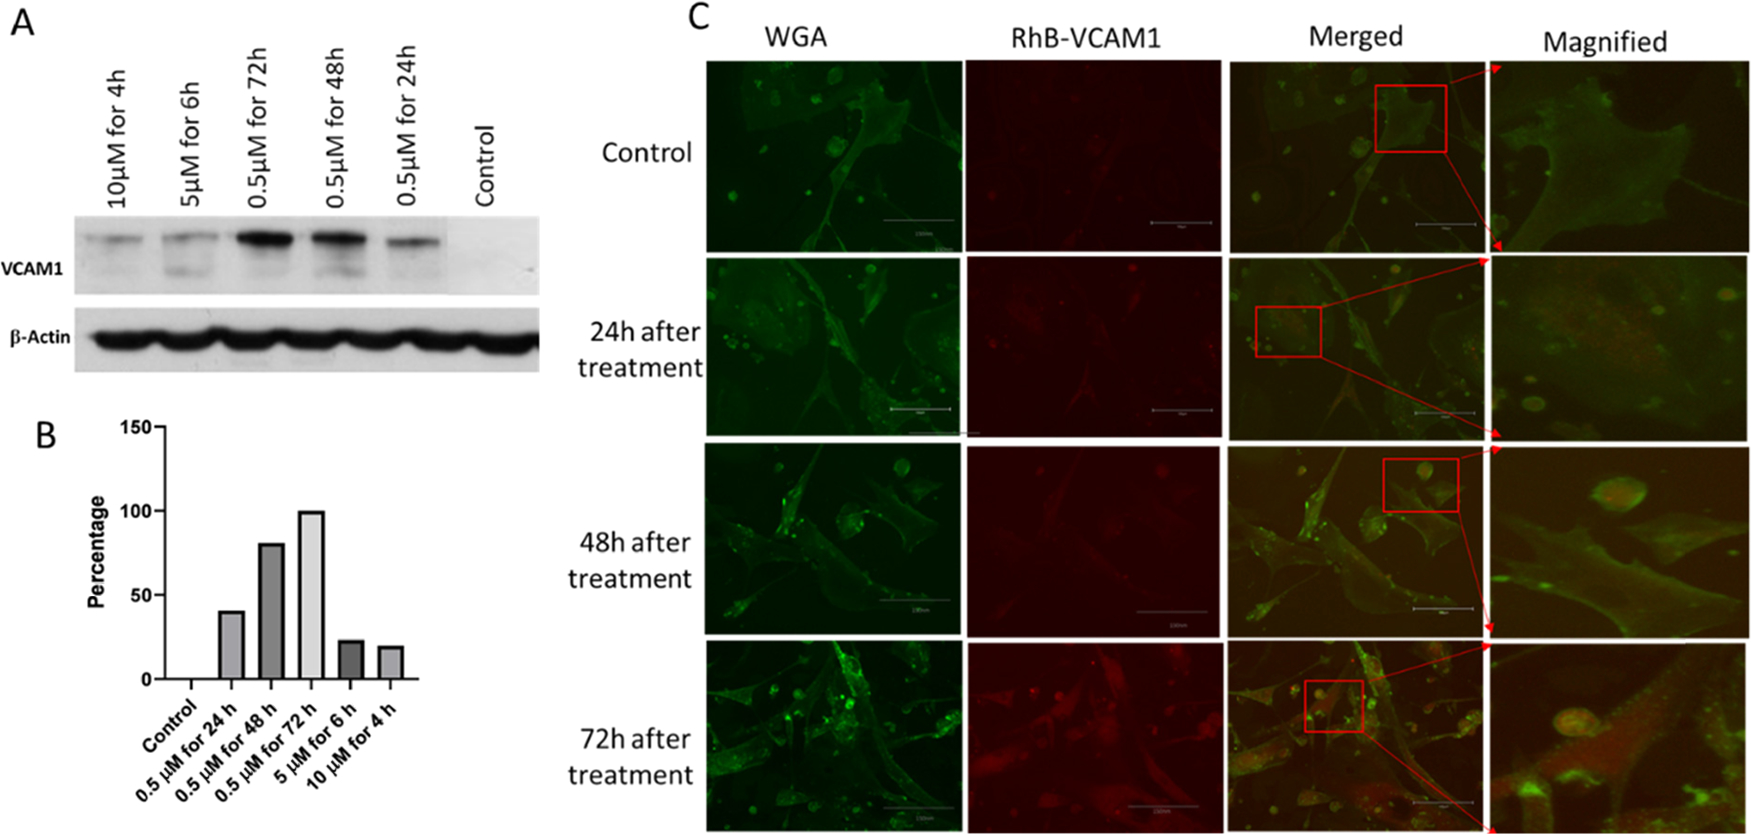
(A) Western blot analysis of VCAM1 protein in the different treatment groups (10 μM for 4 h, 5 μM for 6 h, and 0.5 μM for 72, 48, and 24 h). Proteins collected from untreated HCM cells were considered as a control. 5 μM of DOX treatment at different time points shows more expression of VCAM1 protein than acute insult with 10 and 5 μM. VCAM1 protein expression was the highest for 72 h of DOX treatment. (B) Graph representing the quantification of the WB data in percentage. (C) Microscopic image of HCM shows the cellular uptake of VCAM1–RhB in the injured cells. Control refers to healthy cells without DOX treatment. Cells were treated with 0.5 μM of DOX for 24, 48, and 72 h. Scale bar represents 300 μm.
Microscopic images of inflamed cells were taken to demonstrate the ability of the VCAM1 protein to bind with injured cells, as opposed to healthy cells. In this regard, the DOX-inflamed cells (0.5 μM of DOX for 24, 48, and 72 h) were co-incubated with VCAM1–RhB. The VCAM1 peptide was labeled with the RhB fluorescent dye to visualize the localization of the VCAM1 peptide within the cell. VCAM1–RhB (20 μL) was added to each well of inflamed cells. Co-localization of RhB and WGA indicates that VCAM1 is bound on the cell membrane of the inflamed cell, and the intensity of RhB indicates the degree of inflammation within the cell membrane. In the third column, VCAM1–RhB and the image with WGA were merged to detect the particle binding with the damaged surface expressing VCAM1 protein. The images also show that the accumulation of VCAM1–RhB increases in proportion to the duration of co-incubation (Figure 5C). DOX also shows fluorescence properties at 470 nm excitation and 560 nm emission wavelengths. To exclude the DOX interference, we treated the cells with 0.5 μM DOX for 72 h and collected the images of cells without any RhB particle (Figure S4). The image did not give any fluorescence signal, which confirms that the fluorescence ability of 0.5 μM DOX quenches over that time and the signal we observed in Figure 5C is from RhB. This image suggests that the VCAM1 peptide has binding affinity and specificity to the inflammation marker VCAM1 protein. This protein-specific binding affinity facilitates the internalization of the individual components into the inflamed cardiac cells. We have even observed a higher internalization of the VACM1 peptide for the cells that were incubated for 48 and 72 h, as the expression of VCAM1 protein seems to increase in those cells as a result of exposure of the cell to DOX for a longer period.
After confirming the internalization of RhB–VCAM1, the uptake of PLGA–RhB–VCAM1 was examined in the cells that were pretreated with DOX for 72 h. In this experiment, only the cells that were treated with DOX for 72 h were considered, as we have observed a higher inflammation within the cells and thereby a higher RhB–VCAM1 accumulation.
That is why the nanoparticle uptake study was conducted in the cells that were treated for 72 h, and the accumulation of targeted nanoparticles VCAM1(PLGA–RhB–VCAM1) was compared with the nontargeted particles (PLGA–RhB). The results show the nonspecific accumulation of PLGA–RhB in the cells, mostly observed outside the cells (Figure 6). On the other hand, the PLGA–RhB–VCAM1 nanoparticle was up-taken and internalized by the cells, suggesting that the VCAM1 peptide-linked particle can bind with the inflamed cell and has the potential to detect the zone of myocardial injury.
Figure 6.
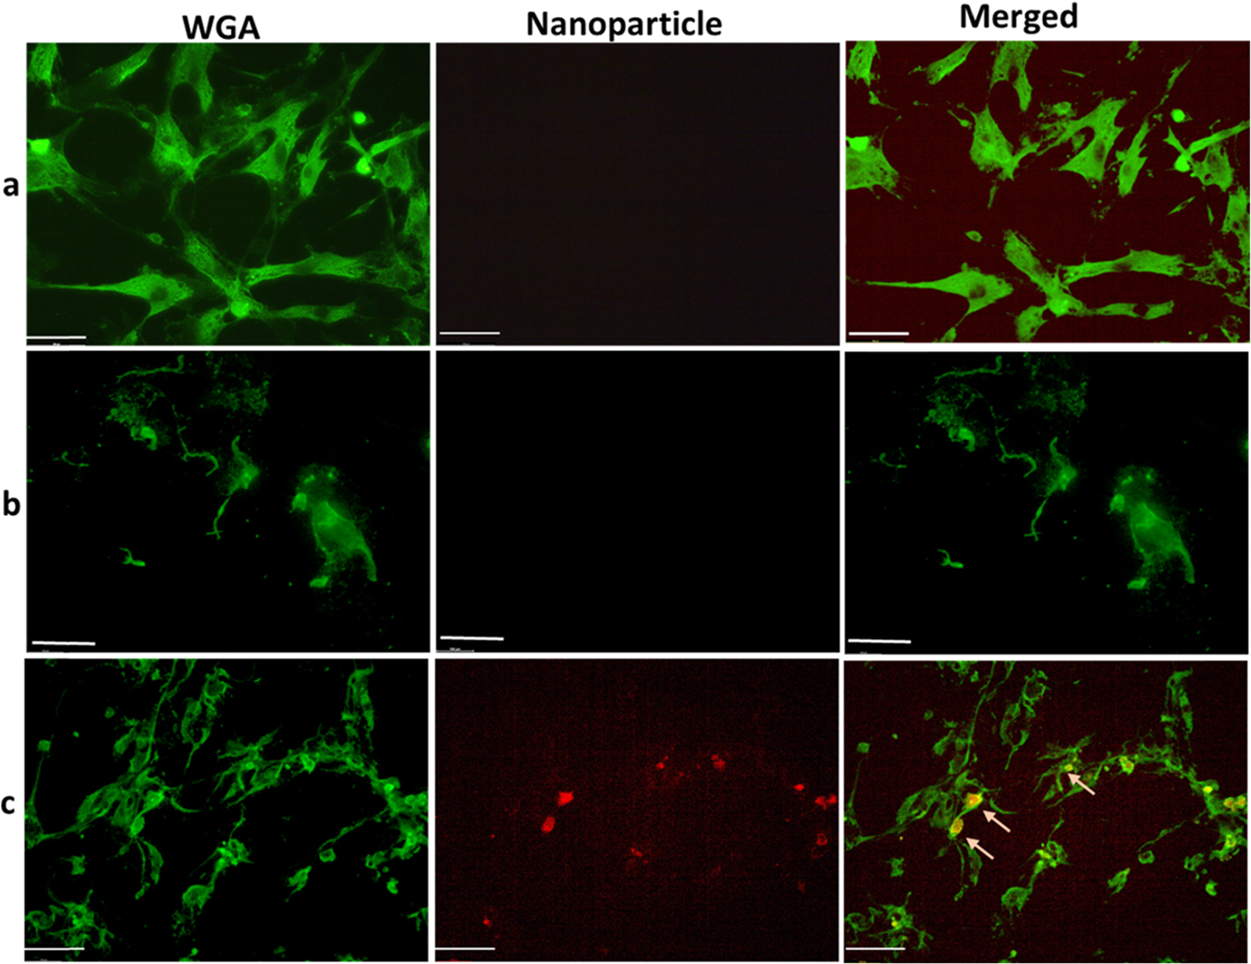
Microscopic image showing the uptake of nanoparticles in HCM. Cells were treated with 0.5 μM of DOX for 72 h to create chronic inflammation. Then, the inflamed cells were treated with PLGA–RhB (b) and PLGA–RhB–VCAM1 (c). Healthy cells were also treated with PLGA–RhB–VCAM1. Both the healthy cells and damaged cells treated with nontargeting nanoparticles show any signal of RhB (arrow in row (a, b)), whereas the imaging nanoprobe (PLGA–RhB–VCAM1) shows specific binding and internalization into the cells or cell surface (arrow in row (c)). Scale bar represents 100 μm.
3.4. In Vivo Cardiotoxic Imaging.
As chemotherapy is given in a cycle with intravenous infusion in clinic, we administered 5 mg/kg dose of DOX via the tail vein once a week for 3 weeks, as shown in Scheme 2. Seven days after the last dose, the mice were treated with PLGA–RhB–VACM1 and PLGA–RhB nanoparticles for imaging and biodistribution studies. Earlier report shows that a cumulative dose of 12–15 mg/kg can successfully produce DOX-induced cardiotoxicity without killing the mice.34,35
Scheme 2. Demonstrates the Procedure of Animal Model Preparation and Imaging Processa.

aDOX (5 mg/kg) was injected every other week for 3 times to produce a cardiotoxic mice model. Mice were divided into three groups: healthy, cardiotoxic mice injected with PLGA–RhB, and cardiotoxic mice injected with PLGA–RhB–VCAM1.
After 1 week of the last dose of DOX, the nanoparticles (PLGA–RhB and PLGA–RhB–VCAM1) were injected intravenously via the tail vein to the DOX-induced cardiotoxic mice. The animals were sacrificed, and the hearts were harvested at 4 h post nanoparticle injection. The harvested hearts and other major organs were imaged by ChemiDoc imager (BioRad Laboratory, USA) to demonstrate the presence of the nanoparticles based on the fluorescence intensity of RhB. The ex vivo images of the heart were taken immediately after the harvest. The fluorescent image shows a higher accumulation of PLGA–RhB–VCAM1 nanoparticles in the affected heart compared to the animal treated with the nontargeted particle PLGA–RhB. The fluorescent area of the heart in different groups was calculated using ImageJ. All autofluorescence was removed by the reference filter and by region of interest (ROI), allowing the genuine fluorescence to be captured. The fluorescent area was measured in percentage, and the value was 10.61% ± 4.90 and 48.62% ± 12.79% for PLGA–RhB and PLGA–RhB–VCAM1, respectively. As the inflamed heart has a higher expression of the VCAM1 protein, the particle containing VCAM1 peptide shows higher binding; thereby, accumulation within the heart was confirmed.
The images of other major organs were also considered to examine the accumulation of PLGA–RhB–VCAM1 (Figure 7A). The images were analyzed using ImageJ for measuring the mean intensity of RhB and the fluorescent area percentage. The mean intensity was measured as 190.32 in heart, whereas 154.22 in liver, 92.2 in lung, 88.79 in kidney, 53.87 in spleen, and 118.46 in intestine. No significant accumulation of particles was noticed either in previously mentioned organs by measuring the area covered with fluorescence RhB. In heart, 68.45 ± 35.83% area was found to be taken up by the particle (Figure 7). Other than heart, no significant accumulation of the particles was found on lung, liver, kidney, spleen, and intestine.
Figure 7.
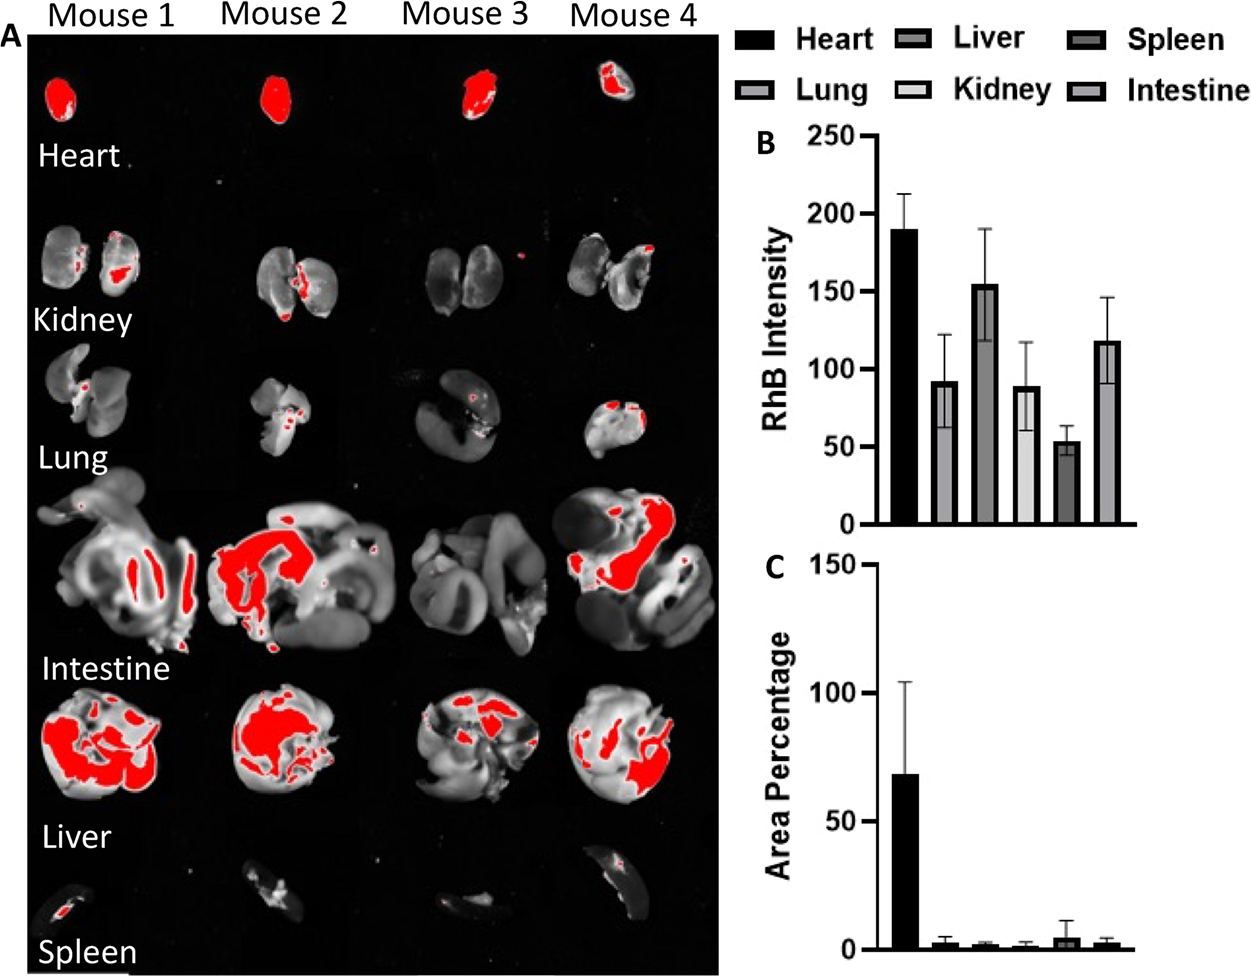
Deposition of the particle (PLGA–RhB–VCAM1) in other major organs (A). Besides heart, liver also showed higher accumulation. Intensity of RhB fluorescence was the highest in the heart (B). Area percentage of the organ was measured, and the particle did not show any significant accumulation in any organ other than heart (C).
After ex vivo imaging, the hearts were homogenized in PBS solution with a mechanical homogenizer. Followed by centrifugation, the supernatant was collected to measure the fluorescence intensity using a fluorometer. The intensity values were compared with the heart collected from a control animal that was not treated with neither DOX nor the nanoparticles. The average fluorescence intensity was measured for control (healthy untreated heart), inflamed hearts treated with PLGA–RhB, and PLGA–RhB–VCAM1 as 91.67, 151, and 235.33 RFU, respectively. All the values were calculated by subtracting the background noise. The same values were also compared in percentage. Compared to the control, the intensity for PLGA–RhB-treated mice was 164.72% and that for PLGA–RhB–VCAM1 was 256.71%. The intensity of the VCAM1 conjugated nanoparticle was 156% higher than that of the control. For PLGA–RhB, the signal was 64.72%. As adding the PLGA polymer to the dye increases the shelf-life of the peptide and fluorescence dye, the fluorescence of non-targeted PLGA–RhB was also observed in the ex vivo images of the heart (Figure 8).
Figure 8.
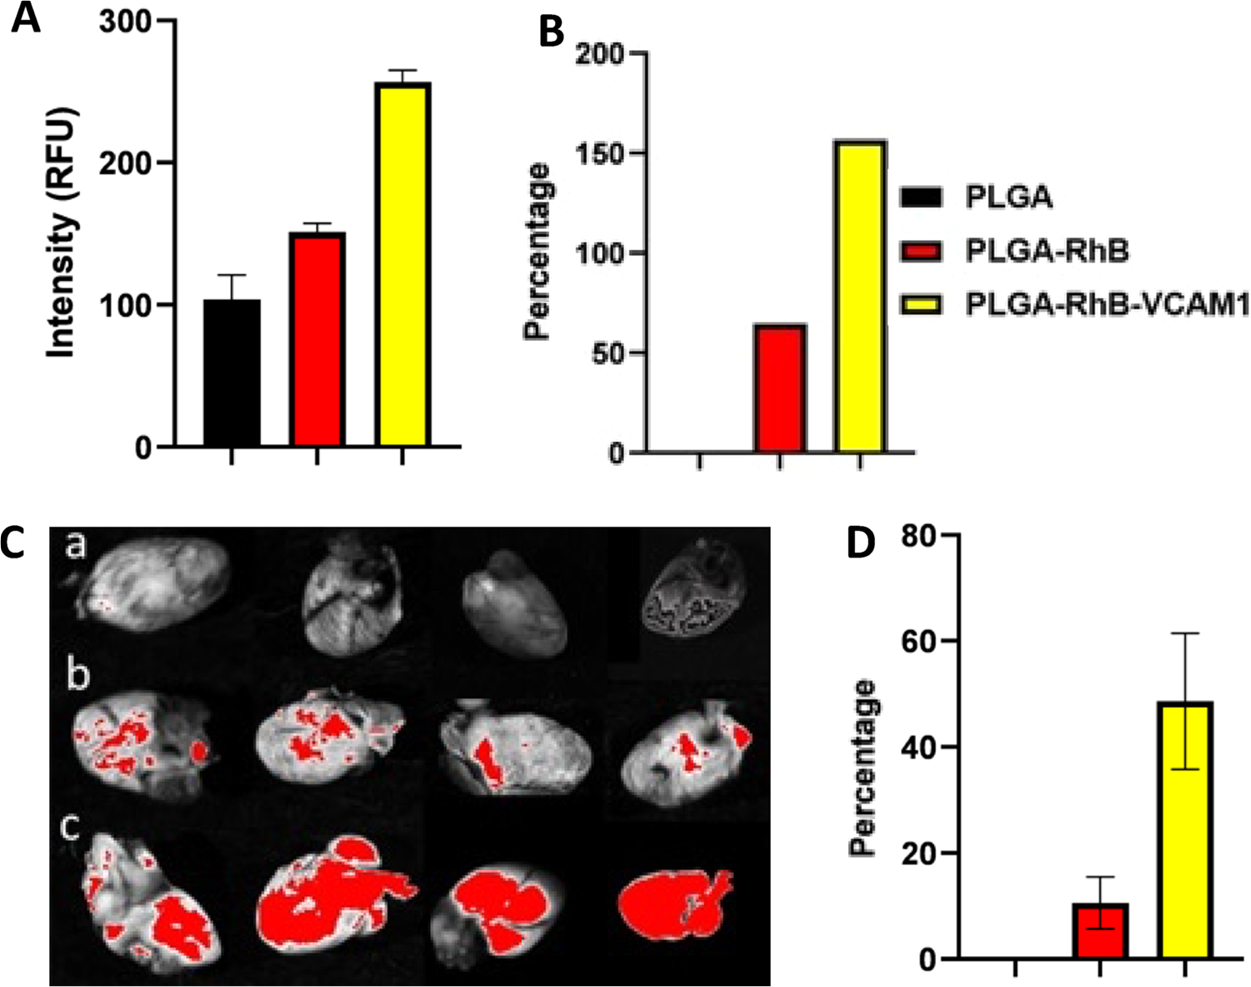
Fluorescence intensity was measured from the cell lysate of heart tissue collected from cardiotoxic mice (A, B). To create chronic DOX-induced toxicity, mice were treated with 5 mg/kg IV DOX injection for 3 weeks. The fluorescence intensity was measured from different treatment groups (healthy control, PLGA–RhB, and PLGA–RhB–VCAM1. In the treatment group. PLGA–RhB–VCAM1, fluorescence intensity was 156% higher than the control. After the mice pretreated with DOX were injected with 100 μL of PLGA–RhB and PLGA–VCAM1–RhB. Images of hearts from different groups: (a) healthy control without any treatment, (b) PLGA–RhB, and (c) PLGA–RhB–VCAM1 were taken after 4 h. (C). Group c shows more accumulation of fluorescence particles than the control. Images were analyzed in ImageJ, and the area (%) of fluorescence was plotted in GraphPad Prism (D). Fluorescence was significantly (P = 0.0057) higher in the treatment group (c) compared to the untreated group.
The harvested hearts were homogenized in RIPA buffer with freshly made protease inhibitor to run the western blotting of the VCAM1 protein. A higher expression of VCAM1 was found in damaged heart compared to healthy heart (Figure 9). Cardiac damage was also confirmed by the troponin I level in the serum of healthy mouse and cardiotoxic mouse by ELISA. The cardiotoxic mouse had a higher level of troponin I (>0.4 ng/mL) than the healthy control mouse (Figure 9). H&E staining and trichrome staining were also done to measure the inflammation and fibrosis in the heart (Figure 9). The H&E staining images demonstrated that the saline control animal has a clear and compact structure of heart tissue, which meant that there was nearly no histopathological abnormality in the healthy group. However, we have observed an opposite scenario in the heart of the DOX-treated mice, which shows signs of severe toxicity. The trichrome staining image shows the presence of an excessive amount of collagen accumulation in the inflamed heart, which is very different when compared to the image collected from healthy mice. Accumulation of collagen is an indication of severe cardiotoxicity, which is probably irreversible. As the heart was treated for several weeks, it developed an inflammatory reaction which lead to the development of fibrosis.36
Figure 9.
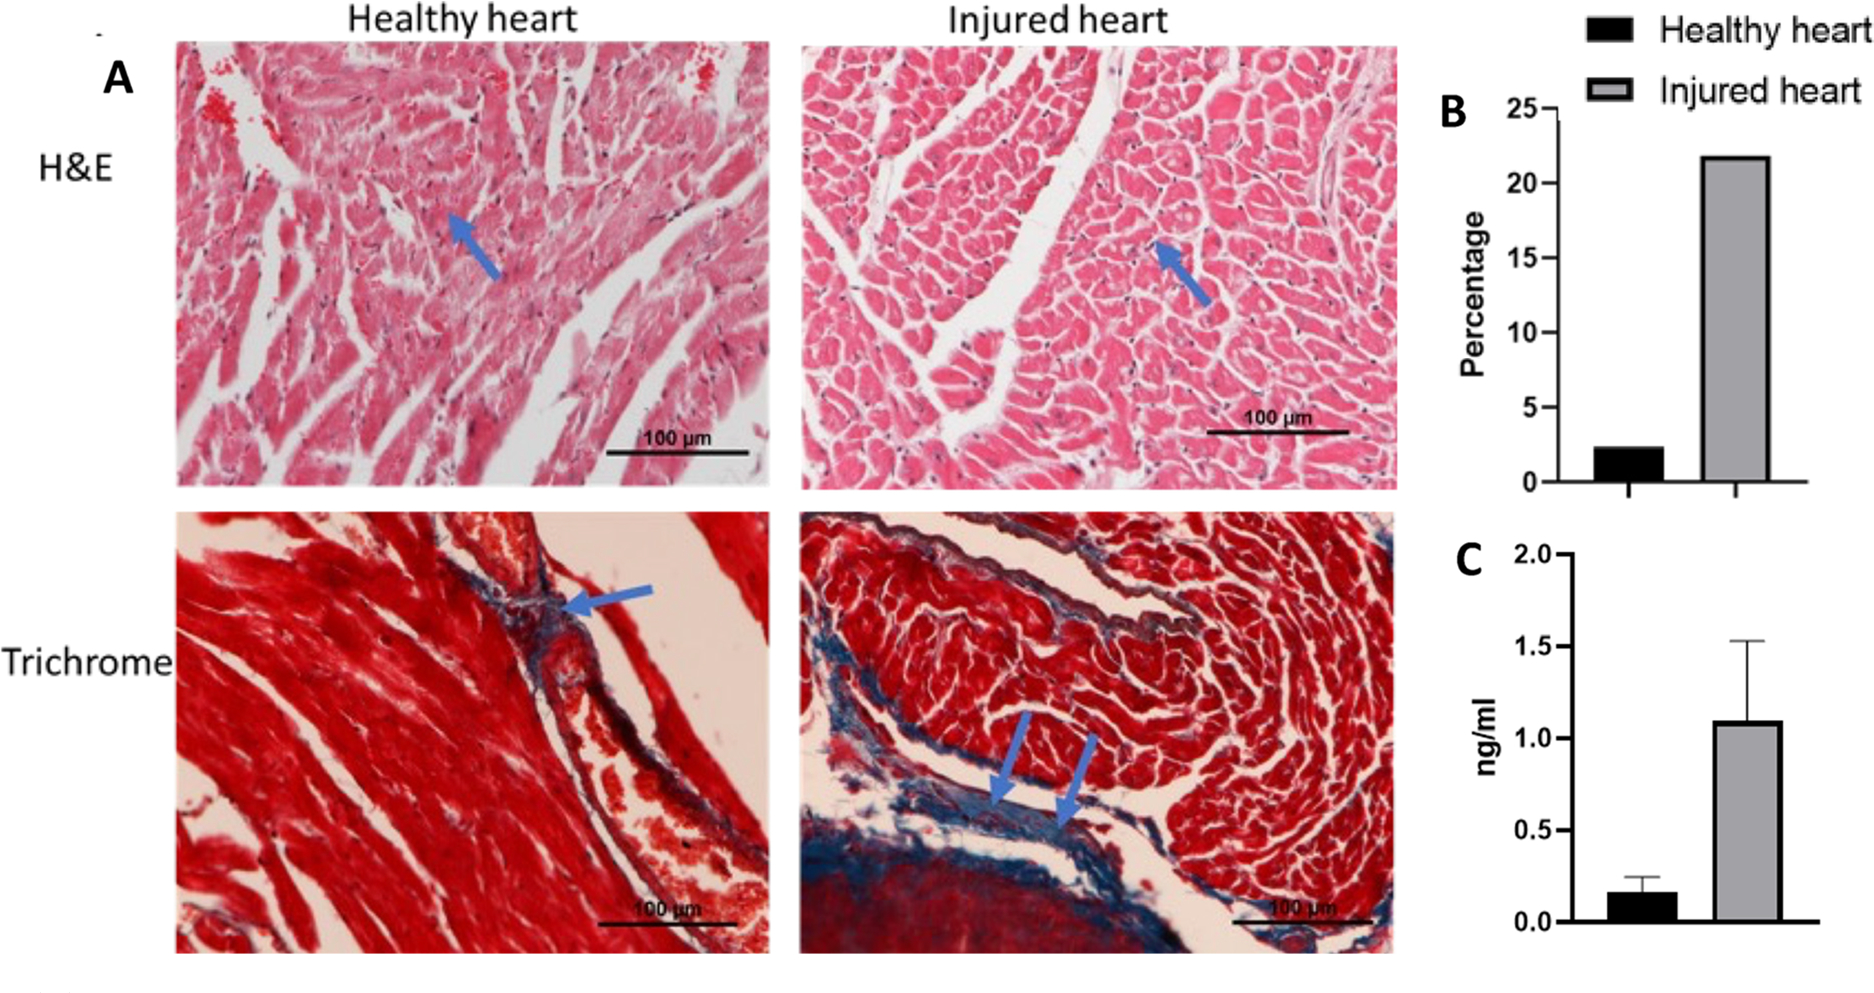
(A) Image shows the histological analysis of heart collected from the mice after treating with 5 mg/kg DOX every other week for 3 weeks. H&E staining shows more nuclear staining, indicating a greater amount of toxicity than the healthy heart, and trichrome staining shows an accumulation of collagen in the toxic heart tissue when compared to healthy tissue. (B) Quantitative data of fibrosed area after analyzing the trichrome staining image by ImageJ. Injured heart treated with DOX had more fibrosis (21.86%) compared to that of healthy heart (2.35%). (C) ELISA of serum collected from the heart shows high level of troponin I in cardiotoxic mouse than healthy mouse.
4. CONCLUSIONS
Our finding from this study demonstrated that DOX-induced cardiotoxicity resulted in the overexpression of VCAM1 protein in the affected myocardium. A targeted peptide-linked polymeric nanoparticle that is labeled with a fluorescence dye has the potential to detect cardiotoxicity. PLGA nanoparticles were prepared by the W/O emulsion method. The surface of the particles was modified with RhB to help with the visualization and the VCAM1 peptide to bind the specific area damaged by the chronic infusion of chemotherapy. In this study, it has been shown that VCAM1 is overexpressed in the heart, and PLGA–RhB–VCAM1 could be a marker for myocardial injury, as it detects the damaged area by binding with the uniquely expressed VCAM1 protein. These nanoparticles are easily made, relatively nontoxic, stable in systemic circulation for at least 6 h, and give a higher fluorescent signal in the affected heart compared to the controls. With further development and validation, this targeting imaging nanoprobe can overcome the current barrier of real-time cancer patient monitoring during chemotherapy. Our newly developed nanoprobe could help detect cardiotoxicity and compliment the currently available clinical tools. Finally, we aim to consider the near-infrared fluorescent dye to be able to image the heart in vivo and will try to test the probe using a larger animal model. Additionally, we will test the in vitro and in vivo VCAM1 expression after treatment with the current HF medications. If changes in VCAM1 expression occur with HF management, this marker could represent not only a sign of injury but also of response to therapy.
Supplementary Material
ACKNOWLEDGMENTS
We acknowledge funding by Lizanell Colbert Colwell Foundation Award No. NAID20220188 (M.N.) and Cancer Prevention Research Institute of Texas (CPRIT) through Texas Regional Excellence in Cancer Award (TREC) under Award No. PR210153. (M.N.). Research reported in this publication was partially supported by the Research Centers at Minority Institutions grant funded by the National Institute on Minority Health and Health Disparities of the National Institutes of Health under Award No. U54MD007592 (M.N.). This material is based upon the work supported by the National Science Foundation Graduate Research Fellowship under Grant No. 1744621 (B.O.P.).
Footnotes
The authors declare no competing financial interest.
ASSOCIATED CONTENT
Supporting Information
The Supporting Information is available free of charge at https://pubs.acs.org/doi/10.1021/acsami.2c13019.
NMR data, fluorescent spectrum, western blotting analysis of cell lysate, cell images upon DOX co-incubation for 72 h, and ex vivo images of sectioned heart to visualize particle accumulation within the heart tissue compared with the nontargeted particle (PDF)
Contributor Information
Humayra Afrin, Environmental Science and Engineering, University of Texas at El Paso, El Paso, Texas 79965, United States; Department of Pharmaceutical Sciences, School of Pharmacy, University of Texas at El Paso, El Paso, Texas 79902, United States.
Md Nurul Huda, Environmental Science and Engineering, University of Texas at El Paso, El Paso, Texas 79965, United States; Department of Pharmaceutical Sciences, School of Pharmacy, University of Texas at El Paso, El Paso, Texas 79902, United States.
Tamanna Islam, Environmental Science and Engineering, University of Texas at El Paso, El Paso, Texas 79965, United States; Department of Pharmaceutical Sciences, School of Pharmacy, University of Texas at El Paso, El Paso, Texas 79902, United States.
Beu P. Oropeza, Biomedical Engineering, College of Engineering, University of Texas at El Paso, El Paso, Texas 79965, United States
Efren Alvidrez, Department of Pharmaceutical Sciences, School of Pharmacy, University of Texas at El Paso, El Paso, Texas 79902, United States; Aerospace Center (cSETR), University of Texas at El Paso, El Paso, Texas 79965, United States.
Muhammad I. Abir, Aerospace Center (cSETR), University of Texas at El Paso, El Paso, Texas 79965, United States
Thomas Boland, Biomedical Engineering, College of Engineering, University of Texas at El Paso, El Paso, Texas 79965, United States.
David Turbay, Department of Pharmaceutical Sciences, School of Pharmacy, University of Texas at El Paso, El Paso, Texas 79902, United States.
Md Nurunnabi, Environmental Science and Engineering, Biomedical Engineering, College of Engineering, and Aerospace Center (cSETR), University of Texas at El Paso, El Paso, Texas 79965, United States; Department of Pharmaceutical Sciences, School of Pharmacy, University of Texas at El Paso, El Paso, Texas 79902, United States.
REFERENCES
- (1).Dong J; Chen H Cardiotoxicity of Anticancer Therapeutics. Front. Cardiovasc. Med. 2018, 5, 9. [DOI] [PMC free article] [PubMed] [Google Scholar]
- (2).Schmitz KH; Prosnitz RG; Schwartz AL; Carver JR Prospective Surveillance and Management of Cardiac Toxicity and Health in Breast Cancer Survivors. Cancer 2012, 118, 2270–2276. [DOI] [PubMed] [Google Scholar]
- (3).Swain SM; Whaley FS; Ewer MS Congestive Heart Failure in Patients Treated with Doxorubicin. Cancer 2003, 97, 2869–2879. [DOI] [PubMed] [Google Scholar]
- (4).Von Hoff DD Risk Factors for Doxorubicin-Lnduced Congestive Heart Failure. Ann. Intern. Med. 1979, 91, 710. [DOI] [PubMed] [Google Scholar]
- (5).Tallarico D; Rizzo V; di Maio F; Petretto F; Bianco G; Placanica G; Marziali M; Paravati V; Gueli N; Meloni F; Campbell SV Myocardial Cytoprotection by Trimetazidine Against Anthracycline-Induced Cardiotoxicity in Anticancer Chemotherapy. Angiology 2003, 54, 219–227. [DOI] [PubMed] [Google Scholar]
- (6).Serrano C; Cortés J; De Mattos-Arruda L; Bellet M; Gómez P; Saura C; Pérez J; Vidal M; Muñoz-Couselo E; Carreras MJ; Sánchez-Ollé G; Tabernero J; Baselga J; Di Cosimo S. Trastuzumab-Related Cardiotoxicity in the Elderly: A Role for Cardiovascular Risk Factors. Ann. Oncol. 2012, 23, 897–902. [DOI] [PubMed] [Google Scholar]
- (7).Sendur MAN; Aksoy S; Altundag K Cardiotoxicity of Novel HER2-Targeted Therapies. Curr. Med. Res. Opin. 2013, 29, 1015–1024. [DOI] [PubMed] [Google Scholar]
- (8).Seraphim A; Westwood M; Bhuva AN; Crake T; Moon JC; Menezes LJ; Lloyd G; Ghosh AK; Slater S; Oakervee H; Manisty CH Advanced Imaging Modalities to Monitor for Cardiotoxicity. Curr. Treat. Options Oncol. 2019, 20, 73. [DOI] [PMC free article] [PubMed] [Google Scholar]
- (9).Jiji RS; Kramer CM; Salerno M Non-Invasive Imaging and Monitoring Cardiotoxicity of Cancer Therapeutic Drugs. J. Nucl. Cardiol. 2012, 19, 377–388. [DOI] [PMC free article] [PubMed] [Google Scholar]
- (10).Panjrath G; Jain D Monitoring Chemotherapy-Induced Cardiotoxicity: Role of Cardiac Nuclear Imaging. J. Nucl. Cardiol. 2006, 13, 415–426. [DOI] [PubMed] [Google Scholar]
- (11).Habibian M; Lyon AR Monitoring the Heart during Cancer Therapy. Eur. Heart. J. Suppl. 2019, 21, M44–M49. [DOI] [PMC free article] [PubMed] [Google Scholar]
- (12).Kerkelä R; Ulvila J; Magga J Natriuretic Peptides in the Regulation of Cardiovascular Physiology and Metabolic Events. J. Am. Heart Assoc. 2015, 4, No. e002423. [DOI] [PMC free article] [PubMed] [Google Scholar]
- (13).López-Sendón J; Álvarez-Ortega C; Zamora Auñon P; Buño Soto A; Lyon AR; Farmakis D; Cardinale D; Canales Albendea M; Feliu Batlle J; Rodríguez Rodríguez I; Rodríguez Fraga O; Albaladejo A; Mediavilla G; González-Juanatey JR; Martínez Monzonis A; Gómez Prieto P; González-Costello J; Serrano Antolín; Cadenas Chamorro R; López Fernández T. Classification, Prevalence, and Outcomes of Anticancer Therapy-Induced Cardiotoxicity: The CARDIOTOX Registry. Eur. Heart J. 2020, 41, 1720–1729. [DOI] [PubMed] [Google Scholar]
- (14).Afrin H; Salazar CJ; Kazi M; Ahamad SR; Alharbi M; Nurunnabi M Methods of Screening, Monitoring and Management of Cardiac Toxicity Induced by Chemotherapeutics. Chinese Chem. Lett. 2022, 33, 2773–2782. [Google Scholar]
- (15).Kong D-H; Kim Y; Kim M; Jang J; Lee S Emerging Roles of Vascular Cell Adhesion Molecule-1 (VCAM-1) in Immunological Disorders and Cancer. Int. J. Mol. Sci. 2018, 19, 1057. [DOI] [PMC free article] [PubMed] [Google Scholar]
- (16).Cook-Mills JM; Marchese ME; Abdala-Valencia H Vascular Cell Adhesion Molecule-1 Expression and Signaling during Disease: Regulation by Reactive Oxygen Species and Antioxidants. Antioxid. Redox Signaling 2011, 15, 1607–1638. [DOI] [PMC free article] [PubMed] [Google Scholar]
- (17).Yi P; Li H; Fang Y; Su J; Xu C; Cao L; Li M; Chen J Administration of Trastuzumab with Heart Irradiation Induced Acute Cardiotoxicity in Mice. Am. J. Cancer Res. 2020, 10, 536–544. [PMC free article] [PubMed] [Google Scholar]
- (18).Chowdhury S; Sinha K; Banerjee S; Sil PC Taurine Protects Cisplatin Induced Cardiotoxicity by Modulating Inflammatory and Endoplasmic Reticulum Stress Responses. BioFactors 2016, 42, 647–664. [DOI] [PubMed] [Google Scholar]
- (19).Songbo M; Lang H; Xinyong C; Bin X; Ping Z; Liang S Oxidative Stress Injury in Doxorubicin-Induced Cardiotoxicity. Toxicol. Lett. 2019, 307, 41–48. [DOI] [PubMed] [Google Scholar]
- (20).Savic-Radojevic A; Radovanovic S; Pekmezovic T; Pljesa-Ercegovac M; Simic D; Djukic T; Matic M; Simic T The Role of Serum VCAM-1 and TNF-α as Predictors of Mortality and Morbidity in Patients with Chronic Heart Failure. J. Clin. Lab. Anal. 2013, 27, 105–112. [DOI] [PMC free article] [PubMed] [Google Scholar]
- (21).Wang T; Tian J; Jin Y VCAM1 Expression in the Myocardium Is Associated with the Risk of Heart Failure and Immune Cell Infiltration in Myocardium. Sci. Rep. 2021, 11, 19488. [DOI] [PMC free article] [PubMed] [Google Scholar]
- (22).Kim JS; Cho KJ; Tran TH; Nurunnabi M; Moon TH; Hong SM; Lee Y In Vivo NIR Imaging with CdTe/CdSe Quantum Dots Entrapped in PLGA Nanospheres. J. Colloid Interface Sci. 2011, 353, 363–371. [DOI] [PubMed] [Google Scholar]
- (23).Cho MO; Li Z; Shim H-E; Cho I-S; Nurunnabi M; Park H; Lee KY; Moon S-H; Kim K-S; Kang S-W; Huh KM Bioinspired Tuning of Glycol Chitosan for 3D Cell Culture. NPG Asia Mater. 2016, 8, e309–e309. [Google Scholar]
- (24).Nurunnabi M; Khatun Z; Huh KM; Park SY; Lee DY; Cho KJ; Lee Y In Vivo Biodistribution and Toxicology of Carboxylated Graphene Quantum Dots. ACS Nano 2013, 7, 6858–6867. [DOI] [PubMed] [Google Scholar]
- (25).Nurunnabi M; Nafiujjaman M; Lee S-J; Park I-K; Huh KM; Lee Y Preparation of Ultra-Thin Hexagonal Boron Nitride Nanoplates for Cancer Cell Imaging and Neurotransmitter Sensing. Chem. Commun. 2016, 52, 6146–6149. [DOI] [PubMed] [Google Scholar]
- (26).Nurunnabi M; Ibsen KN; Tanner EEL; Mitragotri S; Mitragotri S Oral Ionic Liquid for the Treatment of Diet-Induced Obesity. Proc. Natl. Acad. Sci. U. S. A. 2019, 116, 25042. [DOI] [PMC free article] [PubMed] [Google Scholar]
- (27).Chen X; Zhang Y; Zhang H; Zhang L; Liu L; Cao Y; Ran H; Tian J A Non-Invasive Nanoparticles for Multimodal Imaging of Ischemic Myocardium in Rats. J. Nanobiotechnol. 2021, 19, 82. [DOI] [PMC free article] [PubMed] [Google Scholar]
- (28).Chen Y; Molnár M; Li L; Friberg P; Gan L-M; Brismar H; Fu Y Characterization of VCAM-1-Binding Peptide-Functionalized Quantum Dots for Molecular Imaging of Inflamed Endothelium. PLoS One 2013, 8, No. e83805. [DOI] [PMC free article] [PubMed] [Google Scholar]
- (29).Gregg AJ; Schenkel AR Cloning and Structural Analysis of Equine Platelet Endothelial Cell Adhesion Molecule (PECAM, CD31) and Vascular Cell Adhesion Molecule-1 (VCAM-1, CD106). Vet. Immunol. Immunopathol. 2008, 122, 295–308. [DOI] [PubMed] [Google Scholar]
- (30).Elmowafy EM; Tiboni M; Soliman ME Biocompatibility, Biodegradation and Biomedical Applications of Poly(Lactic Acid)/Poly(Lactic-Co-Glycolic Acid) Micro and Nanoparticles. J. Pharm. Investig. 2019, 49, 347–380. [Google Scholar]
- (31).Van Tran C; La DD; Thi Hoai PN; Ninh HD; Thi Hong PN; Vu THT; Nadda AK; Nguyen XC; Nguyen DD; Ngo HH New TiO2-Doped Cu–Mg Spinel-Ferrite-Based Photocatalyst for Degrading Highly Toxic Rhodamine B Dye in Wastewater. J. Hazard. Mater. 2021, 420, 126636. [DOI] [PubMed] [Google Scholar]
- (32).Sardão VA; Oliveira PJ; Holy J; Oliveira CR; Wallace KB Morphological Alterations Induced by Doxorubicin on H9c2 Myoblasts: Nuclear, Mitochondrial, and Cytoskeletal Targets. Cell Biol. Toxicol. 2009, 25, 227–243. [DOI] [PubMed] [Google Scholar]
- (33).Desai VG; Herman EH; Moland CL; Branham WS; Lewis SM; Davis KJ; George NI; Lee T; Kerr S; Fuscoe JC Development of Doxorubicin-Induced Chronic Cardiotoxicity in the B6C3F1 Mouse Model. Toxicol. Appl. Pharmacol. 2013, 266, 109–121. [DOI] [PubMed] [Google Scholar]
- (34).Xiao J; Sun G-B; Sun B; Wu Y; He L; Wang X; Chen R-C; Cao L; Ren X-Y; Sun X-B Kaempferol Protects against Doxorubicin-Induced Cardiotoxicity in Vivo and in Vitro. Toxicology 2012, 292, 53–62. [DOI] [PubMed] [Google Scholar]
- (35).Timm KN; Perera C; Ball V; Henry JA; Miller JJ; Kerr M; West JA; Sharma E; Broxholme J; Logan A; Savic D; Dodd MS; Griffin JL; Murphy MP; Heather LC; Tyler DJ Early Detection of Doxorubicin-Induced Cardiotoxicity in Rats by Its Cardiac Metabolic Signature Assessed with Hyperpolarized MRI. Commun. Biol. 2020, 3, 692. [DOI] [PMC free article] [PubMed] [Google Scholar]
- (36).Wynn T Cellular and Molecular Mechanisms of Fibrosis. J. Pathol. 2008, 214, 199–210. [DOI] [PMC free article] [PubMed] [Google Scholar]
Associated Data
This section collects any data citations, data availability statements, or supplementary materials included in this article.


