

Abstract
Genetic studies on attention have mainly focused on children with attention‐deficit/hyperactivity disorder (ADHD), so little systematic research has been conducted on genetic correlates of attention performance and their potential brain mechanisms among healthy individuals. The current study included a genome‐wide association study (GWAS, N = 1145 healthy young adults) aimed to identify genes associated with sustained attention and an imaging genetics study (an independent sample of 483 healthy young adults) to examine any identified genes' influences on brain function. The GWAS found that TTLL11 showed genome‐wide significant associations with sustained attention, with rs13298112 as the most significant SNP and the GG homozygotes showing more impulsive but also more focused responses than the A allele carriers. A retrospective examination of previously published ADHD GWAS results confirmed an un‐reported, small but statistically significant effect of TTLL11 on ADHD. The imaging genetics study replicated this association and showed that the TTLL11 gene was associated with resting state activity and connectivity of the somatomoter network, and can be predicted by dorsal attention network connectivity. Specifically, the GG homozygotes showed lower brain activity, weaker brain network connectivity, and non‐significant brain‐attention association compared to the A allele carriers. Expression database showed that expression of this gene is enriched in the brain and that the G allele is associated with lower expression level than the A allele. These results suggest that TTLL11 may play a major role in healthy individuals' attention performance and may also contribute to the etiology of ADHD.
Keywords: functional connectivity, gene expression, GWAS, predictive modeling, sustained attention, TTLL11
TLL11 showed genome‐wide significant associations with sustained attention.
The significant effect of TTLL11 on attention‐deficit/hyperactivity disorder (ADHD) was confirmed in two ADHD genome‐wide association study results.
TTLL11 modulated the association between brain activity and sustained attention.
1. INTRODUCTION
Sustained attention is the ability to attend to and focus on an ongoing task for a continuous amount of time and it underlies other higher cognitive processes such as learning, memory, and executive control. 1 , 2 A deficit of sustained attention on the other hand is the key symptom of attention‐deficit/hyperactivity disorder (ADHD). 3 , 4 Consequently, it is of great importance to explore the neural and genetic mechanisms of sustained attention.
Pliszka et al. 5 proposed that attention relies on anterior and posterior brain systems and associated neurotransmitters, namely, dopamine and norepinephrine. 5 This theory has been supported by many subsequent studies, 6 , 7 , 8 , 9 , 10 including a recent transcriptome‐wide association study. 11 Many genes related to these two catecholamine neurotransmitters have been implicated for ADHD, such as those of dopamine transporter (DAT1), receptors (DRD2, DRD4, DRD5), and synthesis (DBH), 4 , 9 and those of norepinephrine transporter (NET1), receptor (ADRA2A), and metabolism (MAOA). 10 , 12 , 13 , 14 , 15 Genome‐wide association studies (GWAS) have also confirmed some of the genes, although the results are not consistent across studies. 11 , 16 , 17 , 18 , 19 A recent meta‐analysis identified 12 loci that were associated with ADHD. 16 However, these studies were mainly conducted with participants of European ancestries and focused on the comparison between cases of ADHD and controls. It has been found that the genetic correlation for ADHD between individuals of Han Chinese and European ancestries was low (r = 0.39, SE = 0.15) 20 and that genetic effect on attention performance differed between patients and controls. 21 Therefore, more research, particularly that of non‐Western samples such as Chinese, is needed to understand genetic bases of attention among healthy individuals.
Moreover, imaging genetics studies are needed in order to understand the brain mechanisms involved in the genetic effects on attention. 22 Such studies consider brain structure and function as the endophenotypes of behaviors of interest, which have been suggested to have stronger statistical power than behavioral measurements. 23 Earlier studies showed that attention involved a dorsal attention network (DAN) consisted of bilateral intraparietal and superior frontal cortex, which is involved in goal‐directed attention (top‐down), and a ventral attention network (VAN) consisted of right temporoparietal and inferior frontal cortex, which is involved in stimulus‐driven attention (bottom‐up). 24 , 25 Using large sample resting state fMRI data, Yeo 26 grouped the cerebral cortex into seven networks according to intrinsic functional connectivity, which included DAN and VAN. Subsequent studies reported that attention involved broader cortical and subcortical regions, including pre‐supplementary motor area, dorsomedial prefrontal cortex, dorsal premotor cortex, middle and ventrolateral prefrontal cortex, dorsolateral prefrontal cortex, anterior insula, inferior parietal lobule, temporoparietal junction, temporo‐occipital junction, middle occipital gyrus, cerebellar vermis, thalamus, putamen, midbrain and so forth, 1 , 9 , 27 , 28 confirming the involvement of DAN, VAN, somatomotor network (SMN), and the default mode network (DMN) in sustained attention. 1 , 28 , 29 , 30 , 31 , 32 , 33 , 34 On the other hand, imaging studies of ADHD also confirmed that DAN and VAN were involved in inattention, while SMN and DMN were involved in hyperactivity. 35 However, only a few studies have explored genetic effects on these brain regions when performing attention tasks. 9 , 36 , 37 We thus expected that genes associated with sustained attention might also be associated with functional connectivity of these networks.
The current study (1) conducted a genome‐wide search for genes related to sustained attention in healthy Chinese subjects (using the GWAS sample), (2) confirmed the potential role of the identified gene (TTLL11) in ADHD using previously published as well as unpublished GWAS results, (3) examined the identified gene's (TTLL11) effects on brain functional networks (using the imaging genetics sample), and (4) explored the expression and functional annotation of TTLL11 using public databases.
2. MATERIALS AND METHODS
2.1. Participants
Participants were healthy Chinese college students recruited from Beijing Normal University and Southwest University. The GWAS sample included 1145 participants (434 males and 711 females, mean age = 20.21 years and SD = 1.94, ranging from 16 to 30) who had valid genetic and sustained attention data but no brain imaging data, The imaging genetics sample included an independent sample of 483 college students from Beijing Normal University (237 males and 246 females, mean age = 21.41 years and SD = 2.25, ranging from 17 to 29) who had valid genetic and brain imaging data. Among them, 467 also had valid sustained attention data (230 males and 237 females, mean age = 21.40 years and SD = 2.25, ranging from 17 to 29). All subjects were Han Chinese, had normal or corrected‐to‐normal vision, and reported no history of psychiatric diseases, head injuries, or stroke/seizure. The study was approved by the Institutional Review Board (IRB) of the State Key Laboratory of Cognitive Neuroscience and Learning at Beijing Normal University, China. Written informed consent was obtained from each participant after a complete description of procedures.
2.2. Neuropsychological measurements
Continuous performance test (CPT) is a widely used neuropsychological measurement for sustained attention. 21 The current study used the number version of CPT on WebCNP at University of Pennsylvania (https://webcnp.med.upenn.edu/). 38 In this task, a series of red vertical and horizontal lines flash in a digital numeric frame (resembling a digital clock) against black background. The participant must press the spacebar as soon as possible when these lines form complete numbers. There are 120 trials that would form complete numbers and 240 trials that would not. Each trial flashes for 300 ms followed by a black page for 700 ms.
Four indices have been widely used in the literature to measure sustained attention during the CPT: (1) the number of failed trials in response to a target (omission errors), which are often interpreted as inattention, (2) the number of responses to the non‐targets (commission errors), which are believed to reflect either impulsivity (i.e., failures to inhibit responses to non‐targets) 39 , 40 or temporal inattention or task‐unrelated thoughts and mind wandering, 41 (3) d′ and (4) β, which are calculated according to signal detection theory, reflecting a balance between omission and commission errors as a measure of attentional capacity. 42 , 43 , 44 , 45 The log linear rule was used to treat extreme values of d′ and β. 42
2.3. Genotyping
Detailed procedures of genotyping for this dataset were reported in a previous publication. 46 Briefly, DNA were extracted from blood samples and genotyped using Infinium chips (Illumina, San Diego, CA, USA), then imputed using Michigan Imputation Server (https://imputationserer.sph.umich.edu/index.html) following their protocol using 1000G Phase 3 EAS population as reference. Imputed data were cleaned again to keep only SNPs with imputation quality r 2 > 0.8, MAF >0.05, HWE > 1 E‐6, retaining 4,856,474 SNPs. No duplicated or related subjects were identified (maximum PI_HAT = 0.0537, calculated with PLINK2) (https://www.cog-genomics.org/plink/1.9/). 47 , 48 No clear population stratification problem or outlier subjects were found by principal component analysis, most likely because this study only enrolled Han Chinese subjects.
2.4. Image acquisition and preprocessing
MR images were acquired using a Siemens Trio 3T scanner in the Brain Imaging Center of Beijing Normal University. Foam pads were used to minimize head motion. Structural MRI images were acquired using a T1‐weighted, three‐dimensional, gradient‐echo pulse sequence. Parameters for this sequence were as follows: repetition time/echo time/flip angle = 2530 ms/3.39 ms/7°, field of view = 256 × 256 mm, matrix = 256 × 256, slice thickness = 1.33 mm. One hundred and forty‐four sagittal slices were acquired to provide a high‐resolution structural image of the whole brain. Resting state functional images were acquired with single‐shot T2*‐weighted gradient‐echo EPI sequence, with the following parameters: repetition time/echo time/flip angle = 2000 ms/30 ms/90°, field of view = 200 × 200 mm, matrix = 64 × 64, slice thickness = 3.5 mm. Forty‐one interleaved axial slices parallel to the AC–PC line were obtained to cover the whole brain. A series of 200 images were acquired.
Resting state functional images were processed as described before. 49 Steps included removing first 10 volumes, slice timing correction, realignment, coregistering and normalizing to the standardized MNI space, linear detrending, nuisance regression, and temporal band‐pass filtering (0.01–0.08 Hz). Amplitude of low‐frequency fluctuation (ALFF), which reflects power of brain spontaneous activation, 50 was calculated for each subject, then smoothed (FWHM = 6 mm) and standardized.
2.5. Statistical analysis
Genome‐wide association analyses were conducted using linear regression models in PLINK2, with indices of CPT as dependent variables; genetic markers as predictors; and age, gender, and 10 principal components of the genomes as covariates. Whole genome results are shown with Manhattan plot and the most significant region was shown with LocusZoom (locuszoom.org/). 51 Then, the summary statistics from the GWAS results were inputted to MAGMA 52 and H‐MAGMA 53 for gene‐based analysis with raw genotype as reference. Gene definition was downloaded from the MAGMA website (https://ctg.cncr.nl/software/magma), using the NCBI37.3 version, resulting in 17,285 genes; annotation files for H‐MAGMA were downloaded from https://github.com/thewonlab/H-MAGMA. SNP level statistical significance threshold was set to p < 5E−8 and gene level threshold was set at Bonferroni‐corrected p < 2.89E−6 (0.05/17285).
To confirm a potential role of the gene identified by the GWAS (TTLL11), we downloaded (1) GWAS summary results of the meta‐analysis of ADHD by the Psychiatric Genomics Consortium (PGC) (http://ldsc.broadinstitute.org/ldhub/), which included 55,374 European individuals; and (2) GWAS summary results of ADHD inattentive symptom (measured by Clinical Diagnostic Interview Scale, unpublished data) on 780 Chinese Han samples reported previously. 54 We fed these results into MAGMA for gene level analysis, using the same settings as above, and determined the significance level of the effect of TTLL11 on ADHD diagnosis. For the PGC sample, the genotypes of the 1000 genome East Asian sample were used as reference; and for the Chinese ADHD sample, their raw genotypes were used.
We also calculated gene score of three Chinese samples (GWAS sample, imaging genetics sample, and Chinese ADHD sample) based on our GWAS result using the Clumping and Thresholding method. 55 The gene score is defined as the sum of allele counts (coded as 0/1/2), weighted by estimated effect sizes obtained from GWAS (beta in PLINK results). 56 , 57 Variants within the gene region were first clumped with PLINK (–clump‐p1 0.01 –clump‐p2 0.05 –clump‐r2 0.50 –clump‐kb 250) to select the most significant variant iteratively and prune out redundant correlated loci. The resulting independent variants with a p value smaller than 0.001 were used to calculate gene score.
Two power analyses were performed using the Gpower 3.1.9.7, 58 one to estimate the effect size that our GWAS SNP analysis would be able to detect (power = 80%, α = 5E−8) and the other to estimate the effect size that the gene score analysis would be able to detect (power = 80%, α = 2.89E−6). The analyses showed that our study would be able to detect effect sizes of 0.033 or greater at the SNP level and 0.027 or greater at the gene score level.
To test the specificity of the effect of the identified gene (TTLL11), we conducted two additional analyses. First, we included whole‐genome polygenic risk score (PRS, after excluding TTLL11) as a covariate. We used PRSice (http://prsice.info//) to calculate the whole genome PRS based on our GWAS results and then calculated a partial correlation between TTLL11‐based gene score and β after controlling for the whole‐genome PRS. Second, we performed a baseline analysis by randomly selecting five SNPs (the same number of SNPs used for TTLL11‐based gene score) from the LD‐pruned SNP data (SNP window = 100, r 2 = 0.8; with 607,543 SNPs remaining after excluding TTLL11 SNPs), calculating their gene score, and correlating it with β with whole‐genome PRS controlled. This procedure was repeated 1000 times to generate a distribution, which was then used to assess the magnitude of TTLL11 gene score's correlation with β.
Genetic effects on imaging data were analyzed using FMRIB's Software Library (FSL) for Linux (https://fsl.fmrib.ox.ac.uk/fsl). 59 Individual ALFF map was included in a group level analysis, with gene score as predictor. Resulting maps were corrected with Gaussian random field (GRF) correction, with voxel‐level threshold of p < 0.005 and cluster‐level threshold of p < 0.05. Identified regions were used as seeds to calculate whole brain functional connectivity (FC) for each participant, and the resulting FC map was associated to gene score in the same way as ALFF map. A moderation model was run to explore the gene‐brain‐attention relationships, with mean brain signal extracted from significant clusters as independent variable, sustained attention as dependent variable, and significant SNP(s) as moderator.
Connectome‐based predictive modeling (CPM) was further used to explore gene‐brain correlation, 60 which captures whole brain connectivity pattern rather than regional activity captured by ALFF or seed connectivity captured by FC. The brain was parcellated into 246 regions (nodes) according to the Human Brainnetome Atlas. 61 For each participant, time courses of resting state BOLD signal within each node were averaged, and the Pearson correlation coefficients between the time courses of each pair of nodes were computed, resulting in a 246 by 246 functional connectivity matrix. Prediction of connectivity matrix on gene score was tested using 10‐fold cross‐validation, controlling for age, gender, and whole genome PRS. Subjects were randomly binned into 10 groups, nine of them were used as training data and the rest as testing data. In training dataset, Pearson correlation between each edge in the connectivity matrices and gene score was performed. Features were picked out at threshold of p < 0.05. Overall strength of connectivity was calculated by summing positive and negative features separately and were further used to predict gene score by linear regression. The resulting linear model was applied to the testing dataset to get a prediction. This procedure was repeated 10 times to predict every subject. This 10‐fold cross‐validation procedure was repeated for 20 times, and the prediction values were averaged to get more robust prediction, and connections showed up every time were identified as final predictive network. 62 The Pearson correlation between this mean prediction and actual gene score was used to estimate prediction performance, and its significance was estimated using permutation procedure (1000 iterations). The gene scores were randomly shuffled and the 20 times 10‐fold CV was run for each iteration, and the correlation between average predicted gene score (of 20 times) and true gene score was calculated, then the empirical p value was calculated as the proportion of permutated correlation larger than the true correlation. 62 Results were visualized with BioImage Suite Connectivity Viewer (https://bioimagesuiteweb.github.io/webapp/connviewer.html). Also, a moderation model was run to explore whether the brain‐attention relationship varied by genotype, with the overall connectivity strength (positive strength minus negative strength) as independent variable, sustained attention (β) as dependent variable, and significant SNP(s) as moderator.
Finally, gene expression and functional annotation were searched on FUMA v1.3.6 (https://fuma.ctglab.nl/), CSEA (http://genetics.wustl.edu/jdlab/csea-tool-2/) and BrainSeq Phase2 (http://eqtl.brainseq.org/phase2/eqtl/). 63 , 64 , 65 On FUMA, we kept SNPs with GWAS p < 5E−8 and all variants in LD with them (r 2 ≥ 0.6), searched for eQTL, and mapped to genes with positional, eQTL, and 3D chromatin interaction (Hi‐C) information. 64 On CSEA, we used specificity index threshold (pSI) of 0.05 and determined enrichment of gene expression in brain through different developmental stages. On BrainSeq, we searched the eQTL results with the whole sample (postmortem DLPFC and hippocampus tissues separately on 286 schizophrenia patients and 265 controls) as recommended by the developer of the database (personal communications, October 2, 2019). 66
3. RESULTS
3.1. Behavioral performance
The mean accuracy of CPT task was 0.98, suggesting that subjects performed well on the task. The means of omission errors were 3.119 (SD = 6.797) and commission errors were 5.146 (SD = 4.627). Detection rate (d′) and response bias (β) were 4.243 ± 0.652 and 1.748 ± 4.209, respectively. These indices were significantly correlated with one another (Table S1).
3.2. Gene effect on behavior
GWAS showed that a locus on chromosome 9 was significantly associated with response bias (β). Both LD score regression intercept (λ = 0.988, SE = 0.0077) 67 and Q–Q plot (λ = 1.026) showed no inflation (Figure 1). Other indices did not show any genome‐wide significant association with genotype. The significant association with β was mapped to TTLL11 on chromosome 9q33.2 (Figure 2). Leading SNPs were rs13298112 and rs13294735 (p = 4.79E−10). These two SNPs were completely linked (r = 1, 3 kb apart), so we used rs13298112 to represent this locus in the following analysis. The genotype counts for GG homozygous, GA heterozygous, and AA homozygous individuals on rs13298112 were respectively 1034, 107, and 4, which did not deviate from Hardy–Weinberg equilibrium (χ 2 = 0.48, p = 0.49). GA and AA groups were combined to form the group of A allele carriers. The GG group showed lower mean β than did the A carriers (t = 4.17, p < 0.001, Cohen's d = 0.42), and a trend of higher mean commission errors than the latter (t = −1.754, p = 0.08, Cohen's d = −0.175) (Figure S1). Bootstrap test confirmed the statistical signficanced of the above differences with 95% confidence interval of [0.231, 3.555] for β and [−1.54, −0.04] for commission errors. No significant differences between the two groups were found for omission errors or d' (Figure S1). MAGMA gene‐based analysis confirmed the effect of TTLL11 gene on β (z = 5.08, p = 4.23 e‐8), and revealed an effect of LPA gene on d′ (z = 4.61, p = 1.99E−6). These effects again were confirmed by H‐MAGMA, with significant effects of TTLL11 gene on β (z = 5.14, p = 1.39E−07) and LPA gene on d′ (z = 4.90, p = 4.83E−07) using the annotation of adult brain and iPSC‐derived astrocyte respectively.
FIGURE 1.
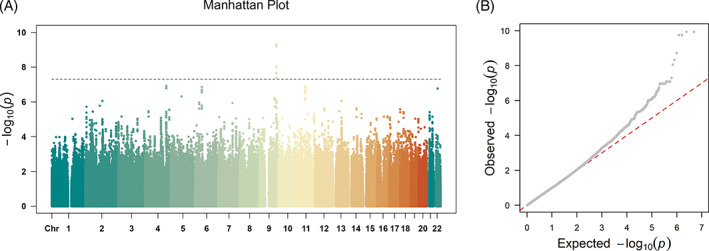
(A) Manhattan plot shows p values of the effects of SNPs on β, with the dotted line representing i = 5E−8. (B) Q–Q plot shows no inflation, with the red dotted line representing expected null distribution, and the gray curve showing observed p values
FIGURE 2.
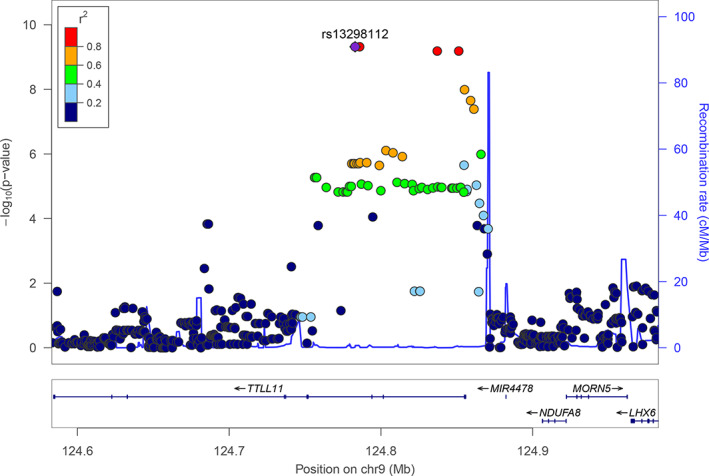
The effect of SNPs on β within ±200 kb of rs13298112, plotted by LocusZoom. Y axis of each dot represents the p value and the dots' color represents LD with rs13298112
Five SNPs (Table S2) were retained to calculate a gene score to represent TTLL11 gene. The effect size of TTLL11 gene score was 0.036, and the effect size of SNP rs13298112 was 0.035. Both effect sizes were larger than that required by power analysis. These results are also consistent with the idea that gene scores have stronger effects than do individual SNPs 68 , 69 and hence gene‐level analysis has an advantage over SNP‐level analysis. 52
3.3. Replication and retrospective confirmation of the genetic effect
Effect of TTLL11 on β was replicated in our imaging genetics sample. Effect of rs13298112 on β was close to genome‐wise significance (p = 1.65E−07), again with GG group also showing lower mean β (t = 4.96, p < 0.001, Cohen's d = 0.69, Bootstrap 95% confidence interval [0.369, 2.636]) than did the A carriers. No significant differences between the two groups were found for commission errors, omission errors or d′. MAGMA analysis revealed a significant effect of TTLL11 at the gene level (z = 3.77, p = 1.52E−05). Gene score for sustained attention of the imaging genetics sample was calculated based on the results of the GWAS sample (see the Method section for details), and significantly correlated with β (r = 0.173, p = 1.79E−04) after controlling age, gender, and two principal components of the genomes. Effect of LPA on d′ was not replicated (z = −0.29, p = 0.61), thus not explored in following analysis.
Effect of TTLL11 on attention was further confirmed by a retrospective check of published data. Two ADHD datasets (PGC and a Chinese dataset, see Method for details) were used to explore TTLL11's potential role in ADHD. Although rs13298112 did not show a significant effect on ADHD in either the PGC dataset (p = 0.88) or the Chinese dataset (p = 0.19), gene‐level analysis found significant effects of TTLL11 (p = 0.008 in the PGC dataset and p = 0.034 in the Chinese dataset). Gene score was also significantly correlated with ADHD symptoms in the Chinese dataset (r = 0.102, p = 0.001).
3.4. Assessment of specificity
The TTLL11‐based gene score and the whole‐genome PRS were significantly correlated (r = 0.168, p = 9.24E−9). The mean correlation between the random control gene score (randomly selected 1000 times) and the whole‐genome PRS was 0.052, none of them larger than 0.168. TTLL11‐based gene score was still significantly correlated with β after controlling for whole‐genome PRS (partial r = 0.129, p = 1.172 e‐5), and again stronger than that of random control gene score (mean partial r = 0.0014, only 1 out of 1000 larger than 0.129).
3.5. Gene effect on brain
The gene score of TTLL11 was significantly and positively correlated with ALFF in the right precentral gyrus and central opercular cortex, right insular cortex, left postcentral gyrus, left central opercular cortex, left Heschl's gyri, all of which are within the SMN according to Yeo 70 (Table 1 and Figure 3A). FC between these regions and right supplementary motor area, right central opercular cortex, and left postcentral gyrus were also significantly and positively correlated with gene score of TTLL11 (Table 1), and these regions were all within the SMN too (Figure 3B). Using each ALFF region as a seed to calculate FC yielded similar results (data not shown).
TABLE 1.
Brain regions showing significant correlations between the gene score of TTLL11 and ALFF/FC after Gaussian random field correction
| Brain areas (Harvard‐Oxford Cortical Structural Atlas) | Cluster size (voxels) | MNI coordinates | T value | ||
|---|---|---|---|---|---|
| x | y | z | |||
| Brain areas showing significant correlations between TTLL11 and ALFF | |||||
| Right precentral gyrus, central opercular cortex | 152 | 66 | −3 | 18 | 4.81 |
| Right insular cortex | 76 | 36 | −9 | −3 | 4.24 |
| Left postcentral gyrus | 74 | −63 | −9 | 18 | 4.54 |
| Left central opercular cortex, Heschls gyrus | 66 | −45 | −18 | 12 | 4.23 |
| Right precentral gyrus | 48 | 6 | −21 | 57 | 4.14 |
| Brain areas showing significant correlations between TTLL11 and FC | |||||
| Right supplementary motor area | 282 | 3 | −9 | 72 | 5.04 |
| Right central opercular cortex | 188 | 63 | −6 | 12 | 5.01 |
| Left postcentral gyrus | 164 | −66 | −12 | 18 | 4.14 |
Abbreviations: ALFF, amplitude of low‐frequency fluctuation; FC, functional connectivity.
FIGURE 3.
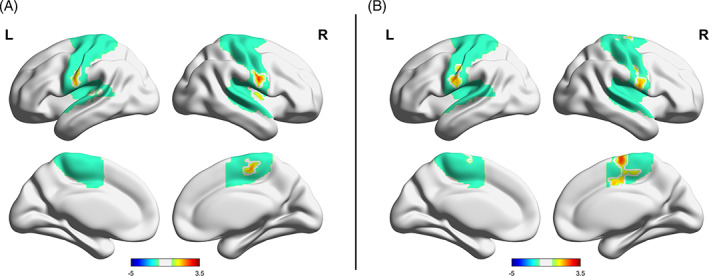
Brain regions with amplitude of low‐frequency fluctuation (A) and functional connectivity (B) significantly correlated with the gene score of TTLL11. All regions are within the somatomotor network (SMN, the green underlying region).
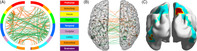
The CPM analysis revealed a brain network that was significantly correlated with gene score (r = 0.13, p < 0.05). There were 136 positive and 202 negative edges retained in the final prediction model, with right superior parietal and left inferior temporal gyrus having the highest degree, both of which belong to the DAN (Figure 4).
FIGURE 4.
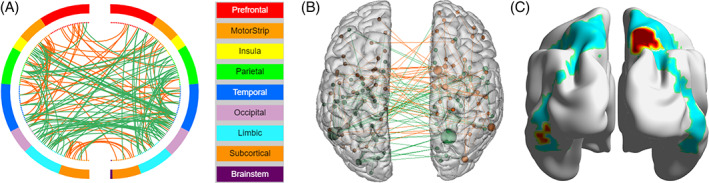
Network that significantly predicted gene score (A, red lines represent positive edges and blue line represent negative edges), with right superior parietal and left inferior temporal gyrus having the highest degree (B, size of node was proportional to degree), and both regions are within the dorsal attention network (C, green underlying region represents DAN)
Focusing on rs13298112, we compared mean ALFF/FC for the regions shown in Table 1 and connectivity strength of the network shown in Figure 3 between the GG and A carrier groups. Compared to the A carriers, the GG group showed lower ALFF (t = 4.81, p < 0.001, Cohen's d = 0.66), smaller FC (t = 4.13, p < 0.001, Cohen's d = 0.58), and weaker overall strength (t = 6.68, p < 0.001, Cohen's d = 0.93). Bootstrap test showed that the differences in ALFF, FC, and connectivity strength were robust (95% confidence intervals were [0.077, 0.196], [0.049, 0.144], [7.024, 13.470], respectively).
We further found a significant moderation effect of rs13298112 on the association between brain indices and sustained attention (β = 0.28, p < 0.05 for ALFF; and β = 0.48, p < 0.001 for connectivity strength), with the association significantly negative for A carriers (ALFF: β = −0.32, p < 0.05, 95% CI [−0.567, −0.075]; connectivity strength: β = −0.55, p < 0.001, 95% CI [−0.771, −0.318]), but not significant for the GG homozygotes (ALFF: β = −0.02, p = 0.75, 95% CI [−0.114, 0.081]; connectivity strength: β = 0.00, p = 0.996, 95% CI [−0.099, 0.100]) (Figure 5). No significant moderation effect found on FC.
FIGURE 5.
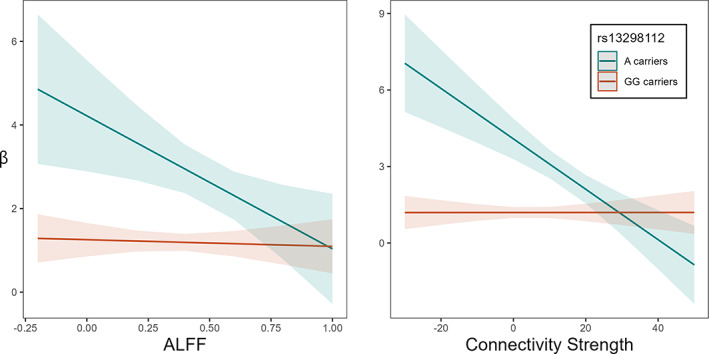
Genotype of TTLL11 rs13298112 moderates the association between sustained attention (β) and amplitude of low‐frequency fluctuation (A), and network connectivity strength (B). Significant correlations were found only in A carriers
3.6. Gene annotation
An exploration of public datasets suggests that rs13298112 was associated with the expression level of TTLL11 and this gene was expressed in the brain. BrainSeq shows that rs13298112 is strongly associated with transcripts of a region within TTLL11 (p = 9.841 e‐7 in DLPFC and p = 1.5341E−12 in the hippocampus), with GG homozygotes showing the lowest level of expression (see BrainSeq website). The same pattern was found by eQTL annotation in FUMA on GTEx V8 cerebellum tissue. CSEA analysis showed significant enrichment for the expression of TTLL11 in the striatum during early childhood and adolescence and in the cerebellum during the mid‐fetal period. MAGMA Tissue Expression Analysis on FUMA showed that genetic effect on attention was significantly associated with gene expression level in 37‐PCW old fetal brain on BrainSpan data.
Hi‐C analysis on FUMA showed significant (FDR < 1 E‐6) chromatin interaction between TTLL11 and 27 genes on chromosome 9 (Figure S2). Twenty‐six of these genes are expressed in the brain (TTLL11, DAB2IP, GPR21, GSN, LHX6, MORN5, MRRF, NDUFA8, OR1B1, OR1J1, OR1J2, OR1K1, OR1L1, OR1L3, OR1L4, OR1L6, OR1Q1, PDCL, PTGS1, RAB14, RABGAP1, RBM18, RC3H2, STOM, ZBTB26, and ZBTB6) (Figure S2). Of them, DAB2IP and LHX6 have been reported to be associated with sustained attention too. 71 , 72 , 73 TTLL11 showed a relatively stronger expression level in the cerebellum compared with other brain tissues. These results suggest that TTLL11 may contribute to sustained attention and brain function together with many other genes.
4. DISCUSSION
The current study provides the first evidence that the TTLL11 gene contributes to sustained attention in a healthy Chinese sample. Both SNP‐level and gene‐level association analyses found that this gene had significant effects on attention performance. Imaging genetics results showed that this gene was correlated with the functional activity and connectivity of brain regions within the DAN and SMN, and modulated the association between brain and sustained attention. Public gene expression data showed that this gene is highly expressed in the striatum and the cerebellum during early development (CSEA, FUMA). Finally, this gene showed a significant effect on ADHD in previous large‐sample GWAS. Taken together, all these results suggest that TTLL11 underlies attention function among healthy individuals and contributes to ADHD.
The TTLL11 gene belongs to the tubulin tyrosine ligase like (TTLL) family. 74 This gene has been found to be essential for neuronal morphogenesis and differentiation; to contribute to the molecular pathogenesis of schizophrenia, intellectual disability, and bipolar disorder 75 , 76 , 77 ; and to be associated with educational attainment. 78 The underlying mechanism for these associations may be attention because individuals with schizophrenia or bipolar disorder exhibit a deficit in sustained attention 79 , 80 and because attention is certainly vital for learning and education. Indeed, ADHD showed strong genetic correlation with educational attainment 16 and children with ADHD tend to have learning problems. 1
Our imaging genetics results suggested TTLL11 gene might influence sustained attention through attention networks. Specifically, TTLL11 had an effect on ALFF and FC in the SMN, and gene score of TTLL11 can be predicted by functional brain network with hub nodes belong to the DAN. These networks represent the intrinsic functional organization of the human brain systems that are responsible for both low‐level processes (e.g., motor control) and high‐level processes (e.g., attention). 1 , 81 , 82 The SMN was shown to be associated with sustained attention performance, 33 , 35 , 83 which may reflect the response movement in sustained attention task and may contribute to the hyperactivity aspect of ADHD. 35 The DAN is involved in the endogenous goal‐driven attention orienting (top‐down) process, and acts as critical regions for sustained attentional processes. 30 Coactivation of the DAN and the VAN has been observed frequently for attention orientation. 84 , 85 Connectivity between DAN and SMN is impaired in ADHD children too. 86 In sum, the imaging genetics data of the current study support the role of TTLL11 in the function of SMN and DAN, further suggesting that this gene influences attention.
FUMA annotation shows that the expression of TTLL11 is significantly enriched in the cerebellum, and CSEA annotation shows significant enrichment in the striatum during early childhood and adolescence and in the cerebellum during the mid‐fetal period. The cerebellum's role in attention has been reported previously, 27 so has the role of functional connectivities between the striatum and the attention networks. 3 , 35 , 87 , 88 , 89 According to BrainSeq, the GG group of rs13298112 shows a lower level of expression of TTLL11 in the brain than the A carriers. In our results, the GG group showed lower β, higher commission errors, lower ALFF and FC, weaker overall strength of resting state brain activity, and non‐significant association between these brain indices and sustained attention. The behavior pattern of the GG group was consistent with previous results. 21 In contrast, the performance of A allele carriers exhibited an opposite trend of vigilance decrements (lapse in sustained attention). 39 , 40 , 44 , 90 These results suggest that TTLL11 gene might influence brain function and then affect attention.
We should mention that, although the effect of TTLL11 on sustained attention was confirmed by multiple sources (GWAS, replication, retrospective confirmation, brain imaging data, FUMA annotation, and previous relevant literature), we found that the TTLL11 gene score was significantly correlated with the whole genome PRS. Therefore, it is plausible that TTLL11 gene score may be a proxy for more widespread polygenicity that was not detected here. Future research is needed to explore close that possibility.
Several limitations of this study need to be mentioned. First, our GWAS sample included 1145 subjects, which was under‐powered to detect small effect sizes. Therefore, our results should be interpreted with caution before the effects of TTLL11 are replicated in more studies. More powerful studies may also capture effect of other genes. Second, the effect of TTLL11 on the brain was only explored in healthy samples, this effect should be explored in ADHD samples in the future. Third, the CPT is an easy task so the accuracy rate was very high, and significant gene effects were found only on β, so further studies should replicate our results with other behavioral paradigms.
To conclude, the current study of Chinese healthy adults found that TTLL11 was associated with attention performance and the function of attention networks in the brain. Compared to the A allele carriers, GG homozygotes on rs13298112 showed lower expression of this gene, which may result in lower activity and weaker connectivity in attention networks and non‐significant associations between brain indices and sustained attention, and consequently lead to more impulsive but focused responses on the attention task. TTLL11 also showed a weak but statistically significant association with ADHD based on a re‐examination of previous datasets. Our findings suggest that TTLL11 may influence the function of brain attention networks and play a major role in healthy individuals' attention performance and may also contribute to the etiology of ADHD.
CONFLICT OF INTEREST
The authors declare no conflict of interest.
ETHICS STATEMENT
The current study was approved by the Institutional Review Board (IRB) of the State Key Laboratory of Cognitive Neuroscience and Learning at Beijing Normal University, China. Written informed consent was obtained from each participant after a complete description of procedures.
Supporting information
Figure S1. Scatter plots showing the relationship between genotype of TTLL11 rs13298112 and response bias [β] (A), sensitivity [d’] (B), omission error (C), commission error (D).
Figure S2. (A) Hi‐C revealed significant interactions between TTLL11 and 26 other genes on chromosome 9 (FDR < 1E−6, shown in orange). (B) Expression level of these genes in brain tissues (log2 transformed).
Table S1. Correlations between the four indices of sustained attention.
Table S2. SNPs used to calculate the gene scores.
ACKNOWLEDGMENTS
This work was supported by the National Natural Science Foundation of China (31571150); China Brain Initiative grant 2021ZD0201701; the 111 Project of the Ministry of Education of China (B07008); and National natural Science Foundation of China (81873803).
Liu H, Zhao X, Xue G, et al. TTLL11 gene is associated with sustained attention performance and brain networks: A genome‐wide association study of a healthy Chinese sample. Genes, Brain and Behavior. 2023;22(1):e12835. doi: 10.1111/gbb.12835
Funding information 111 Project of the Ministry of Education of China, Grant/Award Number: B07008; China Brain Initiative Grant, Grant/Award Number: 2021ZD0201701; National Natural Science Foundation of China, Grant/Award Number: 31571150; National Natural Science Foundation of China, Grant/Award Number: 81873803
DATA AVAILABILITY STATEMENT
The data of the current study are available from the corresponding author upon reasonable request. The GWAS summary results are available at https://github.com/Liuhejun/GWAS_SA.
REFERENCES
- 1. Fortenbaugh FC, DeGutis J, Esterman M. Recent theoretical, neural, and clinical advances in sustained attention research. Ann NY Acad Sci. 2017;1396:70‐91. [DOI] [PMC free article] [PubMed] [Google Scholar]
- 2. Rubia K, Smith AB, Woolley J, et al. Progressive increase of frontostriatal brain activation from childhood to adulthood during event‐related tasks of cognitive control. Hum Brain Mapp. 2006;27:973‐993. [DOI] [PMC free article] [PubMed] [Google Scholar]
- 3. Diwadkar VA, Bakshi N, Gupta G, Pruitt P, White R, Eickhoff SB. Dysfunction and Dysconnection in cortical‐striatal networks during sustained attention: genetic risk for schizophrenia or bipolar disorder and its impact on brain network function. Front Psych. 2014;5:50. [DOI] [PMC free article] [PubMed] [Google Scholar]
- 4. Liu L, Cheng J, Su Y, et al. Deficiency of sustained attention in ADHD and its potential genetic contributor MAOA. J Atten Disord. 2018;22:878‐885. [DOI] [PubMed] [Google Scholar]
- 5. Pliszka SR, McCracken JT, Maas JW. Catecholamines in attention‐deficit hyperactivity disorder: current perspectives. J Am Acad Child Adolesc Psychiatry. 1996;35:264‐272. [DOI] [PubMed] [Google Scholar]
- 6. Arnsten AF. Catecholamine modulation of prefrontal cortical cognitive function. Trends Cogn Sci. 1998;2:436‐447. [DOI] [PubMed] [Google Scholar]
- 7. Arnsten AF, Steere JC, Hunt RD. The contribution of alpha 2‐noradrenergic mechanisms of prefrontal cortical cognitive function. Potential significance for attention‐deficit hyperactivity disorder. Arch Gen Psychiatry. 1996;53:448‐455. [DOI] [PubMed] [Google Scholar]
- 8. Barnes JJM, Dean AJ, Nandam LS, O'Connell RG, Bellgrove MA. The molecular genetics of executive function: role of monoamine system genes. Biological Psychiatry. 2011;69:e127‐e143. [DOI] [PubMed] [Google Scholar]
- 9. Bellgrove MA, Mattingley JB. Molecular genetics of attention. Ann NY Acad Sci. 2008;1129:200‐212. [DOI] [PubMed] [Google Scholar]
- 10. Cho S‐C, Kim J‐W, Kim B‐N, et al. Possible association of the alpha‐2A‐adrenergic receptor gene with response time variability in attention deficit hyperactivity disorder. Am J Med Genet B: Neuropsychiatr Genet. 2008;147B:957‐963. [DOI] [PubMed] [Google Scholar]
- 11. Liao C, Laporte AD, Spiegelman D, et al. Transcriptome‐wide association study of attention deficit hyperactivity disorder identifies associated genes and phenotypes. Nat Commun. 2019;10:4450. [DOI] [PMC free article] [PubMed] [Google Scholar]
- 12. Bellgrove MA, Hawi Z, Gill M, Robertson IH. The cognitive genetics of attention deficit hyperactivity disorder (ADHD): sustained attention as a candidate phenotype. Cortex. 2006;42:838‐845. [DOI] [PubMed] [Google Scholar]
- 13. Fossella J, Sommer T, Fan J, et al. Assessing the molecular genetics of attention networks. BMC Neurosci. 2002;3:14. [DOI] [PMC free article] [PubMed] [Google Scholar]
- 14. Kim B‐N, Kim J‐W, Cummins TDR, et al. Norepinephrine genes predict response time variability and methylphenidate‐induced changes in neuropsychological function in attention deficit hyperactivity disorder. J Clin Psychopharmacol. 2013;33:356‐362. [DOI] [PubMed] [Google Scholar]
- 15. Shalev N, Vangkilde S, Neville MJ, Tunbridge EM, Nobre AC, Chechlacz M. Dissociable catecholaminergic modulation of visual attention: differential effects of catechol‐O‐methyltransferase and dopamine Beta‐hydroxylase genes on visual attention. Neuroscience. 2019;412:175‐189. [DOI] [PMC free article] [PubMed] [Google Scholar]
- 16. Demontis D, Walters RK, Martin J, et al. Discovery of the first genome‐wide significant risk loci for attention deficit/hyperactivity disorder. Nat Genet. 2019;51:63‐75. [DOI] [PMC free article] [PubMed] [Google Scholar]
- 17. Faraone SV, Larsson H. Genetics of attention deficit hyperactivity disorder. Mol Psychiatry. 2019;24:562‐575. [DOI] [PMC free article] [PubMed] [Google Scholar]
- 18. van Hulzen KJE, Scholz CJ, Franke B, et al. Genetic overlap between attention‐deficit/hyperactivity disorder and bipolar disorder: evidence from genome‐wide association study meta‐analysis. Biol Psychiatry. 2017;82:634‐641. [DOI] [PMC free article] [PubMed] [Google Scholar]
- 19. Yuan F‐F, Gu X, Huang X, et al. Attention‐deficit/hyperactivity disorder associated with KChIP1 rs1541665 in Kv channels accessory proteins. PLoS One. 2017;12:e0188678. [DOI] [PMC free article] [PubMed] [Google Scholar]
- 20. Yang L, Neale BM, Liu L, et al. Polygenic transmission and complex neuro developmental network for attention deficit hyperactivity disorder: genome‐wide association study of both common and rare variants. Am J Med Genet B: Neuropsychiatr Genet. 2013;162B:419‐430. [DOI] [PMC free article] [PubMed] [Google Scholar]
- 21. Park Y, Waldman ID. Influence of the COMT val108/158met polymorphism on continuous performance task indices. Neuropsychologia. 2014;61:45‐55. [DOI] [PMC free article] [PubMed] [Google Scholar]
- 22. Meyer‐Lindenberg A, Weinberger DR. Intermediate phenotypes and genetic mechanisms of psychiatric disorders. Nat Rev Neurosci. 2006;7:818‐827. [DOI] [PubMed] [Google Scholar]
- 23. Winkler AM, Kochunov P, Blangero J, et al. Cortical thickness or grey matter volume? The importance of selecting the phenotype for imaging genetics studies. NeuroImage. 2010;53:1135‐1146. [DOI] [PMC free article] [PubMed] [Google Scholar]
- 24. Corbetta M, Shulman GL. Control of goal‐directed and stimulus‐driven attention in the brain. Nat Rev Neurosci. 2002;3:201‐215. [DOI] [PubMed] [Google Scholar]
- 25. Fox MD, Corbetta M, Snyder AZ, Vincent JL, Raichle ME. Spontaneous neuronal activity distinguishes human dorsal and ventral attention systems. Proc Natl Acad Sci USA. 2006;103:10046‐10051. [DOI] [PMC free article] [PubMed] [Google Scholar]
- 26. Thomas Yeo BT, Krienen FM, Sepulcre J, et al. The organization of the human cerebral cortex estimated by intrinsic functional connectivity. J Neurophysiol. 2011;106:1125‐1165. [DOI] [PMC free article] [PubMed] [Google Scholar]
- 27. Langner R, Eickhoff SB. Sustaining attention to simple tasks: a meta‐analytic review of the neural mechanisms of vigilant attention. Psychol Bull. 2013;139:870‐900. [DOI] [PMC free article] [PubMed] [Google Scholar]
- 28. Sellers KK, Yu C, Zhou ZC, et al. Oscillatory dynamics in the frontoparietal attention network during sustained attention in the ferret. Cell Rep. 2016;16:2864‐2874. [DOI] [PMC free article] [PubMed] [Google Scholar]
- 29. Dixon ML, Andrews‐Hanna JR, Spreng RN, et al. Interactions between the default network and dorsal attention network vary across default subsystems, time, and cognitive states. NeuroImage. 2017;147:632‐649. [DOI] [PubMed] [Google Scholar]
- 30. Esterman M, Poole V, Liu G, DeGutis J. Modulating reward induces differential neurocognitive approaches to sustained attention. Cereb Cortex. 2017;27:4022‐4032. [DOI] [PMC free article] [PubMed] [Google Scholar]
- 31. Farahani FV, Fafrowicz M, Karwowski W, et al. Effects of chronic sleep restriction on the brain functional network, as revealed by graph theory. Front Neurosci. 2019;13:1087. [DOI] [PMC free article] [PubMed] [Google Scholar]
- 32. Li J, Kronemer SI, Herman WX, et al. Default mode and visual network activity in an attention task: direct measurement with intracranial EEG. NeuroImage. 2019;201:116003. [DOI] [PMC free article] [PubMed] [Google Scholar]
- 33. Mitko A, Rothlein D, Poole V, et al. Individual differences in sustained attention are associated with cortical thickness. Hum Brain Mapp. 2019;40:3243‐3253. [DOI] [PMC free article] [PubMed] [Google Scholar]
- 34. Pironti VA, Vatansever D, Sahakian BJ. Shared alterations in resting‐state brain connectivity in adults with attention‐deficit/hyperactivity disorder and their unaffected first‐degree relatives. Psychol Med. 2021;51:329‐339. [DOI] [PMC free article] [PubMed] [Google Scholar]
- 35. Bu X, Liang K, Lin Q, et al. Exploring white matter functional networks in children with attention‐deficit/hyperactivity disorder. Brain Commun. 2020;2:fcaa113. [DOI] [PMC free article] [PubMed] [Google Scholar]
- 36. Evans S, Clarke D, Dowell NG, et al. Using event‐related fMRI to examine sustained attention processes and effects of APOE ε4 in young adults. PLoS One. 2018;13:e0198312. [DOI] [PMC free article] [PubMed] [Google Scholar]
- 37. Parasuraman R, Greenwood PM, Sunderland T. The apolipoprotein E gene, attention, and brain function. Neuropsychology. 2002;16:254‐274. [DOI] [PMC free article] [PubMed] [Google Scholar]
- 38. Kurtz MM, Ragland JD, Bilker W, Gur RC, Gur RE. Comparison of the continuous performance test with and without working memory demands in healthy controls and patients with schizophrenia. Schizophr Res. 2001;48:307‐316. [DOI] [PubMed] [Google Scholar]
- 39. Schmidt SL, Simões E d N, Novais Carvalho AL. Association between auditory and visual continuous performance tests in students with ADHD. J Atten Disord. 2019;23:635‐640. [DOI] [PubMed] [Google Scholar]
- 40. Shaked D, Faulkner LMD, Tolle K, Wendell CR, Waldstein SR, Spencer RJ. Reliability and validity of the Conners' continuous performance test. Appl Neuropsychol Adult. 2020;27:478‐487. [DOI] [PubMed] [Google Scholar]
- 41. Rosenberg M, Noonan S, DeGutis J, Esterman M. Sustaining visual attention in the face of distraction: a novel gradual‐onset continuous performance task. Atten Percept Psychophys. 2013;75:426‐439. [DOI] [PubMed] [Google Scholar]
- 42. Hautus MJ. Corrections for extreme proportions and their biasing effects on estimated values ofd. Behav Res Methods Instrum Comput. 1995;27:46‐51. [Google Scholar]
- 43. Hvoslef‐Eide M, Nilsson SRO, Hailwood JM, et al. Effects of anterior cingulate cortex lesions on a continuous performance task for mice. Brain Neurosci Adv. 2018;2:2398212818772962. [DOI] [PMC free article] [PubMed] [Google Scholar]
- 44. Shalev N, Humphreys G, Demeyere N. Manipulating perceptual parameters in a continuous performance task. Behav Res. 2018;50:380‐391. [DOI] [PMC free article] [PubMed] [Google Scholar]
- 45. Stanislaw H, Todorov N. Calculation of signal detection theory measures. Behav Res Methods Instrum Comput. 1999;31:137‐149. [DOI] [PubMed] [Google Scholar]
- 46. Chen C, Chen C, Xue G, Dong Q, Zhao L, Zhang S. Parental warmth interacts with several genes to affect executive function components: a genome‐wide environment interaction study. BMC Genet. 2020;21:11. [DOI] [PMC free article] [PubMed] [Google Scholar]
- 47. Chang CC, Chow CC, Tellier LC, Vattikuti S, Purcell SM, Lee JJ. Second‐generation PLINK: rising to the challenge of larger and richer datasets. Gigascience. 2015;4:7. [DOI] [PMC free article] [PubMed] [Google Scholar]
- 48. Purcell S, Neale B, Todd‐Brown K, et al. PLINK: a tool set for whole‐genome association and population‐based linkage analyses. Am J Hum Genet. 2007;81:559‐575. [DOI] [PMC free article] [PubMed] [Google Scholar]
- 49. Feng J, Chen C, Cai Y, et al. Partitioning heritability analyses unveil the genetic architecture of human brain multidimensional functional connectivity patterns. Hum Brain Mapp. 2020;41:3305‐3317. [DOI] [PMC free article] [PubMed] [Google Scholar]
- 50. Yang H, Long X‐Y, Yang Y, et al. Amplitude of low frequency fluctuation within visual areas revealed by resting‐state functional MRI. NeuroImage. 2007;36:144‐152. [DOI] [PubMed] [Google Scholar]
- 51. Pruim RJ, Welch RP, Sanna S, et al. LocusZoom: regional visualization of genome‐wide association scan results. Bioinformatics. 2010;26:2336‐2337. [DOI] [PMC free article] [PubMed] [Google Scholar]
- 52. de Leeuw CA, Mooij JM, Heskes T, Posthuma D. MAGMA: generalized gene‐set analysis of GWAS data. PLoS Comput Biol. 2015;11:e1004219. [DOI] [PMC free article] [PubMed] [Google Scholar]
- 53. Sey NYA, Hu B, Mah W, et al. A computational tool (H‐MAGMA) for improved prediction of brain‐disorder risk genes by incorporating brain chromatin interaction profiles. Nat Neurosci. 2020;23:583‐593. [DOI] [PMC free article] [PubMed] [Google Scholar]
- 54. Yang L, Chang S, Lu Q, et al. A new locus regulating MICALL2 expression was identified for association with executive inhibition in children with attention deficit hyperactivity disorder. Mol Psychiatry. 2018;23:1014‐1020. [DOI] [PubMed] [Google Scholar]
- 55. Privé F, Aschard H, Blum MGB. Efficient implementation of penalized regression for genetic risk prediction. Genetics. 2019;212:65‐74. [DOI] [PMC free article] [PubMed] [Google Scholar]
- 56. Wray NR, Goddard ME, Visscher PM. Prediction of individual genetic risk to disease from genome‐wide association studies. Genome Res. 2007;17:1520‐1528. [DOI] [PMC free article] [PubMed] [Google Scholar]
- 57. Wray NR, Lee SH, Mehta D, Vinkhuyzen AAE, Dudbridge F, Middeldorp CM. Research review: polygenic methods and their application to psychiatric traits. J Child Psychol Psychiatry. 2014;55:1068‐1087. [DOI] [PubMed] [Google Scholar]
- 58. Faul F, Erdfelder E, Buchner A, Lang A‐G. Statistical power analyses using G*power 3.1: tests for correlation and regression analyses. Behav Res Methods. 2009;41:1149‐1160. [DOI] [PubMed] [Google Scholar]
- 59. Smith SM, Jenkinson M, Woolrich MW, et al. Advances in functional and structural MR image analysis and implementation as FSL. NeuroImage Math Brain Imaging. 2004;23:S208‐S219. [DOI] [PubMed] [Google Scholar]
- 60. Shen X, Finn ES, Scheinost D, et al. Using connectome‐based predictive modeling to predict individual behavior from brain connectivity. Nat Protoc. 2017;12:506‐518. [DOI] [PMC free article] [PubMed] [Google Scholar]
- 61. Fan L, Li H, Zhuo J, et al. The human Brainnetome atlas: a new brain atlas based on connectional architecture. Cereb Cortex. 2016;26:3508‐3526. [DOI] [PMC free article] [PubMed] [Google Scholar]
- 62. He L, Wei D, Yang F, et al. Functional connectome prediction of anxiety related to the COVID‐19 pandemic. Am J Psychiatry. 2021;178:530‐540. [DOI] [PubMed] [Google Scholar]
- 63. Dougherty JD, Schmidt EF, Nakajima M, Heintz N. Analytical approaches to RNA profiling data for the identification of genes enriched in specific cells. Nucleic Acids Res. 2010;38:4218‐4230. [DOI] [PMC free article] [PubMed] [Google Scholar]
- 64. Watanabe K, Taskesen E, van Bochoven A, Posthuma D. Functional mapping and annotation of genetic associations with FUMA. Nat Commun. 2017;8:1826. [DOI] [PMC free article] [PubMed] [Google Scholar]
- 65. Xu X, Wells AB, O'Brien DR, Nehorai A, Dougherty JD. Cell type‐specific expression analysis to identify putative cellular mechanisms for neurogenetic disorders. J Neurosci. 2014;34:1420‐1431. [DOI] [PMC free article] [PubMed] [Google Scholar]
- 66. Collado‐Torres L, Burke EE, Peterson A, et al. Regional heterogeneity in gene expression, regulation, and coherence in the frontal cortex and hippocampus across development and schizophrenia. Neuron. 2019;103:203‐216. [DOI] [PMC free article] [PubMed] [Google Scholar]
- 67. Bulik‐Sullivan BK, Loh P‐R, Finucane HK, et al. LD score regression distinguishes confounding from polygenicity in genome‐wide association studies. Nat Genet. 2015;47:291‐295. [DOI] [PMC free article] [PubMed] [Google Scholar]
- 68. Igo RP, Kinzy TG, Cooke Bailey JN. Genetic risk scores. Curr Protoc Hum Genet. 2019;104:e95. [DOI] [PMC free article] [PubMed] [Google Scholar]
- 69. Shahid SU, Hasnain S. Use of a gene score of multiple low‐modest effect size variants can predict the risk of obesity better than the individual SNPs. Lipids Health Dis. 2018;17:155. [DOI] [PMC free article] [PubMed] [Google Scholar]
- 70. Yeo BTT, Krienen FM, Chee MWL, Buckner RL. Estimates of segregation and overlap of functional connectivity networks in the human cerebral cortex. NeuroImage. 2014;88:212‐227. [DOI] [PMC free article] [PubMed] [Google Scholar]
- 71. Cela P, Hampl M, Fu KK, et al. MORN5 expression during craniofacial development and its interaction with the BMP and TGFβ pathways. Front Physiol. 2016;7:378. [DOI] [PMC free article] [PubMed] [Google Scholar]
- 72. Liu W‐b, Jiang X, Han F, et al. LHX6 acts as a novel potential tumour suppressor with epigenetic inactivation in lung cancer. Cell Death Dis. 2013;4:e882. [DOI] [PMC free article] [PubMed] [Google Scholar]
- 73. Samadaian N, Salehipour P, Ayati M, et al. A potential clinical significance of DAB2IP and SPRY2 transcript variants in prostate cancer. Pathol Res Pract. 2018;214:2018‐2024. [DOI] [PubMed] [Google Scholar]
- 74. Janke C, Rogowski K, Wloga D, et al. Tubulin polyglutamylase enzymes are members of the TTL domain protein family. Science. 2005;308:1758‐1762. [DOI] [PubMed] [Google Scholar]
- 75. Fullston T, Gabb B, Callen D, et al. Inherited balanced translocation t(9;17) (q33.2;q25.3) concomitant with a 16p13.1 duplication in a patient with schizophrenia. Am J Med Genet B. 2011;156B:204‐214. [DOI] [PubMed] [Google Scholar]
- 76. Marchisella F, Coffey ET, Hollos P. Microtubule and microtubule associated protein anomalies in psychiatric disease. Cytoskeleton. 2016;73:596‐611. [DOI] [PubMed] [Google Scholar]
- 77. O'Hagan R, Silva M, Nguyen KCQ, et al. Glutamylation regulates transport, specializes function, and sculpts the structure of cilia. Curr Biol. 2017;27:3430‐3441. [DOI] [PMC free article] [PubMed] [Google Scholar]
- 78. Lee JJ, Wedow R, Okbay A, et al. Gene discovery and polygenic prediction from a genome‐wide association study of educational attainment in 1.1 million individuals. Nat Genet. 2018;50:1112‐1121. [DOI] [PMC free article] [PubMed] [Google Scholar]
- 79. Burton BK, Vangkilde S, Petersen A, et al. Sustained attention and interference control among 7‐year‐old children with a familial high risk of schizophrenia or bipolar disorder‐a Nationwide observational cohort study. Biol Psychiatry Cogn Neurosci Neuroimaging. 2018;3:704‐712. [DOI] [PubMed] [Google Scholar]
- 80. Lahera G, Ruiz A, Brañas A, Vicens M, Orozco A. Reaction time, processing speed and sustained attention in schizophrenia: impact on social functioning. Rev Psiquiatr Salud Ment. 2017;10:197‐205. [DOI] [PubMed] [Google Scholar]
- 81. He Y, Xu T, Zhang W, Zuo X‐N. Lifespan anxiety is reflected in human amygdala cortical connectivity. Hum Brain Mapp. 2016;37:1178‐1193. [DOI] [PMC free article] [PubMed] [Google Scholar]
- 82. Tang Y‐Y, Rothbart MK, Posner MI. Neural correlates of establishing, maintaining, and switching brain states. Trends Cogn Sci. 2012;16:330‐337. [DOI] [PMC free article] [PubMed] [Google Scholar]
- 83. Fortenbaugh FC, Rothlein D, McGlinchey R, DeGutis J, Esterman M. Tracking behavioral and neural fluctuations during sustained attention: a robust replication and extension. NeuroImage. 2018;171:148‐164. [DOI] [PMC free article] [PubMed] [Google Scholar]
- 84. Corbetta M, Shulman GL. Spatial neglect and attention networks. Annu Rev Neurosci. 2011;34:569‐599. [DOI] [PMC free article] [PubMed] [Google Scholar]
- 85. Vossel S, Weidner R, Driver J, Friston KJ, Fink GR. Deconstructing the architecture of dorsal and ventral attention systems with dynamic causal modeling. J Neurosci. 2012;32:10637‐10648. [DOI] [PMC free article] [PubMed] [Google Scholar]
- 86. Guo X, Yao D, Cao Q, et al. Shared and distinct resting functional connectivity in children and adults with attention‐deficit/hyperactivity disorder. Transl Psychiatry. 2020;10:65. [DOI] [PMC free article] [PubMed] [Google Scholar]
- 87. de Lacy N, Kodish I, Rachakonda S, Calhoun VD. Novel in silico multivariate mapping of intrinsic and anticorrelated connectivity to neurocognitive functional maps supports the maturational hypothesis of ADHD. Hum Brain Mapp. 2018;39:3449‐3467. [DOI] [PMC free article] [PubMed] [Google Scholar]
- 88. Wang C, Ong JL, Patanaik A, Zhou J, Chee MWL. Spontaneous eyelid closures link vigilance fluctuation with fMRI dynamic connectivity states. Proc Natl Acad Sci USA. 2016;113:9653‐9658. [DOI] [PMC free article] [PubMed] [Google Scholar]
- 89. Ystad M, Hodneland E, Adolfsdottir S, et al. Cortico‐striatal connectivity and cognition in normal aging: a combined DTI and resting state fMRI study. NeuroImage. 2011;55:24‐31. [DOI] [PubMed] [Google Scholar]
- 90. Dan O, Cohen A, Asraf K, Saveliev I, Haimov I. The impact of sleep deprivation on continuous performance task among young men with ADHD. J Atten Disord. 2020;25(9):1284‐1294. [DOI] [PubMed] [Google Scholar]
Associated Data
This section collects any data citations, data availability statements, or supplementary materials included in this article.
Supplementary Materials
Figure S1. Scatter plots showing the relationship between genotype of TTLL11 rs13298112 and response bias [β] (A), sensitivity [d’] (B), omission error (C), commission error (D).
Figure S2. (A) Hi‐C revealed significant interactions between TTLL11 and 26 other genes on chromosome 9 (FDR < 1E−6, shown in orange). (B) Expression level of these genes in brain tissues (log2 transformed).
Table S1. Correlations between the four indices of sustained attention.
Table S2. SNPs used to calculate the gene scores.
Data Availability Statement
The data of the current study are available from the corresponding author upon reasonable request. The GWAS summary results are available at https://github.com/Liuhejun/GWAS_SA.