

Abstract
The molecular and ecological factors shaping horizontal gene transfer (HGT) via natural transformation in microbial communities are largely unknown, which is critical for understanding the emergence of antibiotic‐resistant pathogens. We investigate key factors shaping HGT in a microbial co‐culture by quantifying extracellular DNA release, species growth, and HGT efficiency over time. In the co‐culture, plasmid release and HGT efficiency are significantly enhanced than in the respective monocultures. The donor is a key determinant of HGT efficiency as plasmids induce the SOS response, enter a multimerized state, and are released in high concentrations, enabling efficient HGT. However, HGT is reduced in response to high donor lysis rates. HGT is independent of the donor viability state as both live and dead cells transfer the plasmid with high efficiency. In sum, plasmid HGT via natural transformation depends on the interplay of plasmid properties, donor stress responses and lysis rates, and interspecies interactions.
Keywords: extracellular DNA, horizontal gene transfer, microbial co‐culture, natural competence, SOS response
Subject Categories: Microbiology, Virology & Host Pathogen Interaction
Plasmid multimerization, donor stress response and donor lysis rate are major determinants of horizontal gene transfer via natural competence in a microbial co‐culture.
Introduction
Horizontal gene transfer (HGT) is a major mechanism of genetic variation in microbial communities that enables the acquisition of new functional capabilities (Soucy et al, 2015). Horizontally acquired sequences can provide a selective advantage by facilitating evolutionary adaptation to changing environmental conditions (Ropars et al, 2015). Conjugation and natural transformation are prevalent processes that enable HGT in bacterial communities. Conjugation involves cell‐to‐cell contact between a donor and recipient cell, and thus, the live donor cell actively participates in the HGT process (Clarke et al, 2008). By contrast, extracellular DNA (eDNA) can be acquired by a naturally competent recipient cell in the absence of living donor cells (Overballe‐Petersen et al, 2013). The capability for natural competence is widespread across Gram‐positive and Gram‐negative bacteria (Johnston et al, 2014), including many bacterial pathogens (Lerminiaux & Cameron, 2019). For example, interspecies or intrastrain gene transfer (Hakenbeck et al, 1999; Sauerbier et al, 2012; Jensen et al, 2015) via natural transformation is implicated in the ability of Streptococcus pneumoniae to adapt and persist on a human host.
eDNA derived from bacteria is prevalent in natural environments (Nagler et al, 2018). The potential biological functions of eDNA and the mechanisms mediating DNA release vary across bacterial species and environmental contexts (Ibáñez de Aldecoa et al, 2017). eDNA can be released through autolysis, active secretion, or cell death and is involved in biofilm formation, DNA repair, nutrient utilization, and gene transfer (Finkel & Kolter, 2001; Whitchurch et al, 2002; Prudhomme et al, 2006; Zafra et al, 2012). Environmental stressors such as bactericidal antibiotics, temperature shifts, chemicals, and enzymes can also modify cell viability and thus the rate of eDNA release (Boman & Eriksson, 1963; Shehadul Islam et al, 2017). In addition, interactions between donors and recipients have been shown to influence eDNA release and the frequency of HGT in microbial co‐cultures. For instance, naturally competent species can exploit predation to enhance DNA release from donor cells to achieve efficient DNA acquisition. For example, Acinetobacter baumannii, Vibrio cholerae, and S. pneumoniae can use type‐VI secretion systems or bacteriocins to enhance DNA release via lysis of the donor (Borgeaud et al, 2015; Wholey et al, 2016; Cooper et al, 2017). In addition, the presence of a donor strain has been shown to enhance the frequency of intrastrain gene transfer in Bacillus subtilis, Porphyromonas gingivalis, and Pseudomonas stutzeri, as well as interspecies gene transfer between the donor Escherichia coli and recipient Vibrio species (Stewart et al, 1983; Paul et al, 1992; Tribble et al, 2012; Zhang et al, 2018). However, the mechanisms driving these interactions are largely unknown.
At the molecular level, the DNA strand exchange protein and master regulator of the SOS response RecA has been shown to play an important role in facilitating HGT (Pavlopoulou, 2018). In the recipient, RecA mediates homologous recombination with incoming DNA with sufficient homology to the recipient genome (Kowalczykowski & Eggleston, 1994). In the donor, RecA plays an important role in HGT via transduction and conjugation (Johnson et al, 1981; Beaber et al, 2004). In response to DNA damage, RecA binds to single‐stranded DNA and inactivates the LexA repressor that regulates SOS response genes (global response to DNA damage; Maslowska et al, 2019). Depending on the degree of DNA damage, the SOS response activates the expression of error‐prone DNA polymerases, inhibitors of cell division, and proteins that promote cell death (Simmons et al, 2008). The repressors in the phages and the integrative and conjugative elements share homology with LexA, which in turn enhances the rates of transduction and conjugation during DNA damage (Johnson et al, 1981; Beaber et al, 2004). In microbial communities, the role of RecA in donor species on HGT via natural competence has not been investigated.
To address these gaps, we construct a microbial co‐culture composed of the donor E. coli and recipient B. subtilis to interrogate the contributions of environmental and molecular factors on eDNA release and efficiency of HGT via natural competence. These two species are evolutionarily distant and thus can provide fundamental insights into the mechanisms of HGT within diverse microbial communities. We demonstrate that eDNA release and HGT efficiency via natural competence depends on the initial culture densities of both donor and recipient, mirroring conjugation (Lopatkin et al, 2016). Notably, recA in the E. coli donor has a major impact on plasmid transfer frequencies by enhancing plasmid multimerization and eDNA release. Using an inducible control of cell lysis, we show that a high rate of donor lysis inhibits plasmid transfer due to the release of both donor genomic DNA (gDNA) and DNases. By comparison, live, heat‐killed, or antibiotic‐inhibited donor cells can efficiently release eDNA and yield high HGT efficiencies in the microbial co‐culture. These results suggest that the donor could efficiently transfer plasmids to naturally competent bacteria in microbial communities with or without perturbations. Bioinformatic analysis identifies E. coli plasmid replication origins in the genomes of wild‐type Bacillus isolates and other naturally competent bacteria, suggesting that plasmids may transfer via natural transformation. In sum, our results provide key insights into the molecular and environmental factors influencing HGT frequency via natural competence in microbial communities.
Results
Interspecies plasmid HGT via natural transformation is efficient in a microbial co‐culture
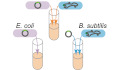
To investigate HGT mediated by natural competence, we constructed a microbial co‐culture composed of the donor E. coli and recipient B. subtilis (Fig 1A). This co‐culture enabled quantification of species abundance, eDNA release, and HGT frequency over time. The E. coli donor harbored an integrative plasmid pBB275 with a spectinomycin resistance gene (specR) flanked by two 500‐bp sequences homologous to B. subtilis PY79 locus ycgO. Once the plasmid is released from E. coli and taken up by B. subtilis, it can be integrated onto the B. subtilis genome via homologous recombination. The donor E. coli strain (MG1655‐rfp) has a constitutively expressed red fluorescent gene (rfp) on the genome to enable fluorescent imaging. To enhance transformation efficiency (~100‐fold) in rich media that supports the growth of both species, a xylose‐inducible master regulator for competence (comK) was introduced into B. subtilis (Zhang & Zhang, 2011).
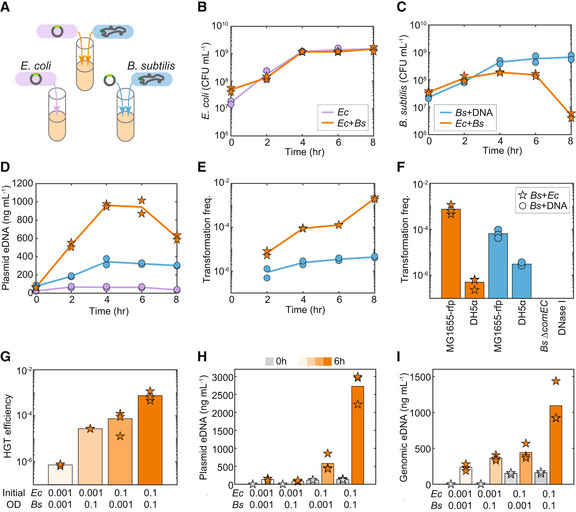
Figure 1. Plasmid horizontal gene transfer via natural transformation is highly efficient in the co‐culture.
-
ASchematic of experimental design to characterize the temporal changes in plasmid horizontal gene transfer, species abundance, and extracellular plasmid release in Escherichia coli monoculture (purple), Bacillus subtilis monoculture supplemented with 100 ng/ml plasmid DNA (blue) or co‐culture composed of E. coli harboring a plasmid and B. subtilis (orange). The pBB275 plasmid harbored a resistance gene flanked by two sequences homologous to B. subtilis for integration onto the B. subtilis genome. B. subtilis was engineered to harbor a xylose‐inducible master regulator for competence comK for enhancing transformation efficiency in the co‐culture.
-
B–ETime‐series measurements of (B) E. coli abundance, (C) B. subtilis abundance, (D) extracellular plasmid concentration, and (E) transformation frequency of the plasmid in monoculture and co‐culture.
-
FBar plot of transformation frequency of the pBB275 plasmid at 6 h in the B. subtilis monoculture or co‐culture. E. coli MG1655‐rfp or E. coli DH5α was used as the donor species in the co‐culture. In the monoculture, 1 μg/ml plasmid DNA derived from E. coli MG1655‐rfp or DH5α was introduced. The transformation frequency was below the detection limit in the co‐culture composed of E. coli M1655‐rfp and B. subtilis ∆comEC or the co‐culture composed of E. coli MG1655‐rfp and B. subtilis in the presence of 1 unit/ml DNase I.
-
GHGT efficiency (i.e., transformation frequency in the co‐culture) of the pBB275 plasmid at 6 h in the co‐cultures composed E. coli MG1655‐rfp and B. subtilis inoculated at different initial abundances (absorbances at 600 nm or OD600).
-
HBar plot of measured extracellular pBB275 plasmid concentration at 0 and 6 h in co‐cultures inoculated with different initial culture densities of E. coli MG1655‐rfp and B. subtilis.
-
IExtracellular E. coli genomic MG1655‐rfp concentration at 0 and 6 h in co‐cultures inoculated with different initial culture densities of E. coli MG1655‐rfp and B. subtilis.
Data information: All time‐series experiments in (B–E) had two biological replicates. All single time measurements in (F–I) had three biological replicates. Lines and bars represent the average of the biological replicates.
Source data are available online for this figure.
To understand the dynamics of HGT, we measured the colony‐forming units (CFU/ml) of the E. coli donor, B. subtilis recipient, and B. subtilis transformants over time in monoculture and co‐culture conditions (Fig 1A–C). To investigate the temporal changes in eDNA release, we performed quantitative real‐time PCR (qPCR) measurements of the pBB275 plasmid released from E. coli (MG1655‐rfp) in monoculture and co‐culture of E. coli (MG1655‐rfp) and B. subtilis (Fig 1A and D). To evaluate the efficiency of HGT, we quantified the transformation frequency of the co‐culture or B. subtilis monoculture supplemented with purified pBB275 plasmid (100 ng/ml) derived from the cloning strain E. coli DH5α (Fig 1A and E). Transformation frequency was defined as the ratio of the number of B. subtilis transformants plated on selective media to the total number of B. subtilis cells. Based on a titration of plasmid concentration in B. subtilis monoculture, 100 ng/ml was close to the saturated regime of transformation efficiency in rich media supplemented with 50 mM xylose (Appendix Fig S1A). This indicates that plasmid concentrations higher than 100 ng/ml would not substantially enhance transformation frequency.
The growth of E. coli was similar in the presence and absence of B. subtilis, indicating the absence of an interspecies interaction (Fig 1B). However, the growth of B. subtilis after 4 h was reduced in the presence of E. coli, indicating a negative interspecies interaction from E. coli to B. subtilis (Fig 1C). The fluorescently labeled E. coli and B. subtilis aggregated together, suggesting that cell‐to‐cell contact with E. coli may influence B. subtilis growth in the co‐culture (Appendix Fig S1B). The growth inhibition was observed for both the wild‐type and engineered B. subtilis strains (Fig 1C and Appendix Fig S1C). In addition, eDNA released from E. coli was substantially enhanced in the presence of B. subtilis than in the E. coli monoculture (Fig 1D, orange vs. purple line). The externally supplemented plasmid concentration moderately increased over time in the B. subtilis monoculture, possibly due to autolysis (i.e., regulated lysis) of B. subtilis (Zafra et al, 2012; Fig 1D, blue line). The transformation frequencies of both the engineered and wild‐type B. subtilis strains were significantly enhanced (~102–103 fold at 6 h) in the co‐culture than in the B. subtilis monocultures supplemented with 100 ng/ml plasmid derived from E. coli DH5α (Fig 1E and Appendix Fig S1D). For further characterizations, we focused on the transformation frequency at 6 h due to the high B. subtilis abundance and high transformation frequency observed in the co‐culture (Fig 1C and E).
We considered if the differences in the genetic background of the E. coli donor (i.e., purified plasmid derived from DH5α or released plasmid from MG1655‐rfp) could drive the high transformation frequency observed in the co‐culture. Indeed, multimerized plasmids could be isolated from E. coli MG1655‐rfp, consistent with a previous study demonstrating plasmid multimerization in recA + E. coli (Bedbrook & Ausubel, 1976; Appendix Fig S1E). B. subtilis monoculture supplemented with plasmid derived from MG1655‐rfp displayed ~10‐fold higher transformation frequency than when supplemented with plasmid derived from DH5α (Fig 1F, blue bars, Appendix Fig S1A). Notably, the transformation frequency in the co‐culture with E. coli DH5α was ~103 lower than in the co‐culture with E. coli MG1655‐rfp (Fig 1F, orange bars). This implies that while plasmid multimerization was a key factor that enhanced HGT efficiency (~10‐fold), it did not fully explain the large increase in HGT efficiency observed in the co‐culture with MG1655‐rfp compared with DH5α. The knockout of DNA transport protein gene comEC in engineered B. subtilis or the addition of DNase I abolished plasmid transfer in the co‐culture with E. coli MG1655‐rfp, indicating that the efficient plasmid DNA transfer in the co‐culture was mediated by natural competence (Fig 1F, right two bars).
To investigate how initial cell density could affect HGT efficiency in the co‐culture, we varied the initial cell densities of E. coli and B. subtilis based on absorbance at 600 nm (OD600) from 0.001 to 0.1 and measured species abundance, eDNA release, and HGT efficiency at 6 h. The plasmid eDNA and HGT efficiency increased with the initial cell densities of E. coli and B. subtilis (Fig 1G and H). The extracellular chromosomal DNA of E. coli was significantly higher for co‐cultures with high initial abundance of both species (Fig 1I), suggesting that E. coli was more susceptible to cell death in cultures with higher initial cell density. Lower initial E. coli abundance resulted in higher abundance of B. subtilis at 6 h, consistent with E. coli's negative impact on the growth of B. subtilis (Appendix Fig S1F). In sum, initial species abundance was a critical variable shaping HGT efficiency and eDNA release in the co‐culture.
We investigated whether chromosomal DNA could transfer from E. coli to B. subtilis in the co‐culture via natural competence. We constructed an E. coli donor with an erythromycin resistance gene flanked by 600‐bp sequences homologous to B. subtilis PY79 yvbJ on the E. coli MG1655 genome (Appendix Fig S2A). Transformants were not observed over 8 h in the co‐culture of the E. coli donor strain and engineered B. subtilis (detection limit was ~10−9; Appendix Fig S2B). By contrast, the B. subtilis monoculture supplemented with E. coli gDNA (100 ng/ml) displayed low transformation frequency (Appendix Fig S2B). While eDNA release of the E. coli donor strain was moderately higher in co‐culture than in monoculture (Appendix Fig S2C, orange vs. purple line), this concentration was not sufficiently high to enable efficient HGT (Appendix Fig S2C, blue line). In this co‐culture, the growth of B. subtilis was also inhibited by E. coli (Appendix Fig S2D and E). In sum, our results indicate that HGT of plasmid DNA was substantially more efficient than chromosomal DNA via natural competence in the co‐culture.
Investigating the role of donor recA on HGT of plasmid via natural competence
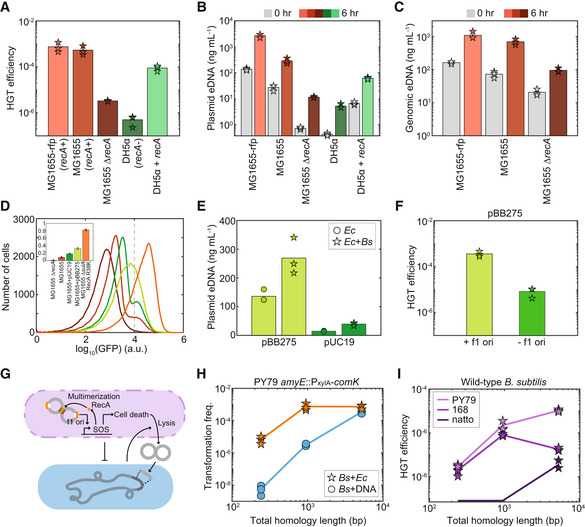
We investigated factors influencing the ~103‐fold increase in HGT efficiency in the co‐culture with E. coli MG1655‐rfp compared with DH5α (Fig 1F, orange bars). E. coli MG1655 and DH5α contain many genetic differences including recA. We compared the HGT efficiency of recA + E. coli donors (MG1655‐rfp, MG1655, or DH5α + recA) with recA − E. coli donors (MG1655 ∆recA or DH5α) in the co‐culture with engineered B. subtilis (Fig 2A). Our results showed that recA + donors displayed substantially higher HGT efficiency in the co‐culture than recA − donors (Fig 2A). Notably, the introduction of a constitutively expressed recA in E. coli DH5α yielded a ~100‐fold increase in HGT efficiency compared with E. coli DH5α, indicating that recA is a major determinant of HGT efficiency. Plasmid and chromosomal eDNA were significantly higher in co‐cultures with E. coli recA + donors than recA − donors, indicating that RecA contributes to eDNA release from E. coli and enhances HGT efficiency (Fig 2B and C). However, the eDNA increase did not trend with E. coli abundance at 6 h in the co‐culture or E. coli growth rate in monoculture (Appendix Fig S3). These strains displayed similar doubling times in monoculture, with MG1655‐rfp and DH5α + recA displaying the fastest and slowest growth rates, respectively (Appendix Fig S3C). These results suggest that RecA may facilitate plasmid transfer by increasing the death rate of a subpopulation of donor cells while not substantially altering growth.
Figure 2. Presence of recA in the Escherichia coli donor enhances HGT efficiency in the co‐culture.
-
ABar plot of HGT efficiencies of the pBB275 plasmid in the co‐culture composed of an E. coli recA + or recA − donor and engineered B. subtilis at 6 h.
-
B, C(B) Extracellular pBB275 plasmid concentration or (C) extracellular E. coli genomic DNA concentration at 0 or 6 h in the co‐cultures composed of a recA + or recA − E. coli plasmid donor and engineered B. subtilis.
-
DHistogram of GFP expression driven by an SOS response promoter in E. coli MG1655 ∆recA, E. coli MG1655, E. coli MG1655 harboring pUC19, E. coli MG1655 harboring pBB275 or E. coli MG1655 ∆sulA RecA(E38K) in monoculture measured by flow cytometry. Inset: bar plot of the fraction of E. coli expressing high GFP (> 10,000 a.u.) for each strain.
-
EExtracellular pBB275 or pUC19 plasmid concentration in the E. coli MG1655 monoculture or co‐culture with engineered B. subtilis.
-
FHGT efficiencies of pBB275 plasmid (with or without an f1 ori) at 6 h in the co‐culture composed of E. coli MG1655 and engineered B. subtilis.
-
GSchematic of the proposed model for the efficient plasmid transfer via natural competence in the co‐culture composed of a recA + E. coli donor and recipient B. subtilis. The plasmid leads to the activation of the SOS response, which in turn enhances eDNA release and plasmid multimerization via RecA. B. subtilis enhances E. coli eDNA release even being inhibited by E. coli.
-
HRelationship between total homology length and transformation frequency of pBB275 plasmid in the co‐culture composed of E. coli MG1655‐rfp and engineered B. subtilis or B. subtilis monoculture at 6 h. In the B. subtilis monoculture, 1 μg/ml pBB275 plasmid DNA derived from E. coli DH5α was introduced.
-
IRelationship between total homology length and HGT efficiency of the pBB275 plasmid in the co‐culture composed of the DAP‐auxotrophic E. coli BW29427 and wild‐type B. subtilis PY79, 168 or natto IFO3335 at 6 h. HGT efficiency of pBB275 plasmid with total ~200‐ and ~1,000‐bp homology for B. subtilis natto was below the detection limit.
Data information: All experiments had three biological replicates. Bars and lines are the average of the biological replicates.
Source data are available online for this figure.
Since RecA has been shown to induce cell death via the SOS response (Erental et al, 2014), we tested whether the integrative plasmid pBB275 induced the SOS response of recA + E. coli, which in turn could enhance eDNA release. To quantify the activity of the SOS response, we constructed an SOS response reporter P sulA ‐gfp on a different plasmid (McCool et al, 2004). To test the reporter, we first introduced the SOS response reporter plasmid into E. coli MG1655 ∆recA, MG1655, and MG1655 ∆sulA RecA(E38K) (constitutively active SOS response (Robinson et al, 2015)) without the integrative plasmid. We used flow cytometry to quantify the fluorescence distribution of the SOS response reporter across the E. coli population in monoculture. By setting a GFP threshold of 104 a.u. (GFP ON subpopulation), 1% of E. coli MG1655 ∆recA, 9% of E. coli MG1655, and 83% of wild‐type E. coli MG1655 ∆sulA RecA(E38K) were GFP ON. This implies that the SOS fluorescent reporter can quantify the degree of SOS response in E. coli (Fig 2D).
Plasmid pBB275 consists of heterologous DNA sequences including sequences homologous to B. subtilis and a phage‐derived replication origin (f1 ori), which could activate the SOS response in E. coli (Arís et al, 1998; Lee et al, 2002; Johnson et al, 2019; Appendix Fig S4A). To evaluate the effect of the pBB275 plasmid on the activity of the SOS response, we characterized the SOS response in E. coli MG1655 harboring pBB275 and in E. coli MG1655 with a plasmid pUC19 that lacks the sequences homologous to ycgO in B. subtilis and the f1 ori (Appendix Fig S4B). E. coli MG1655 harboring pUC19 or pBB275 displayed larger GFP ON subpopulations (18 and 33% of the populations, respectively) than MG1655 lacking these plasmids (9% of the population). In addition, the GFP ON subpopulation in E. coli MG1655 harboring pBB275 displayed elongated cell morphologies by microscopy and higher Forward Scatter measured by flow cytometry compared with the GFP ON subpopulation of E. coli MG1655 harboring pUC19 (Appendix Fig S5A–D). This elongated cell morphology is consistent with SOS response induction in E. coli (Witkin, 1967). In sum, these results show that different plasmids can induce the SOS response in E. coli to varying degrees.
Plasmid eDNA release was substantially higher for E. coli MG1655 harboring pBB275 than E. coli MG1655 harboring pUC19 in monoculture and in the co‐culture with engineered B. subtilis. This is consistent with the observed larger fraction of the GFP ON cells for SOS reporter in E. coli with pBB275 than pUC19 (Fig 2D and E). The plasmid conformations of pUC19 derived from recA + E. coli or recA − E. coli were similar (Appendix Fig S5E). This implies that sequences that differentiate pUC19 and pBB275 (e.g., f1 ori and ycgO) could contribute to plasmid multimerization. To determine whether the phage replication origin contributed to the high HGT efficiency, we constructed a derivative of pBB275 that lacks the f1 ori (Appendix Fig S4C). The HGT efficiency of pBB275 was substantially higher than pBB275 lacking the f1 ori, indicating that the f1 ori was a critical determinant of HGT efficiency (Fig 2F). The f1 ori has been previously shown to activate the SOS response (Johnson et al, 2019). Taken together, this suggests that the f1 ori, SOS response, and plasmid multimerization interact to enhance HGT efficiency in the co‐culture (Fig 2G).
To investigate how the sequence length of B. subtilis homologous DNA on the integrative pBB275 plasmid could impact HGT efficiency, we constructed plasmids with homology length 100 or 2,500 bp that also harbored the f1 ori. Plasmids with different homology lengths all formed multimers when derived from E. coli MG1655‐rfp and not when derived from E. coli DH5α (Appendix Fig S5F). The HGT efficiency of these plasmids was substantially higher in co‐culture than in monoculture supplemented with high concentration of plasmid DNA derived from DH5α (1 μg/ml; Fig 2H). The magnitude of this enhancement in HGT efficiency was maximized (~1,000‐fold) for the plasmid with the shortest homology length (Fig 2H). The plasmid eDNA concentration displayed a nonmonotonic relationship with homology length and was highest for the plasmid with 500‐bp homology (Appendix Fig S5G).
Based on the high HGT efficiency of these plasmids, we tested whether wild‐type B. subtilis can be directly transformed in the co‐culture in a rich media that does not typically induce natural competence activity. To this end, we transformed individual plasmids into a diaminopimelic acid (DAP) auxotrophic E. coli strain. We co‐cultured the individual auxotrophic E. coli donors with wild‐type B. subtilis PY79, 168, or natto IFO3335 as recipients (Goto & Kunioka, 1992; Zeigler et al, 2008; Wang et al, 2015). By selecting for spectinomycin‐resistant cells in the absence of DAP, HGT occurred in co‐culture for all three B. subtilis strains with varying transformation efficiencies (Fig 2I). In sum, our results demonstrate that the plasmids can transfer efficiently from recA + E. coli donor strains to different B. subtilis recipient strains via natural competence.
High donor lysis rate reduces HGT efficiency
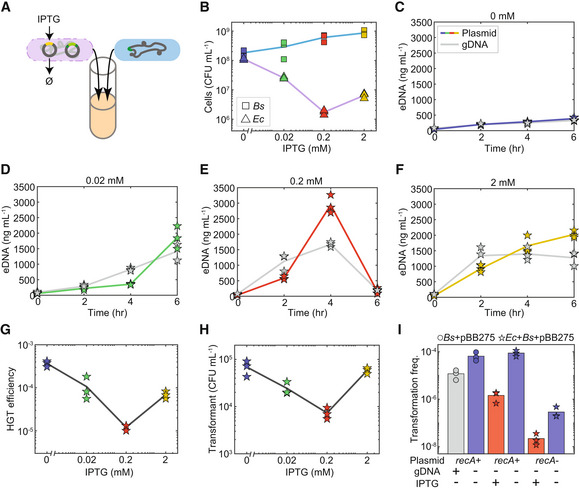
Bacteria are continuously confronted with biotic and abiotic environmental stimuli that impact cellular growth rates and viability (Maurice et al, 2013; García‐Bayona & Comstock, 2018). We investigated how different perturbations on donor growth could impact HGT efficiency in our microbial co‐culture. To precisely control the lysis rate of the donor, we introduced an Isopropyl β‐D‐1‐thiogalactopyranoside (IPTG)‐inducible phage φX174 lysis gene E into the E. coli MG1655‐rfp donor strain on a second plasmid in addition to the integrative plasmid pBB275 (Fig 3A). With the addition of IPTG, E. coli abundance decreased at 6 h, consistent with induced lysis (Fig 3B). In addition, B. subtilis grew to a moderately higher abundance, consistent with a weakened negative interaction from E. coli to B. subtilis (Fig 3B). The concentrations of plasmid and chromosomal eDNA of E. coli were substantially higher in the presence of IPTG, consistent with the high lysis rate and reduced abundance of E. coli (Fig 3B–F). Notably, despite the high eDNA concentrations in the presence of IPTG, the HGT efficiency and abundance of transformants decreased over a range of IPTG concentrations (Fig 3G and H).
Figure 3. High Escherichia coli donor cell lysis rates inhibit HGT efficiency in the co‐culture.
-
ASchematic of the co‐culture experiment composed of engineered B. subtilis and E. coli MG1655‐rfp harboring pBB275 integrative plasmid and an IPTG‐inducible lysis gene on a second plasmid.
-
BE. coli and B. subtilis abundances in the co‐culture in the presence of 0, 0.02, 0.2 or 2 mM IPTG at 6 h.
-
C–FTime‐series measurements of extracellular plasmid or E. coli gDNA concentrations in the co‐culture in the presence of (C) 0 mM, (D) 0.02 mM, (E) 0.2 mM or (F) 2 mM IPTG.
-
GHGT efficiency of the pBB275 plasmid in the co‐culture in the presence of 0, 0.02, 0.2 or 2 mM IPTG at 6 h.
-
HAbundance of transformants in the co‐culture in the presence of 0, 0.02, 0.2 or 2 mM IPTG at 6 h.
-
IBar plot of transformation frequencies of engineered B. subtilis in monoculture or co‐culture with E. coli harboring an IPTG‐inducible lysis gene. In the B. subtilis monoculture or co‐culture, 1 μg/ml pBB275 plasmid DNA derived from E. coli MG1655‐rfp (recA +) or DH5α (recA −) was externally introduced. The presence of 1 μg/ml genomic DNA derived from E. coli MG1655‐rfp in B. subtilis monoculture or 0.2 mM IPTG in co‐culture reduced the transformation frequency of the pBB275 plasmid DNA at 6 h.
Data information: Each experiment had three biological replicates. Lines and bars are the average of the biological replicates.
Source data are available online for this figure.
To test whether the released E. coli gDNA could compete with plasmid for transformation, we supplemented a high concentration of E. coli MG1655‐rfp gDNA (1 μg/ml) into the B. subtilis monoculture that also contained a high concentration of pBB275 plasmid DNA (1 μg/ml). The presence of E. coli gDNA inhibited plasmid transformation of the B. subtilis monoculture (Fig 3I, first two bars). This implies that gDNA could compete with plasmid for DNA uptake and/or limit homologous recombination efficiency. To test whether the E. coli lysate contained an additional factor that inhibits plasmid HGT in addition to gDNA, we co‐cultured B. subtilis with an E. coli MG1655‐rfp strain harboring only the plasmid containing IPTG‐inducible lysis gene. To control the plasmid concentration, we externally supplemented a high concentration of pBB275 (1 μg/ml) derived from DH5α (monomeric) or MG1655‐rfp (multimeric) into separate cultures. The transformation frequencies of externally supplemented plasmids were substantially reduced in the presence of IPTG (0.2 mM) and were lower than the B. subtilis monoculture supplemented with gDNA. This indicates that both gDNA competition and donor cell lysis reduced the transformation frequency of both monomeric and multimeric plasmids (Fig 3I, last four bars). The externally supplemented pBB275 plasmid was degraded in the supernatants of the co‐cultures in the presence of IPTG at 6 h (Appendix Fig S6). This implies that DNases released from lysed E. coli could also inhibit plasmid HGT in addition to released gDNA. These data indicate that maximizing donor cell lysis did not achieve a corresponding increase in HGT efficiency. In sum, E. coli harboring a plasmid that enhanced the activity of the SOS response displayed the highest HGT efficiency, suggesting that donor cell lysis rates can be optimized to maximize HGT efficiency.
Live or dead donor cells contribute to efficient plasmid transfer
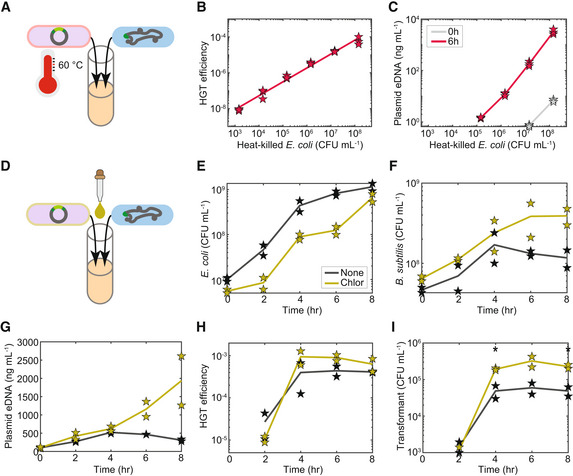
To determine whether live and metabolically active donor cells are contributing to the observed efficiency of HGT in the co‐culture, the E. coli donor was killed by incubating at 60°C for 30 min (Usajewicz & Nalepa, 2006). This heat treatment did not induce substantial eDNA release when compared to eDNA release of live cells (Appendix Fig S7A and B). The log‐transformed HGT efficiency of heat‐killed E. coli co‐cultured with B. subtilis was linearly related to the log transform of the initial cell density of heat‐treated E. coli (Fig 4A and B). In addition, the plasmid eDNA concentration at 6 h was linearly related to the initial cell density of heat‐killed E. coli (Fig 4C). This indicates that plasmids can be efficiently released from dead E. coli cells and transferred to B. subtilis in the co‐culture.
Figure 4. High HGT efficiency in the microbial co‐culture is independent of Escherichia coli donor viability state.
-
ASchematic of the experimental design to determine the impact of donor species viability on HGT efficiency and plasmid DNA release. The microbial co‐culture was composed of engineered B. subtilis and heat‐killed E. coli MG1655‐rfp harboring pBB275.
-
BScatter plot of the initial abundance of heat‐killed E. coli MG1655‐rfp and HGT efficiency in the co‐culture at 6 h. Line represents data fit to the linear equation y = 0.74*x − 10.37 with the coefficient of determination R 2 = 0.9839 where x and y are the log10 transformed abundance of heat‐killed E. coli density and log10 transformed HGT efficiency, respectively.
-
CScatter plot of the initial abundance of heat‐killed E. coli MG1655‐rfp and extracellular pBB275 plasmid concentration at 0 or 6 h in the co‐culture.
-
DSchematic of the experimental design to determine the impact of chloramphenicol on HGT efficiency and plasmid DNA release in the co‐culture composed of engineered B. subtilis and E. coli MG1655‐rfp. B. subtilis harbored a chloramphenicol resistance gene.
-
E–ITime‐series measurements of (E) the abundance of E. coli MG1655‐rfp, (F) the abundance of engineered B. subtilis, (G) extracellular pBB275 plasmid concentration, (H) HGT efficiency of the pBB275 plasmid, and (I) abundance of transformants in the co‐culture in the presence or absence of chloramphenicol (5 μg/ml). Unpaired t‐test was used to determine whether the abundances in the presence and absence of chloramphenicol in (I) were statistically different. Stars (*) indicate P‐value of 0.0237 and 0.0283 for 4 and 8 h, respectively.
Data information: Single time point measurements in (B and C) had three biological replicates. Time‐series measurements in (E–I) had two biological replicates. Lines denote the average of the biological replicates.
Source data are available online for this figure.
To further investigate this question, we supplemented a sublethal concentration of the bacteriostatic antibiotic chloramphenicol (5 μg/ml) into the co‐culture that selectively inhibits E. coli growth by blocking protein synthesis of E. coli (Fig 4D). The engineered B. subtilis harbored a chloramphenicol resistance gene and was not impacted by the presence of the antibiotic. In the presence of chloramphenicol, the growth of E. coli was reduced, whereas B. subtilis abundance was enhanced at later times, consistent with a diminished negative interspecies interaction impacting B. subtilis (Fig 4E and F). In addition, the eDNA release of plasmid and chromosome was enhanced at later times in the presence of chloramphenicol (Frenkel & Bremer, 1986; Fig 4G and Appendix Fig S7C). The HGT efficiency was similar with or without chloramphenicol, indicating that it was not affected by the growth rate of E. coli donor (Fig 4E and H). However, the number of B. subtilis transformants were higher in the co‐culture due to the higher abundance of B. subtilis in the presence of the antibiotic (Fig 4F and I). In sum, donor cells, either live or dead, can release eDNA and yield efficient HGT in microbial co‐cultures.
Plasmid replication origins in wild‐type Bacillus and non‐Bacillus genomes
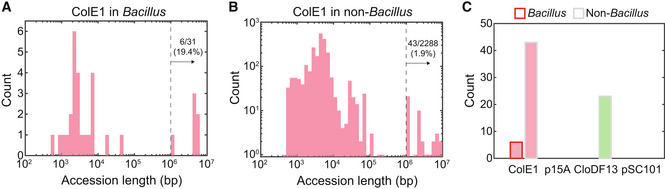
Many constructed E. coli plasmids contain sequences that could enhance their release into the environment via mechanisms such as the activation of the SOS response. Therefore, we tested whether E. coli plasmids were present in other bacteria beyond our tested strains using bioinformatics. We searched for the E. coli plasmid replication origin ColE1 sequence (present in pBB275) in the NCBI Reference Sequence Database (RefSeq) by nucleotide BLAST. We found that 31 Bacillus strains from a total of 77 Bacillus hits harbored ColE1 with high coverage and similarity (> 80% coverage and > 90% identity; Appendix Fig S8A and Dataset EV1). Further analysis of the sequence length greater than threshold (106 bp) revealed the presence of ColE1 in six Bacillus genomes, including B. subtilis laboratory strains and three wild‐type Bacillus isolates (Fig 5A and Appendix Fig S9). Notably, other plasmid replication origins including p15A and CloDF13 did not return as many hits with high percent identity and percent coverage and no hits were observed for pSC101 (Appendix Fig S8B and C, and Dataset EV1).
Figure 5. Genomic sequence analysis identifies Escherichia coli plasmid replication origins in bacterial genomes.
-
AHistogram of the sequence lengths of 31 Bacillus containing a ColE1 replication origin.
-
BHistogram of the sequence lengths of 2,288 strains excluding members of E. coli and Bacillus containing a ColE1 replication origin.
-
CHistogram of the number of E. coli plasmid replication origins ColE1, p15A, CloDF13 or pSC101 identified in Bacillus or non‐Bacillus DNA sequences with a sequence length larger than 106 bp (indicating potential genomic integration). ColE1 was found in six Bacillus genomes and 43 non‐Bacillus genomes. CloDF13 was found in 23 non‐Bacillus genomes. p15A and pSC101 were not detected in this NCBI RefSeq dataset.
A similar analysis for non‐Bacillus strains revealed that ColE1 and CloDF13 are present in the genomes of 43 and 23 diverse bacteria, respectively (Fig 5B and C, and Appendix Fig S8D–J and Dataset EV1). The replication origin ColE1 was found in diverse wild‐type environmental isolates and laboratory strains, including Neisseria meningitidis, which is known to be naturally competent (Berry et al, 2013; Appendix Fig S9A). By contrast, CloDF13 was found mostly in Klebsiella pneumoniae (Dataset EV1), which may have occurred via conjugation or transduction (Haudiquet et al, 2021). Sequence analysis revealed that ColE1 was associated with antibiotic resistance genes and heterologous genes in the genomes of five Bacillus strains but not associated with conjugation genes (Appendix Fig S9B). In sum, the presence of plasmid replication origins in the genomes of naturally competent bacteria suggests that E. coli plasmids may have transferred to other bacteria via natural transformation.
Discussion
We used a microbial co‐culture to characterize the molecular and environmental factors shaping HGT via natural competence. Our results demonstrate that plasmid transfer via natural competence can be highly efficient in microbial co‐cultures. We identified several key mechanisms that enable efficient plasmid HGT. Specifically, we show that higher donor eDNA release in the microbial co‐culture and plasmid multimerization enhanced HGT. The eDNA release and natural transformation efficiency also depend on the initial densities of donor and recipient in the co‐culture. The SOS response in the donor E. coli species plays a major role in triggering eDNA release, which in turn enhances the efficiency of HGT in the co‐culture. Efficient HGT can be achieved with live and dead donor cells, which demonstrates that purified DNA or cell lysate is not necessary for achieving successful transformation (Kaneko & Itaya, 2010; Juhas et al, 2016). These molecular and ecological mechanisms enabling efficient HGT via natural competence could also impact the efficiency of HGT in multispecies communities and natural environments. For example, plasmids isolated from Staphylococcus aureus have been shown to be multimerized and transformable, which may lead to the emergence of multidrug‐resistant strains via natural transformation (Canosi et al, 1978; Maree et al, 2022).
RecA has been shown to be critical for plasmid multimerization in E. coli (Bedbrook & Ausubel, 1976) and has only been implicated in cell death via activation of the SOS response in monoculture (Erental et al, 2014). To our knowledge, the role of RecA in enhancing eDNA release and HGT efficiency in microbial communities has not been explored. Future studies can examine how different plasmid features could induce strong SOS response and plasmid multimerization (Arís et al, 1998; Lee et al, 2002; Johnson et al, 2019). For example, it is unknown whether the phage replication origin induces strong SOS response via forming single‐stranded DNA and thus triggers the SOS response (Johnson et al, 2019). A recent study showed that replication–transcription conflicts on plasmids can lead to plasmid multimerization (Wein et al, 2019). In addition, future work will investigate how the degree of population heterogeneity in the donor strain SOS response or the recipient natural competence activity quantitatively shapes HGT efficiency. Future studies using time‐lapse fluorescence microscopy could allow deeper understanding of the interspecies HGT process at the single‐cell level (Cooper et al, 2017). Bioinformatic analysis suggests that E. coli plasmids can transfer to diverse bacteria including naturally competent bacteria. These results suggest that biocontainment of engineered plasmids is crucial to limit their dissemination to other bacteria in the environment (Arnolds et al, 2021).
Materials and Methods
Plasmids and bacterial strains
To construct the integrative plasmid pBB275, two ~500‐bp B. subtilis PY79 ycgO sequences were cloned upstream and downstream of a spectinomycin resistance gene (specR) on a ColE1 plasmid. Two other pBB275 plasmids with ~100‐ and ~2,500‐bp ycgO homology were also constructed. pUC19 plasmid was purchased from New England Biolabs. The integration region (two ycgO sequences and specR) on the pBB275 plasmid was cloned onto pUC19 to replace the lacZα gene for the construction of plasmid pBB275 without f1 ori. To introduce a constitutively expressed RecA into E. coli DH5α, the recA gene was PCR amplified from E. coli MG1655 gDNA and cloned onto a p15A plasmid (pBbA6k_J23100_recA), where RecA is expressed from PJ23100 promoter. The SOS response reporter plasmid pBbA6c_PsulA_sfGFP was constructed by introducing 69‐bp PsulA promoter sequence to the upstream of green fluorescent protein gene super‐folder gfp (sfgfp). The lysis plasmid pYC01 was modified from plasmid pCSaE500, a gift from Lingchong You (Addgene Plasmid #53182). The PampC promoter of the phage φX174 lysis gene E on the pCSaE500 plasmid was replaced with the PA1lacO‐1 promoter (Lutz & Bujard, 1997). Plasmids used in this study are listed in Appendix Table S1.
To construct the E. coli MG1655‐rfp, a constitutively expressed PJ23100‐rfp was integrated into the E. coli MG1655 caiE locus using the CRISPR gene editing technique (Egbert et al, 2019). To construct the E. coli gDNA donor, an erythromycin resistance gene (ermR) flanked by two ~600‐bp B. subtilis PY79 yvbJ sequences was integrated into the E. coli MG1655 caiE locus using the same CRISPR method. E. coli MG1655 ∆recA and E. coli MG1655 ∆sulA RecA(E38K) are gifts from Dr. Michael Cox. To transform wild‐type B. subtilis directly in the co‐culture, the DAP‐auxotrophic E. coli BW29427 (E. coli Genetic Stock Center, CGSC) was used as the plasmid donor. Growth of E. coli BW29427 required 25 μM 2,6‐Diaminopimelic acid (DAP, MilliporeSigma) supplemented in LB. B. subtilis PY79 was introduced a xylose‐inducible comK to increase its transformation efficiency in LB medium (Zhang & Zhang, 2011). To image B. subtilis on a fluorescence microscope, a constitutively expressed Phyperspank‐gfp(Sp) was integrated into the ycgO locus (Overkamp et al, 2013). Additional antibiotic resistance genes ermR and kanR were introduced into B. subtilis PY79 for selection and gDNA transformation, respectively. B. subtilis PY79 strains were constructed using the MC medium for transformation (Konkol et al, 2013). MC medium is composed of 10.7 g/l potassium phosphate dibasic (Chem‐Impex International), 5.2 g/l potassium phosphate monobasic (MilliporeSigma), 20 g/l glucose (MilliporeSigma), 0.88 g/l sodium citrate dihydrate (MilliporeSigma), 0.022 g/l ferric ammonium citrate (MilliporeSigma), 1 g/l Oxoid casein hydrolysate (Thermo Fisher Scientific), 2.2 g/l potassium L‐glutamate (MilliporeSigma), and 20 mM magnesium sulfate (MilliporeSigma). A double crossover of the plasmid into B. subtilis PY79 genome was confirmed by the replacement of a different antibiotic resistance gene at the integration locus. gDNA of modified B. subtilis was then extracted and transformed into a differently modified B. subtilis to introduce multiple modifications onto the genome. Bacterial strains used in this study can be found in Appendix Table S2.
HGT experiments
To start a monoculture or co‐culture of bacteria for transformation, bacteria were first inoculated from the −80°C glycerol stock into 4 ml Lennox LB medium (MilliporeSigma) with selective antibiotics and cultured at 37°C with shaking (250 rpm) for 12 h. OD600 of the overnight culture was measured by NanoDrop One (Thermo Fisher Scientific), and the cell culture was diluted to OD600 0.1 in 5 ml LB in a 14 ml Falcon™ Round‐Bottom Tube (Thermo Fisher Scientific). LB was supplemented with 50 mM xylose (Thermo Fisher Scientific) to induce ComK expression in engineered B. subtilis. Purified DNA was supplemented into B. subtilis monoculture for transformation. Cells in the co‐culture or monoculture were mixed by pipetting and then cultured at 37°C with shaking (250 rpm). Plasmids were extracted using Plasmid Miniprep Kit (Qiagen). gDNA was extracted using DNeasy Blood & Tissue Kit (Qiagen). Cell culture was collected at specific times for qPCR and CFU quantification. To quantify eDNA, cell culture was spun down at 5,000 g for 5 min by a table centrifuge (Thermo Fisher Scientific). The supernatant was transferred to a new tube and filtered by 0.2 μm Whatman Puradisc Polyethersulfone Syringe Filter (GE Healthcare), stored at −20°C, and later quantified by qPCR. To count the CFU of the donor or recipient, cell culture was serially diluted in phosphate‐buffered saline (PBS; MilliporeSigma) and plated on selective LB agar plates with specific antibiotics. To count CFU of transformed B. subtilis, cells were plated directly on LB agar plates with antibiotics for selection without dilution. LB agar plates were incubated at 37°C, and colonies were counted the next day. Transformation frequency was defined as the ratio of transformed B. subtilis to the total B. subtilis cells with detection limit ~10−9. HGT efficiency was defined as the transformation frequency in the co‐culture with the E. coli donor.
For DNase treatment, 1 unit/ml DNase I (Thermo Fisher Scientific) was added to the cell culture. One unit of DNase I completely degrades 1 μg of plasmid DNA in 10 min at 37°C according to the manufacturer's specification. To induce the lysis of E. coli in the co‐culture, 0, 0.02, 0.2, or 2 mM IPTG was added at the beginning of the experiment into the co‐culture to induce the lysis gene E on pYC01 plasmid. To heat‐kill E. coli, overnight E. coli cell culture was diluted to OD600 0.1 in LB and cultured at 37°C with shaking (250 rpm) for 6 h. Then, the cells were incubated at 60°C with shaking (250 rpm) for 30 min. Heat‐killed cells were spun down at 5,000 g for 5 min. The pellet was resuspended with fresh LB and stored at 4°C for use in the HGT experiment on the next day. CFU counting was performed before and after heat‐killing to confirm that E. coli was completely killed. To inhibit E. coli growth in the co‐culture, 5 μg/ml chloramphenicol was added at the beginning of the experiment into the co‐culture. B. subtilis was not affected by chloramphenicol because of the introduced chloramphenicol acetyltransferase cat gene. Antibiotics used in this study were spectinomycin (spec) from Dot Scientific, chloramphenicol (chlor) from MilliporeSigma, MLS (1 μg/ml erythromycin from MilliporeSigma and 25 μg/ml lincomycin from Thermo Fisher Scientific), carbenicillin (carb) from MilliporeSigma, streptomycin (strep) from MilliporeSigma, and kanamycin (kan) from MilliporeSigma.
qPCR measurement of extracellular DNA concentration
To measure eDNA concentration, filtered supernatant from HGT experiments was added to a qPCR reaction mix containing 2X SsoAdvanced™ Universal Probes Supermix (Bio‐Rad) and PrimeTime qPCR Assays (Integrated DNA Technologies) with 500 nM of forward and reverse primers and 250 nM of probe. For each biological replicate, three technical replicates were performed on the 96‐well PCR plate (Thermo Fisher Scientific). Designed qPCR primers can amplify specR on pBB275 plasmid, ampR on pUC19 plasmid, ermR introduced into E. coli MG1655 gDNA donor genome, and caiE in the E. coli MG1655 plasmid donor genome. qPCR primer sequences are listed in Appendix Table S3. DNA standards of plasmid or gDNA were included in each qPCR run to estimate the eDNA concentration in the collected supernatant. DNA standards were quantified using Quant‐iT dsDNA Assay Kit (Thermo Fisher Scientific). qPCR reactions were performed on the CFX Connect Real‐Time PCR Detection System (Bio‐Rad). eDNA concentration was calculated from the calibration curve of DNA standards.
Agarose gel electrophoresis for imaging plasmid conformation
To determine the size of plasmids, a 0.8% agarose (MIDSCI) gel was run at 120 V for ~40 min on an electrophoresis equipment (Bio‐Rad). Before electrophoresis, extracted plasmids were mixed with the Purple Gel Loading Dye (6×, no SDS; New England Biolabs) and loaded into wells in the agarose gel. Quick‐Load® Purple 1 kb DNA Ladder (New England Biolabs) or Quick‐Load® 1 kb Extend DNA Ladder (New England Biolabs) was used for the reference of DNA length. Gel images were inverted by ImageJ for visualization purpose.
Plate reader measurement of bacterial growth
To measure the growth rate of recA + and recA − E. coli donors, overnight culture was diluted to OD600 0.1 in LB and transferred to a 96‐well black and clear‐bottom CELLSTAR® format sterile cell culture microplate (Greiner Bio‐One). The plate was sealed with Breathe‐Easy Adhesive Microplate Seal (Thermo Fisher Scientific) and cultured with shaking in the TECAN Spark 10 M Multimode Microplate Reader for time‐series OD600 measurements. A delay growth model was fitted to the time‐series OD600 measurements to infer the cell doubling time (Appendix S1 and S2).
Flow cytometer measurement of SOS response in E. coli population
To characterize SOS response in E. coli population, cell cultures of different E. coli strains with the SOS response reporter plasmid pBbA6c_PsulA_sfGFP were diluted to OD600 0.1 and cultured at 37°C with shaking (250 rpm) for 6 h. GFP expression was measured by the LSRFortessa X‐20 Flow Cytometer (BD Biosciences). A blue (488 nm) laser was used for GFP excitation, and a 530/30 nm filter was used for GFP emission. To quantify the percentage of SOS response‐activated cells, a threshold of GFP 10,000 (a.u.) was used to define the GFP ON subpopulation. Data analysis was performed using a customized MATLAB script. The distribution of GFP and Forward Scatter of single cells was plotted using FlowJo.
Microscopic imaging of single cells
To image single cells of E. coli and B. subtilis in the co‐culture, an overnight culture of each strain was first diluted to OD600 0.1 into LB supplemented with 50 mM xylose. Cells were co‐cultured for 3 h, and 4 μl of the cell culture was transferred to a glass slide. Five microliter 0.1% (w/v) Poly‐L‐lysine (Millipore Sigma) was spread evenly on the glass slide to allow the cells to adhere to the surface. Pipetting was avoided to prevent the disruption of the physically associated cells. A coverslip was gently placed on the culture on the glass slide.
Single cells were imaged by Ti‐E Eclipse inverted microscope (Nikon) with 40× magnification. GFP, RFP, and phase‐contrast images were taken from multiple spots on the glass slide. Filters used for GFP (Chroma) were 470/40 nm (excitation) and 525/50 nm (emission). Filters used for RFP (Chroma) were 560/40 nm (excitation) and 630/70 nm (emission). To image SOS response of single cells, cell culture of E. coli MG1655 with the SOS response reporter plasmid pBbA6c_PsulA_sfGFP and pBB275 or pUC19 was diluted to an OD600 0.1 and cultured at 37°C with shaking (250 rpm) for 6 h. Four microliter cell culture was transferred to the glass slide and imaged by Nikon Eclipse Ti Microscope with 40× magnification. Phase‐contrast and GFP images were taken to determine the presence of filamentous and fluorescent cells in E. coli MG1655 harboring pBB275.
Bioinformatic analysis of plasmid transfer to Bacillus and non‐Bacillus bacteria
To search E. coli plasmid replication origins in the Genus Bacillus, ColE1 (589 bp in pUC19, Addgene Plasmid #50005), p15A (712 bp in pBbA6c‐RFP, Addgene Plasmid #35290), CloDF13 (739 bp in pCSaE500, Addgene Plasmid #53182), and pSC101 (2,224 bp in pBbS2k‐RFP, Addgene Plasmid #35330) were searched in NCBI RefSeq Genome Database. Nucleotide BLAST was optimized for highly similar sequences. The organism was limited to Bacillus (taxid:1386). Max target sequences of 5,000 were selected. To search E. coli plasmid replication origins in non‐Bacillus bacteria, the organism was limited to Bacteria (taxid:2) and excluded Escherichia (taxid:561) and Bacillus (taxid:1386). Accession date of data is 2021‐09‐03. Hits were listed in Dataset EV1. Hits with > 90% identity and > 80% percentage were selected for the analysis of sequence length. Query coverage is the percentage of the query sequence aligned to the hit sequence. Percent identity is the percentage of nucleotides that match the alignment. A sequence length longer than 106 bp suggests a potential genomic integration of plasmid. Shorter sequence lengths may be caused by the contamination of plasmid DNA during library preparation or sequencing steps (Wally et al, 2019). A phylogenetic tree was constructed by aligning 16S rRNA sequences using neighbor joining method in MEGA v10.2.6 (Kumar et al, 2018). To annotate genes near plasmid origin replication in Bacillus genomes, GenBank sequences were downloaded from NCBI website and analyzed using SnapGene Viewer v5.3.2.
Author contributions
Yu‐Yu Cheng: Conceptualization; software; validation; investigation; visualization; methodology; writing – original draft; writing – review and editing. Zhichao Zhou: Resources; software; investigation; methodology. James M Papadopoulos: Resources; investigation. Jason D Zuke: Resources; investigation. Tanya G Falbel: Resources; validation; investigation; methodology. Karthik Anantharaman: Resources; software; investigation. Briana M Burton: Conceptualization; resources; supervision; validation; investigation; methodology; project administration; writing – review and editing. Ophelia S Venturelli: Conceptualization; resources; supervision; funding acquisition; validation; investigation; visualization; methodology; writing – original draft; project administration; writing – review and editing.
Disclosure and competing interests statement
The authors declare that they have no conflict of interest.
Supporting information
Appendix
Dataset EV1
Source Data for Figure 1
Source Data for Figure 2
Source Data for Figure 3
Source Data for Figure 4
Acknowledgements
We would like to thank Zhengyi Chen for the assistance with experiments and Dr. Michael Cox for the sharing of E. coli RecA strains and suggestions. This work was supported by the Defense Advanced Research Projects Agency (DARPA) under grant number HR0011‐19‐2‐0002, National Institute of General Medical Sciences under grant number R35GM124774 and the Army Research Office under grant number W911NF1910269. Jason D Zuke was supported by the National Institutes of Health T32GM007215.
Mol Syst Biol. (2023) 19: e11406
Data availability
Nucleotide BLAST results of E. coli plasmid replication origins in bacterial genome are included in Dataset EV1. Source data of bacterial CFU, transformation frequency, HGT efficiency, and eDNA concentration in primary data can be downloaded from https://www.ebi.ac.uk/biostudies with the accession number S‐BSST1002.
References
- Arís A, Corchero JL, Benito A, Carbonell X, Viaplana E, Villaverde A (1998) The expression of recombinant genes from bacteriophage lambda strong promoters triggers the SOS response in Escherichia coli . Biotechnol Bioeng 60: 551–559 [DOI] [PubMed] [Google Scholar]
- Arnolds KL, Dahlin LR, Ding L, Wu C, Yu J, Xiong W, Zuniga C, Suzuki Y, Zengler K, Linger JG et al (2021) Biotechnology for secure biocontainment designs in an emerging bioeconomy. Curr Opin Biotechnol 71: 25–31 [DOI] [PubMed] [Google Scholar]
- Beaber JW, Hochhut B, Waldor MK (2004) SOS response promotes horizontal dissemination of antibiotic resistance genes. Nature 427: 72–74 [DOI] [PubMed] [Google Scholar]
- Bedbrook JR, Ausubel FM (1976) Recombination between bacterial plasmids leading to the formation of plasmid multimers. Cell 9: 707–716 [DOI] [PubMed] [Google Scholar]
- Berry JL, Cehovin A, McDowell MA, Lea SM, Pelicic V (2013) Functional analysis of the interdependence between DNA uptake sequence and its cognate ComP receptor during natural transformation in Neisseria species. PLoS Genet 9: e1004014 [DOI] [PMC free article] [PubMed] [Google Scholar]
- Boman HG, Eriksson KG (1963) Penicillin‐induced lysis in Escherichia coli . J Gen Microbiol 31: 339–352 [DOI] [PubMed] [Google Scholar]
- Borgeaud S, Metzger LC, Scrignari T, Blokesch M (2015) The type VI secretion system of vibrio cholerae fosters horizontal gene transfer. Science 347: 63–67 [DOI] [PubMed] [Google Scholar]
- Canosi U, Morelli G, Trautner TA (1978) The relationship between molecular structure and transformation efficiency of some S. aureus plasmids isolated from B. subtilis . Mol Gen Genet 166: 259–267 [DOI] [PubMed] [Google Scholar]
- Clarke M, Maddera L, Harris RL, Silverman PM (2008) F‐pili dynamics by live‐cell imaging. Proc Natl Acad Sci USA 105: 17978–17981 [DOI] [PMC free article] [PubMed] [Google Scholar]
- Cooper RM, Tsimring L, Hasty J (2017) Inter‐species population dynamics enhance microbial horizontal gene transfer and spread of antibiotic resistance. Elife 6: e25950 [DOI] [PMC free article] [PubMed] [Google Scholar]
- Egbert RG, Rishi HS, Adler BA, McCormick DM, Toro E, Gill RT, Arkin AP (2019) A versatile platform strain for high‐fidelity multiplex genome editing. Nucleic Acids Res 47: 3244–3256 [DOI] [PMC free article] [PubMed] [Google Scholar]
- Erental A, Kalderon Z, Saada A, Smith Y, Engelberg‐Kulka H (2014) Apoptosis‐like death, an extreme SOS response in Escherichia coli . MBio 5: e01426‐14 [DOI] [PMC free article] [PubMed] [Google Scholar]
- Finkel SE, Kolter R (2001) DNA as a nutrient: novel role for bacterial competence gene homologs. J Bacteriol 183: 6288–6293 [DOI] [PMC free article] [PubMed] [Google Scholar]
- Frenkel L, Bremer H (1986) Increased amplification of plasmids pBR322 and pBR327 by low concentrations of chloramphenicol. DNA 5: 539–544 [DOI] [PubMed] [Google Scholar]
- García‐Bayona L, Comstock LE (2018) Bacterial antagonism in host‐associated microbial communities. Science 361: eaat2456 [DOI] [PubMed] [Google Scholar]
- Goto A, Kunioka M (1992) Biosynthesis and hydrolysis of poly(γ‐glutamic acid) from Bacillus subtilis IF03335. Biosci Biotechnol Biochem 56: 1031–1035 [DOI] [PubMed] [Google Scholar]
- Hakenbeck R, Grebe T, Zähner D, Stock JB (1999) β‐Lactam resistance in Streptococcus pneumoniae: penicillin‐binding proteins and non‐penicillin‐binding proteins. Mol Microbiol 33: 673–678 [DOI] [PubMed] [Google Scholar]
- Haudiquet M, Buffet A, Rendueles O, Rocha EPC (2021) Interplay between the cell envelope and mobile genetic elements shapes gene flow in populations of the nosocomial pathogen klebsiella pneumoniae. PLoS Biol 19: e3001276 [DOI] [PMC free article] [PubMed] [Google Scholar]
- Ibáñez de Aldecoa AL, Zafra O, González‐Pastor JE (2017) Mechanisms and regulation of extracellular DNA release and its biological roles in microbial communities. Front Microbiol 8: 1390 [DOI] [PMC free article] [PubMed] [Google Scholar]
- Jensen A, Valdórsson O, Frimodt‐Møller N, Hollingshead S, Kilian M (2015) Commensal streptococci serve as a reservoir for β‐lactam resistance genes in Streptococcus pneumoniae . Antimicrob Agents Chemother 59: 3529–3540 [DOI] [PMC free article] [PubMed] [Google Scholar]
- Johnson AD, Poteete AR, Lauer G, Sauer RT, Ackers GK, Ptashne M (1981) λ repressor and cro – components of an efficient molecular switch. Nature 294: 217–223 [DOI] [PubMed] [Google Scholar]
- Johnson SA, Ormsby MJ, McIntosh A, Tait SWG, Blyth K, Wall DM (2019) Increasing the bactofection capacity of a mammalian expression vector by removal of the f1 ori. Cancer Gene Ther 26: 183–194 [DOI] [PMC free article] [PubMed] [Google Scholar]
- Johnston C, Martin B, Fichant G, Polard P, Claverys J‐P (2014) Bacterial transformation: distribution, shared mechanisms and divergent control. Nat Rev Microbiol 12: 181–196 [DOI] [PubMed] [Google Scholar]
- Juhas M, Wong C, Ajioka JW (2016) Combining genes from multiple phages for improved cell lysis and DNA transfer from Escherichia coli to Bacillus subtilis . PLoS ONE 11: 0165778 [DOI] [PMC free article] [PubMed] [Google Scholar]
- Kaneko S, Itaya M (2010) Designed horizontal transfer of stable giant DNA released from Escherichia coli . J Biochem 147: 819–822 [DOI] [PubMed] [Google Scholar]
- Konkol MA, Blair KM, Kearns DB (2013) Plasmid‐encoded comi inhibits competence in the ancestral 3610 strain of Bacillus subtilis . J Bacteriol 195: 4085–4093 [DOI] [PMC free article] [PubMed] [Google Scholar]
- Kowalczykowski SC, Eggleston AK (1994) Homologous pairing and DNA strand‐exchange proteins. Annu Rev Biochem 63: 991–1043 [DOI] [PubMed] [Google Scholar]
- Kumar S, Stecher G, Li M, Knyaz C, Tamura K (2018) MEGA X: molecular evolutionary genetics analysis across computing platforms. Mol Biol Evol 35: 1547–1549 [DOI] [PMC free article] [PubMed] [Google Scholar]
- Lee J, Kim HC, Kim SW, Kim SW, Hong SI, Park YH (2002) Interplay of SOS induction, recombinant gene expression, and multimerization of plasmid vectors in Escherichia coli . Biotechnol Bioeng 80: 84–92 [DOI] [PubMed] [Google Scholar]
- Lerminiaux NA, Cameron ADS (2019) Horizontal transfer of antibiotic resistance genes in clinical environments. Can J Microbiol 65: 34–44 [DOI] [PubMed] [Google Scholar]
- Lopatkin AJ, Huang S, Smith RP, Srimani JK, Sysoeva TA, Bewick S, Karig DK, You L (2016) Antibiotics as a selective driver for conjugation dynamics. Nat Microbiol 1: 16044 [DOI] [PMC free article] [PubMed] [Google Scholar]
- Lutz R, Bujard H (1997) Independent and tight regulation of transcriptional units in Escherichia coli via the LacR/O, the TetR/O and AraC/I1‐I2 regulatory elements. Nucleic Acids Res 25: 1203–1210 [DOI] [PMC free article] [PubMed] [Google Scholar]
- Maree M, Thi Nguyen LT, Ohniwa RL, Higashide M, Msadek T, Morikawa K (2022) Natural transformation allows transfer of SCCmec‐mediated methicillin resistance in Staphylococcus aureus biofilms. Nat Commun 13: 1–14 [DOI] [PMC free article] [PubMed] [Google Scholar]
- Maslowska KH, Makiela‐Dzbenska K, Fijalkowska IJ (2019) The SOS system: a complex and tightly regulated response to DNA damage. Environ Mol Mutagen 60: 368–384 [DOI] [PMC free article] [PubMed] [Google Scholar]
- Maurice CF, Haiser HJ, Turnbaugh PJ (2013) Xenobiotics shape the physiology and gene expression of the active human gut microbiome. Cell 152: 39–50 [DOI] [PMC free article] [PubMed] [Google Scholar]
- McCool JD, Long E, Petrosino JF, Sandler HA, Rosenberg SM, Sandler SJ (2004) Measurement of SOS expression in individual Escherichia coli K‐12 cells using fluorescence microscopy. Mol Microbiol 53: 1343–1357 [DOI] [PubMed] [Google Scholar]
- Nagler M, Insam H, Pietramellara G, Ascher‐Jenull J (2018) Extracellular DNA in natural environments: features, relevance and applications. Appl Microbiol Biotechnol 102: 6343–6356 [DOI] [PMC free article] [PubMed] [Google Scholar]
- Overballe‐Petersen S, Harms K, Orlando LAA, Mayar JVM, Rasmussen S, Dahl TW, Rosing MT, Poole AM, Sicheritz‐Ponten T, Brunak S et al (2013) Bacterial natural transformation by highly fragmented and damaged DNA. Proc Natl Acad Sci USA 110: 19860–19865 [DOI] [PMC free article] [PubMed] [Google Scholar]
- Overkamp W, Beilharz K, Weme RDO, Solopova A, Karsens H, Kovács ÁT, Kok J, Kuipers OP, Veening J‐W (2013) Benchmarking various green fluorescent protein variants in Bacillus subtilis, Streptococcus pneumoniae, and Lactococcus lactis for live cell imaging. Appl Environ Microbiol 79: 6481–6490 [DOI] [PMC free article] [PubMed] [Google Scholar]
- Paul JH, Thurmond JM, Frischer ME, Cannon JP (1992) Intergeneric natural plasmid transformation between E. coli and a marine Vibrio species. Mol Ecol 1: 37–46 [DOI] [PubMed] [Google Scholar]
- Pavlopoulou A (2018) RecA: a universal drug target in pathogenic bacteria. Front Biosci (Landmark Ed) 23: 36–42 [DOI] [PubMed] [Google Scholar]
- Prudhomme M, Attaiech L, Sanchez G, Martin B, Claverys J‐P (2006) Antibiotic stress induces genetic transformability in the human pathogen Streptoccus pneumoniae . Science 313: 89–92 [DOI] [PubMed] [Google Scholar]
- Robinson A, McDonald JP, Caldas VEA, Patel M, Wood EA, Punter CM, Ghodke H, Cox MM, Woodgate R, Goodman MF et al (2015) Regulation of mutagenic DNA polymerase V activation in space and time. PLoS Genet 11: 1005482 [DOI] [PMC free article] [PubMed] [Google Scholar]
- Ropars J, Rodríguez de la Vega RC, López‐Villavicencio M, Gouzy J, Sallet E, Dumas É, Lacoste S, Debuchy R, Dupont J, Branca A et al (2015) Adaptive horizontal gene transfers between multiple cheese‐associated fungi. Curr Biol 25: 2562–2569 [DOI] [PMC free article] [PubMed] [Google Scholar]
- Sauerbier J, Maurer P, Rieger M, Hakenbeck R (2012) Streptococcus pneumoniae R6 interspecies transformation: genetic analysis of penicillin resistance determinants and genome‐wide recombination events. Mol Microbiol 86: 692–706 [DOI] [PubMed] [Google Scholar]
- Shehadul Islam M, Aryasomayajula A, Selvaganapathy P (2017) A review on macroscale and microscale cell lysis methods. Micromachines 8: mi8030083 [Google Scholar]
- Simmons LA, Foti JJ, Cohen SE, Walker GC (2008) The SOS regulatory network. EcoSal Plus 3: ecosalplus.5.4.3 [DOI] [PubMed] [Google Scholar]
- Soucy SM, Huang J, Gogarten JP (2015) Horizontal gene transfer: building the web of life. Nat Rev Genet 16: 472–482 [DOI] [PubMed] [Google Scholar]
- Stewart GJ, Carlson CA, Ingraham JL (1983) Evidence for an active role of donor cells in natural transformation of Pseudomonas stutzeri . J Bacteriol 156: 30–35 [DOI] [PMC free article] [PubMed] [Google Scholar]
- Tribble GD, Rigney TW, Dao DHV, Wong CT, Kerr JE, Taylor BE, Pacha S, Kaplan HB (2012) Natural competence is a major mechanism for horizontal DNA transfer in the oral pathogen Porphyromonas gingivalis . MBio 3: e00231‐11 [DOI] [PMC free article] [PubMed] [Google Scholar]
- Usajewicz I, Nalepa B (2006) Survival of Escherichia coli O157:H7 in milk exposed to high temperatures and high pressure. Food Technol Biotechnol 44: 33–39 [Google Scholar]
- Wally N, Schneider M, Thannesberger J, Kastner MT, Bakonyi T, Indik S, Rattei T, Bedarf J, Hildebrand F, Law J et al (2019) Plasmid DNA contaminant in molecular reagents. Sci Rep 9: 1652 [DOI] [PMC free article] [PubMed] [Google Scholar]
- Wang P, Yu Z, Li B, Cai X, Zeng Z, Chen X, Wang X (2015) Development of an efficient conjugation‐based genetic manipulation system for Pseudoalteromonas . Microb Cell Fact 14: 11 [DOI] [PMC free article] [PubMed] [Google Scholar]
- Wein T, Hülter NF, Mizrahi I, Dagan T (2019) Emergence of plasmid stability under non‐selective conditions maintains antibiotic resistance. Nat Commun 10: 2595 [DOI] [PMC free article] [PubMed] [Google Scholar]
- Whitchurch CB, Tolker‐Nielsen T, Ragas PC, Mattick JS (2002) Extracellular DNA required for bacterial biofilm formation. Science 295: 1487 [DOI] [PubMed] [Google Scholar]
- Wholey W‐Y, Kochan TJ, Storck DN, Dawid S (2016) Coordinated bacteriocin expression and competence in Streptococcus pneumoniae contributes to genetic adaptation through neighbor predation. PLoS Pathog 12: e1005413 [DOI] [PMC free article] [PubMed] [Google Scholar]
- Witkin EM (1967) The radiation sensitivity of Escherichia coli B: a hypothesis relating filament formation and prophage induction. Proc Natl Acad Sci USA 57: 1275–1279 [DOI] [PMC free article] [PubMed] [Google Scholar]
- Zafra O, Lamprecht‐Grandío M, de Figueras CG, González‐Pastor JE (2012) Extracellular DNA release by undomesticated Bacillus subtilis is regulated by early competence. PLoS ONE 7: e48716 [DOI] [PMC free article] [PubMed] [Google Scholar]
- Zeigler DR, Prágai Z, Rodriguez S, Chevreux B, Muffler A, Albert T, Bai R, Wyss M, Perkins JB (2008) The origins of 168, W23, and other Bacillus subtilis legacy strains. J Bacteriol 190: 6983–6995 [DOI] [PMC free article] [PubMed] [Google Scholar]
- Zhang X‐Z, Zhang Y‐HP (2011) Simple, fast and high‐efficiency transformation system for directed evolution of cellulase in Bacillus subtilis . J Microbial Biotechnol 4: 98–105 [DOI] [PMC free article] [PubMed] [Google Scholar]
- Zhang X, Jin T, Deng L, Wang C, Zhang Y, Chen X (2018) Stress‐induced, highly efficient, donor cell‐dependent cell‐to‐cell natural transformation in Bacillus subtilis . J Bacteriol 200: e00267‐18 [DOI] [PMC free article] [PubMed] [Google Scholar]