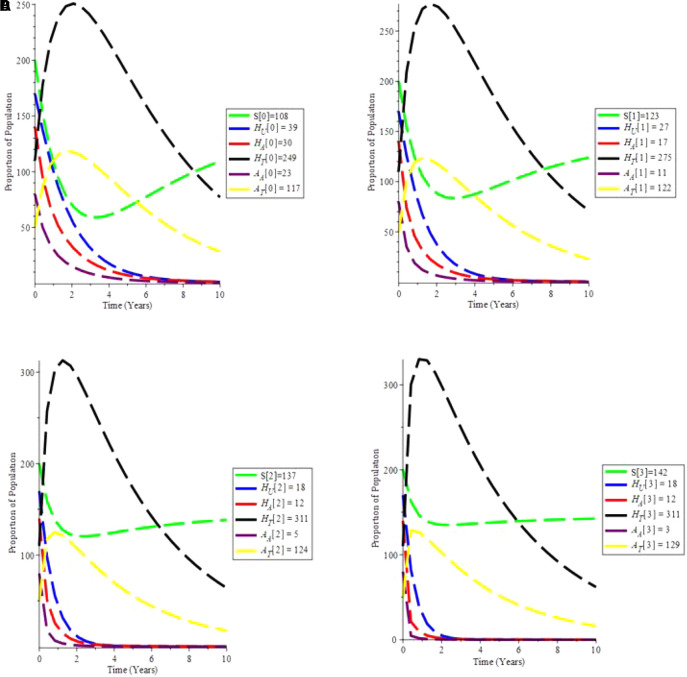
Figure 7. (Simulation 6) Proportion of different Population at the increased values of α and θ.
A. Proportion of Population when α = 0.7 and θ = 1.6949. B. Proportion of Population when α = 0.9 and θ = 2.6949. C. Proportion of Population when α = 1.5 and θ = 4.6949. D. Proportion of Population when α = 1.9 and θ = 9.6949.

