Objectives
The aims were to investigate if potassium (39K) magnetic resonance imaging (MRI) can be used to analyze changes in the apparent tissue potassium concentration (aTPC) in calf muscle tissue after eccentric exercise and in delayed-onset muscle soreness, and to compare these to corresponding changes in the apparent tissue sodium concentration (aTSC) measured with sodium (23Na) MRI.
Materials and Methods
Fourteen healthy subjects (7 female, 7 male; 25.0 ± 2.8 years) underwent 39K and 23Na MRI at a 7 T MR system, as well as 1H MRI at a 3 T MR system. Magnetic resonance imaging data and blood samples were collected at baseline (t0), directly after performing eccentric exercise (t1) and 48 hours after exercise (t2). Self-reported muscle soreness was evaluated using a 10-cm visual analog scale for pain (0, no pain; 10, worst pain) at t0, t1, and t2. Quantification of aTPC/aTSC was performed after correcting the measured 39K/23Na signal intensities for partial volume and relaxation effects using 5 external reference phantoms. Edema volume and 1H T2 relaxation times were determined based on the 1H MRI data. Participants were divided according to their increase in creatine kinase (CK) level into high (CKt2 ≥ 10·CKt0) and low CK (CKt2 < 10·CKt0) subjects.
Results
Blood serum CK and edema volume were significantly increased 48 hours after exercise compared with baseline (P < 0.001). Six participants showed a high increase in blood serum CK level at t2 relative to baseline, whereas 8 participants had only a low to moderate increase in blood serum CK. All participants reported increased muscle soreness both at rest and when climbing stairs at t1 (0.4 ± 0.7; 1.4 ± 1.2) and t2 (1.6 ± 1.4; 4.8 ± 1.9) compared with baseline (0 ± 0; 0 ± 0). Moreover, aTSC was increased at t1 in exercised muscles of all participants (increase by 57% ± 24% in high CK, 73% ± 33% in low CK subjects). Forty-eight hours after training, subjects with high increase in blood serum CK still showed highly increased aTSC (increase by 79% ± 57% compared with t0). In contrast, aTPC at t2 was elevated in exercised muscles of low CK subjects (increase by 19% ± 11% compared with t0), in which aTSC had returned to baseline or below. Overall, aTSC and aTPC showed inverse evolution, with changes in aTSC being approximately twice as high as in aTPC.
Conclusions
Our results showed that 39K MRI is able to detect changes in muscular potassium concentrations caused by eccentric exercise. In combination with 23Na MRI, this enables a more holistic analysis of tissue ion concentration changes.
Key Words: potassium (39K) MRI, sodium (23Na) MRI, exercise, ultra-high field, muscle fatigue, ion perturbations
The distribution of potassium ions (K+) between the intracellular and extracellular space ([K+]i = 60–160 mM, [K+]e = 3.5–5 mM1) strongly contributes to the resting membrane potential of skeletal muscle cells and is therefore essential for their excitability. It is maintained by the Na+/K+-ATPase, which continuously transports 3 sodium (Na+) ions out of the cell and 2 K+ ions into the cell. During exercise, the Na+/K+-ATPase activity is increased to restore the equilibrium ion distribution after changes induced by the action potentials. However, at high stimulation frequencies, K+ efflux can exceed the capacity of the ion pumps, resulting in cell depolarization, and thus loss of cell excitability.2 Persisting ion perturbations, and mainly an increased K+ content within the interstitial space, are thought to be one cause for muscle fatigue.3
Shifts of ions and particularly K+ in skeletal muscle cells during and after exercise have been studied using ion-selective microelectrodes inserted into the muscle, microdialysis, muscle biopsies, or radioisotopes.1,2 However, due to their invasive character, such investigations are usually limited to a small number of participants and can lead to erroneous results if cells are damaged, for example, by insertion of needles. To perform studies on larger cohorts, both in healthy subjects and patients, noninvasive alternatives for the assessment of tissue ion concentrations are therefore desirable.
Sodium (23Na) and potassium (39K) magnetic resonance imaging (MRI) offer unique possibilities to noninvasively determine tissue ion concentrations. However, the application of 23Na and particularly 39K MRI in vivo is challenging due their intrinsically low MR signal caused by low tissue concentrations in combination with less favorable MR properties compared with protons (1H). Overall, the relative signal-to-noise ratio of 23Na and 39K MRI is only approximately 0.02% and 0.002% compared with conventional 1H MRI.4 Nevertheless, 23Na MRI has already been successfully applied in various studies to assess altered Na+ concentrations in skeletal muscle tissue.5–9 Moreover, recent advances in ultra-high field MRI10,11 have made it possible to perform 39K MRI in vivo with a sufficiently high signal-to-noise ratio to determine K+ concentrations in skeletal muscle tissue.12 However, 39K MRI has only been used to investigate K+ of resting, healthy muscle tissue so far.12–14
Eccentric contractions as a specific form of muscle work have gained a growing interest in several fields including sports training, physical medicine, and rehabilitation.15 The usage of eccentric exercise in athletes has proven its effectiveness to prevent sport injuries such as hamstring strain, and robust evidence supports its wide prescription in rehabilitation, notably in the treatment of tendinopathies.16,17 Otherwise, unaccustomed eccentric exercise is associated with exercise-induced muscle damage, which manifests itself by a range of clinical symptoms including delayed-onset muscle soreness (DOMS).15 Despite the widespread use of eccentric contractions, a significant gap remains in the understanding of the underlying metabolic mechanisms as a response to muscle damaging eccentric exercise.15
Hence, in this work, we aimed to investigate the feasibility of a noninvasive assessment of potassium shifts in skeletal muscle tissue using 39K MRI. We performed quantitative 39K MRI measurements of the lower leg to detect possible changes in the apparent tissue potassium concentration (aTPC) after eccentric exercise and in DOMS, and compared these to corresponding changes in the apparent tissue sodium concentration (aTSC) measured by 23Na MRI.
MATERIALS AND METHODS
Study Population
The study was performed in accordance with the Declaration of Helsinki. Measurements were approved by the local institutional ethics committee. Written informed consent was obtained from all subjects.
Fourteen healthy subjects (7 male, 7 female; mean age, 25.0 ± 2.8 years; height, 1.73 ± 0.09 m; body mass, 64.8 ± 9.9 kg; body mass index, 21.5 ± 1.6 kg/m2) were enrolled. The average common training frequency of the participants corresponded to grade 2 of the Valderrabano Sport Scale (2.2 ± 0.5) representing 1 to 5 hours of sports activity per week.18 All study participants were asked to forego sports 72 hours before and 48 hours after baseline measurements. Inclusion criteria were no history of chronic diseases, no current acute or overuse injuries of the lower limbs, and no history of muscle injury. Exclusion criteria were any symptoms of lower-limb muscle soreness in the 3 months before the study and regular training habits that included eccentric exercises.19
Study Design
Subjects underwent 39K/23Na MRI as well as 1H MRI at baseline (t0), directly after performing eccentric exercises (t1) and 48 hours after training (t2) (Fig. 1). Blood samples for the determination of serum potassium, serum sodium, and creatine kinase (CK) levels were drawn at t0, t1, and t2. Blood samples were taken directly before entering the MR scanner at t1. Self-reported muscle soreness was evaluated using a 10-cm visual analog scale for pain (0, no pain; 10, worst pain). Pain scores were reported at rest and during activity (going down stairs) at t0, t1, and t2.20
FIGURE 1.
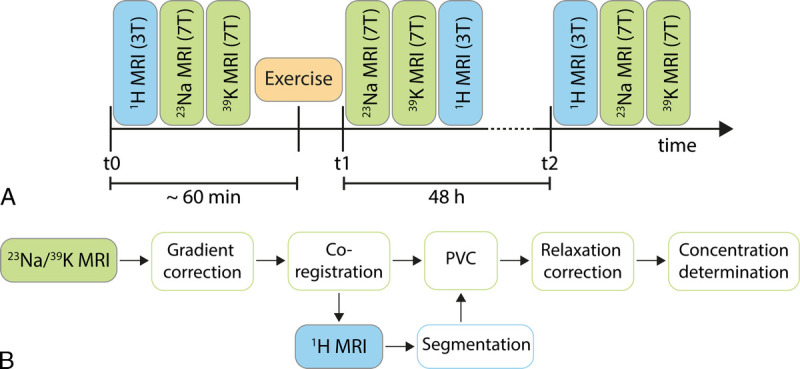
Study design (A) and postprocessing workflow of the 23Na/39K MRI data (B). MRI measurements were performed at baseline (t0), directly after performing a standardized eccentric exercise protocol (t1) and 48 hours after exercise (t2).
Exercise Intervention
All subjects performed a standardized exercise protocol of eccentric exercises of 1 randomized lower leg.19,21–23 For warm-up, 2 sets of heel raises (15 repetitions each), with a 20-second break between sets, were performed. The eccentric exercise was conducted in 4 sets of 50 repetitions each, with 60-second break between sets. A final fifth set was performed until muscle fatigue, so that no further repetition of eccentric exercise was possible. Exercises were carried out on a slant plate with a tilt of −35 degrees with the subject wearing a weighted vest bearing approximately 40% of their body weight, as described previously.19,21–23 One repetition was defined by contraction of the calf muscle for 1 second by raising the heel, with subsequent lowering of the heel within 3 seconds until the soles were below 0 degrees. To return to the starting position (heel raised), the participants had to pull themselves up on a pull-up bar installed above their heads to focus on eccentric contraction.
MRI Acquisitions
At baseline, MRI examinations were started with 1H MRI to ensure that participants rested for at least 30 minutes in supine position before X-nuclei MRI (23Na followed by 39K MRI) to reduce the impact of potential prior movements (eg, walking) and postural changes on the measured ion concentrations. Image acquisition at t1 was started with 23Na MRI and followed by 39K MRI after finishing the exercise and collecting the blood sample (≈5 minutes after end of exercise) to increase sensitivity toward changes in muscular ion concentrations. After the X-nuclei MRI protocol at 7 T, 1H MRI was started at 3 T (≈25–30 minutes after end of exercise). Forty-eight hours after exercise, measurements were conducted in the same way as at baseline.
23Na and 39K MRI data sets were acquired at a whole-body 7 T MRI system (Magnetom Terra; Siemens Healthcare GmbH, Erlangen, Germany) using a dual-tuned, quadrature birdcage 23Na/39K RF coil (Rapid Biomedical GmbH, Rimpar, Germany) tailored for calf examinations. The coil setup included a removable container including 5 chambers, which were filled with varying combinations of NaCl and KCl solution ([Na]/[K] = 10/240, 20/210, 25/180, 30/150, 40/120 mM) and used as external concentration references. To reduce motion effects during the acquisition, several cushions were used to fix the position of the leg within the 23Na/39K RF coil. Before 23Na/39K MRI measurements, B0 shimming was performed based on 23Na MRI data in combination with a constrained regularized algorithm.24 Quantitative 39K and 23Na MRI data were acquired using a 3D acquisition-weighted stack-of-stars (AW-SOSt) sequence applying a nonselective excitation pulse.25 Most relevant MRI measurement parameters are summarized in Table 1.
TABLE 1.
Measurement Parameters for Quantitative 23Na and 39K Acquisitions Performed at a 7 T MR System and 1H Acquisitions Performed at a 3 T MR System
| Acquisition | TR, ms | TE, ms | FA, Degrees | Readout Duration, ms | Resolution, mm3 | Slices | Radial Spokes | TAcq, min:s |
|---|---|---|---|---|---|---|---|---|
| 23Na AW-SOSt | 120 | 0.3 | 90 | 10.0 | 2.5 × 2.5 × 15 | 16 | 253 | 8:06 |
| 39K AW-SOSt | 40 | 0.35 | 90 | 5.0 | 7.5 × 7.5 × 30 | 8 | 84 | 8:58 |
| 1H T1 TSE | 588 | 13 | 150 | 4.0 | 0.8 × 0.8 × 3.5 | 110 | — | 4:53 |
| 1H T2 TIRM | 5480 | 68.0 | 145 | 4.1 | 0.8 × 0.8 × 3.5 | 26 | — | 2:35 |
| 1H MESE | 3000 | 9.5–304 (32 echoes) | 90–180 | 2.3 | 1.3 × 1.3 × 10 | 5 | — | 3:56 |
MESE, multiecho spin echo; MR, magnetic resonance; TR, repetition time; TE, echo time; FA, flip angle; AW-SOSt, acquisition-weighted stack-of-stars; TSE, turbo spin echo; TIRM, turbo inversion recovery magnitude.
Because of technical restrictions, 1H MRI measurements of the lower leg with a sufficiently large field of view and adequate signal homogeneity could not be performed at 7 T. Thus, 1H MRI examinations were performed at a 3 T whole-body system (Magnetom Prisma; Siemens Healthcare GmbH, Erlangen, Germany) using an 18-channel flexible RF coil wrapped around the lower leg. 1H MRI included an axial T1-weighted turbo spin echo (TSE) sequence, axial and coronal T2-weighted turbo inversion recovery magnitude (TIRM) sequences, and multiecho spin echo measurement. Both MR scanners (3 T and 7 T) were located in adjacent rooms.
To simplify image coregistration between the 23Na and 1H MRI data, legs were placed in a similar way on top of the reference container during both 7 T and 3 T acquisitions. In addition, the position of the largest circumference of the calf was marked at baseline to ensure a reproducible positioning of the leg at all measurement times.
Data Evaluation
For quantitative evaluation of the data, all MRI scans were interpolated to match the T1 TSE 1H image resolution and coregistered to the T1-weighted 1H data using an affine image registration.26 The reading of the images and the manual segmentation were performed by one board-certificated radiologist with 8 years of experience in musculoskeletal MRI. T1-weighted 1H images were segmented manually into gastrocnemius muscle, medial and lateral head (GM/GL), soleus muscle (SOL), and tibialis anterior muscle (TA). The corresponding muscle volume was calculated by multiplying the area of the segments by the slice thickness and adding up all slices. In addition, the entire intrafascial muscle tissue, subcutaneous adipose tissue (SAT), and bones (tibia/fibula) were segmented using a semiautomatic approach.27 Water T2 relaxation times were determined based on the multiecho spin echo data by a single-compartment T2 fit.
Moreover, the intramuscular edema volume within GM was determined based on T2 TIRM 1H MRI data by manual segmentation (Chimaera GmbH, Erlangen, Germany). The quantification of intramuscular edema was performed according to a previously published threshold-based approach.20,21 Hyperintense vessels were segmented in the baseline images and subtracted from the segmented edema volume in the postexercise images.20,21
Postprocessing of the 23Na/39K data sets is visualized in Figure 1B. First, 23Na/39K raw data sets were reconstructed offline using a nonuniform fast Fourier transform.28 Before coregistration to the 1H images, a correction for gradient nonlinearities29 was performed. Then, a region-based partial volume correction using the tissue masks as described previously was applied to the 23Na and 39K data.12,30 In this partial volume correction approach, a varying average residual quadrupolar interaction for 39K nuclei in individual lower leg muscles (ωq = 151 Hz for GM/GL, ωq = 102 Hz for SOL, and ωq = 194 Hz in TA)31 was considered to calculate the strength of signal blurring. Moreover, 23Na/39K signal intensities were corrected for relaxation effects assuming known relaxation times.12 Finally, aTSC and aTPC values were determined using the corrected signal intensities based on 5 external references containing NaCl and KCl solution by a linear regression.
Classification of Subjects
For evaluation of the quantitative MR measures, participants were divided according to their increase in blood serum CK level 48 hours after exercise, which can serve as a marker for muscle damage. For example, a mild exercised-induced muscle damage is generally accompanied by a low serum/plasma CK activity (below approximately 1000 IU/L).32 In contrast, a high serum/plasma CK activity (>10,000 IU/L) can provide evidence of severe muscle damage.32 Therefore, participants with a low increase in blood serum CK (CKt2 < 10·CKt0) were denoted as “low CK,” and subjects with a high increase in blood serum CK level (CKt2 ≥ 10·CKt0) were denoted as “high CK.”
Statistical Analysis
Results are presented as mean ± SD. Statistical analysis was performed using the MATLAB statistics toolbox (Matlab 2019b; The MathWorks). Values were checked for normality with the Shapiro-Wilk test. In case of normality, an analysis of variance test with a Bonferroni correction as post hoc test was performed. If distributions were nonnormal, Friedman test with Wilcoxon signed rank test and Bonferroni correction was applied. Pearson correlations were calculated between different variables when data were normally distributed. If data distribution was nonnormal, Spearman correlation was determined. A P value <0.05 was considered significant.
RESULTS
In all participants, DOMS was successfully induced, indicated by an increased blood serum CK value and intramuscular edema volume at t2 compared with t0 (P < 0.001, compare Fig. 2). In contrast, blood serum Na+ and K+ concentrations remained stable over time. All acquired blood serum values as well as quantitative MRI measures can be found in the Supplemental Content (http://links.lww.com/RLI/A764). Six participants showed a high increase in blood serum CK level at t2 relative to baseline (CKt2 ≥ 10·CKt0; 4 female, 2 male), whereas 8 participants had only a low to moderate increase in blood serum CK (CKt2 < 10·CKt0). All participants reported increased muscle soreness both at rest and when climbing stairs at t1 (0.4 ± 0.7; 1.4 ± 1.2) and t2 (1.6 ± 1.4; 4.8 ± 1.9) compared with baseline (0 ± 0; 0 ± 0). Because of technical issues, no 39K MRI measurements could be performed for one subject directly after exercise.
FIGURE 2.

Intramuscular edema volume determined based on 1H T2 TIRM images (A), together with blood serum CK values (B), blood serum Na+ (C), and K+ concentrations (D) at baseline (t0), directly after eccentric exercise (t1) and 48 hours after training (t2). Blood serum CK (note the logarithmic scale of CK values) and intramuscular edema volumes at t2 were significantly increased compared with baseline. Significant changes between individual time points were marked with an asterisk.
Figure 3 shows exemplary 23Na and 39K MRI scans together with corresponding T2 TIRM 1H images of a female subject with a hardly visible intramuscular edema volume and low increase in blood serum CK at t2 compared with baseline (CKt2/CKt0 = 2). For comparison, MRI scans of a male subject with intramuscular edema affecting a large area of the GM and strong increase in blood serum CK at t2 compared with baseline (CKt2/CKt0 = 55) are depicted in Figure 4.
FIGURE 3.
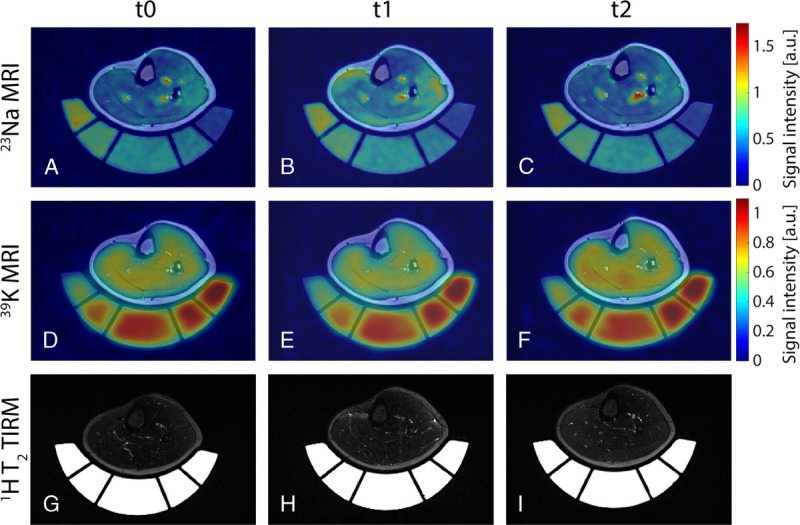
Axial view of 23Na (A–C) and 39K (D–F) MRI scans overlaid to corresponding 1H T1 TSE image, together with T2 TIRM 1H images (G–I) of a female subject (age 24 years) with a low increase in blood serum CK (CKt2 = 2·CKt0). 23Na/39K MR signal intensities were normalized to the mean signal intensity within the reference compartment containing the highest ion concentration each. Directly after exercise (t1), the 23Na concentration was elevated by 104%/80% in the medial/lateral head of gastrocnemius muscle (GM/GL) and by 23% in soleus muscle (SOL) compared with baseline (t0). In contrast, it was reduced by 11% in tibialis anterior (TA) muscle. The 39K concentration was increased at t2 by 39% in GL and approximately 5% in GM and SOL compared with baseline.
FIGURE 4.
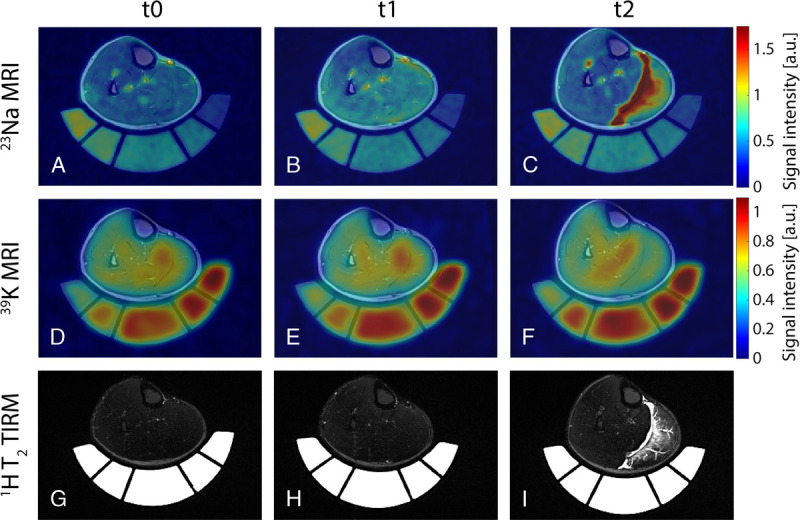
Axial view of 23Na (A–C) and 39K (D–F) MRI scans overlaid to corresponding 1H T1 TSE image, together with T2 TIRM 1H images (G–I) of a male subject (age 20 years) with a high increase in blood serum CK (CKt2 = 55·CKt0). In this subject, T2 TIRM 1H MRI scans revealed strong intramuscular edema 48 hours after exercise (t2) with affection of the fascia and fluid accumulation within the fascial layers. Although evolution of the 23Na/39K signal intensity directly after exercise was comparable to the subject shown in Figure 3, the 23Na concentration was highly increased in GM/GL at t2 (increase by 146%/66%). Particularly, regions of strongly elevated 23Na MR signal corresponded to areas of intramuscular edema as indicated by the 1H T2 TIRM images. Simultaneously, these regions showed a reduced 39K MR signal (20% reduction in TPC in GM at t2 compared with t0).
Boxplots of determined aTSC and aTPC values, together with 1H T2 relaxation times and muscle volumes of primarily exercised muscles (GM and GL), are presented in Figure 5. Figure 6 shows the evolution of the 4 evaluated measures in GM/GL over time relative to the corresponding baseline value for all high and low CK subjects. Directly after exercise, aTSC values in exercised muscles were significantly increased by 57% ± 24% in high CK and 73% ± 33% in low CK subjects (P < 0.001 and P = 0.001, respectively). After 48 hours, aTSC was still significantly increased by 79% ± 57% compared with baseline in high CK subjects (P < 0.001). In contrast, aTPC was significantly increased by 19% ± 11% in low CK subjects at t2 compared with baseline (P < 0.001).
FIGURE 5.
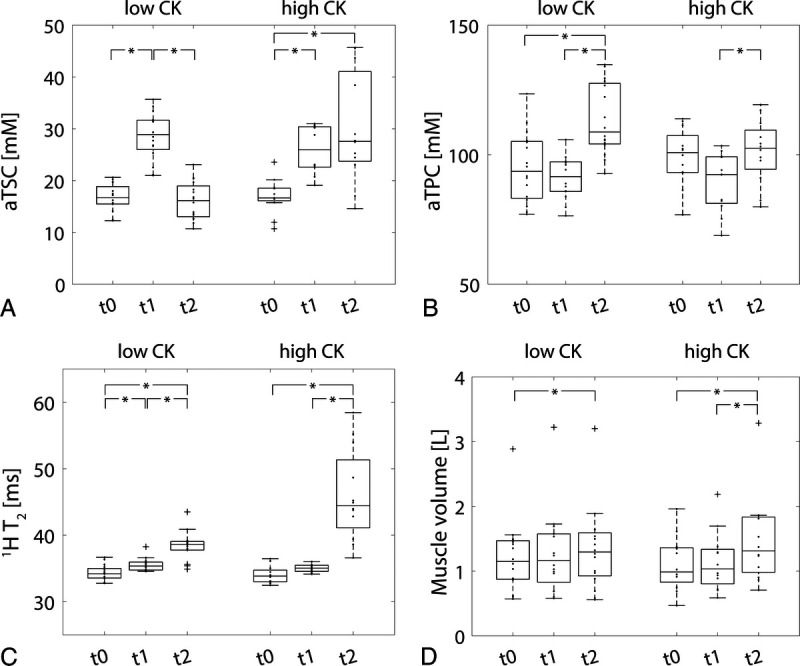
aTSC (A), aTPC (B), 1H T2 relaxation times (C), and muscle volume (D) of primarily exercised muscles (GM and GL) in low and high CK subjects at baseline (t0), directly after exercise (t1) and 48 hours after training (t2). Significant differences between measurement time points were marked with an asterisk.
FIGURE 6.
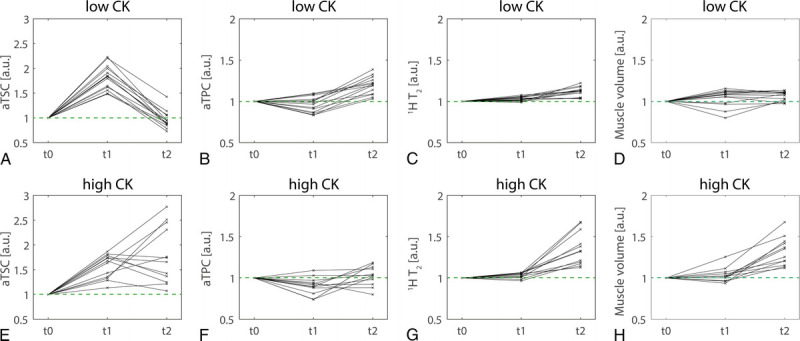
Evolution of aTSC (A, E), aTPC (B, F), 1H T2 relaxation times (C, G), and muscle volume (D, H) in exercised muscles (GM and GL) directly after exercise (t1) and 48 hours after training (t2) relative to baseline values (t0, compare green dashed lines). Overall, changes in aTSC, 1H T2, and muscle volume were stronger in high CK participants, with highly elevated values at t2. Evolution of aTPC differed from the other evaluated MR parameters, with more elevated values in low CK participants than in high CK participants.
Moreover, the 1H T2 relaxation times were increased at t2 by 13% ± 6%/32% ± 17% for low/high CK (P < 0.001 for both low/high CK). Also, the muscle volumes of low and high CK subjects were significantly increased by 9% ± 8% and 32% ± 17%, respectively, at t2 compared with baseline (P = 0.03 and P < 0.001 for low/high CK).
In nonexercised muscles (SOL and particularly TA), the evaluated measures mostly remained at baseline level (compare Supplemental Content 2–4, http://links.lww.com/RLI/A764).
Correlations between the individual quantitative MR measures at t1 and t2 in exercised muscles relative to baseline are shown in Figure 7. In low CK subjects, there was only a significant correlation between aTSC and 1H T2 at t2 (P = 0.009). However, in high CK subjects, aTSC significantly correlated with aTPC, 1H T2, and muscle volume at t2 (P = 0.02, P < 0.001, and P = 0.02). Moreover, there was a significant correlation between aTPC and 1H T2 at t2 (P = 0.02), as well as between muscle volume and 1H T2 both at t1 and t2 in high CK participants (P = 0.04 and P = 0.001).
FIGURE 7.
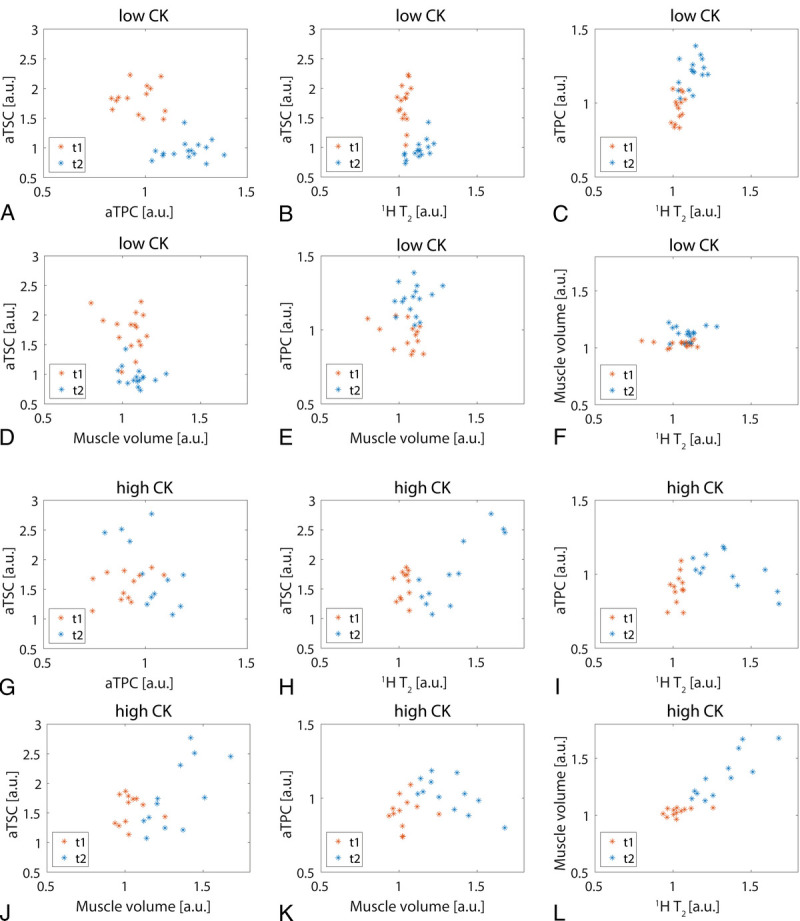
Correlation between aTSC, aTPC, 1H T2, and muscle volume directly after exercise (t1) and 48 hours after training (t2) relative to baseline values for exercised muscles (GM/GL) in low CK (A–F) and high CK (G–L) participants. Only aTSC and 1H T2 significantly correlated at t2 for low CK subjects (P = 0.009), whereas there were significant correlations between several measures at t2 for high CK subjects.
DISCUSSION
In this study, we showed that 39K MRI is able to detect changes in muscular K+ concentrations caused by eccentric exercise and in DOMS. Combined with 23Na MRI, this enables a more holistic analysis of tissue ion concentration changes.
In subjects with a high increase in blood serum CK value, we found a reduced muscular K+ concentration directly after eccentric exercise and aTPC values close to baseline at t2. A decrease of total muscle K+ content after prolonging exercise can be explained by K+ redistribution to remote tissues and resting muscles.2 Using muscle biopsies, a loss of approximately 10% of total muscular K+ (466 mM/[kg dry weight] to 430 mM/[kg dry weight]) after dynamic knee extension has been reported,33 which is in line with our observations in high CK subjects. These changes in total muscular K+ consisted of a decreased intracellular K+ (165 to 129 mM) and increased extracellular K+ (4.5 to >6.0 mM), together with an increased extracellular water content.33 The initial loss in muscular K+ might have been even higher, as 39K MRI was performed approximately 15 minutes after participants finished exercising (compare Fig. 1).
In addition, low CK participants exhibited a significantly increased aTPC 48 hours after training compared with baseline and t1. This could be caused by a K+ redistribution into the intracellular space after intense exercise, which might even exceed baseline conditions. A prolonged period of hypokalemia after exercise compared with pre-exercise has been reported by Lindinger et al.34 However, there are no data available on muscular K+ concentration changes several hours to days after exercise in the literature. As the measured aTPC values are sensitive to the relaxation times and residual quadrupolar interactions of the 39K nuclei,31 an altered aTPC might also reflect changes in the surrounding environment of the 39K nuclei. Additional investigations will therefore be required to determine the processes causing the observed increased aTPC.
In addition, we observed an increased aTSC directly after exercise in all participants, which could partially be explained by an elevated muscle perfusion.23 Although in low CK participants, aTSC returned to baseline or even below after 48 hours, aTSC of high CK participants was (strongly) increased in exercised muscles. These results are in line with previous studies, which performed 23Na MRI after exercise at 3 T.35–37 Different studies have reported a decline of 23Na MR signal intensity after exercise with a half-life of approximately 22 minutes,35,36 or a recovery to baseline within 50 minutes.37 Intramuscular edema could be a main source of an increased aTSC 48 hours after training as 1H T2 relaxation times highly correlated with aTSC at t2, particularly in high CK subjects. However, whereas 1H T2 relaxation times were increased in all participants at t2 compared with baseline, some low CK subjects exhibited aTSC values below baseline at t2. Together with a simultaneously elevated aTPC 48 hours after exercise, this leads to the assumption that in low CK participants, the observed ion shifts might not only be connected to edema.
In contrast to muscular ion concentrations, we did not observe any significant changes in K+ or Na+ in blood serum of participants. Increased plasma K+ concentrations of 8–9 mM in veins draining exercised muscles have been measured during and directly after high intensity exercise,38–40 which returned to baseline with a half-time of approximately 30 seconds after end of training.38,39 In addition, exercise-induced hypokalemia with minimum values of 3 to 3.5 mM were observed 5 to 10 minutes after exercise cessation,1 and plasma (K+) remained below baseline level for >1 hour.41 Although we collected blood samples directly after exercise, the time between muscle activity and blood sampling might have been too long to detect changes in K+. Moreover, we collected blood samples from arm veins, which have been shown to exhibit lower plasma K+ concentrations than leg veins close to exercising muscles due to K+ uptake of unexercised muscles and other tissues.1
Overall, our study design required a relatively long delay between exercise and MRI examinations (approximately 5–10 minutes). Thus, performing exercises directly within the MR scanner, for example, using an MR-suited ergometer,42 would be advantageous for the assessment of ion shifts within exercising muscles. However, exercising within a 7 T system is challenging due to the very long bore of the magnet as well as its small diameter. A simultaneous acquisition of 39K and 23Na MRI using interleaved examinations could further accelerate the MR measurements.42,43 It would also be interesting to include additional measurements at different time after exercise to better characterize the 23Na and 39K signal evolution. Finally, in our study, we only examined a relatively small number of young subjects. To further investigate differences between different subject cohorts, for example, depending on age, sex, or between well-trained and untrained subjects, studies with larger and less homogeneous cohorts would be required.
CONCLUSIONS
39K and 23Na MRI at 7 T enable a noninvasive assessment of changes in muscular ion concentrations caused by exercise. The combination of 39K and 23Na MRI might therefore help to better understand the physiological processes connected to muscle fatigue.
Supplementary Material
ACKNOWLEDGMENTS
This work received funding by the German Federal Ministry of Education and Research (Bundesministerium für Bildung und Forschung) under the Molecular Assessment of Signatures Characterizing the Remission of Arthritis project. Parts of this work were presented at the Joint Annual Meeting ISMRM-ESMRMB 2022 in London.
Footnotes
Conflicts of interest and sources of funding: none declared.
Supplemental digital contents are available for this article. Direct URL citations appear in the printed text and are provided in the HTML and PDF versions of this article on the journal’s Web site (www.investigativeradiology.com).
Contributor Information
Laura-Marie Baier, Email: laura-baier@gmx.de.
Christian R. Meixner, Email: christian.meixner@uk-erlangen.de.
Oliver Chaudry, Email: oliver.chaudry@imp.uni-erlangen.de.
Klaus Engelke, Email: Klaus.engelke@imp.uni-erlangen.de.
Michael Uder, Email: michael.uder@uk-erlangen.de.
Armin M. Nagel, Email: armin.nagel@uk-erlangen.de.
Rafael Heiss, Email: rafael.heiss@uk-erlangen.de.
REFERENCES
- 1.Lindinger MI, Cairns SP. Regulation of muscle potassium: exercise performance, fatigue and health implications. Eur J Appl Physiol. 2021;121:721–748. [DOI] [PubMed] [Google Scholar]
- 2.Sejersted OM, Sjogaard G. Dynamics and consequences of potassium shifts in skeletal muscle and heart during exercise. Physiol Rev. 2000;80:1411–1481. [DOI] [PubMed] [Google Scholar]
- 3.McKenna MJ, Bangsbo J, Renaud JM. Muscle K+, Na+, and Cl disturbances and Na + -K+ pump inactivation: implications for fatigue. J Appl Physiol (1985). 2008;104:288–295. [DOI] [PubMed] [Google Scholar]
- 4.Ladd ME Bachert P Meyerspeer M, et al. Pros and cons of ultra-high-field MRI/MRS for human application. Prog Nucl Magn Reson Spectrosc. 2018;109:1–50. [DOI] [PubMed] [Google Scholar]
- 5.Constantinides CD Gillen JS Boada FE, et al. Human skeletal muscle: sodium MR imaging and quantification-potential applications in exercise and disease. Radiology. 2000;216:559–568. [DOI] [PubMed] [Google Scholar]
- 6.Kopp C Linz P Wachsmuth L, et al. (23)Na magnetic resonance imaging of tissue sodium. Hypertension. 2012;59:167–172. [DOI] [PubMed] [Google Scholar]
- 7.Weber MA Nagel AM Kan HE, et al. Quantitative imaging in muscle diseases with focus on non-proton MRI and other advanced MRI techniques. Semin Musculoskelet Radiol. 2020;24:402–412. [DOI] [PubMed] [Google Scholar]
- 8.Nagel AM Amarteifio E Lehmann-Horn F, et al. 3 Tesla sodium inversion recovery magnetic resonance imaging allows for improved visualization of intracellular sodium content changes in muscular channelopathies. Invest Radiol. 2011;46:759–766. [DOI] [PubMed] [Google Scholar]
- 9.Gerhalter T Marty B Gast LV, et al. Quantitative 1H and 23Na muscle MRI in facioscapulohumeral muscular dystrophy patients. J Neurol. 2021;268:1076–1087. [DOI] [PMC free article] [PubMed] [Google Scholar]
- 10.Platt T, Ladd ME, Paech D. 7 Tesla and beyond: advanced methods and clinical applications in magnetic resonance imaging. Invest Radiol. 2021;56:705–725. [DOI] [PMC free article] [PubMed] [Google Scholar]
- 11.Pazahr S, Nanz D, Sutter R. 7 T musculoskeletal MRI: fundamentals and clinical implementation. Invest Radiol. 2022;Publish ahead of print. [DOI] [PMC free article] [PubMed] [Google Scholar]
- 12.Gast LV Volker S Utzschneider M, et al. Combined imaging of potassium and sodium in human skeletal muscle tissue at 7 T. Magn Reson Med. 2021;85:239–253. [DOI] [PubMed] [Google Scholar]
- 13.Umathum R, Rosler MB, Nagel AM. In vivo 39K MR imaging of human muscle and brain. Radiology. 2013;269:569–576. [DOI] [PubMed] [Google Scholar]
- 14.Rosler MB Nagel AM Umathum R, et al. In vivo observation of quadrupolar splitting in (39)K magnetic resonance spectroscopy of human muscle tissue. NMR Biomed. 2016;29:451–457. [DOI] [PubMed] [Google Scholar]
- 15.Hody S Croisier JL Bury T, et al. Eccentric muscle contractions: risks and benefits. Front Physiol. 2019;10:536. [DOI] [PMC free article] [PubMed] [Google Scholar]
- 16.Croisier JL Foidart-Dessalle M Tinant F, et al. An isokinetic eccentric programme for the management of chronic lateral epicondylar tendinopathy. Br J Sports Med. 2007;41:269–275. [DOI] [PMC free article] [PubMed] [Google Scholar]
- 17.Croisier JL Forthomme B Namurois MH, et al. Hamstring muscle strain recurrence and strength performance disorders. Am J Sports Med. 2002;30:199–203. [DOI] [PubMed] [Google Scholar]
- 18.Valderrabano V Pagenstert G Horisberger M, et al. Sports and recreation activity of ankle arthritis patients before and after total ankle replacement. Am J Sports Med. 2006;34:993–999. [DOI] [PubMed] [Google Scholar]
- 19.Heiss R Kellermann M Swoboda B, et al. Effect of compression garments on the development of delayed-onset muscle soreness: a multimodal approach using contrast-enhanced ultrasound and acoustic radiation force impulse elastography. J Orthop Sports Phys Ther. 2018;48:887–894. [DOI] [PubMed] [Google Scholar]
- 20.Hotfiel T Hoger S Nagel AM, et al. Multi-parametric analysis of below-knee compression garments on delayed-onset muscle soreness. Int J Environ Res Public Health. 2021;18. [DOI] [PMC free article] [PubMed] [Google Scholar]
- 21.Heiss R Hotfiel T Kellermann M, et al. Effect of compression garments on the development of edema and soreness in delayed-onset muscle soreness (DOMS). J Sports Sci Med. 2018;17:392–401. [PMC free article] [PubMed] [Google Scholar]
- 22.Hotfiel T Kellermann M Swoboda B, et al. Application of acoustic radiation force impulse elastography in imaging of delayed onset muscle soreness: a comparative analysis with 3T MRI. J Sport Rehabil. 2018;27:348–356. [DOI] [PubMed] [Google Scholar]
- 23.Riexinger A Laun FB Höger SA, et al. Effect of compression garments on muscle perfusion in delayed-onset muscle soreness: a quantitative analysis using intravoxel incoherent motion MR perfusion imaging. NMR Biomed. 2021;34:e4487. [DOI] [PubMed] [Google Scholar]
- 24.Gast LV Henning A Hensel B, et al. Localized B0 shimming based on 23 Na MRI at 7 T. Magn Reson Med. 2020;83:1339–1347. [DOI] [PubMed] [Google Scholar]
- 25.Utzschneider M Müller M Gast LV, et al. Towards accelerated quantitative sodium MRI at 7 T in the skeletal muscle: Comparison of anisotropic acquisition- and compressed sensing techniques. Magn Reson Imaging. 2021;75:72–88. [DOI] [PubMed] [Google Scholar]
- 26.Klein S Staring M Murphy K, et al. Elastix: a toolbox for intensity-based medical image registration. IEEE Trans Med Imaging. 2010;29:196–205. [DOI] [PubMed] [Google Scholar]
- 27.Chaudry O Friedberger A Grimm A, et al. Segmentation of the fascia lata and reproducible quantification of intermuscular adipose tissue (IMAT) of the thigh. MAGMA. 2021;34:367–376. [DOI] [PMC free article] [PubMed] [Google Scholar]
- 28.BART . Toolbox for Computational Magnetic Resonance Imaging [computer program] 10.5281/zenodo.592960. [DOI]
- 29.Jovicich J Czanner S Greve D, et al. Reliability in multi-site structural MRI studies: effects of gradient non-linearity correction on phantom and human data. Neuroimage. 2006;30:436–443. [DOI] [PubMed] [Google Scholar]
- 30.Niesporek SC Hoffmann SH Berger MC, et al. Partial volume correction for in vivo (23)Na-MRI data of the human brain. Neuroimage. 2015;112:353–363. [DOI] [PubMed] [Google Scholar]
- 31.Gast LV Baier L-M Chaudry O, et al. Assessing muscle-specific potassium concentrations in human lower leg using potassium magnetic resonance imaging. NMR in Biomed. 2022;e4819. [DOI] [PubMed] [Google Scholar]
- 32.Paulsen G Mikkelsen UR Raastad T, et al. Leucocytes, cytokines and satellite cells: what role do they play in muscle damage and regeneration following eccentric exercise? Exerc Immunol Rev. 2012;18:42–97. [PubMed] [Google Scholar]
- 33.Sjogaard G, Adams RP, Saltin B. Water and ion shifts in skeletal muscle of humans with intense dynamic knee extension. Am J Physiol. 1985;248(2 Pt 2):R190–R196. [DOI] [PubMed] [Google Scholar]
- 34.Lindinger MI. Potassium regulation during exercise and recovery in humans: implications for skeletal and cardiac muscle. J Mol Cell Cardiol. 1995;27:1011–1022. [DOI] [PubMed] [Google Scholar]
- 35.Bansal N Szczepaniak L Ternullo D, et al. Effect of exercise on (23)Na MRI and relaxation characteristics of the human calf muscle. J Magn Reson Imaging. 2000;11:532–538. [DOI] [PubMed] [Google Scholar]
- 36.Chang G Wang L Schweitzer ME, et al. 3D 23Na MRI of human skeletal muscle at 7 Tesla: initial experience. Eur Radiol. 2010;20:2039–2046. [DOI] [PMC free article] [PubMed] [Google Scholar]
- 37.Hammon M Grossmann S Linz P, et al. 3 Tesla (23)Na magnetic resonance imaging during aerobic and anaerobic exercise. Acad Radiol. 2015;22:1181–1190. [DOI] [PubMed] [Google Scholar]
- 38.Medbo JI, Sejersted OM. Plasma potassium changes with high intensity exercise. J Physiol. 1990;421:105–122. [DOI] [PMC free article] [PubMed] [Google Scholar]
- 39.Vollestad NK, Hallen J, Sejersted OM. Effect of exercise intensity on potassium balance in muscle and blood of man. J Physiol. 1994;475:359–368. [DOI] [PMC free article] [PubMed] [Google Scholar]
- 40.McKenna MJ Heigenhauser GJ McKelvie RS, et al. Sprint training enhances ionic regulation during intense exercise in men. J Physiol. 1997;501(pt 3):687–702. [DOI] [PMC free article] [PubMed] [Google Scholar]
- 41.Lindinger MI Heigenhauser GJ McKelvie RS, et al. Blood ion regulation during repeated maximal exercise and recovery in humans. Am J Physiol. 1992;262(1 Pt 2):R126–R136. [DOI] [PubMed] [Google Scholar]
- 42.Meyerspeer M Krssak M Kemp GJ, et al. Dynamic interleaved 1H/31P STEAM MRS at 3 Tesla using a pneumatic force-controlled plantar flexion exercise rig. MAGMA. 2005;18:257–262. [DOI] [PMC free article] [PubMed] [Google Scholar]
- 43.Wilferth T Muller M Gast LV, et al. Motion-corrected 23Na MRI of the human brain using interleaved 1H 3D navigator images. Magn Reson Med. 2022;88:309–321. [DOI] [PubMed] [Google Scholar]


