Abstract
A new semisynthetic derivative of the natural alkaloid, theobromine, has been designed as a lead antiangiogenic compound targeting the EGFR protein. The designed compound is an (m-tolyl)acetamide theobromine derivative, (T-1-MTA). Molecular Docking studies have shown a great potential for T-1-MTA to bind to EGFR. MD studies (100 ns) verified the proposed binding. By MM-GBSA analysis, the exact binding with optimal energy of T-1-MTA was also identified. Then, DFT calculations were performed to identify the stability, reactivity, electrostatic potential, and total electron density of T-1-MTA. Furthermore, ADMET analysis indicated the T-1-MTA’s general likeness and safety. Accordingly, T-1-MTA has been synthesized to be examined in vitro. Intriguingly, T-1-MTA inhibited the EGFR protein with an IC50 value of 22.89 nM and demonstrated cytotoxic activities against the two cancer cell lines, A549, and HCT-116, with IC50 values of 22.49, and 24.97 μM, respectively. Interestingly, T-1-MTA’s IC50 against the normal cell lines, WI-38, was very high (55.14 μM) indicating high selectivity degrees of 2.4 and 2.2, respectively. Furthermore, the flow cytometry analysis of A549 treated with T-1-MTA showed significantly increased ratios of early apoptosis (from 0.07% to 21.24%) as well as late apoptosis (from 0.73% to 37.97%).
Introduction
The world health organization (WHO) anticipated that during the next few years, cancer will dominate all other causes of death [1]. Developing treatments that suppress the growth of cancer by interacting with specific molecular targets and damaging the cancer cells is a major concern for medicinal chemists that work on cancer therapy [2]. Increasing vascularity (angiogenesis) is a crucial process that increases tumor development, so anti-angiogenesis strategies were considered to be very effective in the treatment [3]. Also, it was confirmed that the angiogenesis and growth of cancer cells are driven by the epidermal growth factor receptors (EGFR) [4]. In response to EGFR overexpression, downstream signaling pathways stimulate cell proliferation, differentiation, and survival. In cancers, EGFR was found to be elevated and promoted several solid malignant tumors [5]. Numerous cancer types express lower survival rates when EGFR is expressed. Also, EGFR’s expression served as a powerful diagnostic and prognostic indicator for cancer [6]. In contrast, this overexpression allowed researchers to utilize the EGFR’s inhibition as an essential strategy in cancer treatment [7,8].
Anciently, natural products, especially plants, were the most vital bases of treatments [9,10]. Recently, one-third of the FDA-approved drugs from 1981–2014 have been derived from natural sources [11]. Anticancer drug discovery finds xanthines, and xanthine derivatives, to be interesting compounds that exhibit different antimutagenic properties against ovarian cancer [12], prostate cancer [13], breast cancer, and leukemia [14].
Theobromine, the famous natural alkaloid, was discovered in 1841, while the synthesis of theobromine was described in 1882 [15,16]. Theobromine is found primarily in Theobroma cacao, chocolate, and other foods including tea leaves [17]. Theobromine showed promising anti-cancer activity in vitro and in vivo through the inhibition of DNA synthesis in glioblastoma multiforme [18] and prevented lung cancer angiogenesis [19]. Interestingly, in ovarian cancer, theobromine inhibited the VEGF in vivo and in vitro [20]. By using semi-synthesis to produce analogs, we can discover more potent drugs, give repurposing opportunities, and develop novel bioactive compounds, enhance drug-likeness, and improve pharmacokinetics and pharmacodynamics [21].
In scientific society today, computer-aided drug discovery (CADD) is widely accepted as a means of applying theoretical ideas using computers and a set of techniques for investigating chemical problems and is used in the pharmaceutical industry to investigate how potential drugs interact with biomolecules [22–26]. Our team applied the CADD in molecular design and docking, computational toxicity and ADME [27,28], in addition to MD simulations [29,30].
Rationale
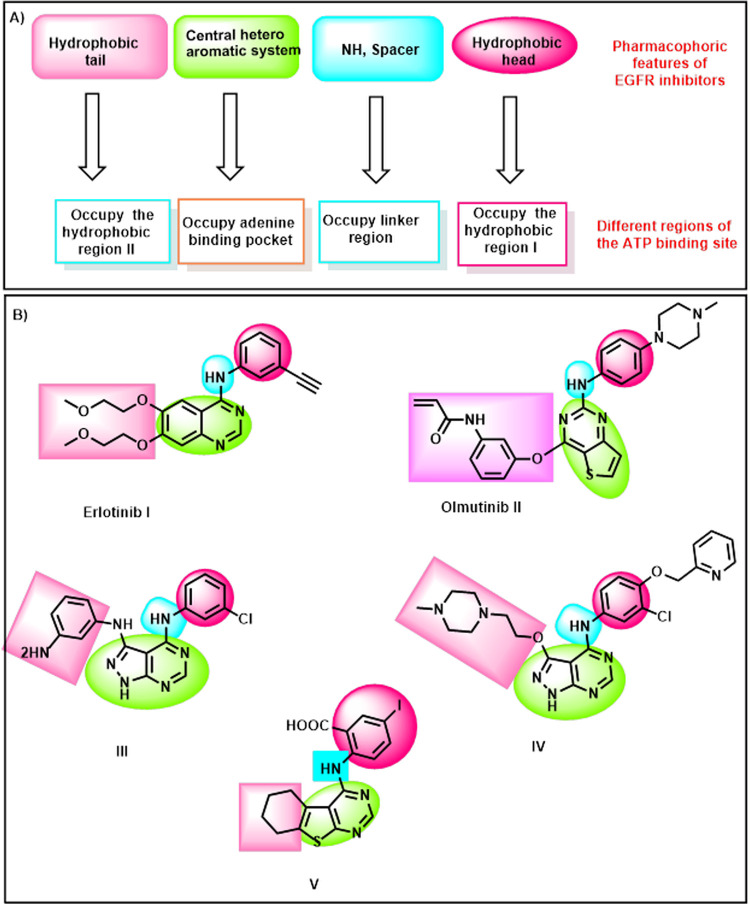
Erlotinib I [31,32] and olmutinib II [33] are reported as EGFR inhibitors. Compounds III and IV are derivatives of 1H-pyrazolo[3,4-d]pyrimidine that showed excellent efficacy for inhibiting EGFR-TK at nono-molar doses [34,35]. Our team previously synthesized compound V (a thieno[2,3-d]pyrimidine derivative) that was promising anti-proliferative and EGFR inhibitor [36] (Fig 1).
Fig 1. EGFR inhibitors’ pharmacophoric features.
These compounds possess some pharmacophoric features of EGFR-TKIs. These features are a planar heterocyclic system, an NH spacer, a terminal hydrophobic head and a hydrophobic tail. The key roles of the above-mentioned structural moieties are to occupy the adenine binding pocket [37], interact with amino acid residues in the linker region [38], to be inserted in the hydrophobic region I [39], and to occupy the hydrophobic region II [40,41], respectively (Fig 1).
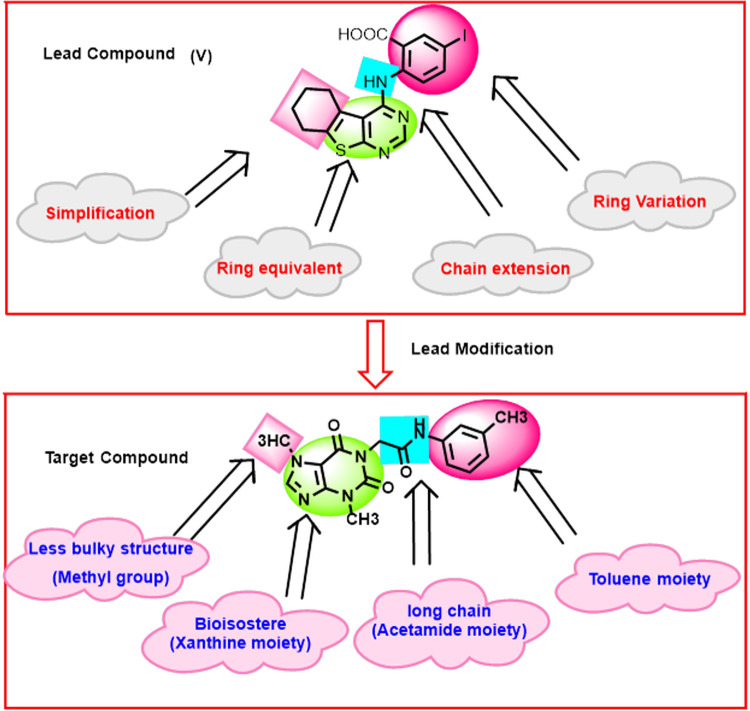
In this work and as an extension of our previous efforts in the discovery of new anti-EGFR agents [36,42–44], compound V was used as a lead compound to reach a more promising anticancer agent targeting EGFR. Several chemical modifications were carried out at four positions. The first position is the planar heterocyclic system. We applied the ring variation strategy as the thieno[2,3-d] pyrimidine moiety was replaced by a xanthine derivative (3-methyl-3,7-dihydro-1H-purine-2,6-dione). The six hydrogen bond (HB) acceptors may facilitate the HB interaction in the adenine binding pocket. Chain extension strategy was applied in the liker region through the replacement of the NH-linker with acetamide moiety. The terminal hydrophobic head (3-iodobenzoic acid) of the lead compound was replaced by toluene moiety) via ring variation strategy. A simplification strategy was applied for the hydrophobic tail (cyclohexene) of the lead compound. It was replaced by methyl group at 7-posision of xanthine moiety (Fig 2).
Fig 2. T-1-MTA’s design rationale.
Results and discussions
2.1. Chemistry
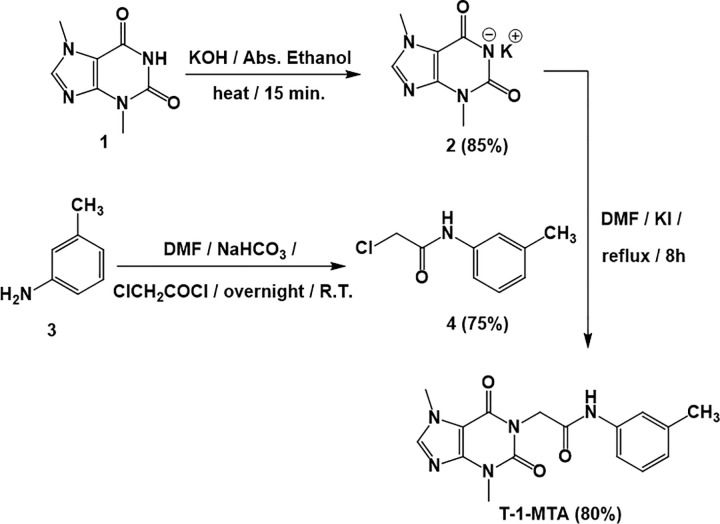
Scheme 1 depicts the synthetic pathway used in this study to produce target T-1-MTA. The potassium salt of 3,7-dimethyl-3,7-dihydro-1H-purine-2,6-dione 2 was first obtained by refluxing 3,7-dimethyl-3,7-dihydro-1H-purine-2,6-dione (theobromine, 1) with alcoholic KOH [45,46]. 2-Chloro-N-(m-tolyl)acetamide 4, as the key intermediate, was prepared from commercially available m-toluidine 3 with chloroacetylchloride in DMF using NaHCO3. When equimolar amounts of potassium 3,7-dimethyl-3,7-dihydro-1H-purine-2,6-dione 2 and 2-Chloro-N-(m-tolyl)acetamide 4 were refluxed in DMF containing a sufficient amount of potassium iodide as a catalyst, an expected final product T-1-MTA was attained.
Scheme 1. Synthetic pathway of T-1-MTA.
The 1H NMR spectrum of T-1-MTA showed singlet signal at δ = 8.07 for CH imidazole and multiplet signals ranging from δ 7.41 to 6.87 for aromatic protons besides remarkable singlet signals for the CH3 (of m-tolyl group) and CH2 groups at δ = 2.27 and 4.67, respectively. The IR spectrum of the same product revealed absorption bands at 1711, 1662 cm-1 corresponding to carbonyl groups and absorption bands at 3255 cm-1 corresponding to NH. Regarding the 13C NMR spectrum, four shielded signals appeared at 43.84, 33.66, 29.90, and 21.62 ppm corresponding to CH2 and the three CH3 groups, respectively.
2.2. Molecular docking
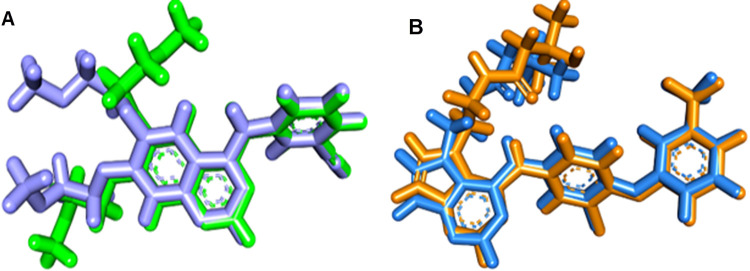
The examined proteins’ X-ray structures (EGFRWT; PDB: 4HJO and EGFRT790M; PDB: 3W2O) were acquired from the Protein Data Bank (PDB, http://www.pdb.org). First, the docking protocol was verified for both wild and mutant EGFR and the RMSD results were 1.20 and 1.15 Å, respectively Fig 3.
Fig 3.
A: Validation of wild EGFR using erlotinib as co-crystallized ligand and B: Validation of mutant EGFR using TAK-285 as co-crystallized ligand.
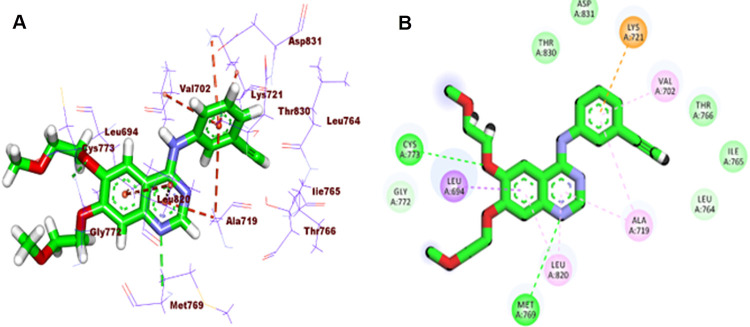
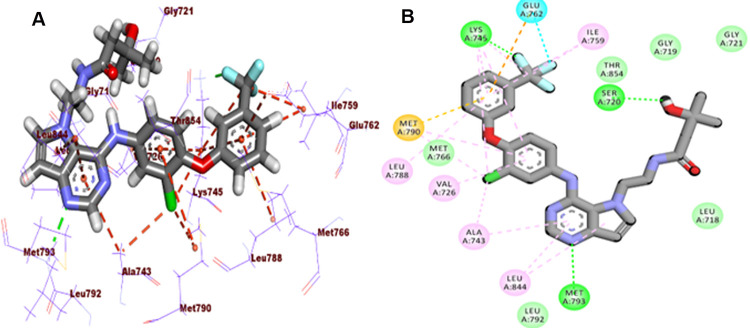
Erlotinib, as a native inhibitor for EGFRWT, revealed an affinity value of -20.50 kcal/mol. The binding pattern of erlotinib revealed a key HB with Met769 (2.11 A˚) in addition to four hydrophobic interactions (HI) in the adenine pocket and three HIs with Ala719 and Val702, and Lys721 in the hydrophobic pocket (Fig 4). TAK-285, as a native inhibitor for EGFRT790M, presented a binding energy of -7.20 kcal/mol. The binding pattern of TAK-285 revealed a key HB with Met793 (2.44 A˚) through the pyrimidine moiety in the adenine pocket. The later moieties (3-(trifluoromethyl)phenoxy and N-ethyl-3-hydroxy-3-methylbutanamide moieties) were fixed in the hydrophobic pocket via a network of HIs with Lys745, Ile759, Met790, Val726, and Ala743, and Leu844 (Fig 5).
Fig 4.
A: 3D and B: 2D close view of erlotinib EGFRWT.
Fig 5. 3D and 2D close view of TAK-285 into EGFRT790M.
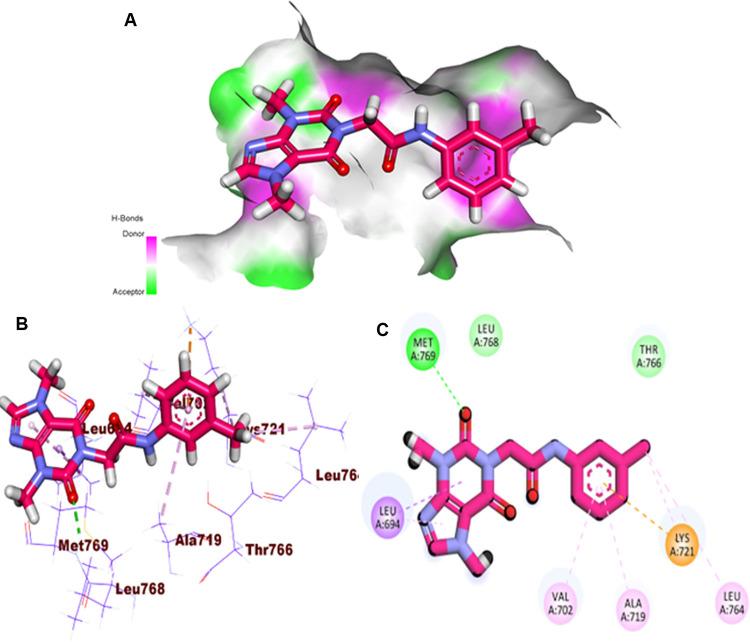
Regarding the EGFRWT, a comparable affinity value to erlotinib was obtained by T-1-MTA (-20.45 kcal/mol). Additionally, it interacts with the EGFRWT active site similar to erlotinib and adopts the same orientation. Besides, the 3,7-dimethyl-2,6-dioxo-2,3,6,7-tetrahydro-1H-purine arm formed a crucial HB with Met769 besides two HIs with Lue694 inside the adenine pocket. On the other side, five HIs with Leu764, Ala719, Val702, and Lys721 were achieved via the m-tolyl moiety in the conserved hydrophobic pocket. The methyl group at 7-posision of xanthine moiety failed to form HIs in the hydrophobic pocket II (Fig 6).
Fig 6.
A: Mapping Surface (MS), B: 3D, and C: 2D close view of T-1-MTA inside the EGFRWT.
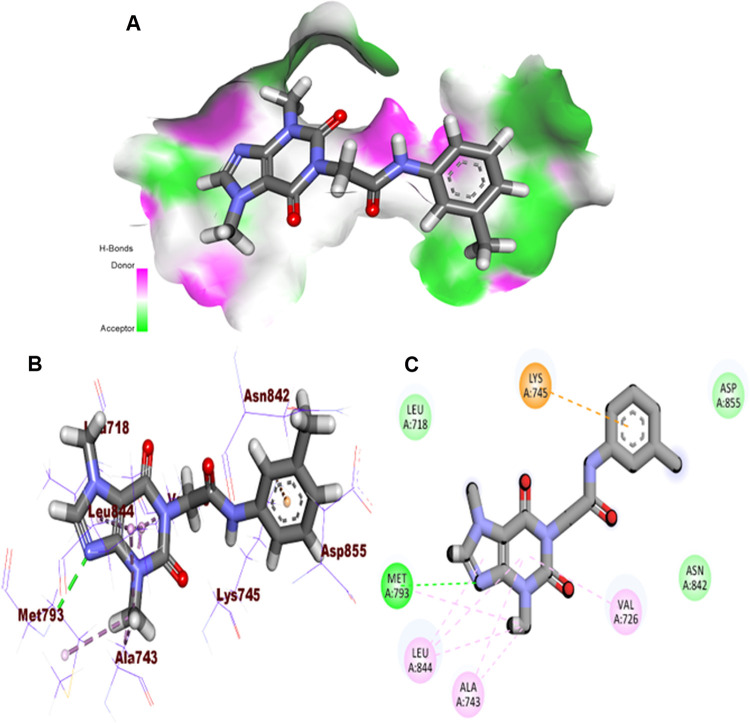
Regarding the EGFRT790M, T-1-MTA (binding energy of -6.95 kcal/mol.) was tacked onto the catalytic site similarly to the positive control, TAK-285. In the adenine pocket, six pi-pi bonds with Leu844, Ala743, and Met79 were accomplished through the 3,7-dimethyl-2,6-dioxo-2,3,6,7-tetrahydro-1H-purine arm. Also, in the same region, a crucial HB with Met793 was observed. Additionally, in the hydrophobic pocket, the m-tolyl moiety was buried to form one electrostatic interaction with Lys745 Fig 7.
Fig 7.
A: MS, B: 3D, and C: 2D close view of T-1-MTA with EGFRT790M.
2.3. MD simulations
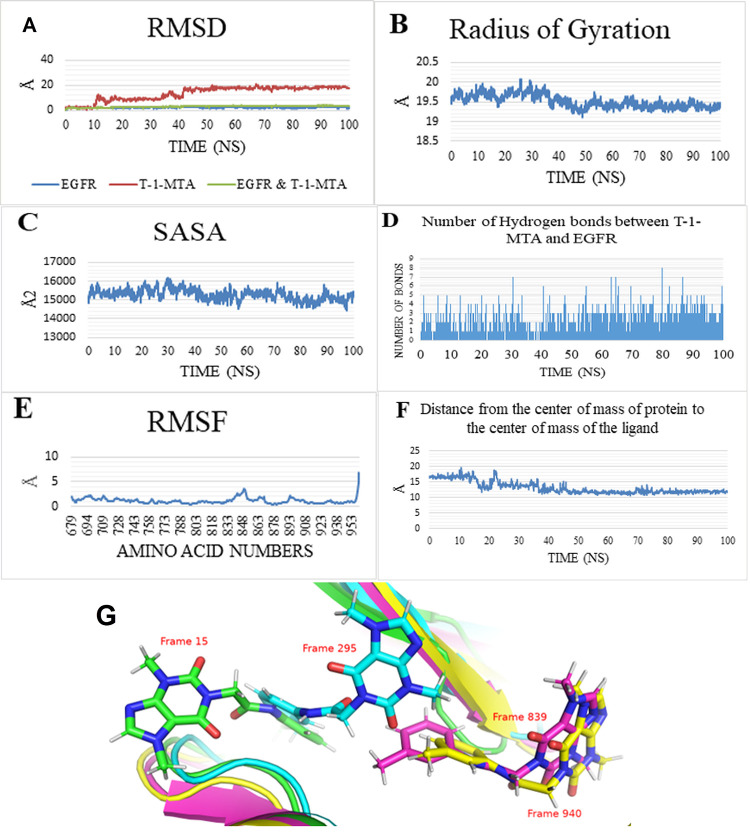
The MD analyses obtained on a 100 ns production run showing an overall system stability. The RMSD plot (Fig 8A) showed a stable trend for the EGFR only and the EGFR_T-1-MTA complex that were represented as blue and green curves showings averages of 2.16 Å and 2.97 Å, respectively. Moreover, the RMSD of the T-1-MTA (red) showed three states during the whole trajectory. The first 10 ns show an average of 2.16 Å before spiking to an average of 9.43 Å for the next 30 ns. Moreover, the last 60 ns show a large stable average value of 17.72 Å. The reason for this increase in the RMSD values of the compound T-1-MTA is due to the translational movement of the compound T-1-MTA relative to the protein as shown in Fig 8G which compares between the positions of the ligand at 1.5 ns (green sticks), 29.5 ns (cyan sticks), 83.9 ns (magenta sticks), and 94 ns (yellow sticks). The RoG (Fig 8B), SASA and (Fig 8C) HB show a stable protein fluctuation with an average of 19.51 Å, and 15285 Å2, respectively. The change in HBs between the T-1-MTA and EGFR (Fig 8D) shows that there is, approximately, at least one HB formed during the first 40 ns and it increases to at least two bonds during the rest of the simulation. The amino acids’ fluctuation was depicted in the RMSF plot (Fig 8E) showing low values of fluctuation (less than 2 Å) excepting the free C-terminal and the loop region E842:Y845 reaching 7 Å, and 3.5 Å, respectively. During the simulation time, the distance between the center of mass of compound T-1-MTA and the center of mass of EGFR protein shows a similar trend to the RMSD values of the ligand (three states) (Fig 8F). It started with an average of 16.72 Å for the first 15 ns before slightly decreasing to an average of 14.02 Å for the next 25 ns (from 15 ns to 40 ns). Finally, the last 60 ns showed an average value of 11.87 Å showing a stable interaction (Fig 8G).
Fig 8. MD measurements calculated for a 100 ns.
A) RMSD, B) RoG, C) SASA, D) HBBs’ change between the T-1-MTA and EGFR, E) RMSF, F) Center of Mass distance between the compound T-1-MTA and EGFR, and G) shows the positions of the compound T-1-MTA at different snapshots of the trajectory. T-1-MTA is in stick representation while the protein at the same snapshots is in cartoon representation.
2.4. MM-GBSA studies
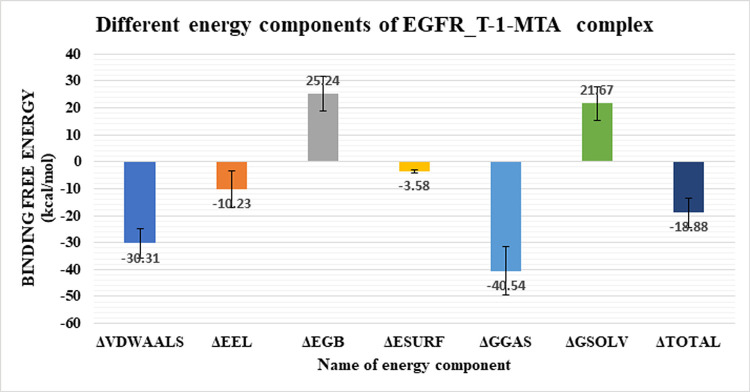
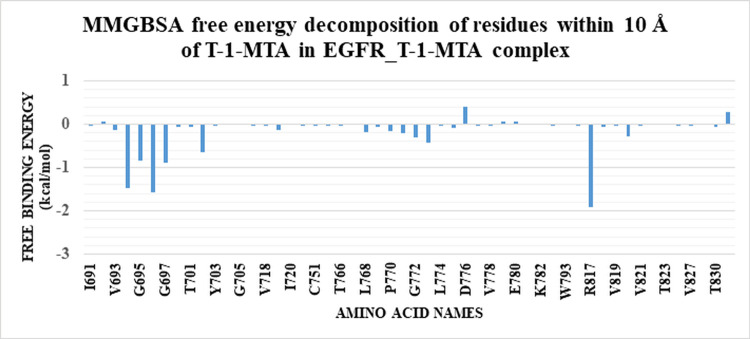
The binding free energy of the EGFR_T-1-MTA complex was further analyzed deeply by the MM-GBSA analysis. As Fig 9 shows, the EGFR_T-1-MTA complex had a total binding energy of an average value of -18.88 kcal/Mol. The various forms of energy that contribute to binding of the EGFR_T-1-MTA complex were analyzed to be. Van Der Waals interaction, electrostatic interaction with average values of -30.31 kcal/Mol and-10.23 kcal/Mol, respictively. Moreover, we performed an energy- decomposition analysis as shown in Fig 10 to identify the amino acids that had the highest contribution to the binding (1 nm or better). L694 (-1.48 kcal/Mol), S696 (-1.56 kcal/Mol), and R817 (-1.9 kcal/Mol) are the amino acids that exhibited the best contributions (better or less than -1 kcal/Mol).
Fig 9. Energetic components of EGFR-T-1-MTA complex.
Bars represent the standard deviation.
Fig 10. Binding energy decomposition of the EGFR_T-1-MTA complex.
2.5. Protein-Ligand Interaction Profiler (PLIP) studies
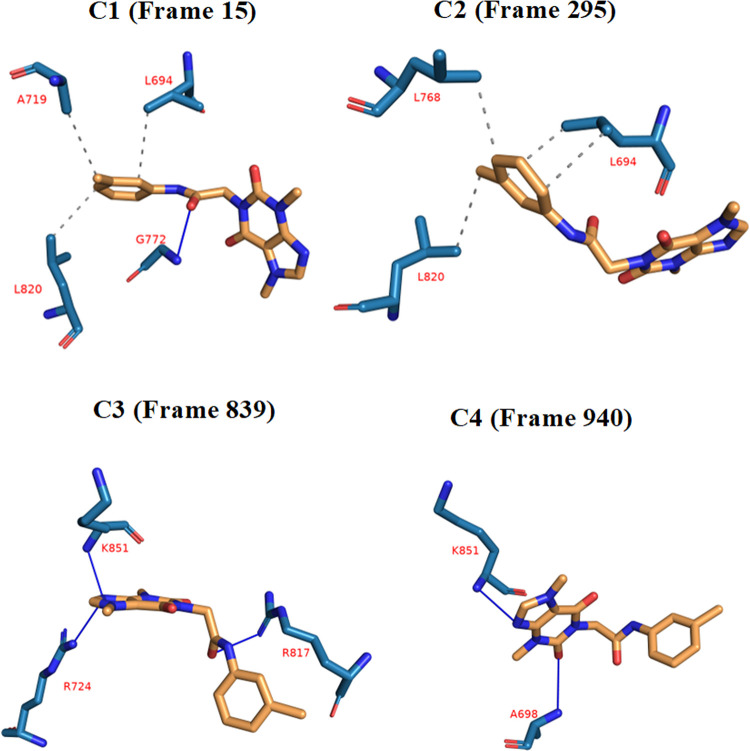
After that, to obtain a representative frame for each cluster of the EGFR_T-1-MTA complex, the obtained trajectory was clustered. The elbow method was used to automatically choose the number of clusters, as described in the methodologies section, and this resulted in four clusters. The PLIP website was used to determine the number and types of interactions between T-1-MTA and EGFR for each cluster representative (Table 1). As can be seen, HIs have a similar overall number of interactions in all the clusters compared to the HBs (7 HIs vs. 6 HBs). Additionally, a.pse file was generated to understand the 3D conformations of T-1-MTA as well as its interaction against the EGFR (Fig 11).
Table 1. Shows the number and types of interactions detected from the PLIP webserver.
| CLUSTER NUMBER | HBS | AMINO ACIDS | HIS | AMINO ACIDS |
|---|---|---|---|---|
| C1 (FRAME 15) | 1 | G772 | 3 | L694—A719—L820 |
| C2 (FRAME 295) | 0 | None | 4 | L694 (2)—L768—L820 |
| C3 (FRAME 839) | 3 | R724—R817—K851 | 0 | None |
| C4 (FRAME 940) | 2 | A698—K851 | 0 | None |
Fig 11. The variation (types and numbers) of interactions of the EGFR_T-1-MTA complex produced from PLIP.
HB: Blue solid line, HI: Dashed grey line, green dashed lines: Pi-Stacking interaction, amino acids: Blue sticks, and T-1-MTA: Orange sticks.
2.6. DFT studies
In an attempt to clarify the inhibitory activity of T-1-MTA, theoretical DFT studies have been explored. The conceptual DFT has been used for understanding the electronic structure of the prepared molecule to determine its structural features which has far-reaching consequences on the molecules’ reactivity. Hence, the DFT-based reactivity descriptors (global), frontier molecular orbital analysis (FMO), and surface potential maps have been investigated to explore the reactivity of the prepared compound.
Geometry optimization
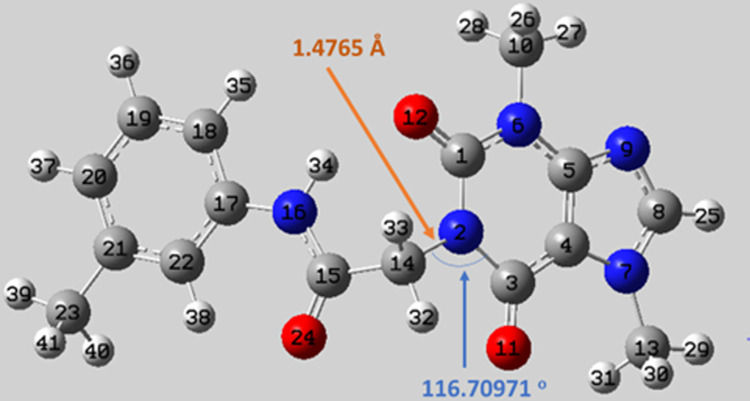
The reactivity of T-1-MTA is mainly determined by its chemical structure, so the structure is fully optimized and computed using DFT. The single bond length N2-C14 is 1.4765 Å, whereas the C14-N2-C3 bond angle is 116.70971° as given in Fig 12 at the B3LYB/6-311G++(d,p) level. The computed ground total energy (TE) is -30470.0 eV whereas the dipole moment (Dm) value is 5.9956 Debye which indicated a strong ability of interaction within the chemical system.
Fig 12. The optimized chemical structure of T-1-MTA.
Frontier molecular orbital analysis (FMO) analysis
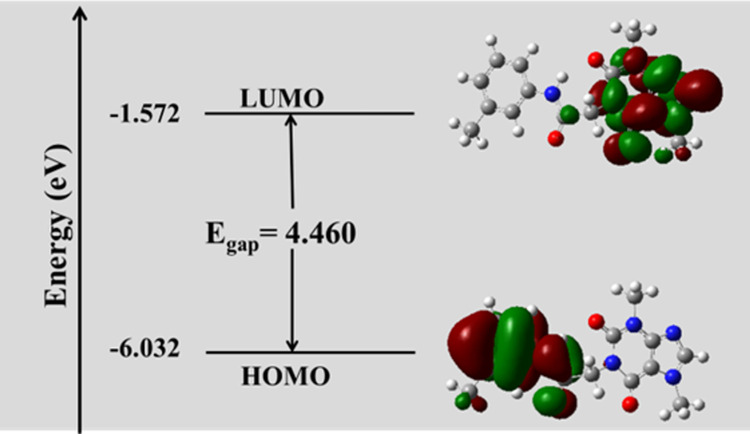
Border molecular orbitals in a molecule play a vital role in the electric properties as the system with a smaller value of energy gap between the border orbitals (Egap = ELUMO-EHOMO) should be more reactive than one having a greater Egap. Fortunately, T-1-MTA reported a smaller Egap value, so the electronic movement between the border orbitals; LUMO and HOMO, could occur easily [47]. The nodal properties of HOMO-LUMO orbitals of the studied heterocyclic molecule in Fig 13 are presented and show the strong orbital overlap, delocalization, and the low number of nodal planes. Hard molecules have a high HOMO-LUMO gap, and soft molecules have a smaller HOMO-LUMO gap. The value of Egap is given in Fig 13 and indicated that T-1-MTA is considered soft and the electronic transition (HOMO-LUMO) within the molecule is easy [48]. The quantum chemical parameters such as ionization potential (IP) and electron affinity (EA) were calculated and listed in Table 2.
Fig 13. FMO analysis of T-1-MTA.
Table 2. The calculated global reactivity indices and energetic parameters for T-1-MTA.
| IP | EA | μ (eV) | χ (eV) | η (eV) | σ (eV) | ω (eV) | Dm (Debye) | TE (eV) | ΔNmax | ΔE (eV) |
|---|---|---|---|---|---|---|---|---|---|---|
| -6.032 | -1.572 | -3.802 | 3.802 | 2.230 | 0.448 | 16.122 | 5.996 | -30470.0 | 1.705 | -16.122 |
Global reactive indices and total density of state (TDOS)
Based on the density functional theory (DFT) concept, global reactivity parameters are essential tools for comprehending the behavior of any chemical molecular structure. Such global reactivity indices depend on the value of Egap. In Table 2, the static global properties of T-1-MTA, namely the electrophilicity (ω), maximal charge acceptance (Nmax), energy change (ΔE), chemical potential (μ), global chemical softness (σ), global electronegativity (χ), global chemical hardness (η), and electron affinity (EA) of T-1-MTA are presented after calculating using Koopmans’ theory. The results in Table 2 indicated that T-1-MTA is treated as soft within the nucleophilicity and electrophilicity scales [49].
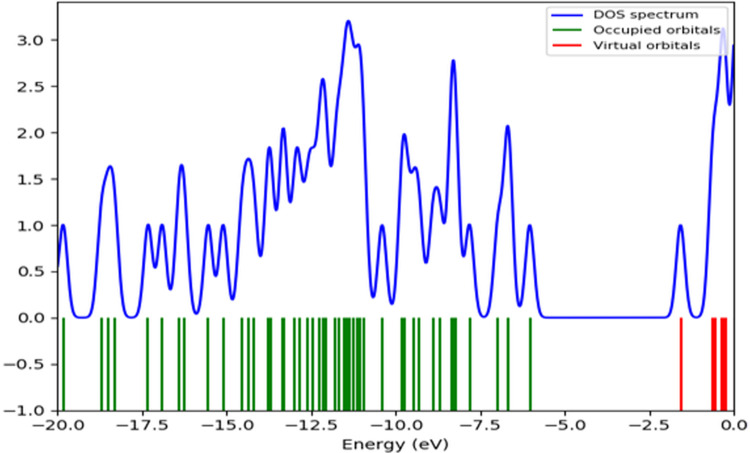
The density of states and the distribution function probability determined by the occupied states per unit volume are important to provide an accurate description best than frontier molecular orbitals. The TDOS spectrum of T-1-MTA in Fig 14 depicted that the highest electronic intensity is located in the occupied orbitals under the HOMO orbital. Also, the TDOS spectrum confirmed the narrow HOMO-LUMO gap.
Fig 14. The TDOS spectrum of T-1-MTA.
2.6.4. Molecular surface potential maps
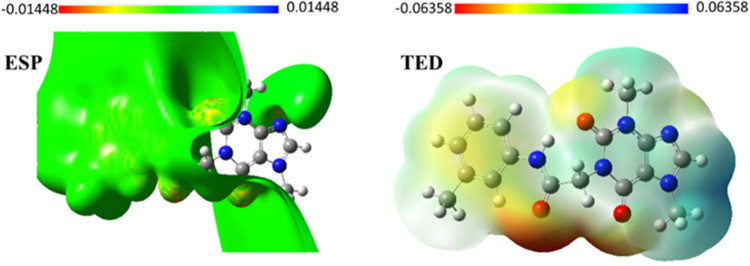
Molecular electrostatic surface potential discovers the relationship between the electronic distribution over the molecule surface and its binding ability. The molecular electrostatic potential explains and predicts the noncovalent interactions. Also, it finds the positive and negative domains of the electrostatic potential with low and high electron densities, respectively. The quantitative electrostatic surface potential (ESP) and total electrostatic density (TED) maps of T-1-MTA are demonstrated in Fig 15 after analysis of the optimized ground-state geometry. It appears that there are red regions indicating the negative potential is localized over the electronegative atoms such as O. The positive potential domains (blue color) are localized on the hydrogen atoms of purine moiety. The areas with moderate electron density values are shown with yellow color and localized on the phenyl ring. It can be predicted that the positive region on the purine ring of T-1-MTA will interact strongly with the negative region of the target and the negative areas at oxygen atoms will form strong interactions with areas of positive potential at the target. Also, it can be predicted that there is a strong attraction between the most positive region of T-1-MTA and the negative region of the target. The most negative region located around the oxygen atoms can also form a strong interaction with the positive region of the target. This implies that the difference in the distribution of electronic charges could result in enhancing the inhibition reactivity of T-1-MTA towards EGFR.
Fig 15. TED and ESP maps of T-1-MTA.
2.7. ADMET profiling study
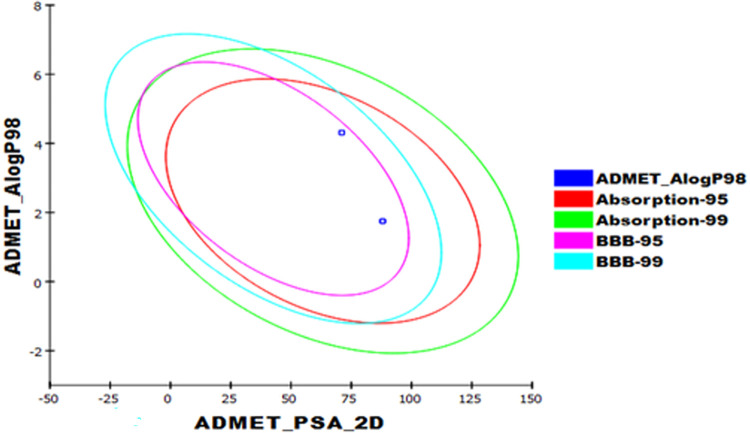
The approval of any new compound as a marketed drug is based on a pharmacokinetic evaluation in addition to its biological activity. So, analyzing the ADME properties of a compound at the early stages should keep the discovery process from being delayed [50]. Although ADMET studies in vitro can investigate the properties of the absorbent, distribution, metabolism, excretion, and toxicity of drugs, in silico studies are advantageous because of their ability of saving cost, time, effort in addition to the regulations restricting the use of animals [51]. Computing ADMET parameters using Discovery is used to determine the ADMET parameters for T-1-MTA against erlotinib. Interestingly, the obtained results of T-1-MTA comparing erlotinib (Fig 16 and Table 3) showed a high likeness degree as it was anticipated to have a low potential to pass the BBB. Additionally, hepatotoxicity (HT) and the inhibition of cytochrome P-450 (CYP2D6-I) were expected to be absent. Also, T-1-MTA levels of aqueos solubility (AS) and intestinal absorption (IA) were computed as good.
Fig 16. Computational prediction of ADMET parameters for T-1-MTA and erlotinib.
Table 3. ADMET parameters for T-1-MTA and erlotinib.
| Comp. | BBB | AS | IA | HT | CYP2D6-I | Plasma protein binding |
|---|---|---|---|---|---|---|
| T-1-MTA | Low | Good | Good | Non-toxic | Non-inhibitor | < 90% |
| erlotinib | High | Low | toxic | >90% |
2.8. In silico toxicity studies
For a drug to be developed successfully, toxicity assessment at the early stages must be done in order to control the possibility of failure in the clinical stage [52]. The in silico approach to toxicity assessment is promising being accurate and avoiding ethical and resource constraints in the in vitro and in vivo phases of toxicity development [53]. In silico prediction of toxicity basically uses the structure-activity relationship (SAR)-predicting toxicity. In detail, the computer compares the chemical properties of the examined molecules against the structural properties of tens of thousands of compounds of reported safety or toxicity [54]. Employing the Discovery studio software, eight toxicity models were used to estimate T-1-MTA’s toxicity in comparison to erlotinib. Providentially, T-1-MTA expressed very good and safe values in the carried-out models (Table 4)
Table 4. In silico toxicity studies of T-1-MTA and erlotinib.
| Comp. | FDA Rodent Carcinogenicity (Rat- female) |
Carcinogenic Potency TD50 (Mouse) 1 |
Ames Mutagenicity | Rat Maximum Tolerated Dose (Feed) 2 |
Rat Oral LD50 2 | Rat Chronic LOAEL2 | Skin Irritancy | Ocular Irritancy |
|---|---|---|---|---|---|---|---|---|
| T-1-MTA | Non-Carcinogen | 111.107 | Non-Mutagen | 0.018 | 4.712 | 0.020 | Mild | Mild |
| erlotinib | 39.771 | Non-Mutagen | 0.083 | 0.662 | 0.036 | Non-Irritant | Mild |
1 Unit: mg/kg /day.
2 Unit: g/kg.
2.9. Biological evaluation
2.9.1. In vitro EGFR inhibition
For the purpose of examining the design and the computational outcomes that clearly demonstrated T-1-MTA’s significant affinity for EGFR, T-1-MTA’s inhibitory ability was assessed in vitro against the EGFR protein (Fig 17). The obtained inhibition value (22.89 nM) was near to erlotinib’s value, and the resulting in vitro results confirmed T-1-MTA ’s suppressive potential.
Fig 17. In vitro EGFR- inhibition potentialities of T-1-MTA (A) and erlotinib (B).
2.9.2 Cytotoxicity and safety
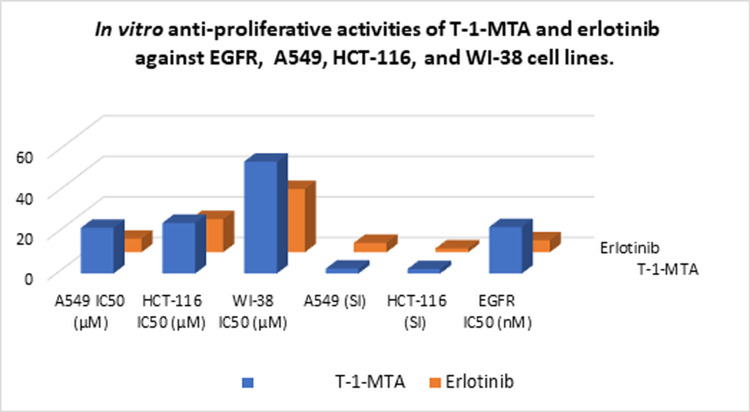
In vitro cytotoxicity assessment was performed for T-1-MTA using compared to erlotinib as demonstrated in Table 5. The obtained IC50 values of T-1-MTA against A549 and HCT-116 malignant cells were 22.49 and 24.97 μM, respectively. T-1-MTA’s anticancer potential was close to that of erlotinib.
Table 5. In vitro anti-proliferative activities of T-1-MTA.
| Comp. | In vitro cytotoxicity IC50 (μM) a | A549 (SI) |
HCT-116 (SI) | EGFR IC50 (nM) |
||
|---|---|---|---|---|---|---|
| A549 | HCT-116 | WI-38 | ||||
| T-1-MTA | 22.49 | 24.97 | 55.14 | 2.4 | 2.2 | 22.89 |
| Erlotinib | 6.73 | 16.35 | 31.17 | 4.6 | 1.9 | 5.91 |
a Data are presented as the mean of the IC50 values of triplicate experiments.
As a confirmation of the computed safety pattern of T-1-MTA and to explore its selectivity, T-1-MTA was tested against the W138 human normal cell line. T-1-MTA showed a high IC50 value of 55.14 μM as well as very high selectivity indexes (SI) of 2.4 and 2.2 against the two cancer cell lines, respectively (Fig 18).
Fig 18. In vitro anti-proliferative and safety assessments of T-1-MTA and erlotinib.
2.9.3. Cell cycle analysis and apoptosis assay
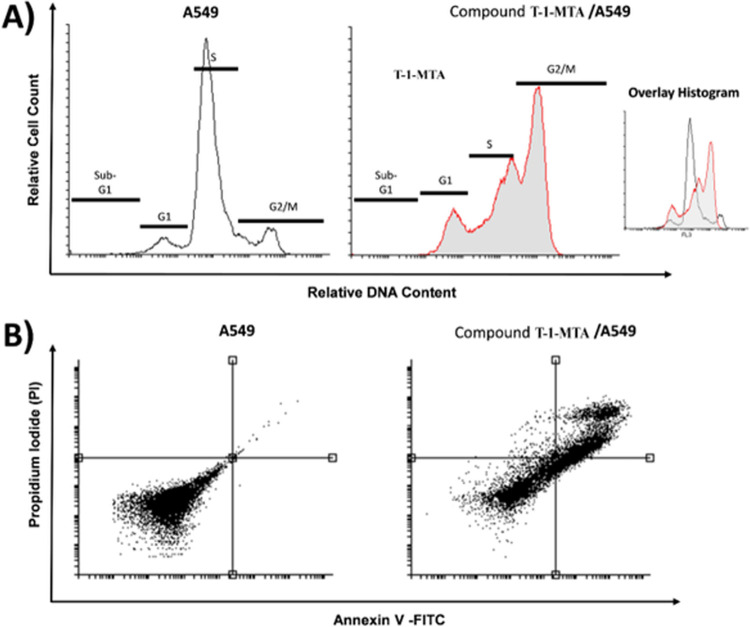
Firstly, the cell cycle phases of A549 after T-1-MTA’s treatment was analyzed by flow cytometry according to the reported method before [55,56]. A concentration of 22.49 μM of T-1-MTA was added to A549 cells for 72 h. Then, the cancer’s cell cycle was investigated. Interestingly, T-1-MTA decreased the percentage of A549 cells in the Sub-G1 and S phases from 0.75% and 68.17% to 0.36% and 28.60%, respectively. Contraversly, in the G2/M phase, the A549 percent was significantly increased from 18.69 to 49.20 after T-1-MTA’s treatment (Table 6 and Fig 19).
Table 6. Effect of T-1-MTA on the cell cycle of A549 cells after 72 h treatment.
| Sample | Cell cycle distribution (%) a | ||||
|---|---|---|---|---|---|
| %Sub-G1 | %G1 | %S | % G2/M | ||
| A549 | 0.75 ± 0.27 | 12.39 ± 5.08 | 68.17 ± 6.92 | 18.69 ± 1.56 | |
| T-1-MTA /A549 | 0.36 ± 0.17 | 21.84 ± 1.83 | 28.60 ± 5.00* | 49.20 ± 3.33* | |
a Values are given as mean ± SEM of two independent experiments.
*p < 0.05 indicates statistically significant differences from the corresponding control (A549) group in unpaired t-tests.
Fig 19. Flow cytometric analysis of cell cycle phases and apoptosis.
(A) The representative histograms show the cell cycle distribution of control (A549), and cells treated with 22.49 μM (IC50 value) of T-1-MTA for 72h. (B) Flow cytometric charts of apoptosis in A549 cells exposed to T-1-MTA (22.49 μM) for 72 h.
To verify the apoptotic effects of T-1-MTA, the apoptosis percentage in the A549 cells was examined by Annexin V and PI double stains after it was subjected of 22.49 μM of T-1-MTA for 72 h [57,58]. Interestingly, T-1-MTA reduced the viable cancer cell count. Comparing control, T-1-MTA induced higher ratio of apoptotic cells. Also, T-1-MTA caused increased the apoptotic cells’ percentage significantly in the early stage of apoptosis (from 0.07% to 21.24%) as well as the late stage of apoptosis (from 0.73% to 37.97%). Also, the necrosis percentage was elevated to be 1.78, compared to 0.04% in the control cells (Fig 19 & Table 7). In conclusion, T-1-MTA successfully arrested the A549 cell cycle at the G2/M phase causing cytotoxic potentialities that may be connected to apoptosis.
Table 7. Effect of T-1-MTA on stages of the cell death process in A549 cells after 72 h treatment.
| Sample | Viable a (Left Bottom) |
Apoptosis a | Necrosis a (Left Top) |
|
|---|---|---|---|---|
| Early (Right Bottom) |
Late (Right Top) |
|||
| A549 | 99.16 ± 0.05 | 0.07 ± 0.01 | 0.73 ± 0.07 | 0.04 ± 0.02 |
| T-1-MTA / A549 | 39.01 ± 4.152 | 21.24 ± 1.07** | 37.97 ± 6.02* | 1.78 ± 0.45 |
a Values are given as mean ± SEM of two independent experiments.
*p < 0.05, and **p < 0.01 indicate statistically significant difference from the corresponding control (A549) group in unpaired t-tests.
Conclusion
According to the essential structural features of EGFR inhibitors, a new lead theobromine-derived candidate, T-1-MTA has been designed. An anti-EGFR potential of the T-1-MTA was showed by molecular docking and verified by six MD simulations (over an100 ns), three MM-GBSA, and three DFT studies. Likely, computational ADMET studies indicated a general drug-likeness and safety. The biological evaluation confirmed the in silico results as T-1-MTA showed EGFR inhibitory activity with IC50 value of 22.89 nM. In addition, it exerted cytotoxic properties against A549 and HCT-116 cell lines with IC50 values of 22.49 and 24.97 μM, respectively. Moreover, T-1-MTA showed high selectivity indices towards the tumor cells. Also, the apoptotic potential of T-1-MTA was confirmed by the flow cytometry analysis. The obtained in silico and in vitro outputs are considered a step in the way to finding a cure through more deep investigations and or chemical modifications.
Experimental
4.1. Chemistry
4.1.1. All apparatus used in analyses of T-1-MTA were illustrated in the supplementary section (S1) in S1 Data detailed explanations.
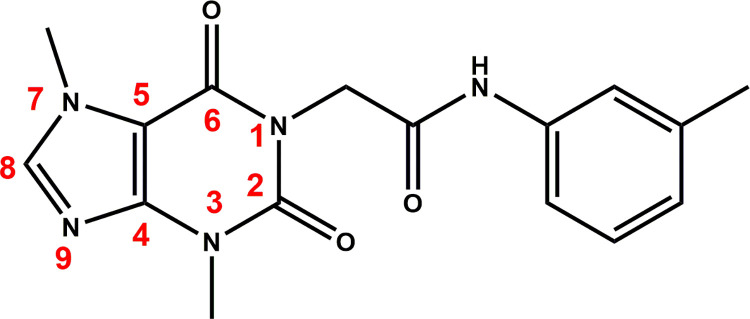
4.1.2. Synthesis of T-1-MTA. 2-Chloro-N-(m-tolyl)acetamide 4 (0.001 mol, 0.21g) was added to a solution of the potassium 3,7-dimethyl-3,7-dihydro-1H-purine-2,6-dione 2 (0.001 mol, 0.25g) in DMF (10 mL), and the mixture was heated in a water bath for 8 h. After being poured onto ice water (200 mL), the reaction mixture was gently stirred for certain time. To afford T-1-MTA (Fig 20), the obtained ppt was filtered, water washed, and crystallized from methanol.
Fig 20. T-1-MTA.
Off-white crystal (yield, 80%); m. p. = 233–235°C; IR (KBr) ν cm-1: 3255, 3143 (NH), 3073 (CH aromatic), 2965, 2923 (CH aliphatic), 1711, 1662 (C = O); 1H NMR: δ 10.20 (s, 1H, NH), 8.07 (s, 1H, CH imidazole), 7.41 (s, 1H, Ar-H), 7.35 (d, J = 8.1 Hz, 1H, Ar-H), 7.19 (t, J = 7.8 Hz, 1H, Ar-H), 6.87 (d, J = 7.5 Hz, 1H, Ar-H), 4.67 (s, 2H, CH2), 3.89 (s, 3H, CH3 at position 7 of purine), 3.44 (s, 3H, at position 3 of purine), 2.27 (s, 3H, CH3 of methyl phenyl); 13C NMR: δ 166.10, 154.64, 151.36, 148.93, 143.67, 139.15, 138.45, 129.08, 124.50, 120.06, 116.67, 107.03, 43.84, 33.66, 29.90, 21.62. For C16H17N5O3 (327.34).
4.2. Docking studies
Was operated for T-1-MTA by MOE2014 software. The supplementary section (S2) in S1 Data includes a detailed explanation.
4.3. MD simulations
Was operated for T-1-MTA by the CHARMM-GUI web server and GROMACS 2021 [24,59]. The supplementary section (S3) in S1 Data includes a detailed explanation.
4.4. MM-GBSA
Was operated for T-1-MTA by the Gmx_MMPBSA package [60]. The supplementary section (S4) in S1 Data includes a detailed explanation.
4.5. DFT
Was operated for T-1-MTA by Gaussian 09 and GaussSum3.0 programs. The supplementary section (S5) in S1 Data includes a detailed explanation.
4.6. ADMET studies
Was operated for T-1-MTA by Discovery Studio 4.0. The supplementary section (S6) in S1 Data includes a detailed explanation.
4.7. Toxicity studies
Was operated for T-1-MTA by Discovery Studio 4.0. The supplementary section (S7) in S1 Data includes a detailed explanation.
4.8 In vitro EGFR inhibition
Was operated for T-1-MTA by Human EGFR ELISA kit. The supplementary materials (S8) in S1 Data show a comprehensive explanation.
4.9. In vitro antiproliferative activity
Was operated for T-1-MTA by MTT procedure. The supplementary materials (S9) in S1 Data show a comprehensive explanation.
4.10. Safety assay
Was operated for T-1-MTA by MTT procedure utilizing W138 cell lines. The supplementary section (S10) in S1 Data includes a detailed explanation.
4.11. Cell cycle analysis and apoptosis
Was operated for T-1-MTA flowcytometry analysis technique. The supplementary section (S11 and S12) in S1 Data includes a detailed explanation.
Supporting information
(PDF)
Data Availability
All relevant data are within the paper and its Supporting Information files.
Funding Statement
This research was funded by Princess Nourah bint Abdulrahman University Researchers Supporting Project number (PNURSP2023R116), Princess Nourah bint Abdulrahman University, Riyadh, Saudi Arabia. The authors extend their appreciation to the Research Center at AlMaarefa University for funding this work.
References
- 1.Abd El-Mageed M.M., Eissa A.A., Farag A.E.-S., Osman E.E.A., Design and synthesis of novel furan, furo [2, 3-d] pyrimidine and furo [3, 2-e][1, 2, 4] triazolo [1, 5-c] pyrimidine derivatives as potential VEGFR-2 inhibitors, Bioorganic Chemistry (2021) 105336. doi: 10.1016/j.bioorg.2021.105336 [DOI] [PubMed] [Google Scholar]
- 2.Chaudhari P., Bari S., Surana S., Shirkhedkar A., Wakode S., Shelar S., et al S. Ghodke, Logical synthetic strategies and structure-activity relationship of indolin-2-one hybrids as small molecule anticancer agents: An Overview, Journal of Molecular Structure (2021) 131280. [Google Scholar]
- 3.El-Dash Y., Elzayat E., Abdou A.M., Hassan R.A., Novel thienopyrimidine-aminothiazole hybrids: design, synthesis, antimicrobial screening, anticancer activity, effects on cell cycle profile, caspase-3 mediated apoptosis and VEGFR-2 inhibition, Bioorganic Chemistry 114 (2021) 105137. doi: 10.1016/j.bioorg.2021.105137 [DOI] [PubMed] [Google Scholar]
- 4.Nicholson R.I., Gee J.M.W., Harper M.E., EGFR and cancer prognosis, European journal of cancer 37 (2001) 9–15. [DOI] [PubMed] [Google Scholar]
- 5.Spano J.-P., Lagorce C., Atlan D., Milano G., Domont J., Benamouzig R., et al. Morere, Impact of EGFR expression on colorectal cancer patient prognosis and survival, Annals of oncology 16(1) (2005) 102–108. [DOI] [PubMed] [Google Scholar]
- 6.Normanno N., De Luca A., Bianco C., Strizzi L., Mancino M., Maiello M.R., et al. Salomon, Epidermal growth factor receptor (EGFR) signaling in cancer, Gene 366(1) (2006) 2–16. [DOI] [PubMed] [Google Scholar]
- 7.Ayati A., Moghimi S., Salarinejad S., Safavi M., Pouramiri B., A.J.B. c. Foroumadi, A review on progression of epidermal growth factor receptor (EGFR) inhibitors as an efficient approach in cancer targeted therapy, 99 (2020) 103811. [DOI] [PubMed] [Google Scholar]
- 8.Eldehna W.M., El Hassab M.A., Elsayed Z.M., Al-Warhi T., Elkady H., Abo-Ashour M.F., et al. , Design, synthesis, in vitro biological assessment and molecular modeling insights for novel 3-(naphthalen-1-yl)-4, 5-dihydropyrazoles as anticancer agents with potential EGFR inhibitory activity, Scientific reports 12(1) (2022) 1–13. [DOI] [PMC free article] [PubMed] [Google Scholar]
- 9.Metwaly A.M., Ghoneim M.M., Eissa I.H., Elsehemy I.A., Mostafa A.E., Hegazy M.M., et al. , Traditional ancient Egyptian medicine: a review, Saudi Journal of Biological Sciences (2021) 5823–5832. doi: 10.1016/j.sjbs.2021.06.044 [DOI] [PMC free article] [PubMed] [Google Scholar]
- 10.Han X., Yang Y., Metwaly A.M., Xue Y., Shi Y., Dou D., The Chinese herbal formulae (Yitangkang) exerts an antidiabetic effect through the regulation of substance metabolism and energy metabolism in type 2 diabetic rats, Journal of ethnopharmacology 239 (2019) 111942. doi: 10.1016/j.jep.2019.111942 [DOI] [PubMed] [Google Scholar]
- 11.Newman D.J., Cragg G.M., Natural products as sources of new drugs from 1981 to 2014, Journal of Natural Products 79(3) (2016) 629–661. doi: 10.1021/acs.jnatprod.5b01055 [DOI] [PubMed] [Google Scholar]
- 12.Barcz E., Sommer E., Janik P., Marianowski L., Skopinska-Rozewska E., Adenosine receptor antagonism causes inhibition of angiogenic activity of human ovarian cancer cells, Oncology reports 7(6) (2000) 1285–1376. doi: 10.3892/or.7.6.1285 [DOI] [PubMed] [Google Scholar]
- 13.Kakuyamanee Iwazaki A., Sadzuka Y., Effect of methylxanthine derivatives on doxorubicin transport and antitumor activity, Current drug metabolism 2(4) (2001) 379–395. doi: 10.2174/1389200013338270 [DOI] [PubMed] [Google Scholar]
- 14.Sultani H.N., Ghazal R.A., Hayallah A.M., Abdulrahman L.K., Abu‐Hammour K., AbuHammad S., et al M.O., Inhibitory effects of new mercapto xanthine derivatives in human mcf7 and k562 cancer cell lines, Journal of Heterocyclic Chemistry 54(1) (2017) 450–456. [Google Scholar]
- 15.Woskresensky A., Ueber das Theobromin, Justus Liebigs Annalen der Chemie 41(1) (1842) 125–127. [Google Scholar]
- 16.A.J.J.L.A.d.C. Woskresensky, Ueber das Theobromin, 41(1) (1842) 125–127. [Google Scholar]
- 17.Fredholm B.B., Smit H.J., Theobromine and the pharmacology of cocoa, Methylxanthines (2011) 201–234. [DOI] [PubMed] [Google Scholar]
- 18.Sugimoto N., Miwa S., Hitomi Y., Nakamura H., Tsuchiya H., Yachie A., Theobromine, the primary methylxanthine found in Theobroma cacao, prevents malignant glioblastoma proliferation by negatively regulating phosphodiesterase-4, extracellular signal-regulated kinase, Akt/mammalian target of rapamycin kinase, and nuclear factor-kappa B, Nutrition and cancer 66(3) (2014) 419–423. doi: 10.1080/01635581.2013.877497 [DOI] [PubMed] [Google Scholar]
- 19.Gil M., Skopińska-Rózewska E., Radomska D., Demkow U., Skurzak H., Rochowska M., et al. , Effect of purinergic receptor antagonists suramin and theobromine on tumor-induced angiogenesis in BALB/c mice, Folia Biologica 39(2) (1993) 63–68. [PubMed] [Google Scholar]
- 20.Barcz E., Sommer E., Sokolnicka I., Gawrychowski K., Roszkowska-Purska K., Janik P., et al. , The influence of theobromine on angiogenic activity and proangiogenic cytokines production of human ovarian cancer cells, Oncology reports 5(2) (1998) 517–537. doi: 10.3892/or.5.2.517 [DOI] [PubMed] [Google Scholar]
- 21.da Rosa R., Schenkel E.P., Bernardes L.S.C., Semisynthetic and newly designed derivatives based on natural chemical scaffolds: moving beyond natural products to fight Trypanosoma cruzi, Phytochemistry Reviews 19(1) (2020) 105–122. [Google Scholar]
- 22.Belal A., Abdel Gawad N.M., Mehany A.B., Abourehab M.A., Elkady H., Al‐Karmalawy A.A., Ismael A.S., Design, synthesis and molecular docking of new fused 1 H-pyrroles, pyrrolo [3, 2-d] pyrimidines and pyrrolo [3, 2-e][1, 4] diazepine derivatives as potent EGFR/CDK2 inhibitors, Journal of Enzyme Inhibition and Medicinal Chemistry 37(1) (2022) 1884–1902. doi: 10.1080/14756366.2022.2096019 [DOI] [PMC free article] [PubMed] [Google Scholar]
- 23.Taghour M.S., Elkady H., Eldehna W.M., El-Deeb N.M., Kenawy A.M., Elkaeed E.B., et al. , Design and synthesis of thiazolidine-2, 4-diones hybrids with 1, 2-dihydroquinolones and 2-oxindoles as potential VEGFR-2 inhibitors: in-vitro anticancer evaluation and in-silico studies, Journal of Enzyme Inhibition and Medicinal Chemistry 37(1) (2022) 1903–1917. doi: 10.1080/14756366.2022.2085693 [DOI] [PMC free article] [PubMed] [Google Scholar]
- 24.Elkaeed E.B., Youssef F.S., Eissa I.H., Elkady H., Alsfouk A.A., Ashour M.L., et al. , Multi-Step In Silico Discovery of Natural Drugs against COVID-19 Targeting Main Protease, International Journal of Molecular Sciences 23(13) (2022) 6912. doi: 10.3390/ijms23136912 [DOI] [PMC free article] [PubMed] [Google Scholar]
- 25.Belal A., Elanany M.A., Santali E.Y., Al-Karmalawy A.A., Aboelez M.O., Amin A.H., et al. , Screening a Panel of Topical Ophthalmic Medications against MMP-2 and MMP-9 to Investigate Their Potential in Keratoconus Management, Molecules 27(11) (2022) 3584. doi: 10.3390/molecules27113584 [DOI] [PMC free article] [PubMed] [Google Scholar]
- 26.Taghour M.S., Mahdy H.A., Gomaa M.H., Aglan A., Eldeib M.G., Elwan A., et al. , Benzoxazole derivatives as new VEGFR-2 inhibitors and apoptosis inducers: design, synthesis, in silico studies, and antiproliferative evaluation, Journal of Enzyme Inhibition and Medicinal Chemistry 37(1) (2022) 2063–2077. doi: 10.1080/14756366.2022.2103552 [DOI] [PMC free article] [PubMed] [Google Scholar]
- 27.Suleimen Y.M., Jose R.A., Suleimen R.N., Ishmuratova M.Y., Toppet S., Dehaen W., et al A.A., Isolation and In Silico SARS-CoV-2 Main Protease Inhibition Potential of Jusan Coumarin, a New Dicoumarin from Artemisia glauca, Molecules 27(7) (2022) 2281. doi: 10.3390/molecules27072281 [DOI] [PMC free article] [PubMed] [Google Scholar]
- 28.Eissa I.H., Khalifa M.M., Elkaeed E.B., Hafez E.E., Alsfouk A.A., Metwaly A.M., In Silico Exploration of Potential Natural Inhibitors against SARS-Cov-2 nsp10, Molecules 26(20) (2021) 6151. doi: 10.3390/molecules26206151 [DOI] [PMC free article] [PubMed] [Google Scholar]
- 29.Elkaeed E.B., Elkady H., Belal A., Alsfouk B.A., Ibrahim T.H., Abdelmoaty M., et al. , Multi-Phase In Silico Discovery of Potential SARS-CoV-2 RNA-Dependent RNA Polymerase Inhibitors among 3009 Clinical and FDA-Approved Related Drugs, Processes 10(3) (2022) 530. [Google Scholar]
- 30.Suleimen Y.M., Jose R.A., Suleimen R.N., Arenz C., Ishmuratova M., Toppet S., et al. Eissa, Isolation and In Silico Anti-SARS-CoV-2 Papain-Like Protease Potentialities of Two Rare 2-Phenoxychromone Derivatives from Artemisia spp, Molecules 27(4) (2022) 1216. [DOI] [PMC free article] [PubMed] [Google Scholar]
- 31.Bonomi P., Erlotinib: a new therapeutic approach for non-small cell lung cancer, Expert opinion on investigational drugs 12(8) (2003) 1395–1401. doi: 10.1517/13543784.12.8.1395 [DOI] [PubMed] [Google Scholar]
- 32.Nossier E.S., Alasfoury R.A., Hagras M., El-Manawaty M., Sayed S.M., Ibrahim I.M., et al H., Modified pyrido [2, 3-d] pyrimidin-4 (3H)-one derivatives as EGFRWT and EGFRT790M inhibitors: Design, synthesis, and anti-cancer evaluation, Journal of Molecular Structure (2022) 133971. [DOI] [PMC free article] [PubMed] [Google Scholar]
- 33.Jänne P.A., Yang J.C.-H., Kim D.-W., Planchard D., Ohe Y., Ramalingam S.S., et al. , AZD9291 in EGFR inhibitor–resistant non–small-cell lung cancer, New England Journal of Medicine 372(18) (2015) 1689–1699. doi: 10.1056/NEJMoa1411817 [DOI] [PubMed] [Google Scholar]
- 34.Traxler P., Bold G., Frei J., Lang M., Lydon N., Mett H., et al. , Use of a pharmacophore model for the design of EGF-R tyrosine kinase inhibitors: 4-(phenylamino) pyrazolo [3, 4-d] pyrimidines, Journal of medicinal chemistry 40(22) (1997) 3601–3616. doi: 10.1021/jm970124v [DOI] [PubMed] [Google Scholar]
- 35.Ducray R., Ballard P., Barlaam B.C., Hickinson M.D., Kettle J.G., Ogilvie D.J., et al. , Novel 3-alkoxy-1H-pyrazolo [3, 4-d] pyrimidines as EGFR and erbB2 receptor tyrosine kinase inhibitors, Bioorganic & medicinal chemistry letters 18(3) (2008) 959–962. doi: 10.1016/j.bmcl.2007.12.035 [DOI] [PubMed] [Google Scholar]
- 36.Elmetwally S.A., Saied K.F., Eissa I.H., Elkaeed E.B., Design, synthesis and anticancer evaluation of thieno [2, 3-d] pyrimidine derivatives as dual EGFR/HER2 inhibitors and apoptosis inducers, Bioorganic chemistry 88 (2019) 102944. doi: 10.1016/j.bioorg.2019.102944 [DOI] [PubMed] [Google Scholar]
- 37.Zhao Z., Wu H., Wang L., Liu Y., Knapp S., Liu Q., et al. , Exploration of type II binding mode: A privileged approach for kinase inhibitor focused drug discovery?, ACS chemical biology 9(6) (2014) 1230–1241. doi: 10.1021/cb500129t [DOI] [PMC free article] [PubMed] [Google Scholar]
- 38.Furet P., Caravatti G., Lydon N., Priestle J.P., Sowadski J.M., Trinks U., Traxler P., Modelling study of protein kinase inhibitors: binding mode of staurosporine and origin of the selectivity of CGP 52411, Journal of Computer-Aided Molecular Design 9(6) (1995) 465–472. doi: 10.1007/BF00124317 [DOI] [PubMed] [Google Scholar]
- 39.Mowafy S., Galanis A., Doctor Z.M., Paranal R.M., Lasheen D.S., Farag N.A., et al. , Toward discovery of mutant EGFR inhibitors; Design, synthesis and in vitro biological evaluation of potent 4-arylamino-6-ureido and thioureido-quinazoline derivatives, Biorg. Med. Chem. 24(16) (2016) 3501–3512. [DOI] [PubMed] [Google Scholar]
- 40.Gandin V., Ferrarese A., Dalla Via M., Marzano C., Chilin A., Marzaro G., Targeting kinases with anilinopyrimidines: discovery of N-phenyl-N’-[4-(pyrimidin-4-ylamino) phenyl] urea derivatives as selective inhibitors of class III receptor tyrosine kinase subfamily, Scientific reports 5 (2015) 16750. doi: 10.1038/srep16750 [DOI] [PMC free article] [PubMed] [Google Scholar]
- 41.Liu Y., Gray N.S., Rational design of inhibitors that bind to inactive kinase conformations, Nature Chemical Biology 2(7) (2006) 358–364. doi: 10.1038/nchembio799 [DOI] [PubMed] [Google Scholar]
- 42.Gaber A.A., Bayoumi A.H., El-Morsy A.M., Sherbiny F.F., Mehany A.B., Eissa I.H., Design, synthesis and anticancer evaluation of 1H-pyrazolo [3, 4-d] pyrimidine derivatives as potent EGFRWT and EGFRT790M inhibitors and apoptosis inducers, Bioorganic chemistry 80 (2018) 375–395. doi: 10.1016/j.bioorg.2018.06.017 [DOI] [PubMed] [Google Scholar]
- 43.Nasser A.A., Eissa I.H., Oun M.R., El-Zahabi M.A., Taghour M.S., Belal A., et al. , Discovery of new pyrimidine-5-carbonitrile derivatives as anticancer agents targeting EGFR WT and EGFR T790M, Organic & biomolecular chemistry 18(38) (2020) 7608–7634. doi: 10.1039/d0ob01557a [DOI] [PubMed] [Google Scholar]
- 44.Elzahabi H.S., Nossier E.S., Alasfoury R.A., El-Manawaty M., Sayed S.M., Elkaeed E.B., et al. , Design, synthesis, and anti-cancer evaluation of new pyrido [2, 3-d] pyrimidin-4 (3H)-one derivatives as potential EGFRWT and EGFRT790M inhibitors and apoptosis inducers, Journal of Enzyme Inhibition and Medicinal Chemistry 37(1) (2022) 1053–1076. doi: 10.1080/14756366.2022.2062752 [DOI] [PMC free article] [PubMed] [Google Scholar]
- 45.Elkaeed E.B., Yousef R.G., Elkady H., Alsfouk A.A., Husein D.Z., Ibrahim I.M., et al. , New anticancer theobromine derivative targeting egfrwt and egfrt790m: Design, semi-synthesis, in silico, and in vitro anticancer studies, Molecules 27(18) (2022) 5859. doi: 10.3390/molecules27185859 [DOI] [PMC free article] [PubMed] [Google Scholar]
- 46.Elkaeed E.B., Yousef R.G., Elkady H., Alsfouk A.A., Husein D.Z., Ibrahim I.M., et al A New Theobromine-Based EGFRWT and EGFRT790M Inhibitor and Apoptosis Inducer: Design, Semi-Synthesis, Docking, DFT, MD Simulations, and In Vitro Studies, Processes 10(11) (2022) 2290. [Google Scholar]
- 47.Husein D.Z., Hassanien R., Khamis M.J.R.A., Cadmium oxide nanoparticles/graphene composite: synthesis, theoretical insights into reactivity and adsorption study, 11(43) (2021) 27027–27041. doi: 10.1039/d1ra04754j [DOI] [PMC free article] [PubMed] [Google Scholar]
- 48.Hanee U., Rahman M., Matin M.M., Synthesis PASS, In Silico ADMET and thermodynamic studies of some galactopyranoside esters, Physical Chemistry Research 9(4) (2021) 591–603. [Google Scholar]
- 49.Wang T., Husein D.Z.J.E.S., Research P., Novel synthesis of multicomponent porous nano-hybrid composite, theoretical investigation using DFT and dye adsorption applications: disposing of waste with waste, (2022) 1–28. [DOI] [PubMed] [Google Scholar]
- 50.Ferreira L.L., Andricopulo A.D., ADMET modeling approaches in drug discovery, Drug discovery today 24(5) (2019) 1157–1165. doi: 10.1016/j.drudis.2019.03.015 [DOI] [PubMed] [Google Scholar]
- 51.Norinder U., Bergström C.A., Prediction of ADMET properties, ChemMedChem: Chemistry Enabling Drug Discovery 1(9) (2006) 920–937. [DOI] [PubMed] [Google Scholar]
- 52.Dearden J.C., In silico prediction of drug toxicity, Journal of computer-aided molecular design 17(2) (2003) 119–127. doi: 10.1023/a:1025361621494 [DOI] [PubMed] [Google Scholar]
- 53.Idakwo G., Luttrell J., Chen M., Hong H., Zhou Z., Gong P., Zhang C., A review on machine learning methods for in silico toxicity prediction, Journal of Environmental Science and Health, Part C 36(4) (2018) 169–191. doi: 10.1080/10590501.2018.1537118 [DOI] [PubMed] [Google Scholar]
- 54.Kruhlak N., Benz R., Zhou H., Colatsky T., (Q) SAR modeling and safety assessment in regulatory review, Clinical Pharmacology & Therapeutics 91(3) (2012) 529–534. [DOI] [PubMed] [Google Scholar]
- 55.Elwan A., Abdallah A.E., Mahdy H.A., Dahab M.A., Taghour M.S., Elkaeed E.B., et al. Alsfouk, Modified benzoxazole-based VEGFR-2 inhibitors and apoptosis inducers: Design, synthesis, and anti-proliferative evaluation, Molecules 27(15) (2022) 5047. [DOI] [PMC free article] [PubMed] [Google Scholar]
- 56.Nossier E.S., Alasfoury R.A., Hagras M., El-Manawaty M., Sayed S.M., Ibrahim I.M., et al. , Modified pyrido[2,3-d]pyrimidin-4(3H)-one derivatives as EGFRWT and EGFRT790M inhibitors: Design, synthesis, and anti-cancer evaluation, Journal of Molecular Structure (2022) 133971. [DOI] [PMC free article] [PubMed] [Google Scholar]
- 57.Alsaif N.A., Taghour M.S., Alanazi M.M., Obaidullah A.J., Al-Mehizia A.A., Alanazi M.M., et al. Elkady, Discovery of new VEGFR-2 inhibitors based on bis ([1, 2, 4] triazolo)[4, 3-a: 3’, 4’-c] quinoxaline derivatives as anticancer agents and apoptosis inducers, Journal of enzyme inhibition and medicinal chemistry 36(1) (2021) 1093–1114. [DOI] [PMC free article] [PubMed] [Google Scholar]
- 58.Alanazi M.M., Eissa I.H., Alsaif N.A., Obaidullah A.J., Alanazi W.A., Alasmari A.F., et al. , Design, synthesis, docking, ADMET studies, and anticancer evaluation of new 3-methylquinoxaline derivatives as VEGFR-2 inhibitors and apoptosis inducers, Journal of Enzyme Inhibition and Medicinal Chemistry 36(1) (2021) 1760–1782. doi: 10.1080/14756366.2021.1956488 [DOI] [PMC free article] [PubMed] [Google Scholar]
- 59.Elkaeed E.B., Eissa I.H., Elkady H., Abdelalim A., Alqaisi A.M., Alsfouk A.A., et al A Multistage In Silico Study of Natural Potential Inhibitors Targeting SARS-CoV-2 Main Protease, International Journal of Molecular Sciences 23(15) (2022) 8407. [DOI] [PMC free article] [PubMed] [Google Scholar]
- 60.Elkaeed E.B., Yousef R.G., Elkady H., Gobaara I.M.M., Alsfouk B.A., Husein D.Z., et al. , Design, Synthesis, Docking, DFT, MD Simulation Studies of a New Nicotinamide-Based Derivative: In Vitro Anticancer and VEGFR-2 Inhibitory Effects, Molecules 27(14) (2022) 4606. doi: 10.3390/molecules27144606 [DOI] [PMC free article] [PubMed] [Google Scholar]
Associated Data
This section collects any data citations, data availability statements, or supplementary materials included in this article.
Supplementary Materials
(PDF)
Data Availability Statement
All relevant data are within the paper and its Supporting Information files.


