

Abstract
Aims:
Frailty is associated with increased morbidity and mortality in patients undergoing left atrial appendage closure (LAAC). This study aimed to compare the performance of two claims-based frailty measures in predicting adverse outcomes following LAAC.
Methods:
We identified patients 66 years and older who underwent LAAC between October 1, 2016 and December 31, 2019 in Medicare fee-for-service claims. Frailty was assessed using the previously validated Hospital Frailty Risk Score (HFRS) and Kim Claims-based Frailty Index (CFI). Patients were identified as frail based on HFRS ≥5 and CFI ≥0.25.
Results:
Of the 21,787 patients who underwent LAAC, frailty was identified in 45.6% by HFRS and 15.4% by CFI. There was modest agreement between the two frailty measures (kappa 0.25, Pearson’s correlation 0.62). After adjusting for age, sex, and comorbidities, frailty was associated with higher risk of 30-day mortality, 1-year mortality, 30-day readmission, long hospital stay, and reduced days at home (p<0.01 for all) regardless of the frailty measure used. The addition of frailty to standard comorbidities significantly improved model performance to predict 1-year mortality, long hospital stay, and reduced days at home (Delong p-value <0.001).
Conclusion:
Despite significant variation in frailty detection and modest agreement between the two frailty measures, frailty status remained highly predictive of mortality, readmissions, long hospital stay, and reduced days at home among patients undergoing LAAC. Measuring frailty in clinical practice, regardless of the method used, may provide prognostic information useful for patients being considered for LAAC, and may inform shared decision-making in this population.
Keywords: Frailty, left atrial appendage closure, claims data
Introduction
Percutaneous left atrial appendage closure (LAAC) is increasingly used for thromboembolic prophylaxis in patients with non-valvular atrial fibrillation (AF) who cannot tolerate long-term anticoagulation. Real-world registries have reported nearly three-fold higher rates of 1-year mortality (7.5–9.8%)1,2 than observed in randomized trials (2.5–3.0%)3,4, which may be related to the high prevalence of older frail patients undergoing LAAC in clinical practice.5 The relatively high rates of mortality in this population may limit the overall benefit and cost-effectiveness of this preventive procedure. Alternatively, higher risk patients may be at increased risk of bleeding and stroke, and may sustain greater benefits from LAAC if the procedure results in a greater absolute reduction in net adverse events. Identifying evidence-based strategies to better optimize patient selection before LAAC are thus needed.
Frailty assessment can be used to identify patients with reduced physiologic reserve and increased vulnerability to adverse outcomes.6,7 While over 20 frailty assessment tools have been developed, there is a lack of consensus on a standard method of measuring frailty, reflecting the complexity of defining this clinical syndrome.6,7 The two most widely used and validated approaches include the Fried frailty phenotype, which is defined based on functional characterizations of strength, mobility, and independence, and the Rockwood deficit accumulation model, which quantifies the total burden of age-related health deficits.8,9 Yet frailty is not routinely assessed in real-world practice, and is often unmeasured in clinical trials and real-world databases. We previously demonstrated that a claims-based frailty risk score can be used to retrospectively ascertain frailty status and can identify individuals at higher risk of adverse outcomes following LAAC.5 However, the preferred method for the measurement of frailty using administrative claims in patients undergoing LAAC remains unclear.
In the present study, we sought to compare two commonly used claims-based frailty measures in terms of their ability to predict clinical adverse outcomes after percutaneous LAAC in a nationwide cohort.
Methods
Data source
We used the Centers for Medicare and Medicaid Services Medicare Provider Analysis and Review (MedPAR) inpatient files from 2016 to 2019, as well as enrollment and mortality data from the Master Beneficiary Summary File (MBSF). This includes a 100% sample of administrative billing claims for inpatient hospitalizations among fee-for-service Medicare beneficiaries.. This study was completed in accordance with a data use agreement with the Centers for Medicare and Medicaid Services (CMS). This work was approved by the institutional review board at Beth Israel Deaconess Medical Center, with a waiver of informed consent applicable to retrospective analysis of observational data.
Study cohort and covariates
Patients aged 66 and older were included in this study if they have a procedural code for percutaneous LAAC (International Classification of Diseases, 10th Revision [ICD-10], Procedure Coding System 02L73DK) with a principal diagnosis code for AF (ICD-10, Clinical Modification codes I480, I481, I482, I4891) between October 1, 2016 and December 31, 2019. These dates were chosen due to the initial approval of the first percutaneous LAAC device, the WATCHMAN device (Boston Scientific, Natick, MA) in 2015. The WATCHMAN procedure is designated by Medicare as an inpatient only procedure, and therefore the ICD-10 procedural code 02L73DK should capture all Medicare beneficiaries undergoing percutaneous LAAC. Patients who were not continuously enrolled in Medicare for at least one year before LAAC device implantation were excluded to facilitate ascertainment of co-morbidities.
Baseline demographics were measured as of the index procedure date. Race/ethnicity (White, Black, Hispanic, Asian, American Indian, Other) was classified based on self-report using categories specified by Medicare at the time of enrollment. Comorbidities were identified using validated algorithms provided by the CMS Chronic Conditions Warehouse.10
Frailty assessment
Two claims-based frailty indices were used to assess frailty. First, we used the Hospital Frailty Risk Score (HFRS), which was developed in a large population of adults 75 years or older in the United Kingdom based on 109 ICD-10 diagnostic codes that were associated with higher resource utilization, and externally validated in a Canadian population of older adults.11,12 Although the HFRS only has fair to modest correlation with the Fried and Rockwood definitions of frailty, respectively, it more closely represents a form of “utilization frailty,” which has been previously shown to identify populations with high resource utilization and adverse outcomes.13 The HFRS was calculated for each patient based on principal and secondary diagnosis codes from all hospitalizations occurring at least one year prior to the date of admission for the index hospitalization, as well as diagnosis codes that were coded as “present on admission” during the index hospitalization. Frailty was defined as HFRS ≥5 based on previously reported cut-points.
Second, we used the Kim Claims-based Frailty Index (CFI), which was developed and validated in the Medicare population using 93 variables derived from diagnosis, health services, and durable medical equipment codes from all claims files (inpatient, outpatient, skilled nursing facility, home health, carrier, and durable medical equipment claims) to predict the value of a deficit-accumulation frailty index (range, 0 to 1).14,15 The deficit accumulation frailty index quantifies the total burden of age-related health deficit across multiple domains. This index was derived from ICD-9 codes and recently updated for ICD-10 codes.16 The MedPAR file used for our study contains only inpatient claims. Frailty was defined as ≥0.25 based on previously published cut-offs.14
Study outcomes
The study outcomes included 30-day mortality, 1-year mortality, 30-day readmission, long hospital stay (defined as >10 days in-hospital for the stay that included the index procedure)11, and days at home. Days at home was defined as the total number of days alive and out of acute care hospitals, inpatient rehabilitation, or skilled nursing facilities in the first 365 days following the index procedure. Reduced days at home was defined as <15 days, which has previously been defined as clinically significant and associated with functional decline.17,18
Statistical analysis
Demographic and clinical characteristics of patients were summarized using count and percentages for categorical variables and mean and standard deviations for continuous variables. To determine whether the frailty measures identify the same group of individuals, we examined the agreement between each frailty score as categorical and continuous variables using Cohen’s kappa score and Spearman correlation coefficient, respectively.
We constructed multivariable logistic regression models to determine the association between frailty with 30-day mortality, 1-year mortality, 30-day readmission, long hospital stay, and reduced days at home, as well as a multivariable linear regression model to evaluate the association between frailty and home time lost. For each binary outcome, models were first created considering frailty as categorical variable (using non-frail as the reference group), and then again as a continuous variable (in standard deviation units). Models were adjusted for age, sex, and CCW comorbidities. For each outcome, the area under the receiver operating curves was compared between the two frailty instruments treated both as categorical and continuous variables using Delong method. Lastly, we compared the performance of each frailty instrument to predict each of the outcomes when added to a model based on age, gender, and CCW comorbidities alone. Models were assessed based on Harrell’s C-statistic. All statistical analyses were performed in STATA version 15.0 (Stata Corporation, College Station, TX) or SAS version 9.4 (SAS Institute, Cary, NC) using a 2-tailed α value of <0.05 to define statistical significance.
Results
Cohort characteristics
A total of 21,787 patients who underwent percutaneous LAAC were included in the analysis. The mean age of patients was 77.5 ± 6.7 years old; 9,536 (43.8%) were female; and 20,258 (93.0%) self-identified as white. Common comorbidities included diabetes (44.9%), heart failure (59.4%), chronic kidney disease (56.6%), and chronic lung disease (30.7%). Alzheimer’s disease and related disorders were documented in 20.1% of all patients (Table 1).
Table 1:
Baseline demographics, covariates, and frailty indices of the study population
| Subject Characteristic | Total ~ (N = 21787) |
|---|---|
| Age (years) | 77.49±6.70 (21787) |
| Hospital Frailty Risk Score | 7.00±8.15 (21787) |
| Frail(≥5) | 45.46% (9905/21787) |
| Not-frail(<5) | 54.54% (11882/21787) |
| Kim Claims-based Frailty Index | 0.20±0.05 (21787) |
| Frail (≥0.25) | 15.42% (3359/21787) |
| Non-frail (<0.25) | 84.58% (18428/21787) |
| Male | 56.23% (12251/21787) |
| Race | |
| White | 92.98% (20258/21787) |
| Black | 3.49% (761/21787) |
| Other | 1.05% (228/21787) |
| Asian | 0.67% (147/21787) |
| Hispanic | 0.55% (119/21787) |
| North American Native | 0.33% (71/21787) |
| CCW Comorbidity | |
| Cardiovascular | |
| Acute Myocardial Infarction | 4.0% (874/21787) |
| Atrial Fibrillation | 100.0% (21784/21787) |
| Heart Failure | 59.4% (12945/21787) |
| Hypertension | 96.8% (21082/21787) |
| Ischemic Heart Disease | 77.5% (16875/21787) |
| Stroke / Transient Ischemic Attack | 22.1% (4817/21787) |
| Non-cardiovascular | |
| Alzheimer’s Disease | 3.47% (756/21787) |
| Alzheimer’s Disease and Rltd Disorders or Senile Dementia | 16.6% (3620/21787) |
| Anemia | 63.2% (13777/21787) |
| Asthma | 12.1% (2637/21787) |
| Breast Cancer | 4.9% (1062/21787) |
| Colorectal Cancer | 2.7% (599/21787) |
| Diabetes | 44.9% (9793/21787) |
| Endometrial Cancer | 0.7% (161/21787) |
| Lung Cancer | 1.8% (393/21787) |
| Prostate Cancer | 8.7% (1885/21787) |
| Cataract | 20.9% (4560/21787) |
| Chronic Kidney Disease | 56.6% (12332/21787) |
| Chronic Obstructive Pulmonary Disease | 30.7% (6685/21787) |
| Depression | 29.1% (6341/21787) |
| Glaucoma | 11.9% (2583/21787) |
| Hip/Pelvic Fracture | 1.2% (266/21787) |
| Benign Prostatic Hyperplasia | 23.4% (5088/21787) |
| Acquired Hypothyroidism | 30.4% (6617/21787) |
| Osteoporosis | 10.7% (2337/21787) |
| Rheumatoid Arthritis / Osteoarthritis | 57.9% (12611/21787) |
| Days at home | 338.59±65.91 (21787/21787) |
| Frail (HFRS≥5) | 326.50±78.97 |
| Non-frail (HFRS<5) | 348.67±50.43 |
| Frail (CFI≥0.25) | 313.66±91.25 |
| Non-frail (CFI<0.25) | 343.14±59.03 |
Values are presented as mean ± SD or n(%); CCW = Chronic Conditions Warehouse
Frailty assessment
In total, 10,740 patients (45.5%) were defined as frail based on the HFRS >5 and the mean HFRS was 7.00±8.15 (range 0–56). In contrast, only 3,359 patients (15.4%) were identified as frail based on the Kim CFI ≥0.25 and the mean Kim CFI was 0.20±0.05 (range 0.07–0.46) (Table 1). There was only fair agreement between the HFRS and Kim CFI as categorical variables (Cohen’s kappa 0.25), though there was strong agreement between the two frailty measures as continuous variables (Spearman correlation 0.62).
Prediction of outcomes
The incidence of adverse outcomes were consistently higher in the frail group compared to non-frail group, regardless of the frailty measure used (Table 2). In multivariable logistic regression analyses, both HFRS and Kim CFI were significantly associated with higher risk of 30-day mortality, 1-year mortality, 30-day readmission, long hospital stay, and reduced days at home after adjusting for age, sex, and comorbidities (Table 3). In multivariable linear regression analyses, frailty defined by the HFRS and Kim CFI was associated with 13.00 fewer days at home (95% CI −14.84 to −11.17) and 17.97 fewer days at home (95% CI −20.58 to −15.36) in the first year after the procedure, respectively.
Table 2:
Incidence of clinical outcomes following percutaneous left atrial appendage closure
| Hospital Frailty Risk Score | Kim Claims-based Frailty Index | |||
|---|---|---|---|---|
| Frail (≥5) | Not frail(<5) | Frail(≥0.25) | Not frail(<0.25) | |
| 30-day Mortality | 95 (0.96%) | 47 (0.40%) | 52 (1.55%) | 90 (0.49%) |
| 1-year Mortality | 1212 (12.24%) | 572 (4.81%) | 518 (15.42%) | 1266 (6.87%) |
| Long Hospital Stay | 295 (2.98%) | 92 (0.77%) | 162 (4.82%) | 225 (1.22%) |
| 30-day Readmission | 1287 (12.99%) | 753 (6.34%) | 537 (15.99%) | 1503 (8.16%) |
| Reduced Days at Home | 3127 (31.57%) | 1626 (13.68%) | 1358 (40.43%) | 3395 (18.42%) |
Table 3:
Results from multivariable logistic regression models according to Hospital Frailty Risk Score and Kim Claims-based Frailty Index
| Hospital Frailty Risk Score | |||
|---|---|---|---|
| Outcomes | Subject Characteristic | Odds Ratio (95% CI) | p-value |
| 30-day Mortality | Hospital frailty risk score (category): Frail (≥5) | 1.70 (1.17, 2.46) | 0.0053 |
| Hospital frailty risk score (continuous*) | 1.41 (1.23, 1.61) | <.0001 | |
| 1-year Mortality | Hospital frailty risk score (category): Frail (≥5) | 1.89 (1.70, 2.11) | <.0001 |
| Hospital frailty risk score (continuous*) | 1.34 (1.28, 1.40) | <.0001 | |
| Long Hospital Stay | Hospital frailty risk score (category): Frail (≥5) | 2.39 (1.86, 3.07) | <.0001 |
| Hospital frailty risk score (continuous*) | 1.54 (1.43, 1.67) | <.0001 | |
| 30-day Readmission | Hospital frailty risk score (category): Frail (≥5) | 1.46 (1.31, 1.61) | <.0001 |
| Hospital frailty risk score (continuous*) | 1.20 (1.15, 1.25) | <.0001 | |
| Reduced Days at Home | Hospital frailty risk score (category): Frail (≥5) | 1.85 (1.71, 2.00) | <.0001 |
| Hospital frailty risk score (continuous*) | 1.41 (1.37, 1.46) | <.0001 | |
| Kim Claims-based Frailty Index | |||
| Outcomes | Subject Characteristic | Odds Ratio (95% CI) | p-value |
| 30-day Mortality | Kim Claims-based frailty index (categorical): Frail (≥0.25) | 2.58 (1.72, 3.85) | <.0001 |
| Kim Claims-based frailty index (continuous*) | 1.53 (1.28, 1.84) | <.0001 | |
| 1-year Mortality | Kim Claims-based frailty index (categorical): Frail (≥0.25) | 1.60 (1.41, 1.81) | <.0001 |
| Kim Claims-based frailty index (continuous*) | 1.35 (1.28, 1.43) | <.0001 | |
| Long Hospital Stay | Kim Claims-based frailty index (categorical): Frail (≥0.25) | 2.15 (1.69, 2.73) | <.0001 |
| Kim Claims-based frailty index (continuous*) | 1.60 (1.43, 1.78) | <.0001 | |
| 30-day Readmission | Kim Claims-based frailty index (categorical): Frail (≥0.25) | 1.26 (1.12, 1.42) | 0.0002 |
| Kim Claims-based frailty index (continuous*) | 1.19 (1.12, 1.25) | <.0001 | |
| Reduced Days at Home | Kim Claims-based frailty index (categorical): Frail (≥0.25) | 1.61 (1.47, 1.77) | <.0001 |
| Kim Claims-based frailty index (continuous*) | 1.38 (1.32, 1.44) | <.0001 | |
per 1-standard deviation increase in Hospital Frailty Risk Score or Kim Claims-based Frailty Index score; CI = confidence interval
The receiver operator curves for the two frailty measures are plotted in Figure 1 and the areas under these curves were calculated for each outcome measure. Model discrimination for all the outcomes are presented in Table 4. The C-statistic for 1-year mortality without any of the frailty instruments was 0.698 (95% confidence interval [CI] 0.686–0.710). After adding the HFRS, the C-statistic for 1-year mortality improved to 0.713 (95% CI 0.701–0.724). Similarly, the incorporation of the Kim CFI improved the C-statistic to 0.705 (95% CI 0.693–0.717). For all other outcomes, incorporation of HFRS to a model based on age, sex, and comorbidities improved prediction of 30-day readmission, long hospital stay, and reduced days at home, but not 30-day mortality. The addition of the Kim CFI improved prediction of long hospital stay and reduced days at home, but did not improve prediction of 30-day mortality and readmissions.
Figure 1:
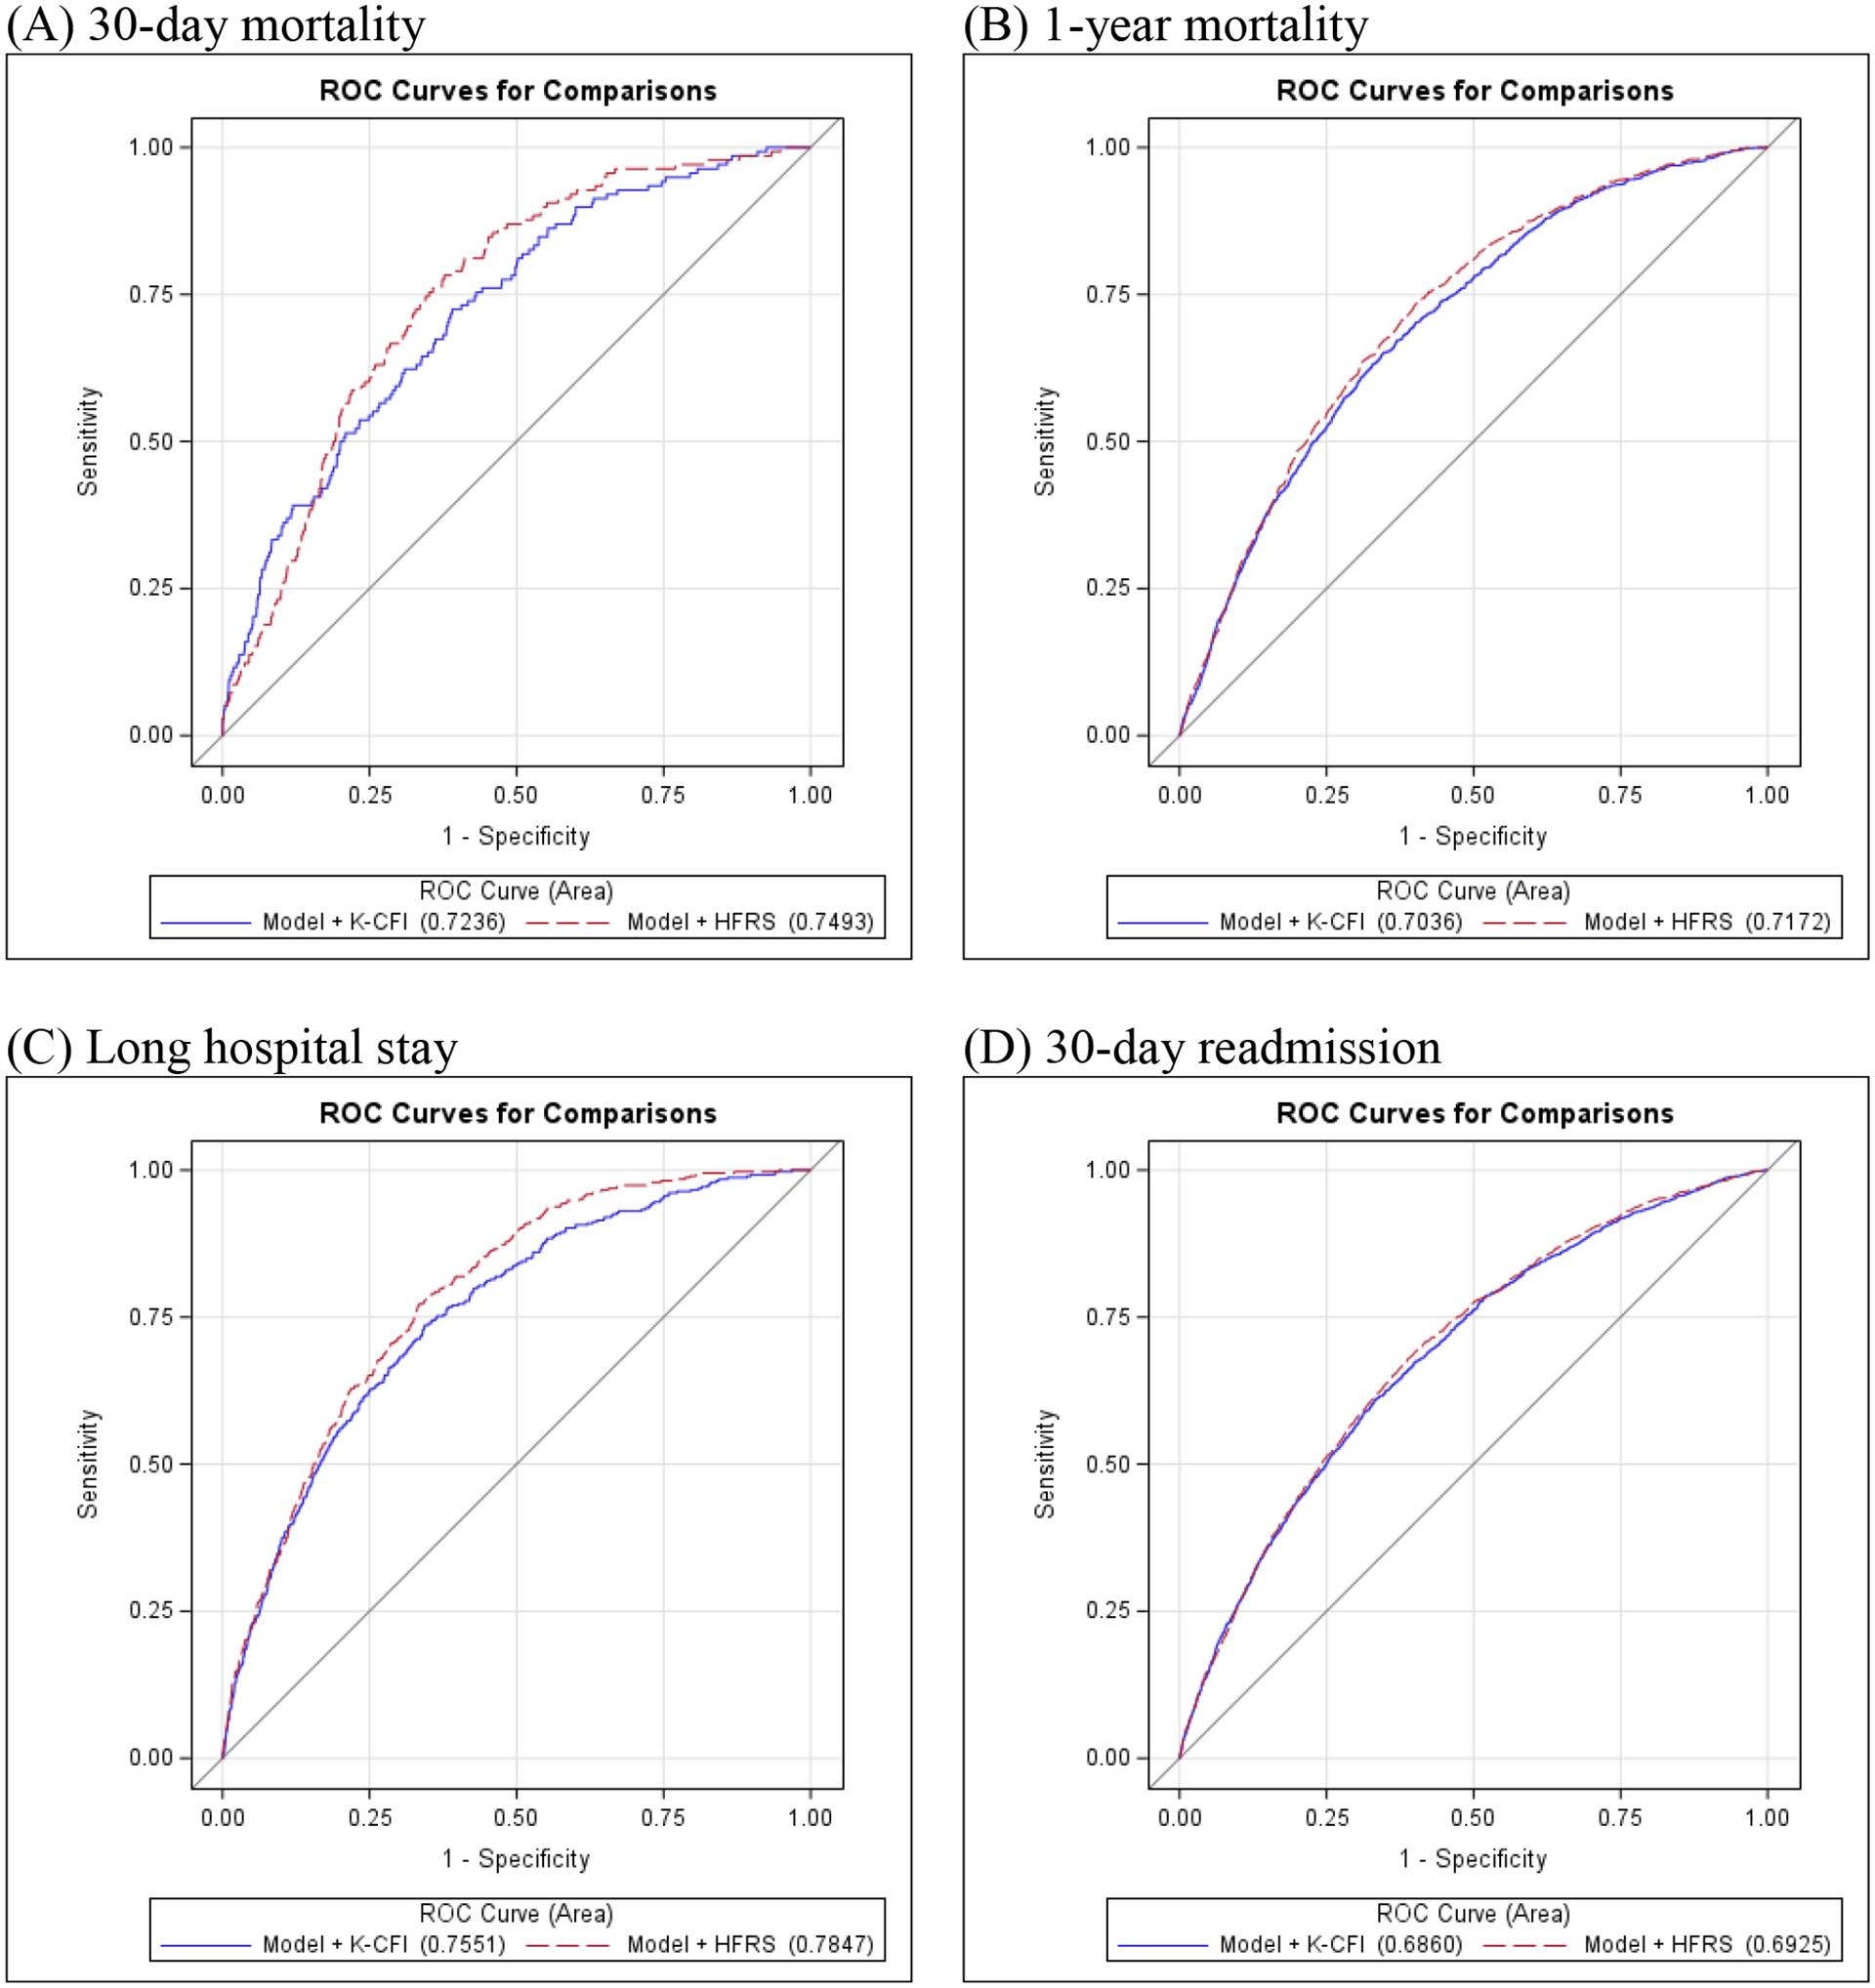
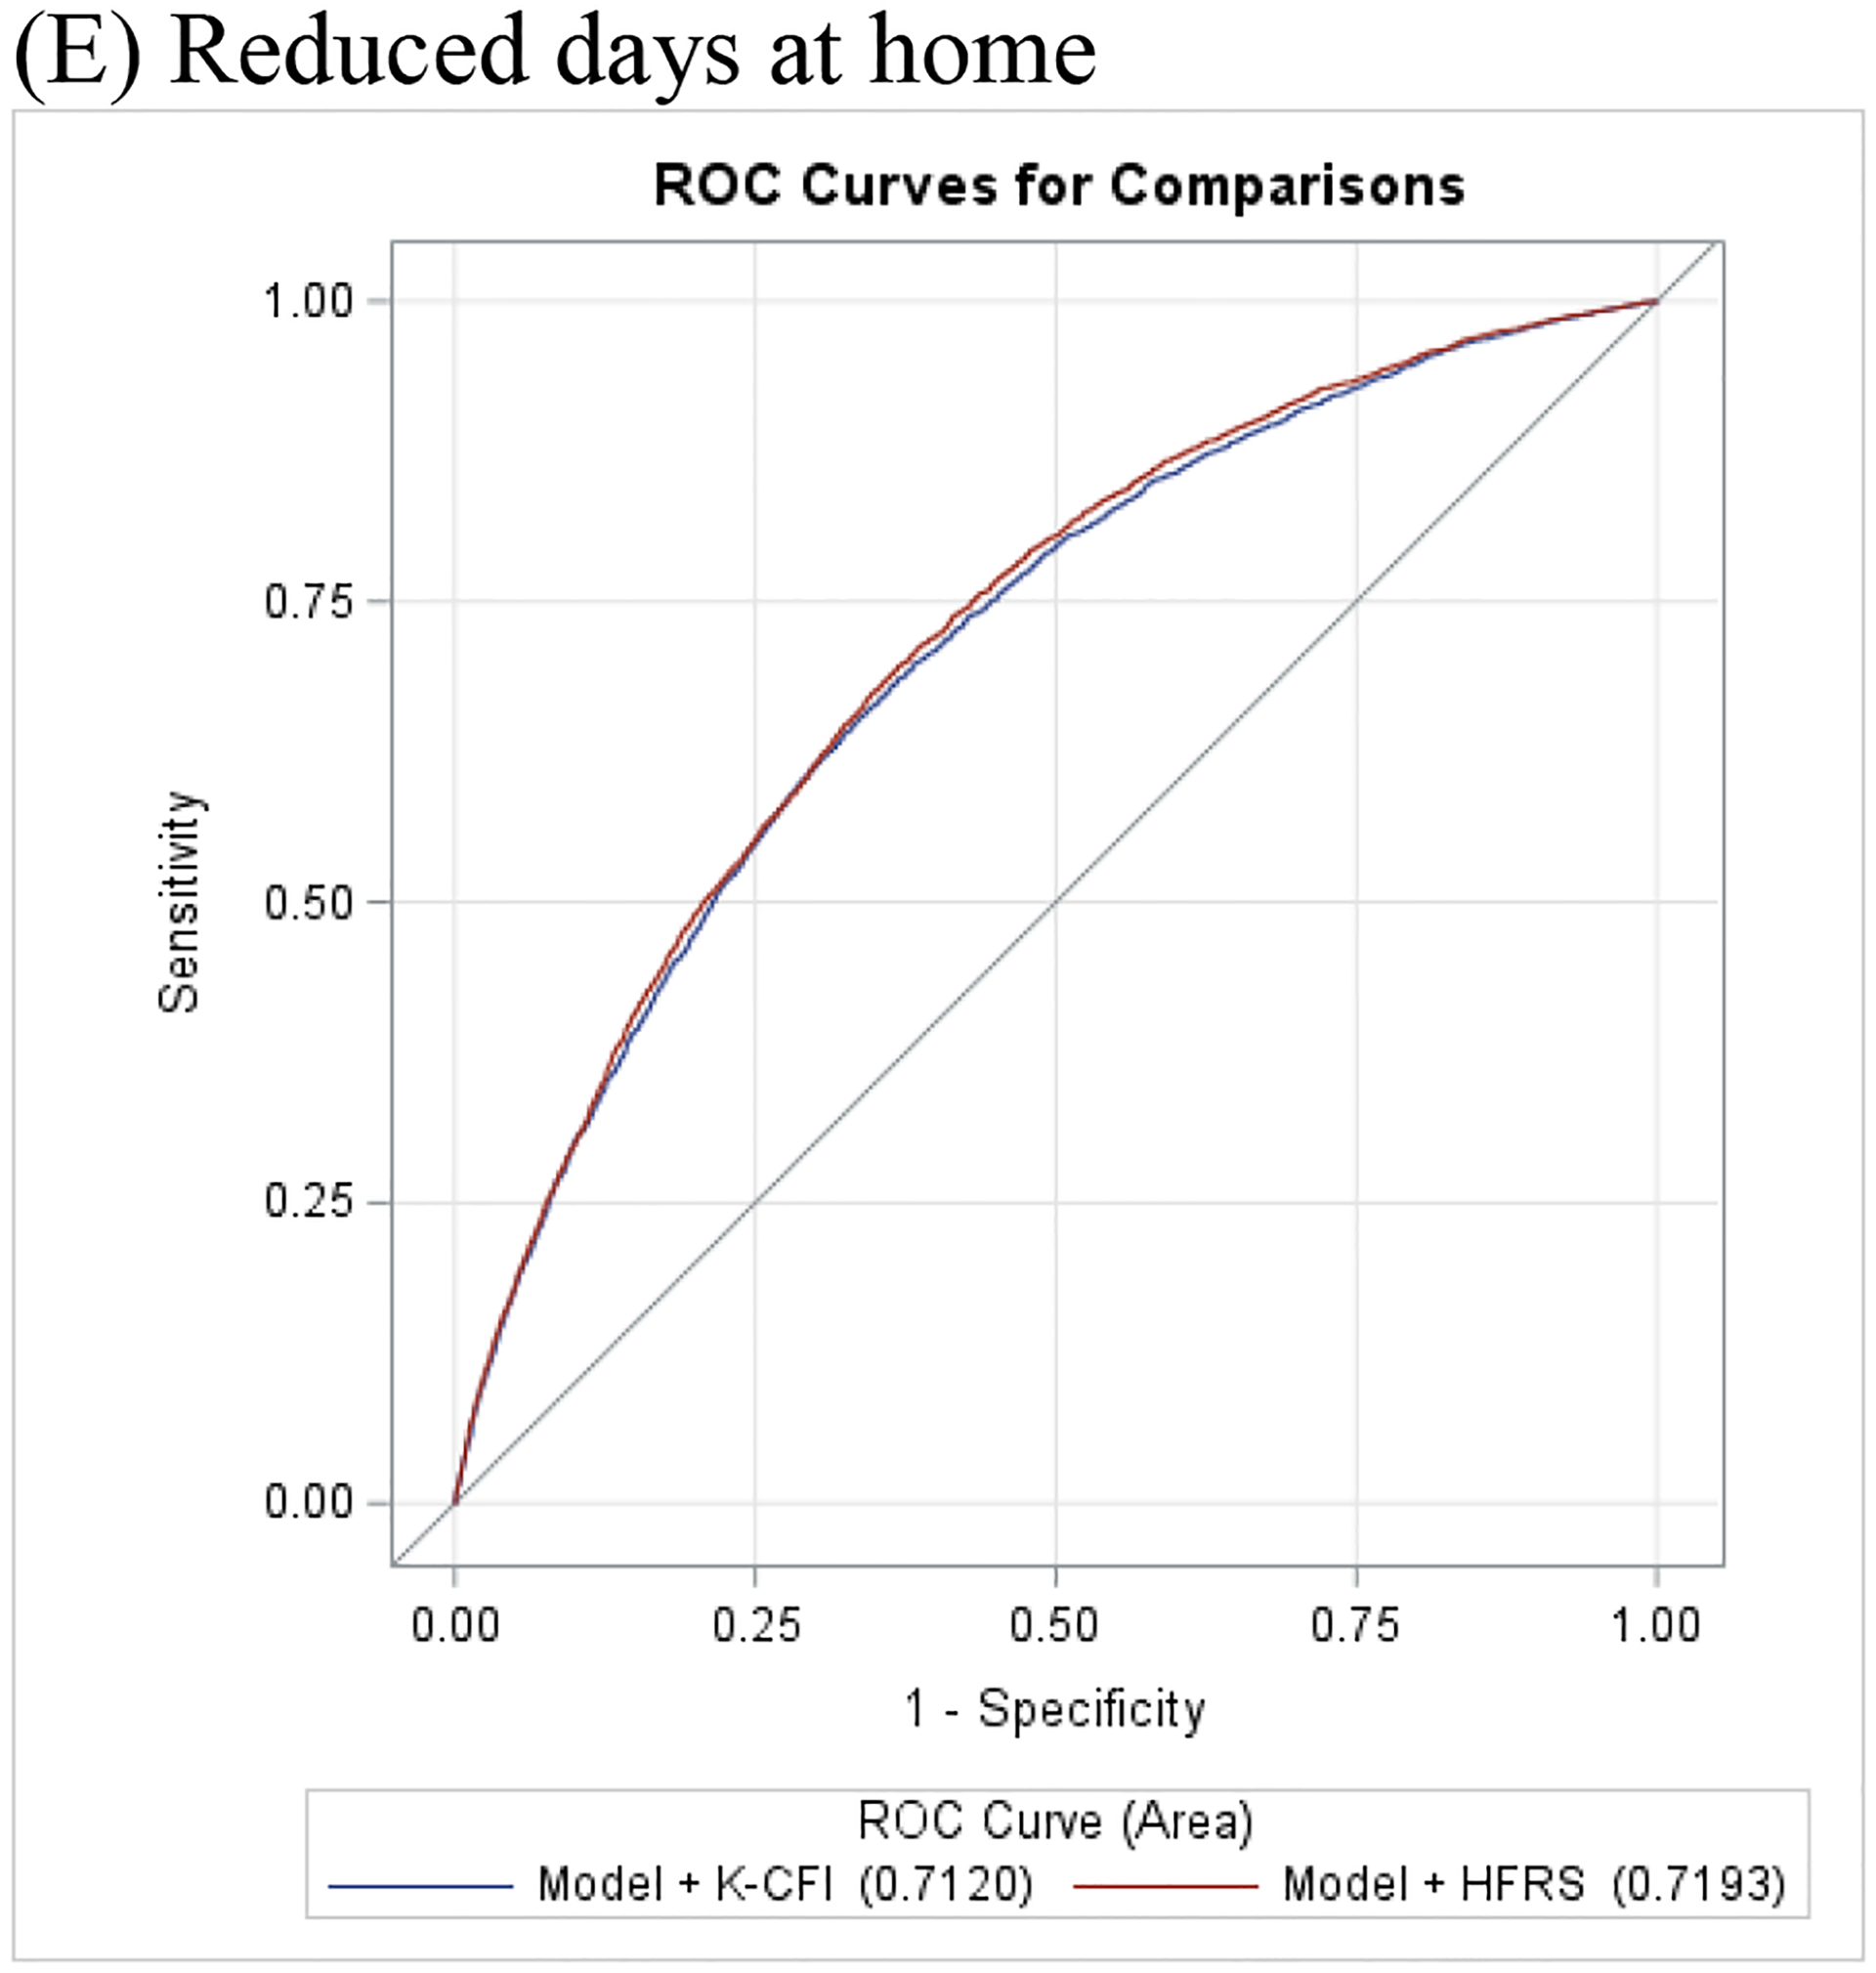
Receiver operating characteristic curves of Hospital Frailty Risk Score and Kim Claims-based Frailty Index to predict (A) 30-day mortality, (B) 1-year mortality, (C) Long hospital stay, (D) 30-day readmission, and (E) Reduced days at home
Table 4:
Discrimination and comparison of Hospital Frailty Risk Score and Kim Claims-based Frailty Index models
| Outcomes | Models | C-statistic (95% CI) | Delong p-value |
|---|---|---|---|
| 1-year Mortality | Model | 0.6979 (0.6859, 0.7099) | |
| Model + HFRS | 0.7127 (0.7009, 0.7244) | <.0001 | |
| Model + CFI | 0.7047 (0.6928, 0.7166) | <.0001 | |
| 30-day Mortality | Model | 0.7048 (0.6674, 0.7422) | |
| Model + HFRS | 0.7158 (0.6778, 0.7538) | 0.1416 | |
| Model + CFI | 0.7219 (0.6821, 0.7617) | 0.1202 | |
| 30-day Readmission | Model | 0.6848 (0.6730, 0.6966) | |
| Model + HFRS | 0.6910 (0.6794, 0.7027) | 0.0002 | |
| Model + CFI | 0.6860 (0.6742, 0.6979) | 0.1101 | |
| Long Hospital Stay | Model | 0.7400 (0.7164, 0.7636) | |
| Model + HFRS | 0.7593 (0.7373, 0.7814) | 0.0007 | |
| Model + CFI | 0.7551 (0.7318, 0.7784) | 0.0005 | |
| Reduced Days at Home | Model | 0.7062 (0.6975, 0.7149) | |
| Model + HFRS | 0.7193 (0.7107, 0.7278) | <.0001 | |
| Model + CFI | 0.7120 (0.7034, 0.7207) | <.0001 |
HFRS = Hospital Frailty Risk Score; CFI = Kim Claims-based Frailty Index; CI = confidence interval; NRI = net reclassification index; IDI = integrated discrimination improvement
Model based on age, sex, and Chronic Conditions Warehouse comorbidities
Discussion
In this nationwide cohort study, we compared the predictive performances of two claims-based frailty measures in patients undergoing LAAC. There were 3 main findings from our analysis: (1) there was significant variation in frailty detection with only modest agreement between the two frailty instruments, (2) irrespective of the frailty scale used, frailty status was independently associated with mortality, readmissions, prolonged hospitalization, and reduced days at home, and (3) both frailty measures provided incremental value above standard comorbidities to predict mortality, prolonged hospitalization, and reduced days at home. Taken together, these findings highlight the prognostic value of measuring frailty in patients undergoing LAAC.
Frailty is characterized by a state of decreased physiological reserve and increased vulnerability to stressors, and has been associated with adverse outcomes in patients undergoing LAAC.5,7 While multiple frailty scales exist to measure frailty, they can be broadly categorized into two main frameworks: (1) the Rockwood deficit accumulation model, which conceptualizes frailty as an accumulation of deficits across multiple health domains, and (2) the Fried frailty phenotype, which conceptualizes frailty as a biologic syndrome based on weight loss, exhaustion, weakness, slowness, and inactivity.7,8,19 In our study, we compared two claims-based frailty indices based on different conceptualizations of frailty. While the Kim CFI was developed based on the Rockwood cumulative-deficit approach, the HFRS defines frailty according to clusters of high resource use, and more closely resembles a form of “utilization frailty” with only modest correlation with the traditional Fried and Rockwood indices.11,14,15 To date, there are no frailty indices developed for the Fried frailty phenotype using the ICD-10-CM classification system. Neither of the frailty indices used in the present study capture physiologic measures of frailty, and therefore may not comprehensively quantify frailty for all patients. Further development of frailty scales anchored to the Fried model is needed to better capture patients with phenotypic frailty.20
In the present study, we found that frailty prevalence varies widely depending on the frailty instrument used, ranging from 15.4% to 45.5%. The discordance in frailty prevalence may be related to how each frailty instrument was derived. For instance, the HFRS was developed in a cohort of hospitalized adults and includes diagnostic codes for acute conditions such as “disorders or fluid, electrolyte, and acid-base balance” and “volume depletion”, which may better identify frail patients at risk for adverse outcomes in the acute care setting. In contrast, the Kim CFI was developed in a community-based population, and uses administrative codes from inpatient, outpatient, home health agency, and durable medical equipment files, which may better characterize frailty among community-dwelling adults.14,15 Given that our study only used inpatient claims, the Kim CFI may underestimate the prevalence of frailty in our population.
Nevertheless, we found that regardless of the claims-based frailty measure used, frailty status remained highly predictive of mortality, readmissions, prolonged hospitalization, and reduced days at home in patients undergoing LAAC. Despite only modest agreement between the two frailty instruments, both provided incremental value above standard comorbidities to predict adverse outcomes. These findings suggests that measuring frailty in patients undergoing LAAC may provide important prognostic information regardless of the method used. This is consistent with prior studies, which have demonstrated an association between distinct frailty measures and adverse outcomes in patients undergoing cardiovascular procedures such as transcatheter valve therapies, catheter ablation, percutaneous coronary intervention, and cardiac surgery. However, frailty assessment tools remain underutilized in clinical practice.6 While not intended to replace validated in-person metrics for the assessment of frailty, our study demonstrated that claims-based frailty indices can be used to retrospectively ascertain frailty status, improve risk prediction in patients undergoing LAAC, and allow determination of heterogeneity in treatment effects across frailty groups. Additionally, claims-based frailty measures can be used to identify high-risk populations who may benefit from targeted pre-procedural interventions such as nutritional supplementation and intensive rehabilitation, which have been shown to reduce frailty and improve post-procedural outcomes.
Despite the potential applications of claims-based frailty measures for population-level frailty screening, well-validated frailty metrics based on in-person measurements remain the gold standard for assessing frailty in clinical practice.7 Our findings suggest that formal assessment of frailty may provide prognostic information useful for patients and heart team committees charged with adjudicating candidates for LAAC. For instance, we found that frail patients are at particularly high risk of mortality, which may limit the overall benefit and cost-effectiveness of this preventive procedure. In post-hoc analyses of the two landmark trials for LAAC, net clinical benefit of LAAC vs. warfarin therapy was not observed until after 2 years of treatment, and cost-effectiveness was not observed until 7 years. However, frail patients may also be at higher risk of bleeding and stroke, and may sustain greater benefits from LAAC than non-frail patients. Therefore, an individualized approach is needed to maximize the clinical utility of LAAC in this high risk population. Our study also demonstrated that frail patients spend significantly fewer days at home following device implantation. Reduced days at home has been associated with poor self-rated health, mobility impairment, depressed mood, limited social activity, and difficulty in self-care, and may better reflect the overall quality of life and functional status of patients. Days at home is a concept that is more easily understood by patients and family members, and may better guide shared decision-making in patients being considered for LAAC.17 Future studies should focus on prospective evaluation of frailty using validated in-person frailty metrics to further refine the relationship between frailty status, clinical outcomes, and treatment benefits in patients eligible for LAAC.
This study should be interpreted in the context of a few specific limitations. First, the majority of our study population were white, which reflects the patient population receiving LAAC in the United States, but limits the generalizability of our findings to patients of different racial or ethnic backgrounds. Second, outpatient and durable medical equipment files were not available for our study, and therefore, the prevalence and effect size of frailty based on the Kim CFI may be underestimated.14 Third, administrative codes may not capture the severity of a given condition or may misclassify certain conditions, which could lead to an underestimate of frailty in our population. Nevertheless, we excluded patients without Medicare fee-for-service coverage for one year prior to the index hospitalization to ensure as complete a record as possible to calculate the frailty indices. Relatedly, the indication for each procedure, such as history of bleeding or intolerance of anticoagulation, is not easily captured by administrative claims.
Conclusion
Despite significant variation in frailty detection and only modest agreement between the two frailty measures, frailty status remained highly predictive of mortality, readmissions, prolonged hospitalization, and reduced days at home among patients undergoing LAAC. Measuring frailty in clinical practice, regardless of the method used, may provide prognostic information useful for patients being considered for LAAC. Future studies should focus on prospective evaluation of frailty using validated in-person frailty metrics to further refine the relationship between frailty status and clinical outcomes, and help inform shared decision making.
Acknowledgements:
DHK is supported by grants from NIH (R01AG056368, R01AG071809, R01AG062713, and R21AG060227) and receives personal fee from Alosa Health and VillageMD. DK reports an investigator-initiated research grant from Boston Scientific Corporation to her institution and a consulting fee from Eagle Pharmaceuticals. DBK reports support from NIH (R01AG068141 and R01HL161697). The rest of the authors have no conflicts of interest to disclose.
Abbreviations
- LAAC
Left atrial appendage closure
- HFRS
Hospital frailty risk score
- CFI
Claims-based frailty index
- CMS
Center for medicare and Medicaid services
- MBSF
Master beneficiary summary file
- ICD-10
International classification of disease - 10
Data Availability:
The data underlying this article were provided by the U.S. Centers for Medicare and Medicaid Services under a data use agreement to the Richard A. and Susan F. Smith Center for Outcomes Research in Cardiology. Data may be shared on request to the corresponding author upon reasonable request with permission of the Centers for Medicare and Medicaid Services.
References
- 1.Boersma LV, Ince H, Kische S, et al. Evaluating Real-World Clinical Outcomes in Atrial Fibrillation Patients Receiving the WATCHMAN Left Atrial Appendage Closure Technology: Final 2-Year Outcome Data of the EWOLUTION Trial Focusing on History of Stroke and Hemorrhage. Circ Arrhythm Electrophysiol. 2019;12(4):e006841. [DOI] [PubMed] [Google Scholar]
- 2.Price MJ, Slotwiner D, Du C, et al. Clinical Outcomes at 1 Year Following Transcatheter Left Atrial Appendage Occlusion in the United States. JACC Cardiovasc Interv. 2022;15(7):741–750. [DOI] [PMC free article] [PubMed] [Google Scholar]
- 3.Reddy VY, Sievert H, Halperin J, et al. Percutaneous left atrial appendage closure vs warfarin for atrial fibrillation: a randomized clinical trial. JAMA. 2014;312(19):1988–1998. [DOI] [PubMed] [Google Scholar]
- 4.Holmes DR Jr., Kar S, Price MJ, et al. Prospective randomized evaluation of the Watchman Left Atrial Appendage Closure device in patients with atrial fibrillation versus long-term warfarin therapy: the PREVAIL trial. J Am Coll Cardiol. 2014;64(1):1–12. [DOI] [PubMed] [Google Scholar]
- 5.Wang A, Ferro EG, Song Y, et al. Frailty in patients undergoing percutaneous left atrial appendage closure. Heart Rhythm. 2022;19(5):814–821. [DOI] [PMC free article] [PubMed] [Google Scholar]
- 6.Bibas L, Levi M, Touchette J, et al. Implications of Frailty in Elderly Patients With Electrophysiological Conditions. JACC Clin Electrophysiol. 2016;2(3):288–294. [DOI] [PubMed] [Google Scholar]
- 7.Afilalo J, Alexander KP, Mack MJ, et al. Frailty assessment in the cardiovascular care of older adults. J Am Coll Cardiol. 2014;63(8):747–762. [DOI] [PMC free article] [PubMed] [Google Scholar]
- 8.Fried LP, Tangen CM, Walston J, et al. Frailty in older adults: evidence for a phenotype. J Gerontol A Biol Sci Med Sci. 2001;56(3):M146–156. [DOI] [PubMed] [Google Scholar]
- 9.Jones DM, Song X, Rockwood K. Operationalizing a frailty index from a standardized comprehensive geriatric assessment. J Am Geriatr Soc. 2004;52(11):1929–1933. [DOI] [PubMed] [Google Scholar]
- 10.Annas GJ. “Culture of life” politics at the bedside--the case of Terri Schiavo. N Engl J Med. 2005;352(16):1710–1715. [DOI] [PubMed] [Google Scholar]
- 11.Gilbert T, Neuburger J, Kraindler J, et al. Development and validation of a Hospital Frailty Risk Score focusing on older people in acute care settings using electronic hospital records: an observational study. Lancet. 2018;391(10132):1775–1782. [DOI] [PMC free article] [PubMed] [Google Scholar]
- 12.McAlister F, van Walraven C. External validation of the Hospital Frailty Risk Score and comparison with the Hospital-patient One-year Mortality Risk Score to predict outcomes in elderly hospitalised patients: a retrospective cohort study. BMJ Qual Saf. 2019;28(4):284–288. [DOI] [PubMed] [Google Scholar]
- 13.Lila Martin JBS. Utilization Frailty and Association with 30-day Readmission and Patient Mortality Under the Hospital Readmissions Reduction Program - Part II. 2019; Dec 10, 2019:https://www.acc.org/latest-in-cardiology/articles/2019/12/10/06/54/utilization-frailty-and-association-with-30-day-readmission-and-patient-mortality-under-the-hospital-readmissions-reduction-program-part-ii.
- 14.Kim DH, Schneeweiss S, Glynn RJ, Lipsitz LA, Rockwood K, Avorn J. Measuring Frailty in Medicare Data: Development and Validation of a Claims-Based Frailty Index. J Gerontol A Biol Sci Med Sci. 2018;73(7):980–987. [DOI] [PMC free article] [PubMed] [Google Scholar]
- 15.Kim DH, Glynn RJ, Avorn J, et al. Validation of a Claims-Based Frailty Index Against Physical Performance and Adverse Health Outcomes in the Health and Retirement Study. J Gerontol A Biol Sci Med Sci. 2019;74(8):1271–1276. [DOI] [PMC free article] [PubMed] [Google Scholar]
- 16.Gautam N, Bessette L, Pawar A, Levin R, Kim DH. Updating International Classification of Diseases 9th Revision to 10th Revision of a Claims-Based Frailty Index. J Gerontol A Biol Sci Med Sci. 2021;76(7):1316–1317. [DOI] [PMC free article] [PubMed] [Google Scholar]
- 17.Lee H, Shi SM, Kim DH. Home Time as a Patient-Centered Outcome in Administrative Claims Data. J Am Geriatr Soc. 2019;67(2):347–351. [DOI] [PMC free article] [PubMed] [Google Scholar]
- 18.Chesney TR, Haas B, Coburn NG, et al. Patient-Centered Time-at-Home Outcomes in Older Adults After Surgical Cancer Treatment. JAMA Surg. 2020;155(11):e203754. [DOI] [PMC free article] [PubMed] [Google Scholar]
- 19.Rockwood K, Song X, MacKnight C, et al. A global clinical measure of fitness and frailty in elderly people. CMAJ. 2005;173(5):489–495. [DOI] [PMC free article] [PubMed] [Google Scholar]
- 20.Cesari M, Gambassi G, van Kan GA, Vellas B. The frailty phenotype and the frailty index: different instruments for different purposes. Age Ageing. 2014;43(1):10–12. [DOI] [PubMed] [Google Scholar]
Associated Data
This section collects any data citations, data availability statements, or supplementary materials included in this article.
Data Availability Statement
The data underlying this article were provided by the U.S. Centers for Medicare and Medicaid Services under a data use agreement to the Richard A. and Susan F. Smith Center for Outcomes Research in Cardiology. Data may be shared on request to the corresponding author upon reasonable request with permission of the Centers for Medicare and Medicaid Services.